Tower Operations Digital Data System – Concept Refinement ...
47
DOT/FAA/TC-08/09 Federal Aviation Administration William J. Hughes Technical Center Atlantic City International Airport, NJ 08405 Tower Operations Digital Data System – Concept Refinement and Description of New Features Todd R. Truitt, Ph.D., Human Factors Team – Atlantic City, ATO-P June 2008 Technical Report This document is available to the public through the National Technical Information Service (NTIS), Springfield, VA 22161. A copy is retained for reference at the William J. Hughes Technical Center Library. U.S. Department of Transportation Federal Aviation Administration
Transcript of Tower Operations Digital Data System – Concept Refinement ...
DOT/FAA/TC-08/09 Federal Aviation Administration William J. Hughes Technical Center Atlantic City International Airport, NJ 08405
Tower Operations Digital Data System – Concept Refinement and Description of New Features Todd R. Truitt, Ph.D., Human Factors Team – Atlantic City, ATO-P June 2008 Technical Report
This document is available to the public through the National Technical Information Service (NTIS), Springfield, VA 22161. A copy is retained for reference at the William J. Hughes Technical Center Library.
U.S. Department of Transportation Federal Aviation Administration

NOTICE
This document is disseminated under the sponsorship of the U.S. Department
of Transportation in the interest of information exchange. The United States
Government assumes no liability for the contents or use thereof. The United
States Government does not endorse products or manufacturers. Trade or
manufacturers’ names appear herein solely because they are considered
essential to the objective of this report. This document does not constitute
Federal Aviation Administration (FAA) certification policy. Consult your
local FAA aircraft certification office as to its use.
This report is available at the FAA William J. Hughes Technical Center’s full-
text Technical Reports Web site: http://actlibrary.tc.faa.gov in Adobe®
Acrobat® portable document format (PDF).

Technical Report Documentation Page 1. Report No.
DOT/FAA/TC-08/09
2. Government Accession No. 3. Recipient’s Catalog No.
4. Title and Subtitle
Tower Operations Digital Data System – Concept Refinement and Description of New
Features
5. Report Date
June 2008
6. Performing Organization Code
AJP-6110
7. Author(s)
Todd R. Truitt, Ph.D., Human Factors Team – Atlantic City, ATO-P
8. Performing Organization Report No.
DOT/FAA/TC-08/09
10. Work Unit No. (TRAIS)
9. Performing Organization Name and Address
Federal Aviation Administration
Human Factors Team – Atlantic City, ATO-P
William J. Hughes Technical Center
Atlantic City International Airport, NJ 08405
11. Contract or Grant No.
13. Type of Report and Period Covered
Technical Report
12. Sponsoring Agency Name and Address
Federal Aviation Administration
Human Factors Research and Engineering Group
800 Independence Avenue, S.W.
Washington, DC 20591
14. Sponsoring Agency Code
ATO-P
15. Supplementary Notes
16. Abstract
Human factors researchers at the Federal Aviation Administration have developed new methods of operation for Air Traffic Control
Specialists working in Airport Traffic Control Towers (ATCT). The newly redesigned and enhanced Tower Operations Digital Data
System (TODDS) provides a means to assist ATCT controllers with flight data management, communication, and coordination by
reducing cognitive and physical taskload. The TODDS prototype designs include separate solutions for ATCTs either with or
without surface surveillance capability. This report addresses the results of a recent usability test by providing a description of
design changes and new features that compose the TODDS. The author also recommends the use of a touchscreen training protocol.
Pending further investigation, the TODDS may help reduce the risk of runway incursions, ease the flow of surface operations, and
support the Staffed Virtual Tower concept.
17. Key Words
Airport Traffic Control Tower
Electronic Flight Data
NextGen
Tower Operations
18. Distribution Statement
This document is available to the public through the
National Technical Information Service, Springfield,
Virginia, 22161. A copy is retained for reference at
the William J. Hughes Technical Center Library.
19. Security Classification (of this report) Unclassified
20. Security Classification (of this page)
Unclassified 21. No. of Pages
47 22. Price
Form DOT F 1700.7 (8-72) Reproduction of completed page authorized
iii
Table of Contents
Page
Acknowledgments......................................................................................................................... vii
Executive Summary....................................................................................................................... ix
1. INTRODUCTION ...................................................................................................................... 1
1.1 Background........................................................................................................................... 1
1.2 Purpose.................................................................................................................................. 5
2. ADDRESSING THE RESULTS OF THE USABILITY TEST ................................................ 5
2.1 Common Issues..................................................................................................................... 5
2.1.1 Touchscreen Training .................................................................................................. 5
2.1.2 ATIS Update Indicator................................................................................................. 6
2.1.3 Aircraft Specific and Generic Timers .......................................................................... 8
2.1.4 Flight Data Amendment Indicator ............................................................................... 9
2.1.5 Acknowledge Flashing EDCT ................................................................................... 10
2.1.6 Hold Short Indicator .................................................................................................. 11
2.1.7 Timer Interface Placement......................................................................................... 11
2.1.8 Ownership Highlighting ............................................................................................ 12
2.1.9 FDE History and Recall ............................................................................................. 13
2.2 Interface-Specific Issues ..................................................................................................... 14
2.2.1 P-S EFDI – FDE Zone Behavior ............................................................................... 14
2.2.2 P-S EFDI – TIPH Undo ............................................................................................. 17
2.2.3 Integrated EFDI – Organization and Separation of the Departure List ..................... 17
2.2.4 Integrated EFDI – Indicator for Aircraft Moving on a Runway Surface................... 19
3. NEW FEATURES – THE TOWER OPERATIONS DIGITAL DATA SYSTEM ................. 19
3.1 Weather Information........................................................................................................... 19
3.2 Wake Turbulence Indicator ................................................................................................ 21
3.3 Closed Runway and Taxiway Segment Indicator............................................................... 22
3.4 Digital Taxi Out Clearance ................................................................................................. 29
3.5 Integrated TODDS – Taxi Conformance Monitoring......................................................... 34
4. SUMMARY AND CONCLUSION ......................................................................................... 35
References..................................................................................................................................... 36
Acronyms...................................................................................................................................... 37
iv
List of Illustrations
Figures Page
Figure 1. Hardware used to implement the prototype displays including resistive touch display,
display mount, keyboard, and trackball/keypad............................................................. 2
Figure 2. The primary elements of the ground controller’s Integrated display including the
surface situation display, electronic flight data lists, and readout area. ......................... 3
Figure 3. The primary elements of the local controller’s Integrated display including the
surface situation display, electronic flight data lists, and readout area. ......................... 3
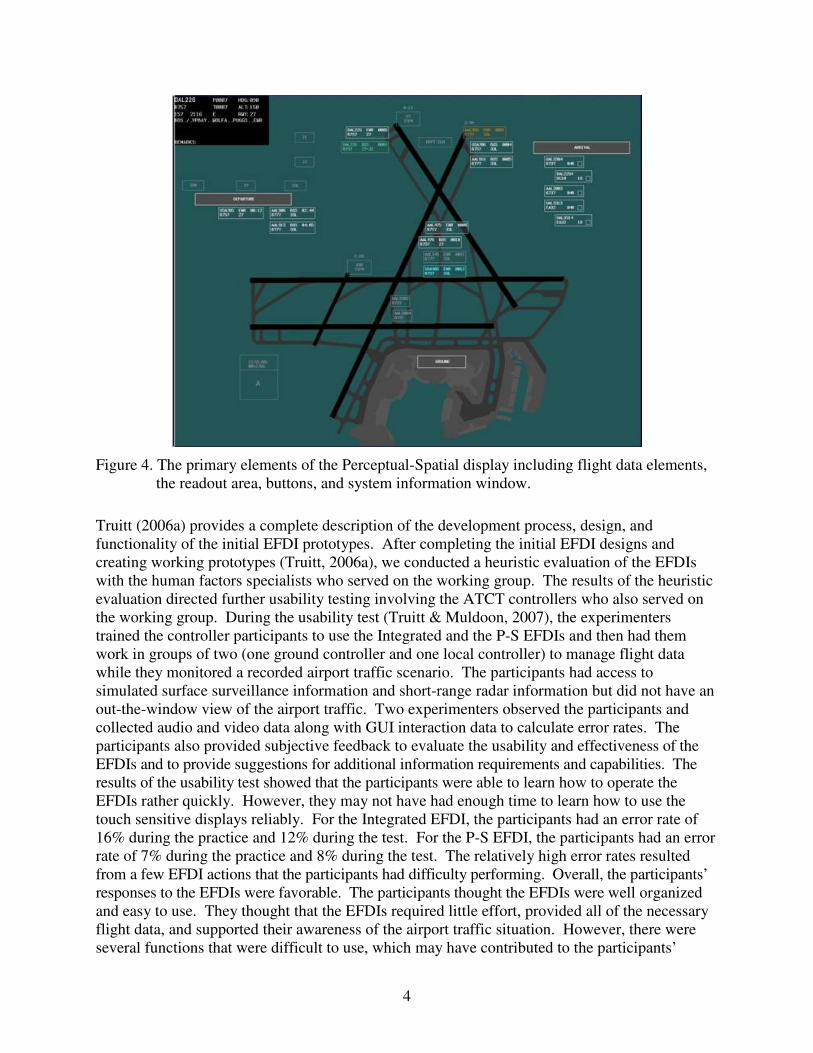
Figure 4. The primary elements of the Perceptual-Spatial display including flight data elements,
the readout area, buttons, and system information window. .......................................... 4
Figure 5. The ATIS Update indicator and ATIS code (shown in yellow) as displayed in the
Integrated (top) and P-S (bottom) EFDIs. ...................................................................... 7
Figure 6. The expired aircraft specific timer icon on an FDE in the Integrated (top) and P-S
(bottom) EFDIs............................................................................................................... 8
Figure 7. Initial generic expired timer design (top) and new generic expired timer design
(bottom left and right). ................................................................................................... 9
Figure 8. New Integrated (top) and P-S EFDI (bottom) aircraft specific expired timer design. .... 9
Figure 9. The Flight Data Amendment indicator on an FDE in the Integrated (top) and P-S
(bottom) EFDIs............................................................................................................. 10
Figure 10. The EDCT highlighting on an FDE in the Integrated (top) and P-S (bottom) EFDIs. 10
Figure 11. The hold short button and indicator on a data block in the Integrated EFDI (top)
and on an FDE in the P-S EFDI (bottom). ................................................................... 11
Figure 12. The readout area (left) is a protected area that other elements cannot occupy,
including the timer interface (right). ........................................................................... 12
Figure 13. A highlighted aircraft in the Integrated (top) and P-S EFDI (bottom) loses
ownership information. ................................................................................................ 12
Figure 14. A highlighted aircraft in the Integrated EFDI (top) and a selected and highlighted
FDE in the P-S EFDI (bottom) retains ownership information................................... 13
Figure 15. The FDE history list for the Integrated (top) and P-S (bottom) EFDIs....................... 14
Figure 16. FDE zones used to organize and manage departure FDEs. The lines defining the
FDE zones are not visible to the controller. ................................................................ 15
Figure 17. FDEs linked inside the FDE zones. ............................................................................. 16
Figure 18. The original design for the departure aircraft list on the local controller’s position... 17
Figure 19. The revised design for the departure aircraft list on the local controller’s position.... 18
Figure 20. The departure aircraft list automatically creates separators for interspersed FDEs. ... 18
v
Figure 21. Aircraft moving on or across a runway surface causes the data block and FDE text
to appear highlighted in yellow. .................................................................................. 19
Figure 22. The weather information box. ..................................................................................... 20
Figure 23. The wake turbulence indicator in the Integrated (top) and P-S (bottom) TODDS. .... 22
Figure 24. The closed runway and taxiway indicator edit buttons. .............................................. 23
Figure 25. The closed runway edit screen including airport sectors and buttons in the
Integrated TODDS. ..................................................................................................... 24
Figure 26. Highlighted runway segments in the zoomed editing view......................................... 25
Figure 27. The closed runway and runway segment indicators on the Integrated TODDS. ........ 26
Figure 28. Highlighted taxiway segments in the editing view on the Integrated TODDS. .......... 27
Figure 29. Selected closed taxiway segment indicators in the zoomed editing view of the
Integrated TODDS. ...................................................................................................... 28
Figure 30. The closed taxiway segment indicators on the Integrated TODDS. ........................... 29
Figure 31. The DCI in the Integrated (left) data block and P-S (right) TODDS prototype FDE. 30
Figure 32. The DCI indicates on the ground controller position a pending pilot request for a
D-Taxi clearance in the Integrated (left) and P-S (right) TODDS. ............................. 30
Figure 33. The readout area displays a digital request for a taxi clearance. ................................. 31
Figure 34. A DCI in the Integrated (left) and P-S (right) TODDS, indicating that the controller
has received and acknowledged the pilots request but has deferred it until later. ....... 31
Figure 35. Inactive (left) and active (right) D-Taxi and Cancel buttons on the TODDS. ............ 31
Figure 36. The DCI on the Integrated (left) and P-S (right) TODDS, indicating that the
controller sent a D-Taxi clearance to the pilot and is pending acceptance. ................ 32
Figure 37. The DCI on the Integrated (left) and P-S (right) TODDS, indicating that the pilot
has rejected the D-Taxi clearance or the digital communications has failed. ............. 32
Figure 38. The DCI on the Integrated (left) and P-S (right) TODDS, indicating that the pilot
has accepted the D-Taxi clearance and will comply with all instructions including
holding short of the active runway. ............................................................................. 33
Figure 39. The readout area showing the D-Taxi clearance. ........................................................ 33
Figure 40. An FDE and data block highlighted in red, indicating that the aircraft is not
conforming to the D-Taxi clearance............................................................................. 34

vi

vii
Acknowledgments
Many thanks to everyone who helped make the ideas for this project become a reality. This
project was a team effort that required lots of skill and attention to detail. The following
individuals demonstrated extraordinary skill and their efforts are much appreciated.
George Chachis (Engility) – Target Generation Facility Contract Support
Joel Grochowski (Engility) – Software Development
April Jackman (Northrop Grumman) – Technical Editor
Johnathan Lykens (Engility) – Target Generation Facility Software Development
Kenneth J. Malott (FAA) – Airport Traffic Control Tower Subject Matter Expert
Mike McAnulty (FAA) – Technical Lead
Jim McGhee (Northrop Grumman) – Airport Traffic Control Tower Subject Matter Expert
Richard Ridgway (Northrop Grumman) – Airport Traffic Control Tower Subject Matter Expert
Dallas Shiles (Barco) – Software Development Lead
Dan Warburton (FAA) – Target Generation Facility Team Lead

viii
ix
Executive Summary
As the number of flights and passengers increase and as the technology ages, the Federal
Aviation Administration (FAA) must develop new systems to support the National Airspace
System (NAS). The Next Generation Air Transportation System (NextGen) Joint Planning
and Development Office (2007) outlines the FAA’s plan for the future, including a number of
new technologies and methods of operation such as System Wide Information Management,
Staffed NextGen Tower, digital data communications, and four-dimensional trajectory
planning. However, the FAA must conduct a considerable amount of research and
development to implement the NextGen concepts. This report discusses ongoing NextGen
research and development efforts for Airport Traffic Control Towers (ATCTs).
Currently, air traffic controllers in ATCTs use paper Flight Progress Strips (FPSs) to obtain and
record information about each flight under their responsibility. However, the FPSs limit the
controllers’ ability to share information among themselves and with other facilities, because it is
difficult or impossible to enter information recorded on the FPSs into the NAS computers. The
FPSs also impose cognitive and physical taskload requirements upon the ATCT controllers.
Engineering Research Psychologists at the FAA have developed a new system for ATCT
operations (a) to address the limitations imposed by FPSs and (b) to potentially enable some of
the NextGen concepts. Originally called the Electronic Flight Data Interface, the Tower
Operations Digital Data System (TODDS) provides a means to assist ATCT controllers with
flight data management, communication, coordination, and cognitive and physical taskload. The
prototype designs of the TODDS include separate solutions for ATCTs either with or without
surface surveillance capability.
This report addresses the results of a recent usability test by providing a description of design
changes and new features that compose the TODDS, including integrated weather information,
digital communication of taxi-out clearances, taxi-conformance monitoring, an indicator for
wake-turbulence separation, and indicators for closed runways and taxiway segments. The
author also recommends a touchscreen training protocol for new users of the touchscreen-based
TODDS.
1
1. INTRODUCTION
The Federal Aviation Administration (FAA) is constantly improving the National Airspace
System (NAS) to ensure reliability and to enhance capability by utilizing the latest advances in
technology. Aging technology and predicted increases in the number of flights and passenger
demand necessitate forward thinking and motivate the development of new systems within the
NAS. The current FAA plan for the future, the Next Generation Air Transportation System
(NextGen) Joint Planning and Development Office (JPDO, 2007), includes several new
technologies and methods of operation such as System Wide Information Management (SWIM),
Staffed NextGen Towers (SNTs), digital data communications, and four-dimensional (4-D)
trajectory planning. The SWIM concept will provide the capability to distribute and share
information across the entire NAS. Users and operators within the NAS will be able to subscribe
to various sets of information and then have that information provided to them on a real-time
basis. The SNT concept reduces the need for physical infrastructure associated with Airport
Traffic Control Towers (ATCTs) and will provide a means to control airport traffic from a remote
location. The digital data communications concept is already in limited use today for the digital
transfer of information between the Airline Operations Centers and pilots and for issuing pre-
departure clearances between air traffic service providers and pilots. NextGen proposes to
expand the digital communications concept to include information such as digital taxi (D-Taxi)
clearances and other non-time-critical air traffic control information. The 4-D trajectory
planning concept would take advantage of the digital communications and SWIM concepts to
provide real-time information about aircraft movement for trajectory planning and traffic flow
management functions. The FAA has described all of these NextGen concepts at a fairly high
level on paper, however, it must conduct a considerable amount of research and development
to implement the concepts. The current paper discusses ongoing NextGen research and
development efforts for ATCTs in particular.
Currently, air traffic controllers in ATCTs, Terminal Radar Approach Controls, and Air Route
Traffic Control Centers use paper Flight Progress Strips (FPSs) to obtain and record information
about each flight under their responsibility. The FPSs limit the ability to share information
between controllers and facilities and make it extremely difficult or impossible to enter recorded
information into the NAS computer system. A number of private companies, as well as the
FAA, have developed electronic FPS systems for ATCTs to facilitate the sharing, coordination,
and recording of pertinent air traffic information. However, all of these electronic FPS systems
tend to mimic the paper FPS in both form and function. For example, the typical electronic FPS
system replicates the paper FPS information format and places each electronic FPS in a virtual
FPS bay. These existing systems capitalize on the controllers’ familiarity with the FPS
information format and usage and provide the ability to easily transfer and record information.
However, they do not address many of the cognitive bottlenecks associated with ATCT
operations and flight data management.
1.1 Background
Truitt (2006a, 2006b) examined the ATCT controllers’ tasks in an effort to redesign the way
controllers manage and interact with flight data. The goal of Truitt’s research was to identify
cognitive bottlenecks in the ATCT operations and flight data management process and then
address these bottlenecks in a way that reduced controllers’ mental workload and the probability
2
of errors that may lead to runway incursions or other more serious errors. Truitt began his
research by conducting a literature review (Truitt, 2006b). He then formed a multidisciplinary
working group that included ATCT supervisors, software developers, and human factors
specialists with advanced degrees in cognitive psychology. The working group used detailed
task flows (Alexander et al., 1989; Ammerman, Becker, Jones, Tobey, & Phillips, 1987) to
examine the most common ATCT tasks and to identify the information requirements for the
ATCT ground and local control positions. The working group also examined the task flows to
identify cognitive bottlenecks (tasks that caused ATCT controllers to exert a great deal of
cognitive effort) and to identify tasks that could potentially lead to errors or increased risk on the
airport surface. We then formed an interface design team, which was a smaller version of the
working group and included ATCT controllers, a software developer, and an Engineering
Research Psychologist (Truitt, 2006a). The interface design team translated the information
generated by the working group into a Graphical User Interface (GUI) form.
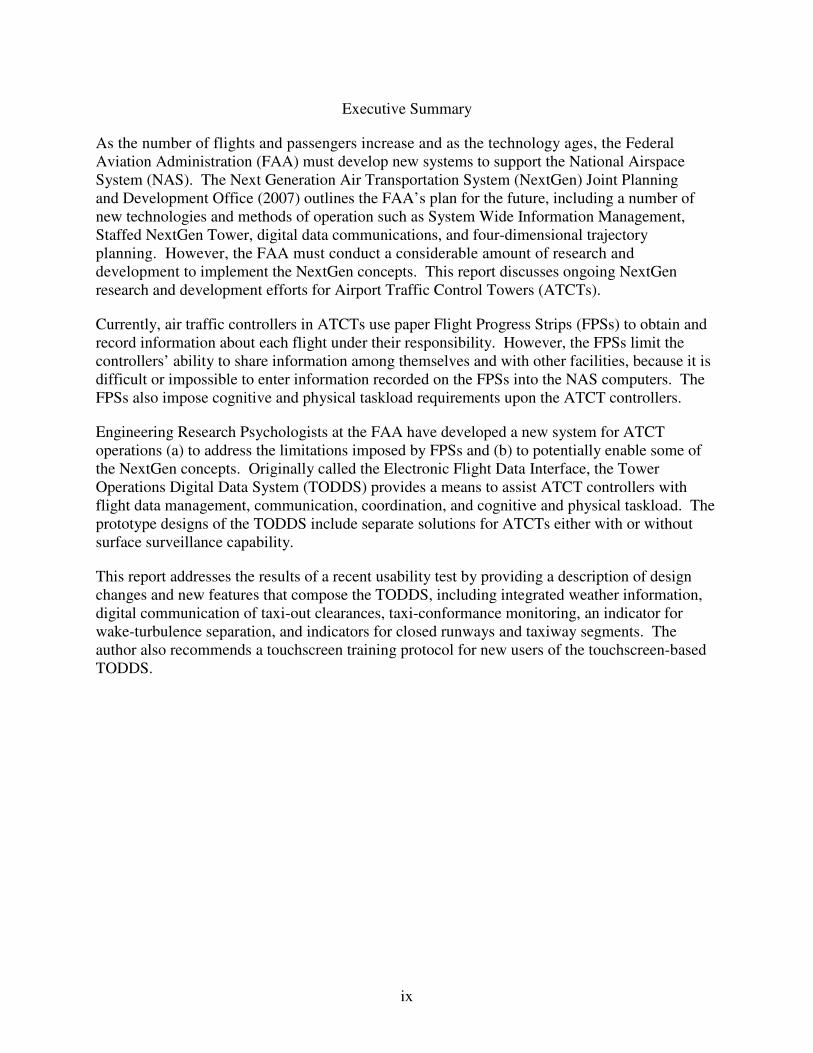
The interface design team created two GUIs using a 21.3″ VarTech Systems, Inc. touch sensitive
display. They also selected the Airport Surface Detection Equipment – Model X (ASDE-X)
keyboard and trackball/keypad as additional input devices (see Figure 1). The interface design
team created the Integrated Electronic Flight Data Interface (EFDI) to support airports that have
surface surveillance capability. They designed the Perceptual-Spatial (P-S) EFDI for airports
that do not have surface surveillance capability. For each type of EFDI, the team created
separate displays for the ground and local controller positions to accommodate each position’s
unique information and task requirements (see Figures 2 through 4).
Figure 1. Hardware used to implement the prototype displays including resistive touch display,
display mount, keyboard, and trackball/keypad.
3
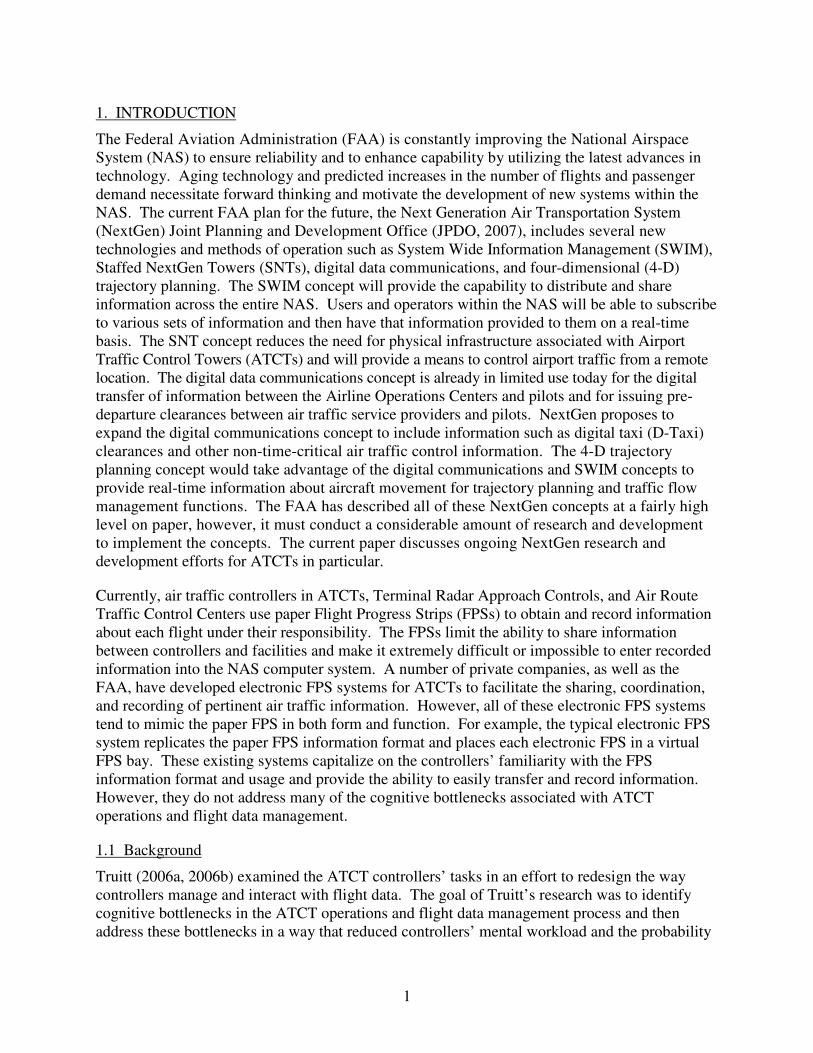
Figure 2. The primary elements of the ground controller’s Integrated display including the
surface situation display, electronic flight data lists, and readout area.
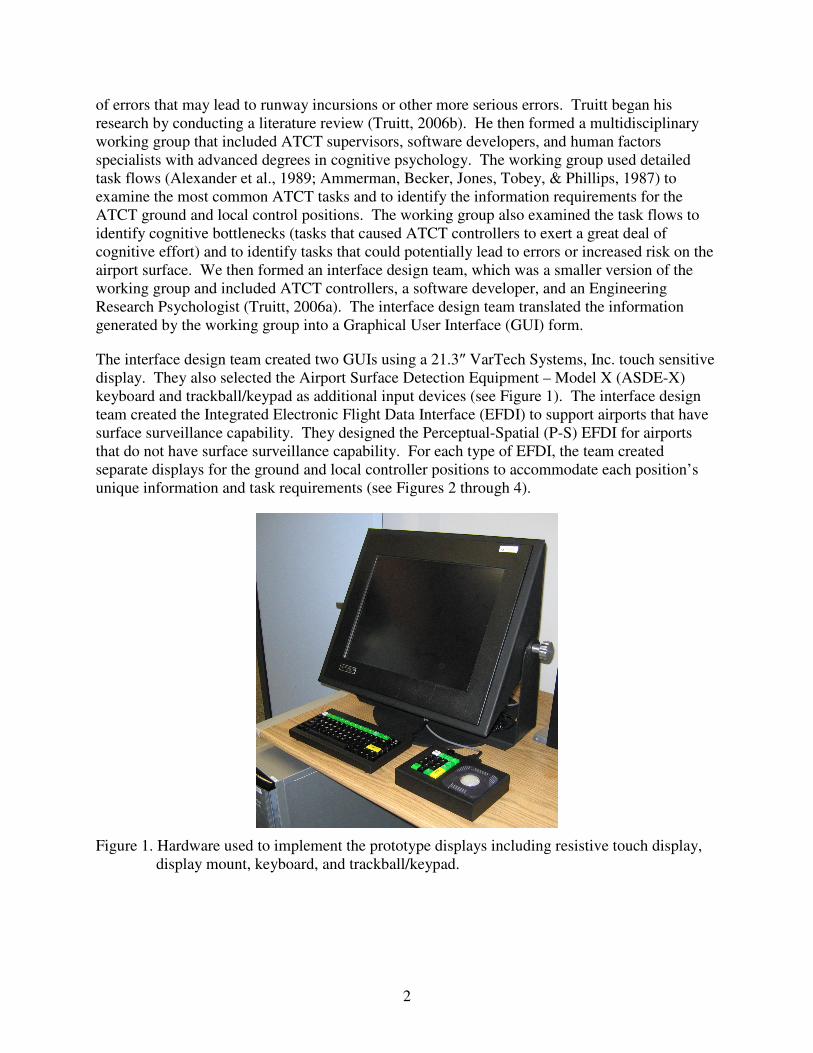
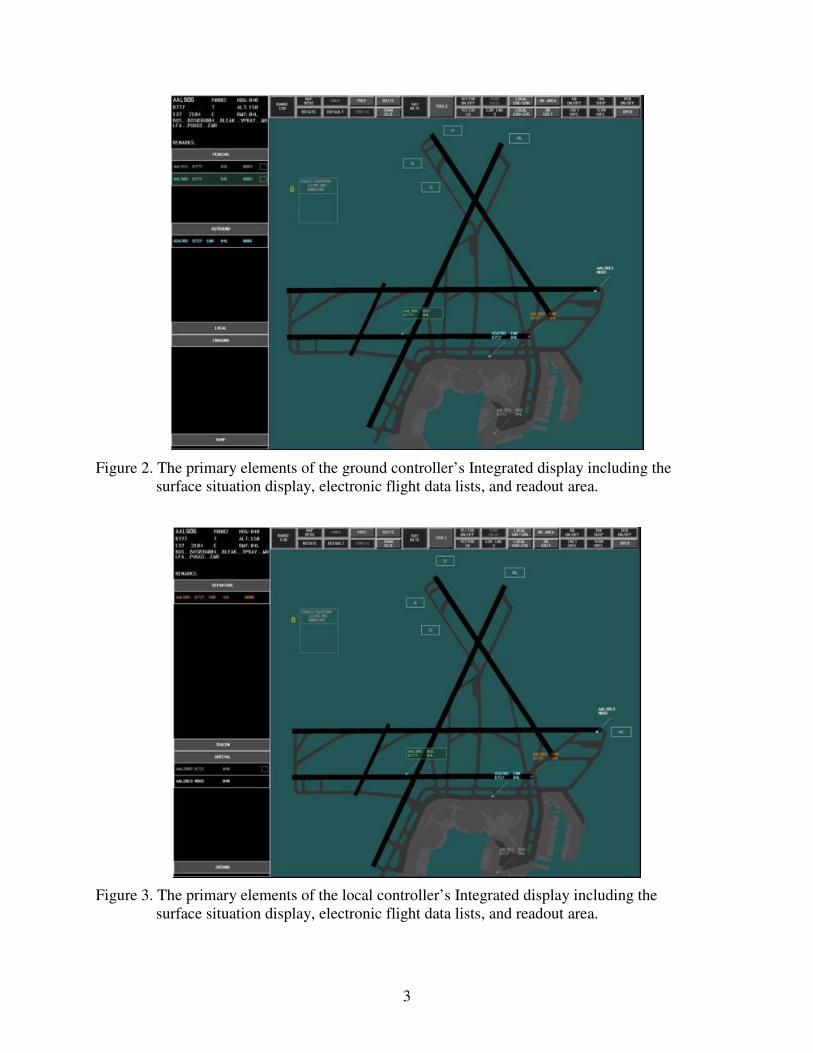
Figure 3. The primary elements of the local controller’s Integrated display including the
surface situation display, electronic flight data lists, and readout area.
4
Figure 4. The primary elements of the Perceptual-Spatial display including flight data elements,
the readout area, buttons, and system information window.
Truitt (2006a) provides a complete description of the development process, design, and
functionality of the initial EFDI prototypes. After completing the initial EFDI designs and
creating working prototypes (Truitt, 2006a), we conducted a heuristic evaluation of the EFDIs
with the human factors specialists who served on the working group. The results of the heuristic
evaluation directed further usability testing involving the ATCT controllers who also served on
the working group. During the usability test (Truitt & Muldoon, 2007), the experimenters
trained the controller participants to use the Integrated and the P-S EFDIs and then had them
work in groups of two (one ground controller and one local controller) to manage flight data
while they monitored a recorded airport traffic scenario. The participants had access to
simulated surface surveillance information and short-range radar information but did not have an
out-the-window view of the airport traffic. Two experimenters observed the participants and
collected audio and video data along with GUI interaction data to calculate error rates. The
participants also provided subjective feedback to evaluate the usability and effectiveness of the
EFDIs and to provide suggestions for additional information requirements and capabilities. The
results of the usability test showed that the participants were able to learn how to operate the
EFDIs rather quickly. However, they may not have had enough time to learn how to use the
touch sensitive displays reliably. For the Integrated EFDI, the participants had an error rate of
16% during the practice and 12% during the test. For the P-S EFDI, the participants had an error
rate of 7% during the practice and 8% during the test. The relatively high error rates resulted
from a few EFDI actions that the participants had difficulty performing. Overall, the participants’
responses to the EFDIs were favorable. The participants thought the EFDIs were well organized
and easy to use. They thought that the EFDIs required little effort, provided all of the necessary
flight data, and supported their awareness of the airport traffic situation. However, there were
several functions that were difficult to use, which may have contributed to the participants’
5
concerns that the EFDIs may cause too much head down time and may be labor intensive in
some situations. The results of the usability test generated recommendations to improve the
usability of the EFDIs and provided suggestions for new features.
Due to the expanding scope of the EFDIs’ capabilities, we changed the name to the Tower
Operations Digital Data System (TODDS) to better describe the concept’s breadth and to
distinguish it from existing Electronic Flight Data systems. This report describes changes made
to the initial design concepts by referring to the EFDIs and describes new features by referring to
the TODDS. The overall redesigned concepts are also called TODDS.
1.2 Purpose
The current report describes how we addressed the results of the usability test (Truitt & Muldoon,
2007) and presents new features that expand the EFDI capability into the TODDS. In particular,
(a) we discuss the need for improved training procedures for using the touch sensitive display,
(b) we discuss how we improved the usability of the most difficult-to-use elements, and (c) we
discuss new features that we implemented based on the participants’ suggestions and as a need to
expand the scope of the EFDI capabilities.
2. ADDRESSING THE RESULTS OF THE USABILITY TEST
2.1 Common Issues
This report presents our response to the results of the usability test. In particular, we discuss
touchscreen training, as well as present solutions for the identified usability issues for the
Automated Terminal Information Service (ATIS) Update indicator, acknowledging expired
aircraft specific and generic timers, the Flight Data Amendment indicator, acknowledging
flashing Expected Departure Clearance Times (EDCTs), Hold Short indicator, timer interface
placement, and we present new features for ownership highlighting, and history and recall of
Flight Data Elements (FDEs). These usability issues and new features apply to both the
Integrated and P-S EFDI prototypes.
2.1.1 Touchscreen Training
One of the primary findings of the usability test was that controllers need to learn how to operate
the interface, but they also need considerable training in using the touch sensitive display itself.
Most people have some experience with computers and GUIs and are typically adept at using a
keyboard, mouse, and maybe even a trackball or joystick. However, interacting with a touch
sensitive display is much less common in everyday applications. The VarTech Systems, Inc.
touch sensitive display is a resistive display that responds to pressure on its screen. Therefore,
learning how to apply the right amount of pressure and maintaining that pressure while
performing actions, such as dragging an element across the screen, is something that takes more
training than we provided in the usability study. The VarTech Systems, Inc. display, like the
common Cathode Ray Tube displays, can also present some degree of visual parallax, depending
on the user’s viewing angle. We did not provide adequate training for the controller participants
in the usability study to be able to compensate for visual parallax and the requirements of the
resistive touch sensitive technology. The relatively high error rates in the usability study were
likely due to a combination of the participants’ lack of familiarity with the touch sensitive
display and the design of the elements presented on the display.
6
To address the users’ lack of familiarity with the touch sensitive display, we designed a
touchscreen training protocol to give users experience with basic touchscreen operation. The
training protocol requires users to repetitively perform three separate tasks with 10 different
button sizes. The users start with the largest button size and perform a number of trials for each
of three tasks using the same button size. The first task is to select a single button. The second
task is to select two buttons in succession. The third task is to drag a button to a target area. For
each trial, the buttons and target area in the dragging task appear at a random location on the
screen. If more than one button is present at a time, the buttons never overlap and the button in
the dragging task never overlaps the target zone. The software provides immediate visual
feedback to the user to let them know whether they succeeded or failed a trial. After completing
trials for all three tasks on the largest button size, the users repeat each of the three tasks using a
smaller button size until they have completed all tasks for all button sizes. The touchscreen
training protocol requires that the users complete a minimum number of trials, and they must
successfully perform a number of trials in succession before moving on to the next task. The
training protocol also establishes a maximum number of trials for each task. If a user reaches the
maximum number of trials, the task ends and the software continues by presenting the next task.
The software provides feedback to the users during each task to let them know how they are
progressing.
We are currently conducting pilot studies to determine the parameters for the minimum and
maximum number of trials. We expect that the training protocol will provide users with about
2.5 to 3 hours of training with the touch sensitive display. After completing the training
protocol, we expect that users will be much better prepared to use the touch sensitive display and
any usability problems that we detect subsequently will be due primarily to the interface design
and not due to the user’s experience with touch sensitive displays. Therefore, the touchscreen
training protocol should allow us to obtain more reliable and valid estimates of errors rates
associated with our prototype interface designs.
2.1.2 ATIS Update Indicator
One design element of the EFDIs that was particularly troublesome for the participants, due to its
small size, was the ATIS Update indicator. The ATIS Update indicator appears as a box on the
right side of an FDE (see Figure 5).
7
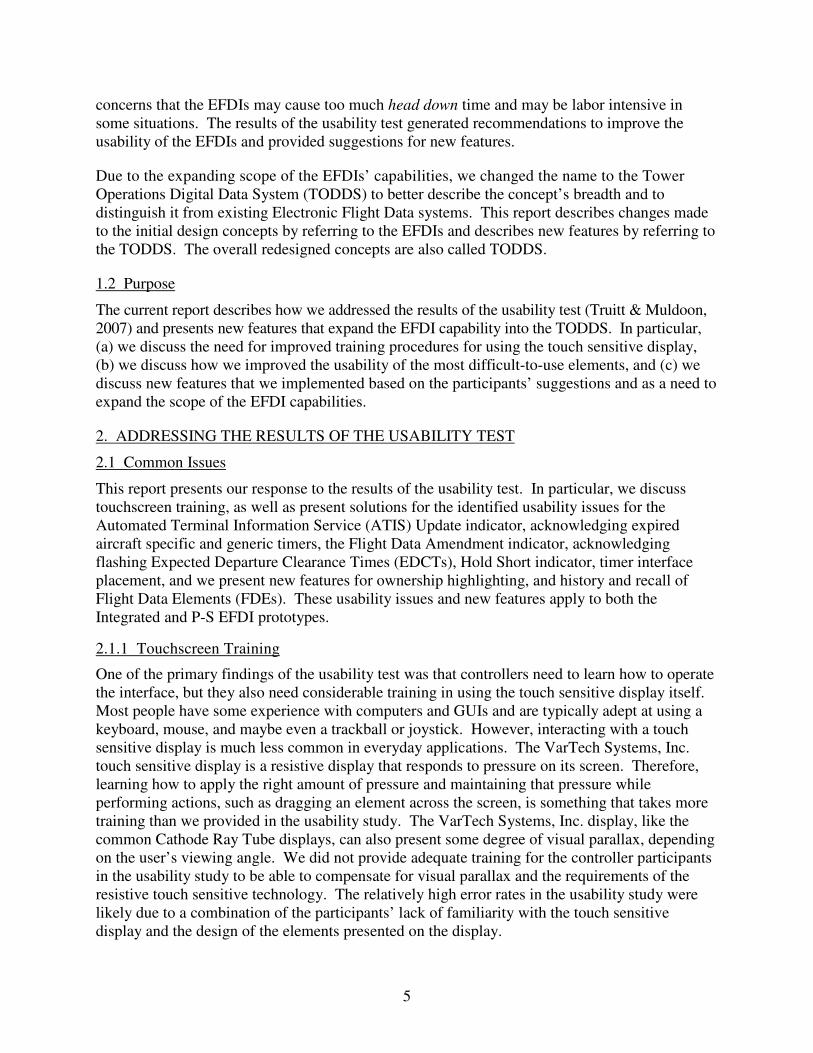
Figure 5. The ATIS Update indicator and ATIS code (shown in yellow) as displayed in the
Integrated (top) and P-S (bottom) EFDIs.
Controllers select the ATIS Update indicator once they have verified that the pilot has the current
ATIS information, which removes it from the FDE. The ATIS update indictor automatically
returns to the FDE if there is an update to the ATIS information.
The participants made an error in selecting the ATIS Update indicator 33% of the time in the
Integrated EFDI and 26% of the time in the P-S EFDI (Truitt & Muldoon, 2007). We increased
the size of the selectable area around the ATIS Update indicator to improve the user’s ability to
select this element. We also implemented a means to undo an ATIS update acknowledgment. In
the initial EFDI design, there was no way for the user to recover from inadvertently acknowledging
an ATIS Update indicator. The user can now undo an inadvertent acknowledgment of an update
indicator by selecting the FDE or data block of the aircraft and then selecting the current ATIS
code that appears on the situation display. We also moved the location of the current ATIS code
from the system area (as shown in Figure 5) and integrated it with the weather information panel
(as described in section 3.1).
8
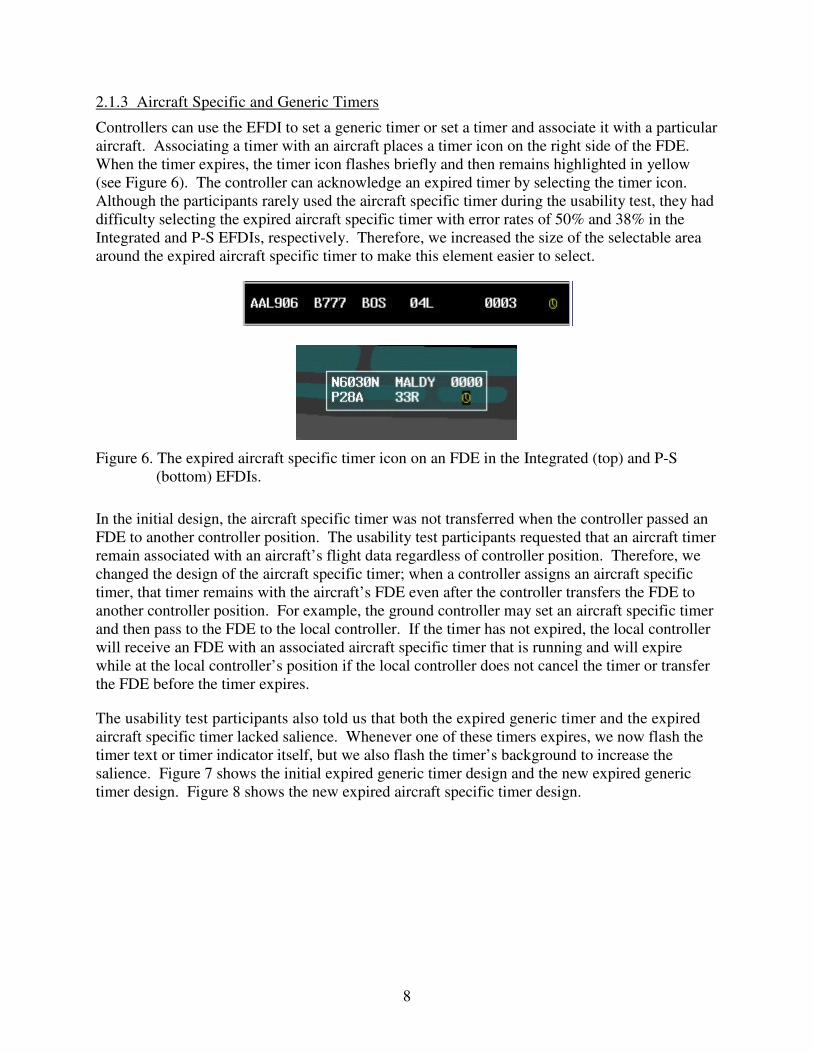
2.1.3 Aircraft Specific and Generic Timers
Controllers can use the EFDI to set a generic timer or set a timer and associate it with a particular
aircraft. Associating a timer with an aircraft places a timer icon on the right side of the FDE.
When the timer expires, the timer icon flashes briefly and then remains highlighted in yellow
(see Figure 6). The controller can acknowledge an expired timer by selecting the timer icon.
Although the participants rarely used the aircraft specific timer during the usability test, they had
difficulty selecting the expired aircraft specific timer with error rates of 50% and 38% in the
Integrated and P-S EFDIs, respectively. Therefore, we increased the size of the selectable area
around the expired aircraft specific timer to make this element easier to select.
Figure 6. The expired aircraft specific timer icon on an FDE in the Integrated (top) and P-S
(bottom) EFDIs.
In the initial design, the aircraft specific timer was not transferred when the controller passed an
FDE to another controller position. The usability test participants requested that an aircraft timer
remain associated with an aircraft’s flight data regardless of controller position. Therefore, we
changed the design of the aircraft specific timer; when a controller assigns an aircraft specific
timer, that timer remains with the aircraft’s FDE even after the controller transfers the FDE to
another controller position. For example, the ground controller may set an aircraft specific timer
and then pass to the FDE to the local controller. If the timer has not expired, the local controller
will receive an FDE with an associated aircraft specific timer that is running and will expire
while at the local controller’s position if the local controller does not cancel the timer or transfer
the FDE before the timer expires.
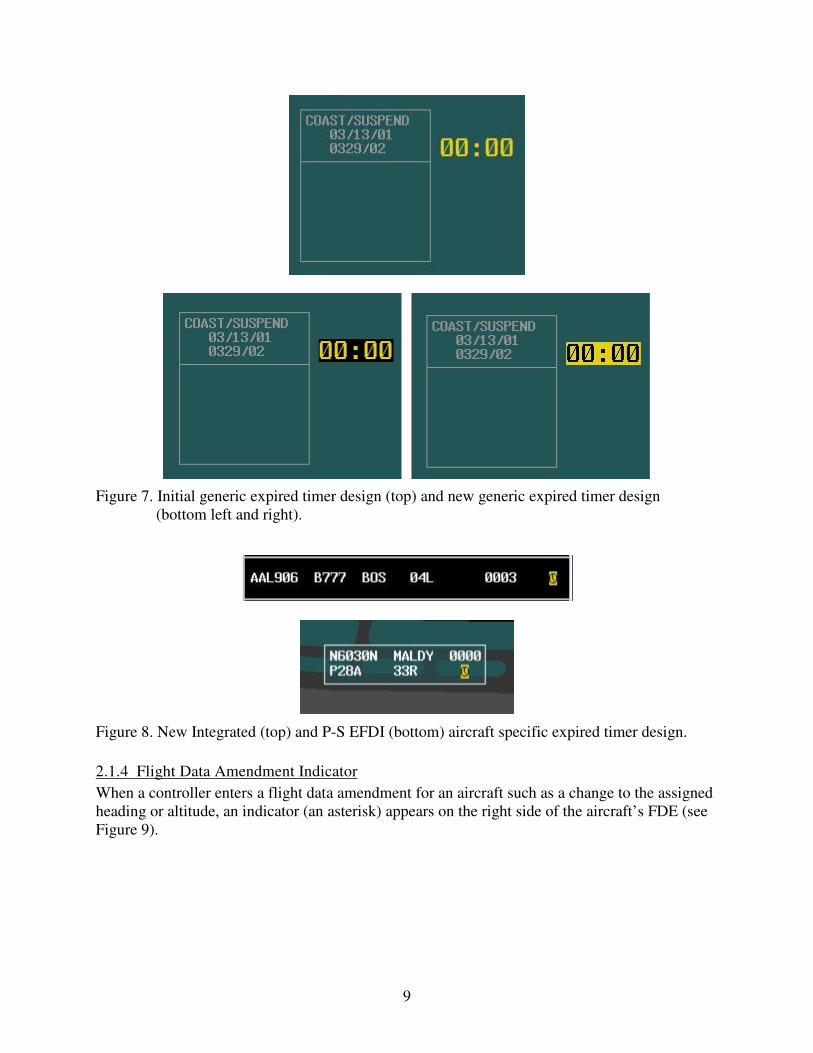
The usability test participants also told us that both the expired generic timer and the expired
aircraft specific timer lacked salience. Whenever one of these timers expires, we now flash the
timer text or timer indicator itself, but we also flash the timer’s background to increase the
salience. Figure 7 shows the initial expired generic timer design and the new expired generic
timer design. Figure 8 shows the new expired aircraft specific timer design.
9
Figure 7. Initial generic expired timer design (top) and new generic expired timer design
(bottom left and right).
Figure 8. New Integrated (top) and P-S EFDI (bottom) aircraft specific expired timer design.
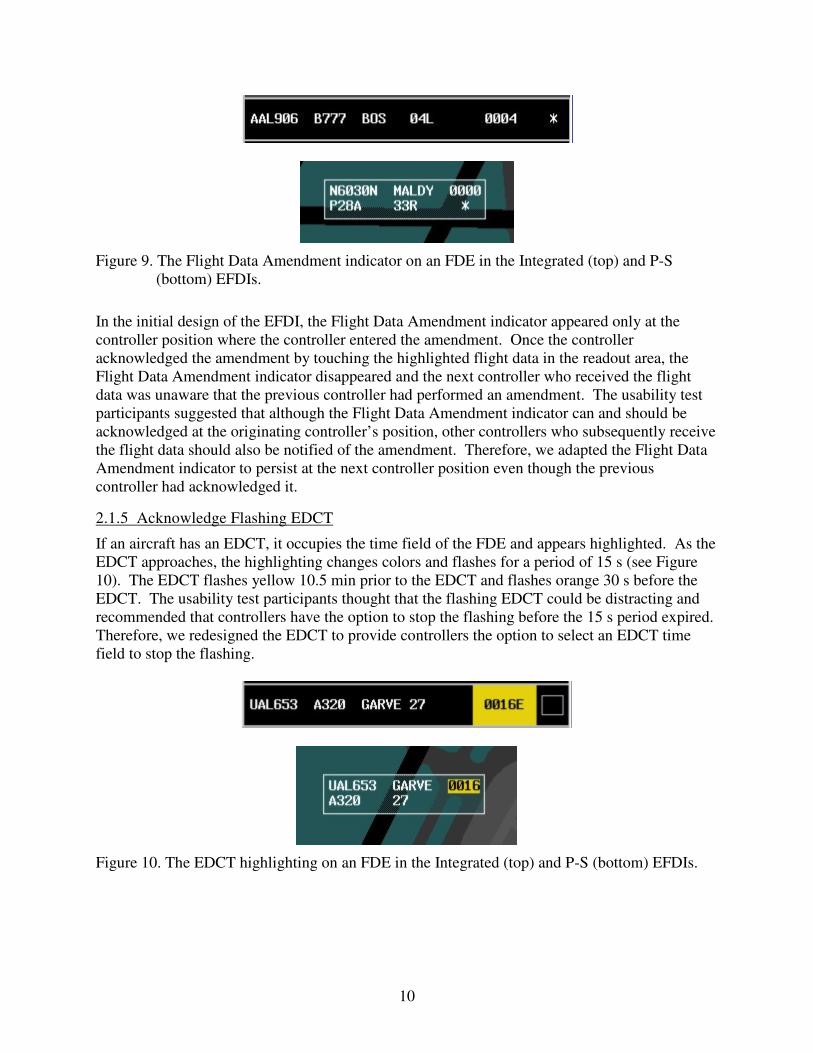
2.1.4 Flight Data Amendment Indicator
When a controller enters a flight data amendment for an aircraft such as a change to the assigned
heading or altitude, an indicator (an asterisk) appears on the right side of the aircraft’s FDE (see
Figure 9).
10
Figure 9. The Flight Data Amendment indicator on an FDE in the Integrated (top) and P-S
(bottom) EFDIs.
In the initial design of the EFDI, the Flight Data Amendment indicator appeared only at the
controller position where the controller entered the amendment. Once the controller
acknowledged the amendment by touching the highlighted flight data in the readout area, the
Flight Data Amendment indicator disappeared and the next controller who received the flight
data was unaware that the previous controller had performed an amendment. The usability test
participants suggested that although the Flight Data Amendment indicator can and should be
acknowledged at the originating controller’s position, other controllers who subsequently receive
the flight data should also be notified of the amendment. Therefore, we adapted the Flight Data
Amendment indicator to persist at the next controller position even though the previous
controller had acknowledged it.
2.1.5 Acknowledge Flashing EDCT
If an aircraft has an EDCT, it occupies the time field of the FDE and appears highlighted. As the
EDCT approaches, the highlighting changes colors and flashes for a period of 15 s (see Figure
10). The EDCT flashes yellow 10.5 min prior to the EDCT and flashes orange 30 s before the
EDCT. The usability test participants thought that the flashing EDCT could be distracting and
recommended that controllers have the option to stop the flashing before the 15 s period expired.
Therefore, we redesigned the EDCT to provide controllers the option to select an EDCT time
field to stop the flashing.
Figure 10. The EDCT highlighting on an FDE in the Integrated (top) and P-S (bottom) EFDIs.
11
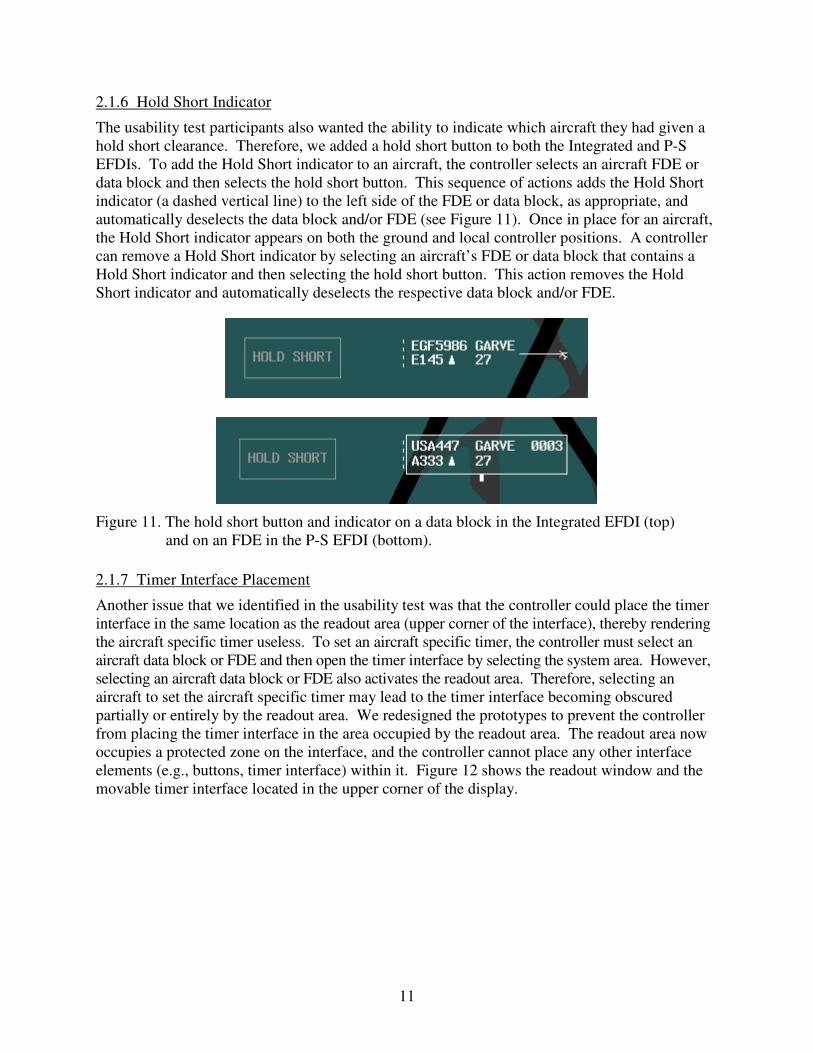
2.1.6 Hold Short Indicator
The usability test participants also wanted the ability to indicate which aircraft they had given a
hold short clearance. Therefore, we added a hold short button to both the Integrated and P-S
EFDIs. To add the Hold Short indicator to an aircraft, the controller selects an aircraft FDE or
data block and then selects the hold short button. This sequence of actions adds the Hold Short
indicator (a dashed vertical line) to the left side of the FDE or data block, as appropriate, and
automatically deselects the data block and/or FDE (see Figure 11). Once in place for an aircraft,
the Hold Short indicator appears on both the ground and local controller positions. A controller
can remove a Hold Short indicator by selecting an aircraft’s FDE or data block that contains a
Hold Short indicator and then selecting the hold short button. This action removes the Hold
Short indicator and automatically deselects the respective data block and/or FDE.
Figure 11. The hold short button and indicator on a data block in the Integrated EFDI (top)
and on an FDE in the P-S EFDI (bottom).
2.1.7 Timer Interface Placement
Another issue that we identified in the usability test was that the controller could place the timer
interface in the same location as the readout area (upper corner of the interface), thereby rendering
the aircraft specific timer useless. To set an aircraft specific timer, the controller must select an
aircraft data block or FDE and then open the timer interface by selecting the system area. However,
selecting an aircraft data block or FDE also activates the readout area. Therefore, selecting an
aircraft to set the aircraft specific timer may lead to the timer interface becoming obscured
partially or entirely by the readout area. We redesigned the prototypes to prevent the controller
from placing the timer interface in the area occupied by the readout area. The readout area now
occupies a protected zone on the interface, and the controller cannot place any other interface
elements (e.g., buttons, timer interface) within it. Figure 12 shows the readout window and the
movable timer interface located in the upper corner of the display.
12
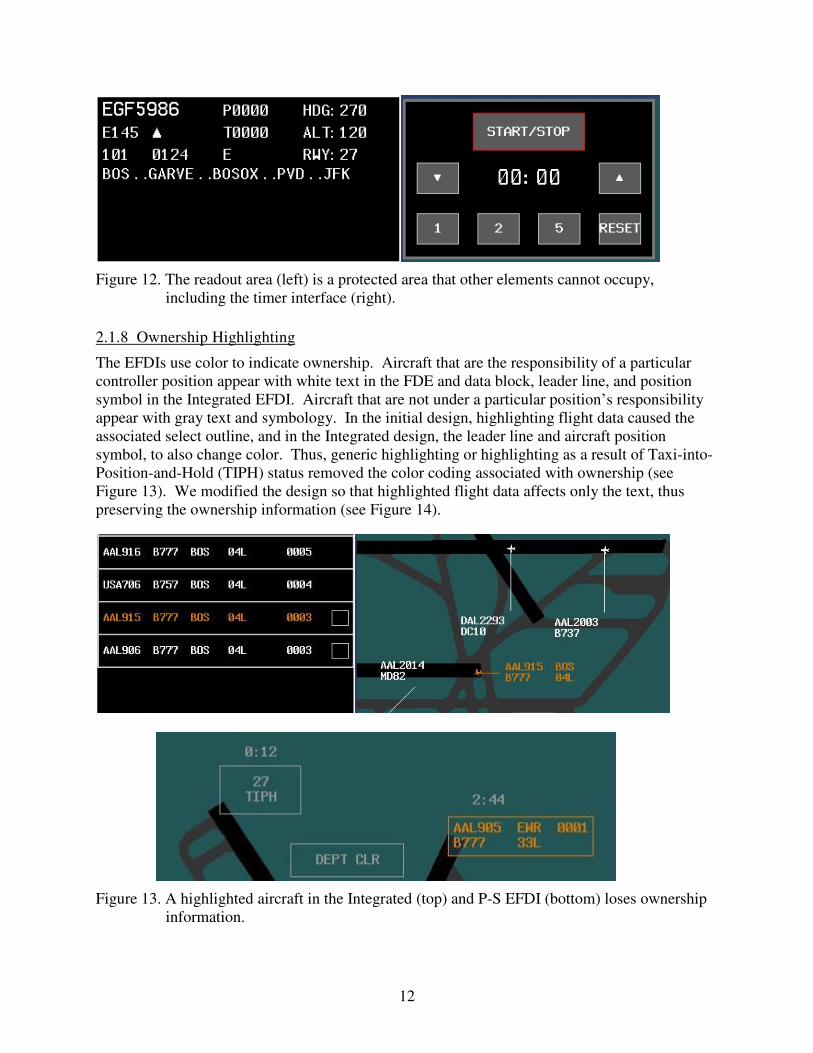
Figure 12. The readout area (left) is a protected area that other elements cannot occupy,
including the timer interface (right).
2.1.8 Ownership Highlighting
The EFDIs use color to indicate ownership. Aircraft that are the responsibility of a particular
controller position appear with white text in the FDE and data block, leader line, and position
symbol in the Integrated EFDI. Aircraft that are not under a particular position’s responsibility
appear with gray text and symbology. In the initial design, highlighting flight data caused the
associated select outline, and in the Integrated design, the leader line and aircraft position
symbol, to also change color. Thus, generic highlighting or highlighting as a result of Taxi-into-
Position-and-Hold (TIPH) status removed the color coding associated with ownership (see
Figure 13). We modified the design so that highlighted flight data affects only the text, thus
preserving the ownership information (see Figure 14).
Figure 13. A highlighted aircraft in the Integrated (top) and P-S EFDI (bottom) loses ownership
information.
13
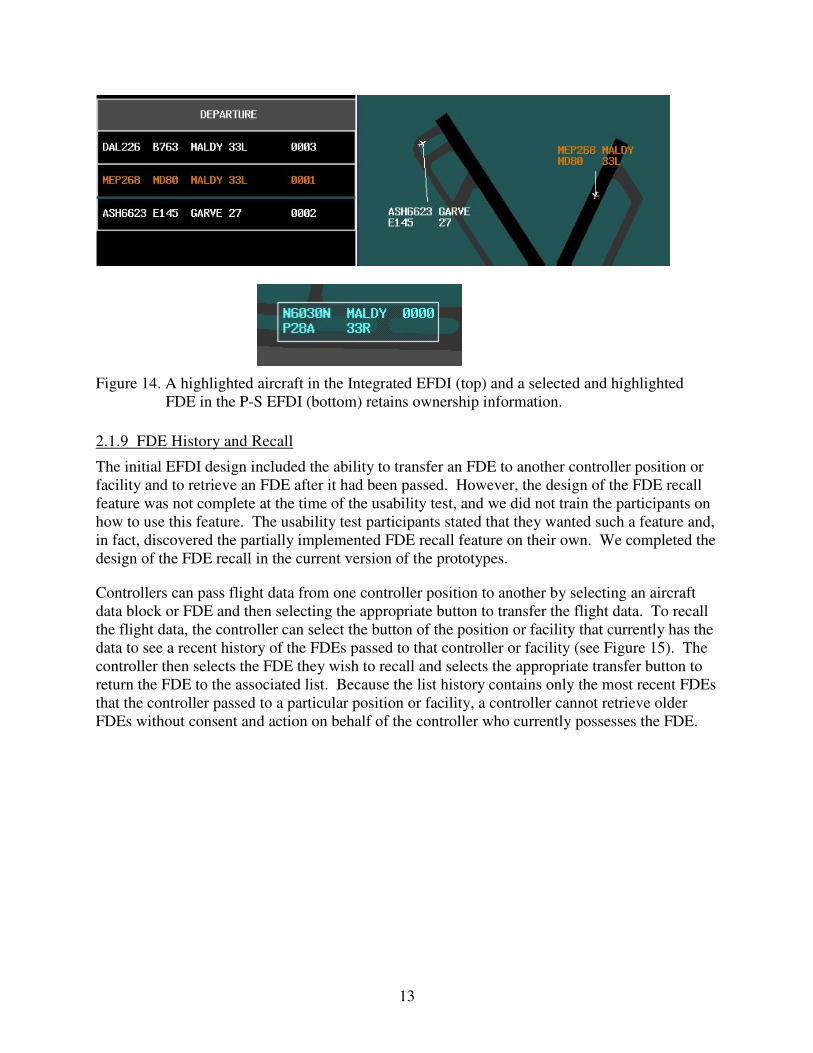
Figure 14. A highlighted aircraft in the Integrated EFDI (top) and a selected and highlighted
FDE in the P-S EFDI (bottom) retains ownership information.
2.1.9 FDE History and Recall
The initial EFDI design included the ability to transfer an FDE to another controller position or
facility and to retrieve an FDE after it had been passed. However, the design of the FDE recall
feature was not complete at the time of the usability test, and we did not train the participants on
how to use this feature. The usability test participants stated that they wanted such a feature and,
in fact, discovered the partially implemented FDE recall feature on their own. We completed the
design of the FDE recall in the current version of the prototypes.
Controllers can pass flight data from one controller position to another by selecting an aircraft
data block or FDE and then selecting the appropriate button to transfer the flight data. To recall
the flight data, the controller can select the button of the position or facility that currently has the
data to see a recent history of the FDEs passed to that controller or facility (see Figure 15). The
controller then selects the FDE they wish to recall and selects the appropriate transfer button to
return the FDE to the associated list. Because the list history contains only the most recent FDEs
that the controller passed to a particular position or facility, a controller cannot retrieve older
FDEs without consent and action on behalf of the controller who currently possesses the FDE.
14
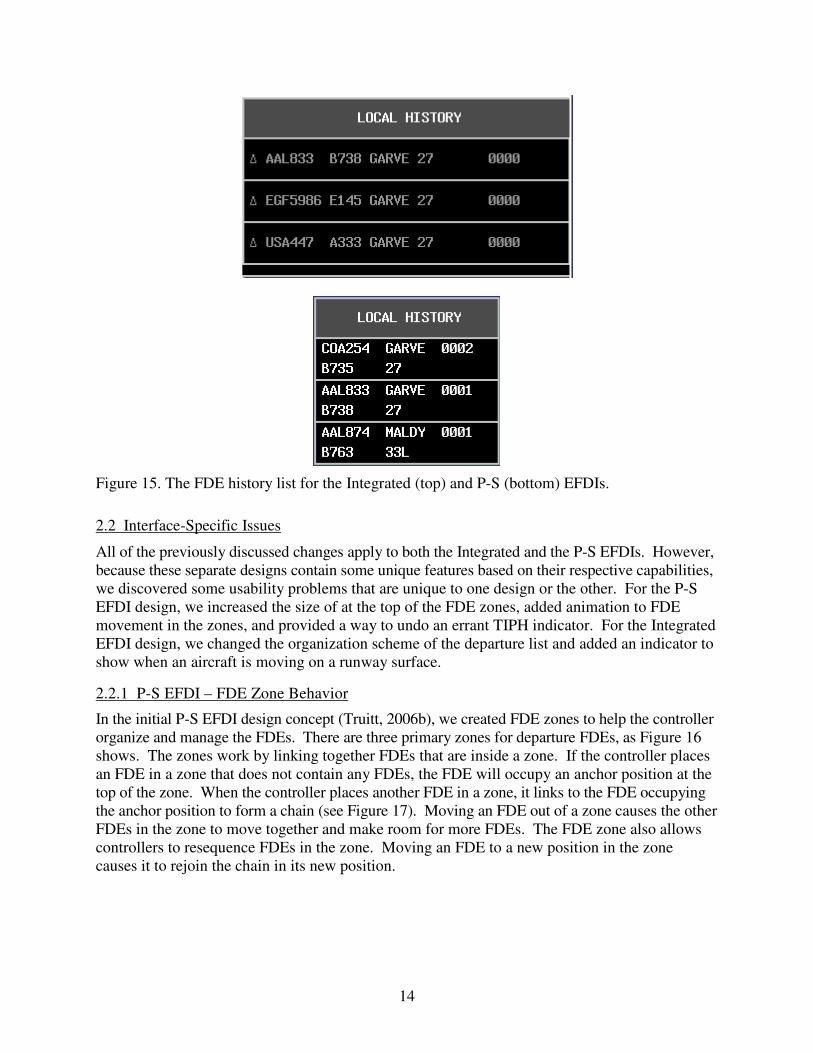
Figure 15. The FDE history list for the Integrated (top) and P-S (bottom) EFDIs.
2.2 Interface-Specific Issues
All of the previously discussed changes apply to both the Integrated and the P-S EFDIs. However,
because these separate designs contain some unique features based on their respective capabilities,
we discovered some usability problems that are unique to one design or the other. For the P-S
EFDI design, we increased the size of at the top of the FDE zones, added animation to FDE
movement in the zones, and provided a way to undo an errant TIPH indicator. For the Integrated
EFDI design, we changed the organization scheme of the departure list and added an indicator to
show when an aircraft is moving on a runway surface.
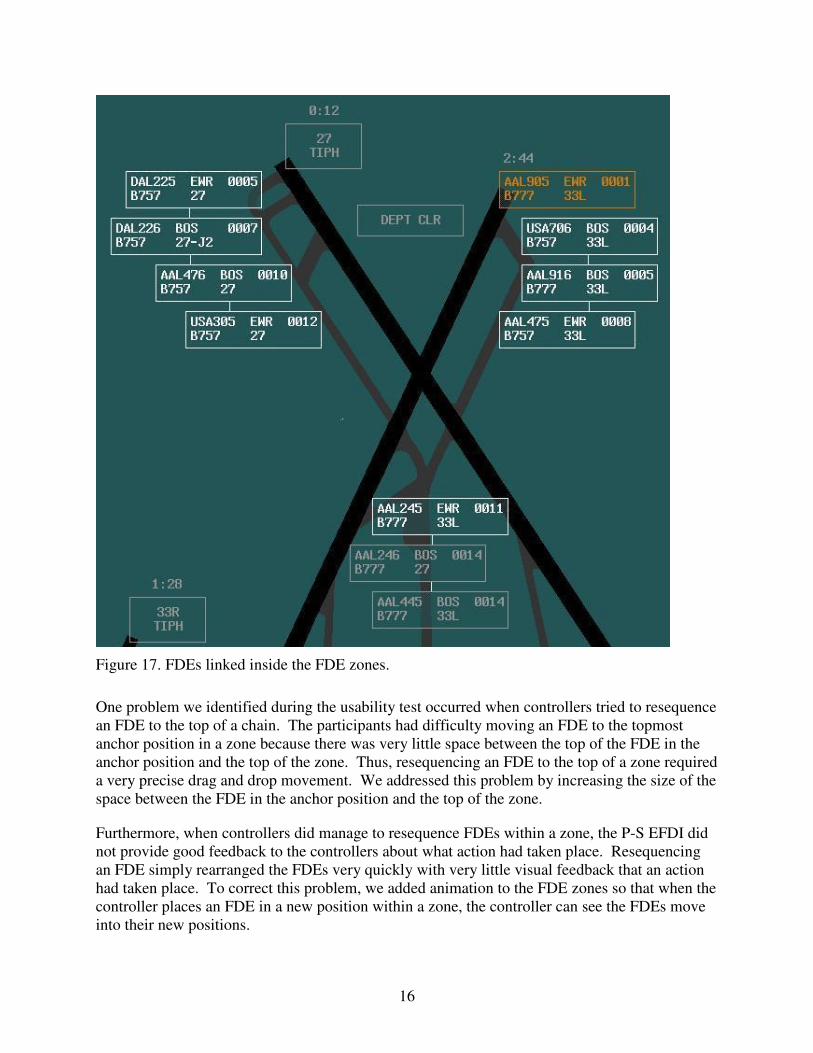
2.2.1 P-S EFDI – FDE Zone Behavior
In the initial P-S EFDI design concept (Truitt, 2006b), we created FDE zones to help the controller
organize and manage the FDEs. There are three primary zones for departure FDEs, as Figure 16
shows. The zones work by linking together FDEs that are inside a zone. If the controller places
an FDE in a zone that does not contain any FDEs, the FDE will occupy an anchor position at the
top of the zone. When the controller places another FDE in a zone, it links to the FDE occupying
the anchor position to form a chain (see Figure 17). Moving an FDE out of a zone causes the other
FDEs in the zone to move together and make room for more FDEs. The FDE zone also allows
controllers to resequence FDEs in the zone. Moving an FDE to a new position in the zone
causes it to rejoin the chain in its new position.
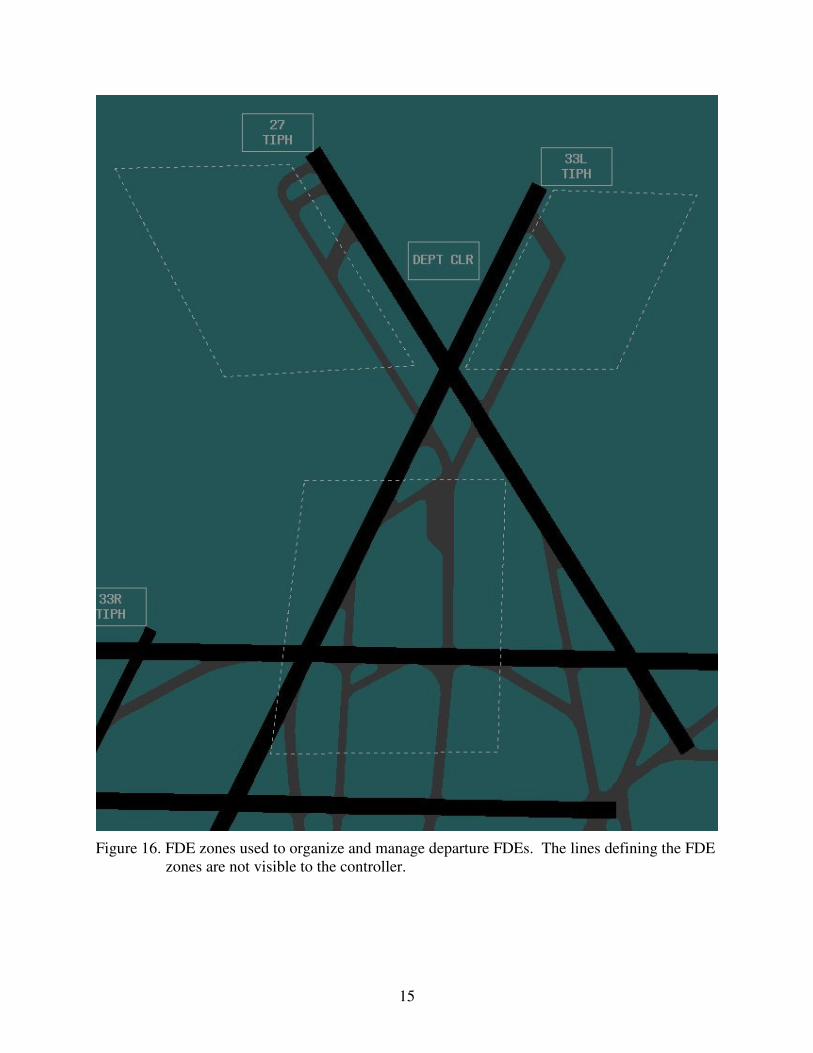
15
Figure 16. FDE zones used to organize and manage departure FDEs. The lines defining the FDE
zones are not visible to the controller.
16
Figure 17. FDEs linked inside the FDE zones.
One problem we identified during the usability test occurred when controllers tried to resequence
an FDE to the top of a chain. The participants had difficulty moving an FDE to the topmost
anchor position in a zone because there was very little space between the top of the FDE in the
anchor position and the top of the zone. Thus, resequencing an FDE to the top of a zone required
a very precise drag and drop movement. We addressed this problem by increasing the size of the
space between the FDE in the anchor position and the top of the zone.
Furthermore, when controllers did manage to resequence FDEs within a zone, the P-S EFDI did
not provide good feedback to the controllers about what action had taken place. Resequencing
an FDE simply rearranged the FDEs very quickly with very little visual feedback that an action
had taken place. To correct this problem, we added animation to the FDE zones so that when the
controller places an FDE in a new position within a zone, the controller can see the FDEs move
into their new positions.
17
2.2.2 P-S EFDI – TIPH Undo
The usability test participants commented that there were times when they wanted to undo an
action but were unable to do so. During the usability test, we observed that controllers could
place the wrong FDE into TIPH status. To place an aircraft FDE in TIPH status, the controller
selects an FDE and then selects the TIPH button for the appropriate runway. The FDE then
occupies a position at the end of the appropriate runway and the FDE text appears highlighted in
orange (as shown in Figures 13 and 17). Once an FDE enters TIPH status, the controller could
not reverse the action. Therefore, we augmented the TIPH clearance to allow controllers to drag
an FDE out of the TIPH location and place it back on the surface map or back into an FDE zone.
When the controller drags an FDE out of TIPH status, the FDE text reverts to the previous color
(white on the local controller’s display, gray on the ground controller’s display, or cyan) if it was
highlighted prior to achieving TIPH status.
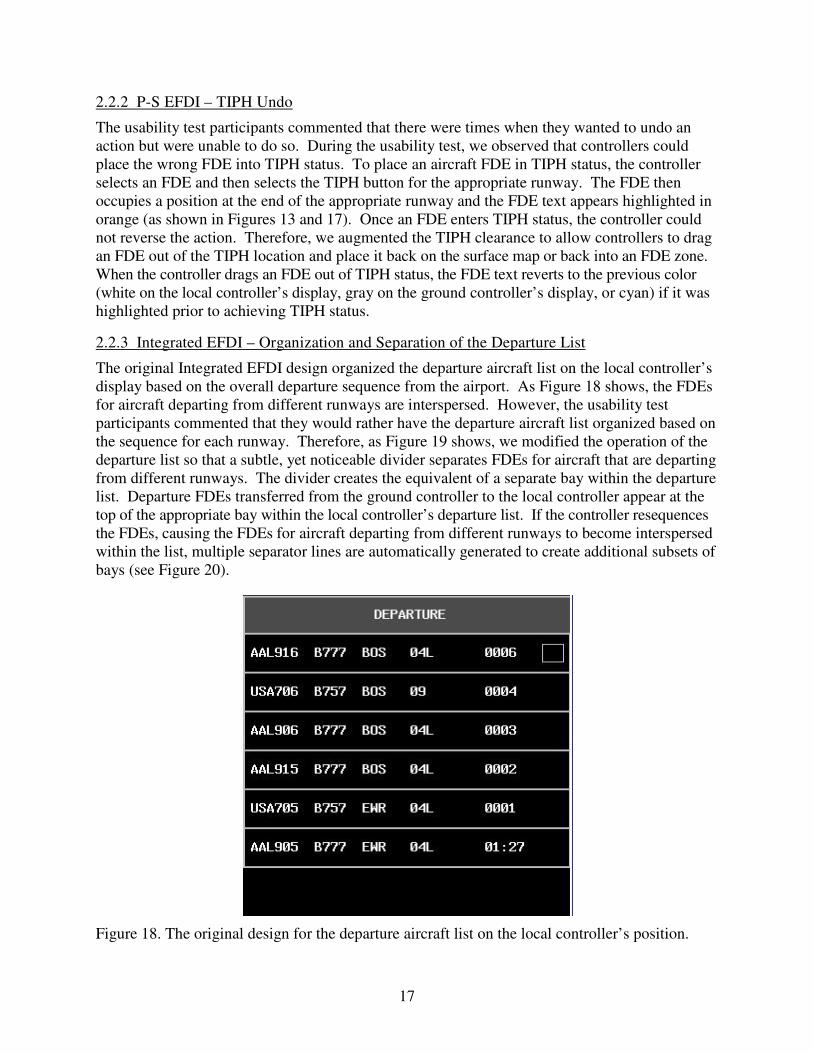
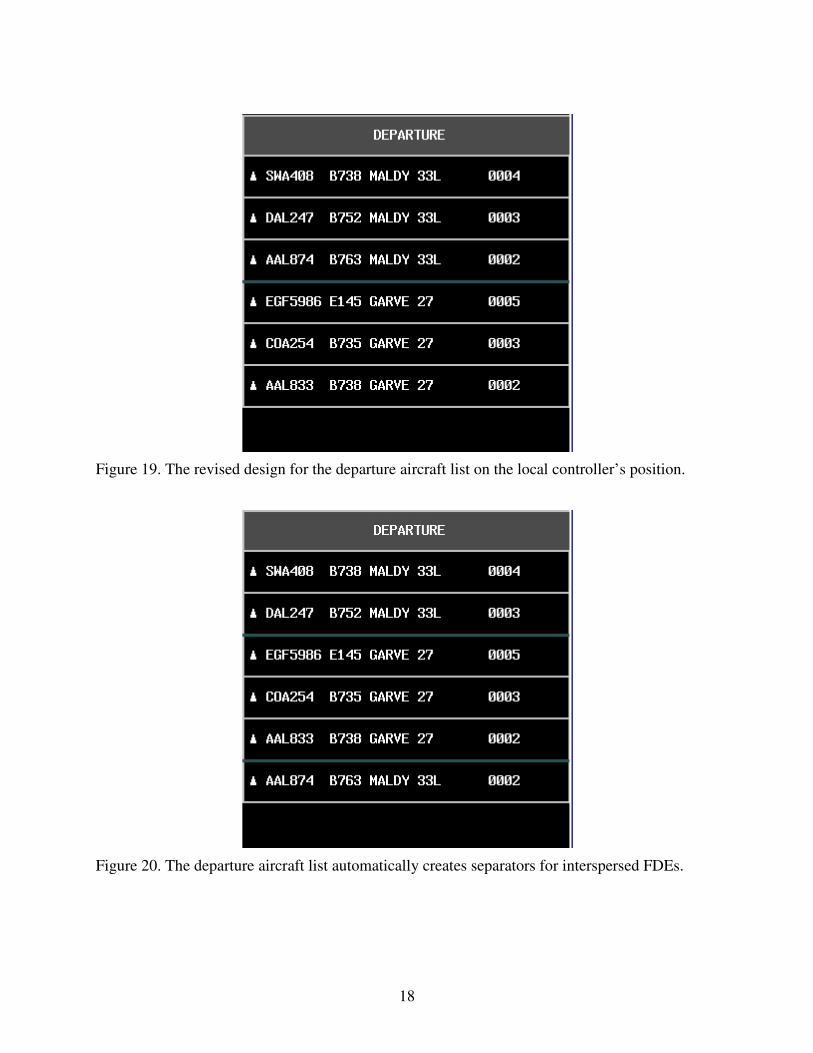
2.2.3 Integrated EFDI – Organization and Separation of the Departure List
The original Integrated EFDI design organized the departure aircraft list on the local controller’s
display based on the overall departure sequence from the airport. As Figure 18 shows, the FDEs
for aircraft departing from different runways are interspersed. However, the usability test
participants commented that they would rather have the departure aircraft list organized based on
the sequence for each runway. Therefore, as Figure 19 shows, we modified the operation of the
departure list so that a subtle, yet noticeable divider separates FDEs for aircraft that are departing
from different runways. The divider creates the equivalent of a separate bay within the departure
list. Departure FDEs transferred from the ground controller to the local controller appear at the
top of the appropriate bay within the local controller’s departure list. If the controller resequences
the FDEs, causing the FDEs for aircraft departing from different runways to become interspersed
within the list, multiple separator lines are automatically generated to create additional subsets of
bays (see Figure 20).
Figure 18. The original design for the departure aircraft list on the local controller’s position.
18
Figure 19. The revised design for the departure aircraft list on the local controller’s position.
Figure 20. The departure aircraft list automatically creates separators for interspersed FDEs.
19
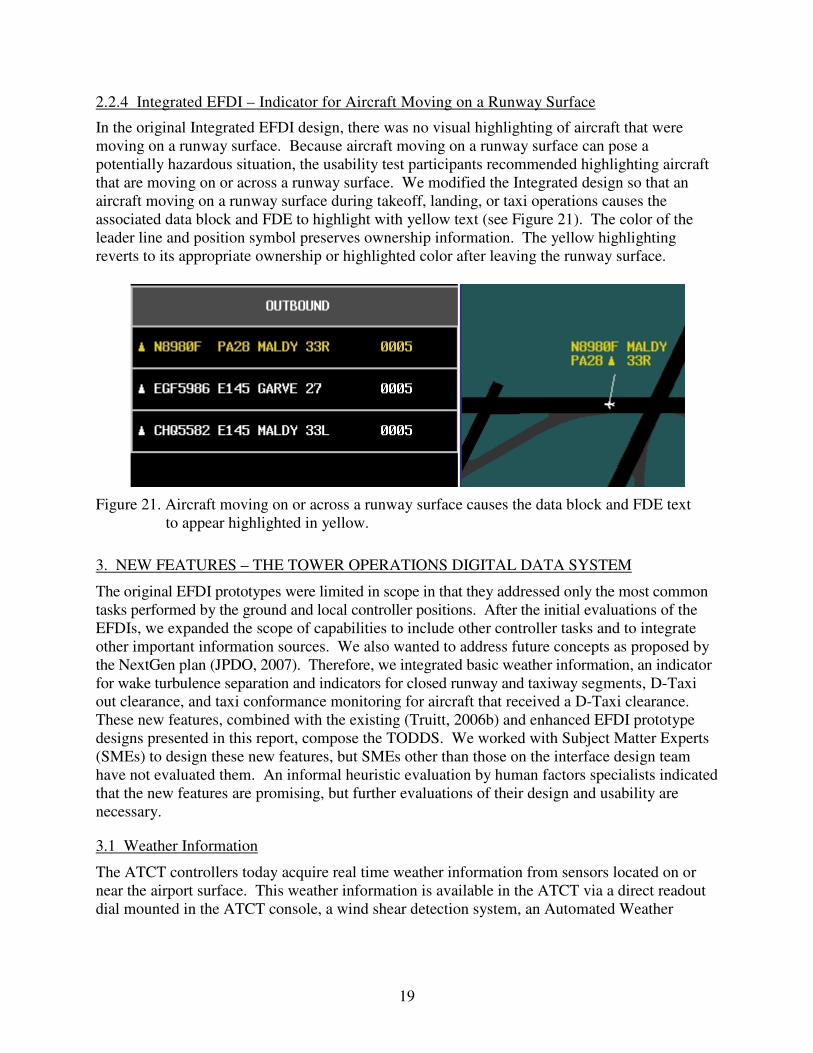
2.2.4 Integrated EFDI – Indicator for Aircraft Moving on a Runway Surface
In the original Integrated EFDI design, there was no visual highlighting of aircraft that were
moving on a runway surface. Because aircraft moving on a runway surface can pose a
potentially hazardous situation, the usability test participants recommended highlighting aircraft
that are moving on or across a runway surface. We modified the Integrated design so that an
aircraft moving on a runway surface during takeoff, landing, or taxi operations causes the
associated data block and FDE to highlight with yellow text (see Figure 21). The color of the
leader line and position symbol preserves ownership information. The yellow highlighting
reverts to its appropriate ownership or highlighted color after leaving the runway surface.
Figure 21. Aircraft moving on or across a runway surface causes the data block and FDE text
to appear highlighted in yellow.
3. NEW FEATURES – THE TOWER OPERATIONS DIGITAL DATA SYSTEM
The original EFDI prototypes were limited in scope in that they addressed only the most common
tasks performed by the ground and local controller positions. After the initial evaluations of the
EFDIs, we expanded the scope of capabilities to include other controller tasks and to integrate
other important information sources. We also wanted to address future concepts as proposed by
the NextGen plan (JPDO, 2007). Therefore, we integrated basic weather information, an indicator
for wake turbulence separation and indicators for closed runway and taxiway segments, D-Taxi
out clearance, and taxi conformance monitoring for aircraft that received a D-Taxi clearance.
These new features, combined with the existing (Truitt, 2006b) and enhanced EFDI prototype
designs presented in this report, compose the TODDS. We worked with Subject Matter Experts
(SMEs) to design these new features, but SMEs other than those on the interface design team
have not evaluated them. An informal heuristic evaluation by human factors specialists indicated
that the new features are promising, but further evaluations of their design and usability are
necessary.
3.1 Weather Information
The ATCT controllers today acquire real time weather information from sensors located on or
near the airport surface. This weather information is available in the ATCT via a direct readout
dial mounted in the ATCT console, a wind shear detection system, an Automated Weather
20
Observation System display, or the computerized Information Display System display. One way
the TODDS prototypes reduce cognitive and physical taskload is by integrating information into
a single display. Integrating information that is normally dispersed throughout the ATCT cab
reduces the controllers need to shift their visual attention and provides information in a readily
accessible format. Therefore, we decided to integrate the most-often-used weather information
into the TODDS prototypes.
We determined the weather information requirements for ATCT controllers by using the same
task flow analysis procedure employed in the original design process for the EFDIs (Truitt,
2006b). Instead of reconvening the entire working group, we established the necessary
information requirements by using the members of the multidisciplinary interface design team
consisting of ATCT SMEs, a human factors specialist, and a computer software engineer. By
examining the controller tasks, we determined that the most important weather information needs
included the wind speed, wind direction, gust speed, altimeter reading, and runway visual range
(RVR) for the active runways at touchdown, midpoint, and rollout. Although pilots can get
weather information by listening to the recorded ATIS information, the ATIS does not present
information in real time and can be outdated by as much as 1 hour. The ATCT controllers at the
ground and local control positions communicate real-time information to pilots to inform them of
the most current weather conditions at the airport.
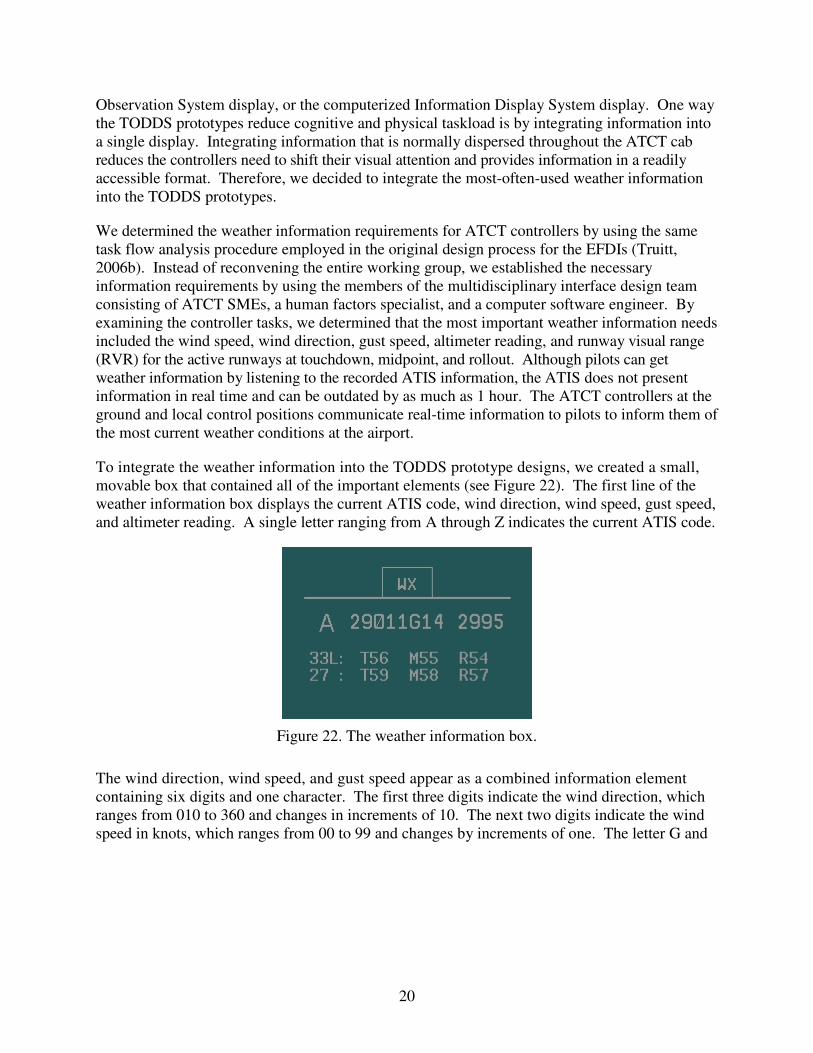
To integrate the weather information into the TODDS prototype designs, we created a small,
movable box that contained all of the important elements (see Figure 22). The first line of the
weather information box displays the current ATIS code, wind direction, wind speed, gust speed,
and altimeter reading. A single letter ranging from A through Z indicates the current ATIS code.
Figure 22. The weather information box.
The wind direction, wind speed, and gust speed appear as a combined information element
containing six digits and one character. The first three digits indicate the wind direction, which
ranges from 010 to 360 and changes in increments of 10. The next two digits indicate the wind
speed in knots, which ranges from 00 to 99 and changes by increments of one. The letter G and

21
two digits that indicate the wind gust follow the wind direction. The wind gust is represented by
two digits ranging from 01 to 99 and changes by increments of one. The wind gust information
appears only if a wind gust is present. The current altimeter reading also appears on the first line
of the weather information box, separated from the wind information, and includes four digits.
We decided to present the weather information in this format because it coincides with how
controllers actually use the information and communicate it to pilots. For example, the controller
may give the current weather information to a pilot as, “Winds, two three zero at eleven, gusting to
fifteen; altimeter, two niner niner five.” Subsequent lines of the weather information box display
the RVR information. Each line indicates an active runway and its associated RVR at the
touchdown (T), midpoint (M), and rollout (R) in hundreds of feet. If an RVR reading is greater
than 6,000 feet, a plus sign will accompany the reading (e.g., T60+). Improper runway lighting
conditions at night can produce erroneous RVR readings. Therefore, if the RVR system detects
an improper runway light setting, the weather information box displays the message, LIGHTS.
The weather information box includes a handle on the top that controllers can use to drag the box
to a different location on the TODDS. When a controller touches the handle of the weather box,
the handle highlights to provide visual feedback.
3.2 Wake Turbulence Indicator
ATCT controllers currently must consider wake turbulence when instructing aircraft to land and
depart according to FAA Order 7110.65S, section 9, 3-9-6 and 3-9-7 (FAA, 2008). The FAA is
working on new wake turbulence detection systems that take into account wind speed and wind
direction to determine situations where the effect of wake turbulence is mitigated. The Wake
Turbulence Detection system has the potential to tell controllers when wake turbulence is or is
not a factor and allows them to space aircraft closer together during arrival to and departure from
the airport. Such a system could improve airport capacity without impacting safety. However, a
Wake Turbulence Detection system would also place yet another display in the ATCT, to which
controllers must attend, requiring additional shifts of visual attention and increased cognitive and
physical taskload. Therefore, we decided to integrate a Wake Turbulence indicator into the
TODDS prototypes.
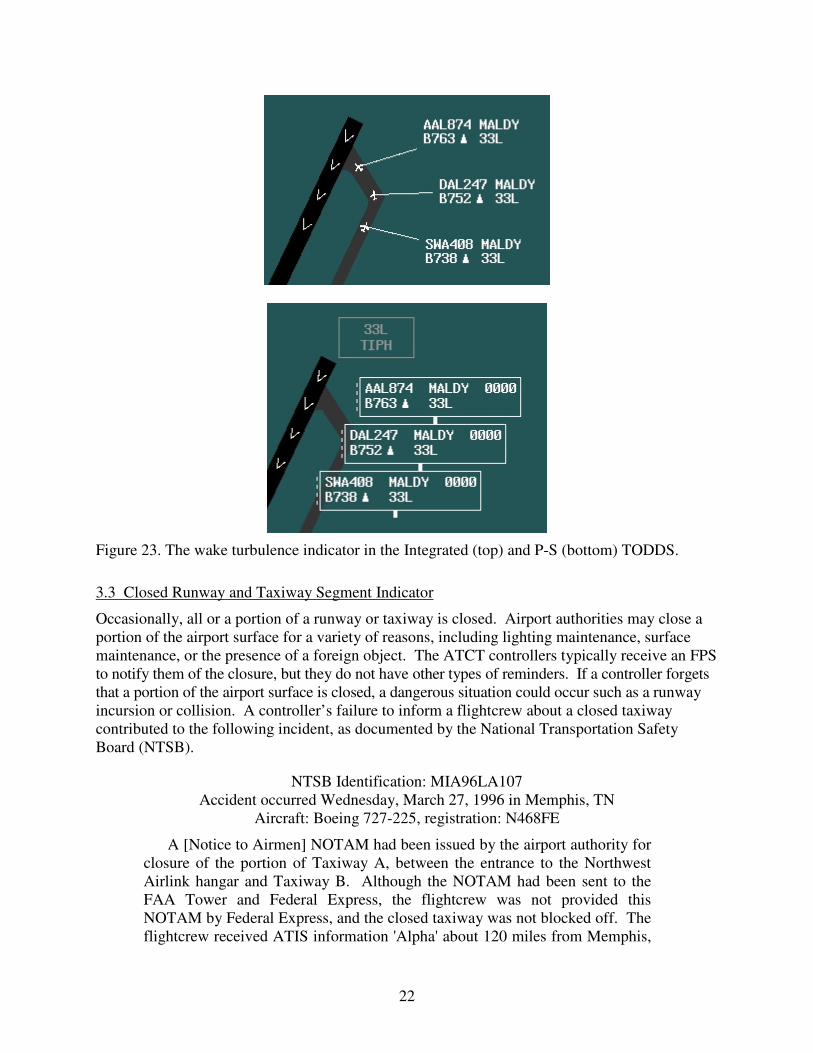
The Wake Turbulence indicator appears as a set of chevrons at the departure end of a runway, as
Figure 23 shows. The controller must use standard separation for wake turbulence when the
Wake Turbulence indicator appears on the runway. When the Wake Turbulence indicator is not
present, the controller can suspend the standard rules governing wake turbulence separation.
This design concept demonstrates how new systems can be integrated into the TODDS design to
prevent controllers from engaging in unnecessary shifts of visual attention.
22
Figure 23. The wake turbulence indicator in the Integrated (top) and P-S (bottom) TODDS.
3.3 Closed Runway and Taxiway Segment Indicator
Occasionally, all or a portion of a runway or taxiway is closed. Airport authorities may close a
portion of the airport surface for a variety of reasons, including lighting maintenance, surface
maintenance, or the presence of a foreign object. The ATCT controllers typically receive an FPS
to notify them of the closure, but they do not have other types of reminders. If a controller forgets
that a portion of the airport surface is closed, a dangerous situation could occur such as a runway
incursion or collision. A controller’s failure to inform a flightcrew about a closed taxiway
contributed to the following incident, as documented by the National Transportation Safety
Board (NTSB).
NTSB Identification: MIA96LA107
Accident occurred Wednesday, March 27, 1996 in Memphis, TN
Aircraft: Boeing 727-225, registration: N468FE
A [Notice to Airmen] NOTAM had been issued by the airport authority for
closure of the portion of Taxiway A, between the entrance to the Northwest
Airlink hangar and Taxiway B. Although the NOTAM had been sent to the
FAA Tower and Federal Express, the flightcrew was not provided this
NOTAM by Federal Express, and the closed taxiway was not blocked off. The
flightcrew received ATIS information 'Alpha' about 120 miles from Memphis,
23
but the controller, who had recorded the ATIS, did not include the NOTAM
information. About 20 minutes before the flight landed, the ATIS was changed
to information 'Bravo,' which included the NOTAM information. The
flightcrew did not get information 'Bravo,' and the approach controller did not
ensure that the flightcrew had the most current information. After landing, the
flight was cleared to taxi and hold short of runway 27. The ground controller
did not inform the flightcrew that taxiway 'A' was closed. The flight proceeded
along the closed portion of taxiway 'A,' and as the flightcrew was maneuvering
around construction equipment, the right wing of the aircraft struck the
construction equipment.
The National Transportation Safety Board determines the probable cause(s)
of this accident as follows: failure of the flightcrew to maintain clearance from
construction equipment while taxiing after landing. Factors relating to the
accident were: failure of operator personnel to supply the flightcrew with
current NOTAM information, failure of ATC personnel to include NOTAM
information on ATIS information 'Alpha,' failure of tower personnel to ensure
that the flightcrew had the most current ATIS information, failure of the
ground controller to control the movement of the aircraft to prevent it from
entering the closed taxiway, and failure of the airport authority to block the
closed taxiway (NTSB, 1997).
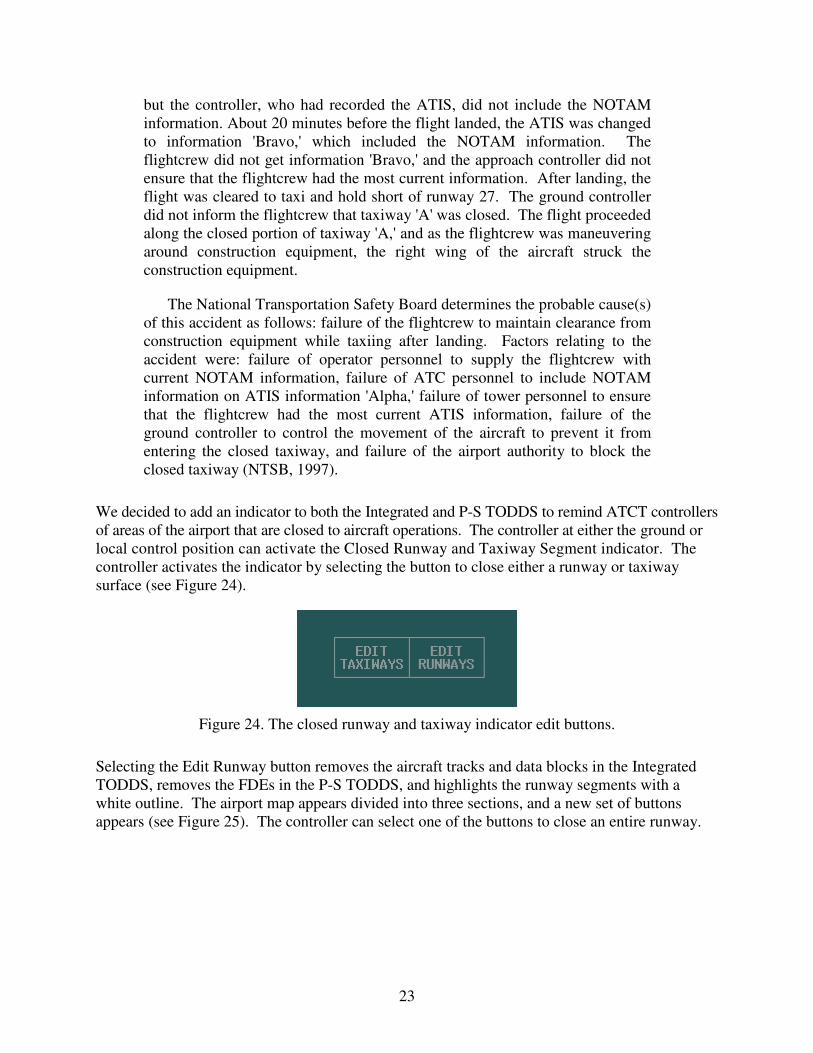
We decided to add an indicator to both the Integrated and P-S TODDS to remind ATCT controllers
of areas of the airport that are closed to aircraft operations. The controller at either the ground or
local control position can activate the Closed Runway and Taxiway Segment indicator. The
controller activates the indicator by selecting the button to close either a runway or taxiway
surface (see Figure 24).
Figure 24. The closed runway and taxiway indicator edit buttons.
Selecting the Edit Runway button removes the aircraft tracks and data blocks in the Integrated
TODDS, removes the FDEs in the P-S TODDS, and highlights the runway segments with a
white outline. The airport map appears divided into three sections, and a new set of buttons
appears (see Figure 25). The controller can select one of the buttons to close an entire runway.
24
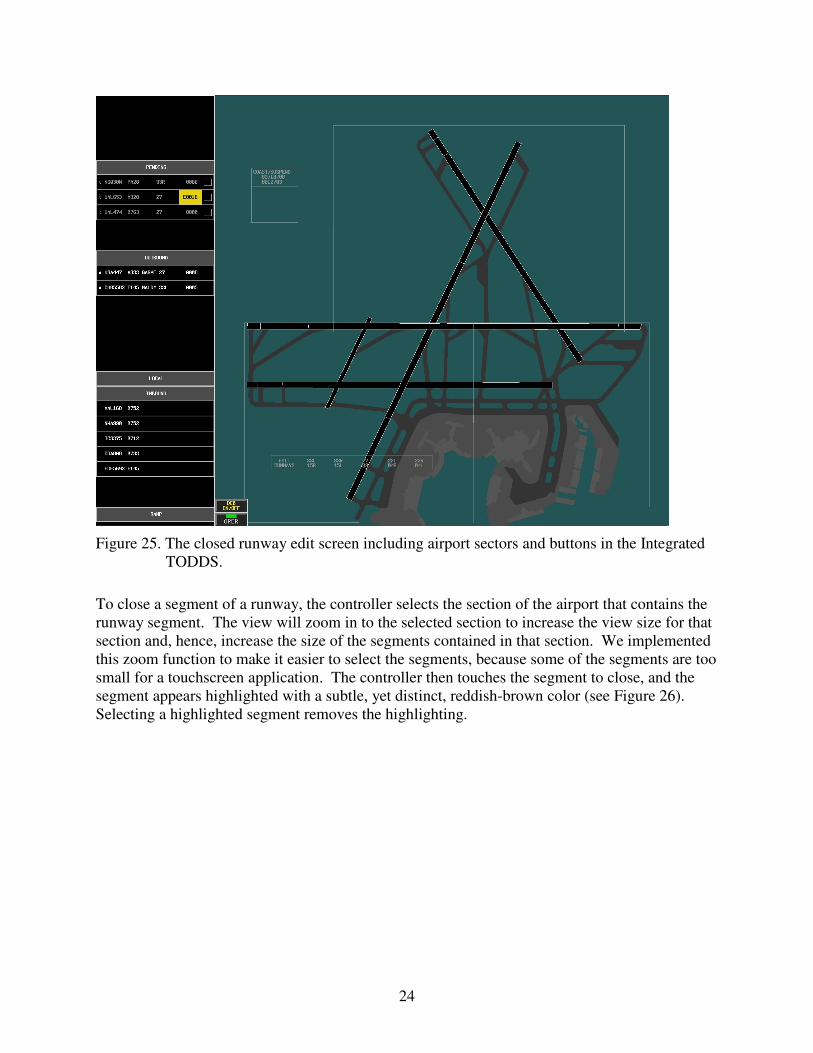
Figure 25. The closed runway edit screen including airport sectors and buttons in the Integrated
TODDS.
To close a segment of a runway, the controller selects the section of the airport that contains the
runway segment. The view will zoom in to the selected section to increase the view size for that
section and, hence, increase the size of the segments contained in that section. We implemented
this zoom function to make it easier to select the segments, because some of the segments are too
small for a touchscreen application. The controller then touches the segment to close, and the
segment appears highlighted with a subtle, yet distinct, reddish-brown color (see Figure 26).
Selecting a highlighted segment removes the highlighting.
25
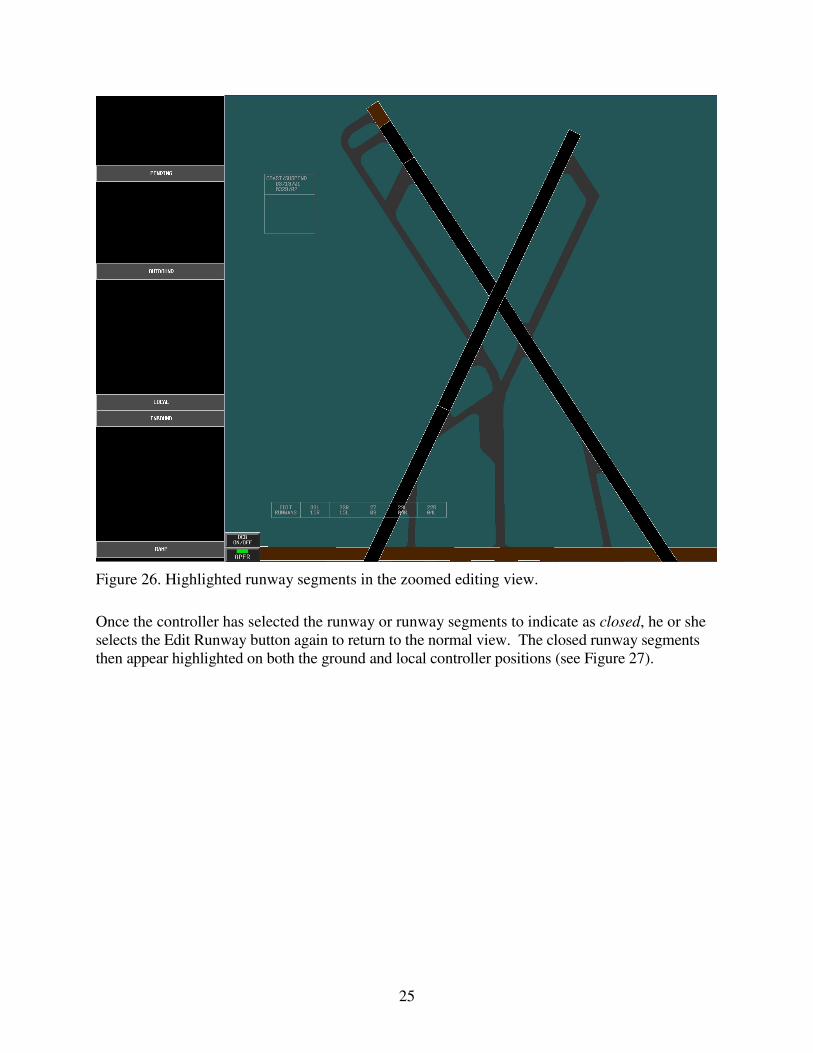
Figure 26. Highlighted runway segments in the zoomed editing view.
Once the controller has selected the runway or runway segments to indicate as closed, he or she
selects the Edit Runway button again to return to the normal view. The closed runway segments
then appear highlighted on both the ground and local controller positions (see Figure 27).
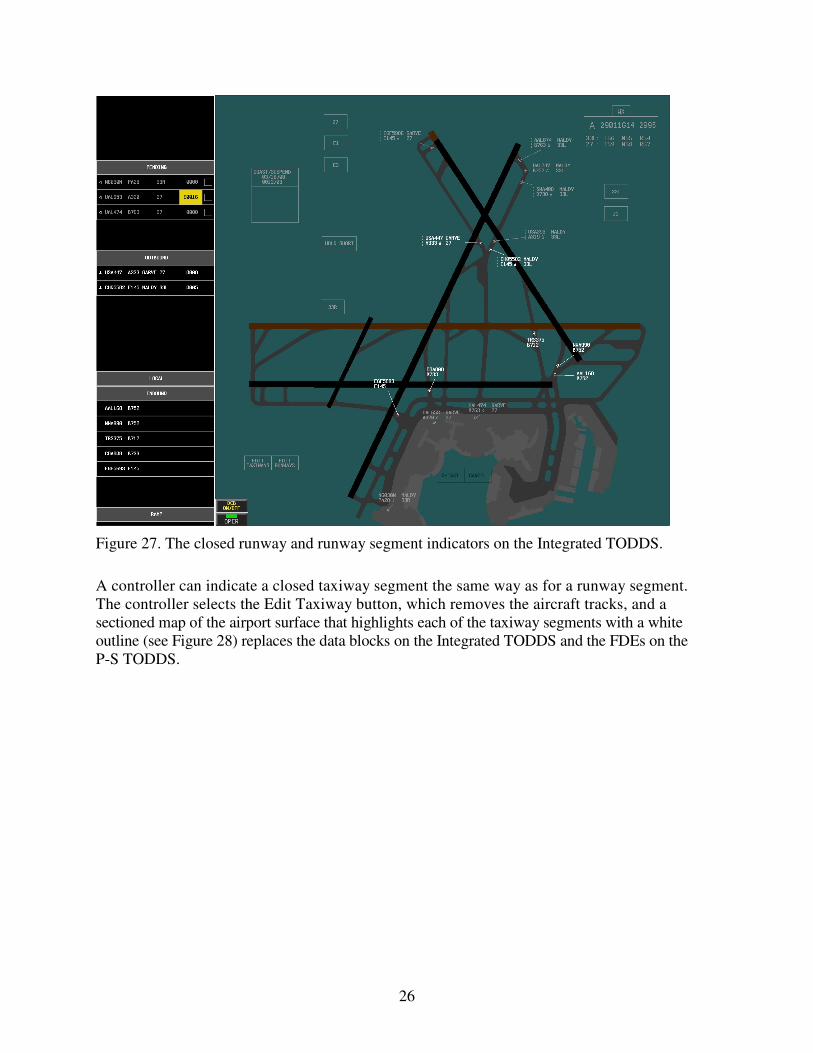
26
Figure 27. The closed runway and runway segment indicators on the Integrated TODDS.
A controller can indicate a closed taxiway segment the same way as for a runway segment.
The controller selects the Edit Taxiway button, which removes the aircraft tracks, and a
sectioned map of the airport surface that highlights each of the taxiway segments with a white
outline (see Figure 28) replaces the data blocks on the Integrated TODDS and the FDEs on the
P-S TODDS.

27
Figure 28. Highlighted taxiway segments in the editing view on the Integrated TODDS.
The controller then selects the section of the airport containing the taxiway segments to indicate
as closed, and the view zooms in to that section of the airport surface map. The controller then
selects the appropriate taxiway segments to activate (or deactivate) the highlighting (see Figure
29). The controller selects the Edit Taxiway button again to return to the normal view where the
highlighted segments appear on both the ground and local controller positions (see Figure 30).
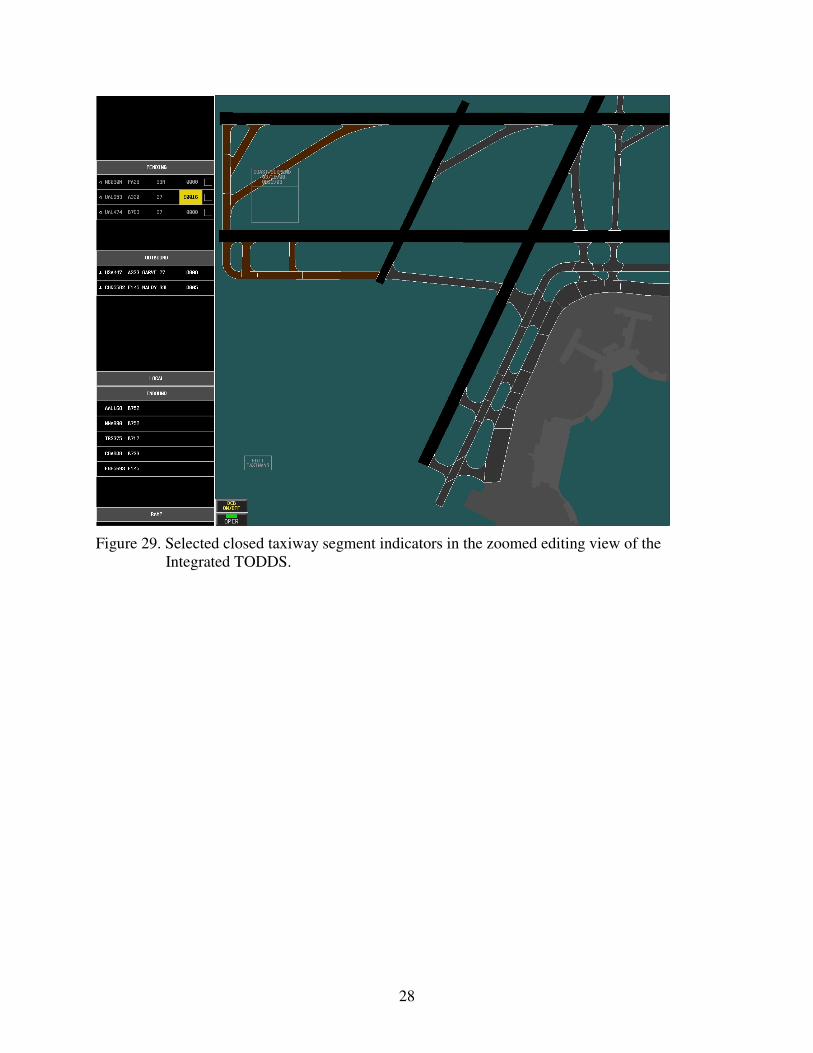
28
Figure 29. Selected closed taxiway segment indicators in the zoomed editing view of the
Integrated TODDS.

29
Figure 30. The closed taxiway segment indicators on the Integrated TODDS.
We chose to use color highlighting rather than graphics (e.g., X’s or hash marks) to indicate a
closed runway or taxiway segment because graphics would not always display properly for
smaller segments and surfaces displayed in certain orientations. We decided to remove the FDEs,
aircraft tracks, and data blocks during the runway/taxiway segment-editing task because we do not
expect controllers to use this function very often and the entire function takes only a few seconds
to complete. Because the TODDS prototypes link the ground and local controller positions to
one another, any change to a runway or taxiway indicator on one controller’s display is reflected
on the other controller’s display. The linked displays allow controllers to communicate and
remember information about closed runways and taxiways without direct verbal communication
or increased memory load, thereby reducing the possibility of miscommunication or memory
lapse.
3.4 Digital Taxi Out Clearance
The JPDO NextGen plan calls for an increase in the use of digital communications (JPDO,
2007). One way the JPDO plans to use digital communications in ATCT operations is for
D-Taxi out clearances. Therefore, we decided to implement D-Taxi out clearances into the
TODDS prototypes. The D-Taxi out clearance works the same way in both the Integrated and
P-S TODDS, except that the P-S TODDS contains only FDEs, whereas the Integrated TODDS
contains both FDEs and data blocks. The Integrated TODDS can also use the D-Taxi out
clearance to perform taxi conformance monitoring (as described in section 3.5).
30
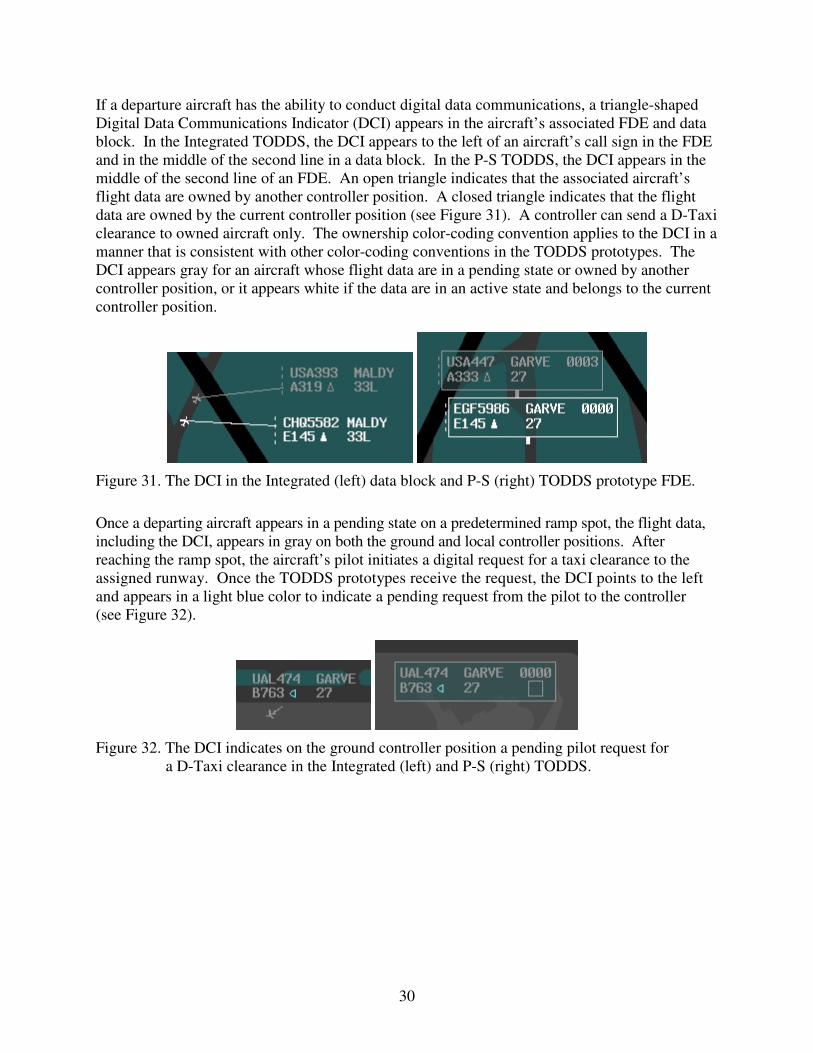
If a departure aircraft has the ability to conduct digital data communications, a triangle-shaped
Digital Data Communications Indicator (DCI) appears in the aircraft’s associated FDE and data
block. In the Integrated TODDS, the DCI appears to the left of an aircraft’s call sign in the FDE
and in the middle of the second line in a data block. In the P-S TODDS, the DCI appears in the
middle of the second line of an FDE. An open triangle indicates that the associated aircraft’s
flight data are owned by another controller position. A closed triangle indicates that the flight
data are owned by the current controller position (see Figure 31). A controller can send a D-Taxi
clearance to owned aircraft only. The ownership color-coding convention applies to the DCI in a
manner that is consistent with other color-coding conventions in the TODDS prototypes. The
DCI appears gray for an aircraft whose flight data are in a pending state or owned by another
controller position, or it appears white if the data are in an active state and belongs to the current
controller position.
Figure 31. The DCI in the Integrated (left) data block and P-S (right) TODDS prototype FDE.
Once a departing aircraft appears in a pending state on a predetermined ramp spot, the flight data,
including the DCI, appears in gray on both the ground and local controller positions. After
reaching the ramp spot, the aircraft’s pilot initiates a digital request for a taxi clearance to the
assigned runway. Once the TODDS prototypes receive the request, the DCI points to the left
and appears in a light blue color to indicate a pending request from the pilot to the controller
(see Figure 32).
Figure 32. The DCI indicates on the ground controller position a pending pilot request for
a D-Taxi clearance in the Integrated (left) and P-S (right) TODDS.
31
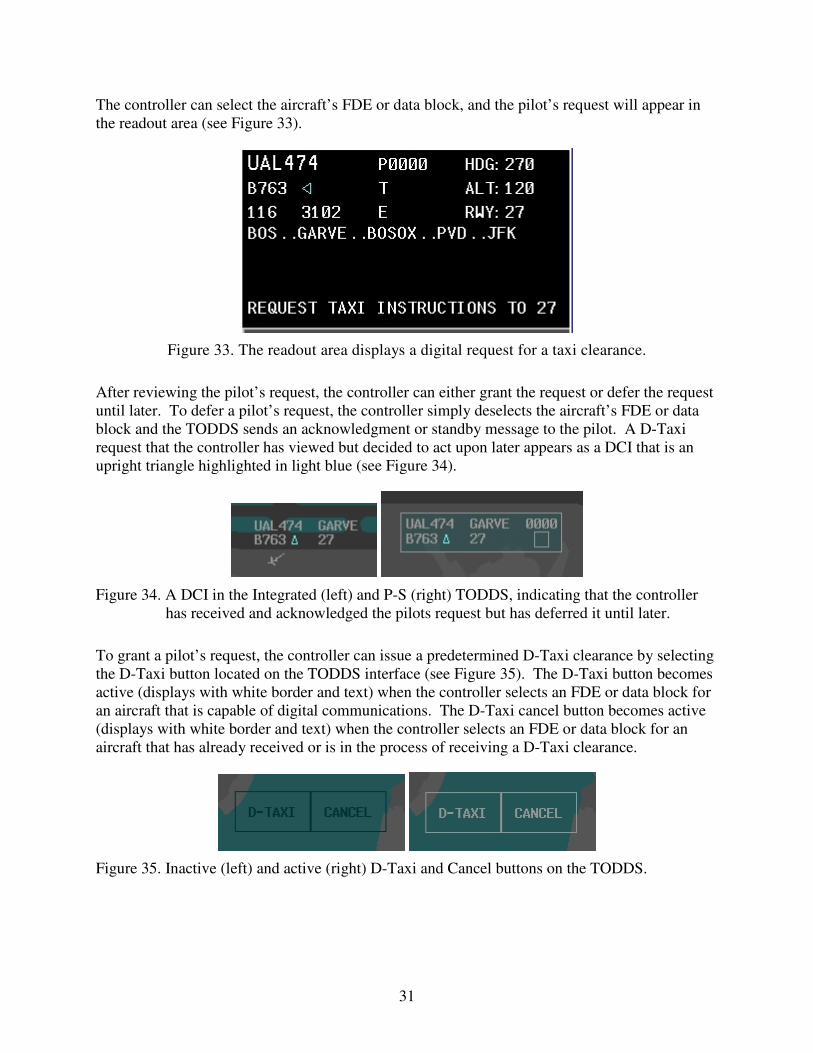
The controller can select the aircraft’s FDE or data block, and the pilot’s request will appear in
the readout area (see Figure 33).
Figure 33. The readout area displays a digital request for a taxi clearance.
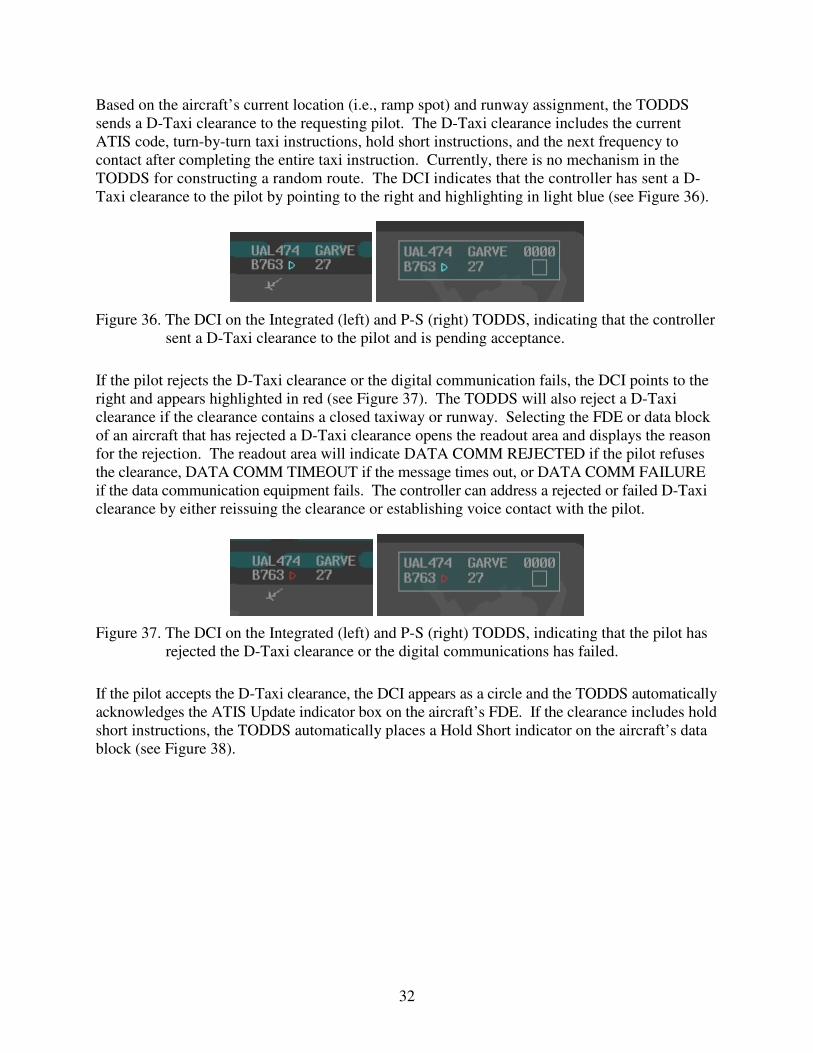
After reviewing the pilot’s request, the controller can either grant the request or defer the request
until later. To defer a pilot’s request, the controller simply deselects the aircraft’s FDE or data
block and the TODDS sends an acknowledgment or standby message to the pilot. A D-Taxi
request that the controller has viewed but decided to act upon later appears as a DCI that is an
upright triangle highlighted in light blue (see Figure 34).
Figure 34. A DCI in the Integrated (left) and P-S (right) TODDS, indicating that the controller
has received and acknowledged the pilots request but has deferred it until later.
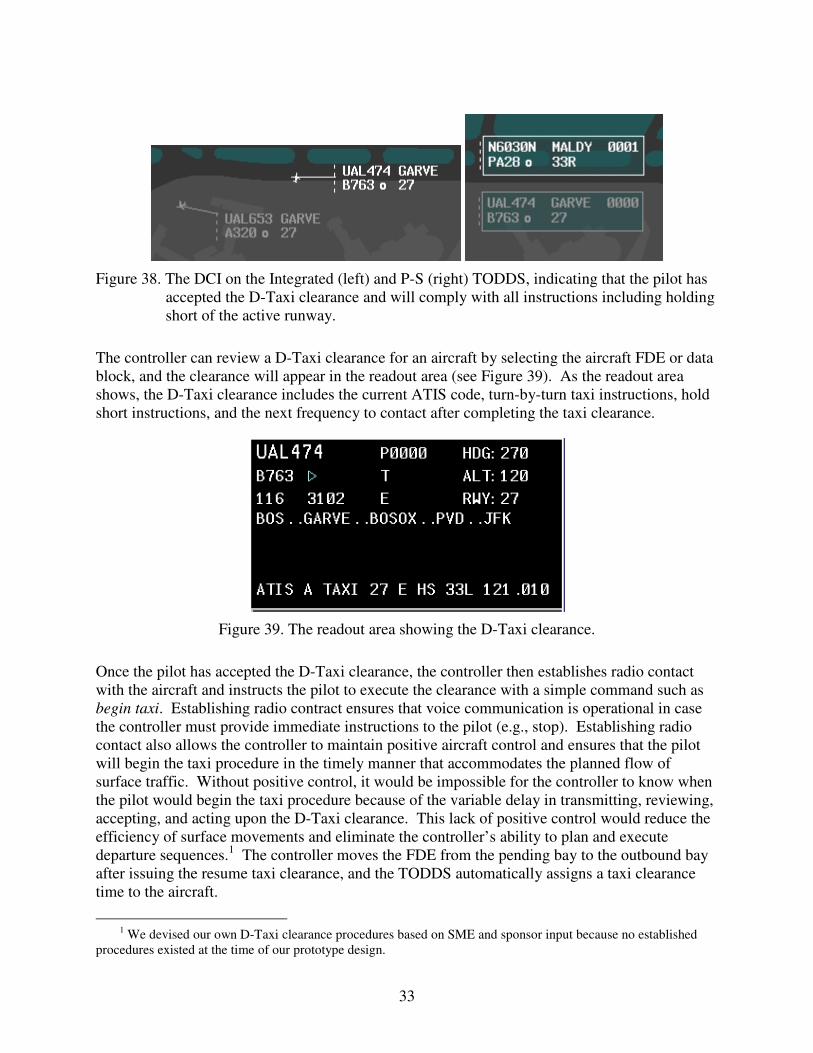
To grant a pilot’s request, the controller can issue a predetermined D-Taxi clearance by selecting
the D-Taxi button located on the TODDS interface (see Figure 35). The D-Taxi button becomes
active (displays with white border and text) when the controller selects an FDE or data block for
an aircraft that is capable of digital communications. The D-Taxi cancel button becomes active
(displays with white border and text) when the controller selects an FDE or data block for an
aircraft that has already received or is in the process of receiving a D-Taxi clearance.
Figure 35. Inactive (left) and active (right) D-Taxi and Cancel buttons on the TODDS.
32
Based on the aircraft’s current location (i.e., ramp spot) and runway assignment, the TODDS
sends a D-Taxi clearance to the requesting pilot. The D-Taxi clearance includes the current
ATIS code, turn-by-turn taxi instructions, hold short instructions, and the next frequency to
contact after completing the entire taxi instruction. Currently, there is no mechanism in the
TODDS for constructing a random route. The DCI indicates that the controller has sent a D-
Taxi clearance to the pilot by pointing to the right and highlighting in light blue (see Figure 36).
Figure 36. The DCI on the Integrated (left) and P-S (right) TODDS, indicating that the controller
sent a D-Taxi clearance to the pilot and is pending acceptance.
If the pilot rejects the D-Taxi clearance or the digital communication fails, the DCI points to the
right and appears highlighted in red (see Figure 37). The TODDS will also reject a D-Taxi
clearance if the clearance contains a closed taxiway or runway. Selecting the FDE or data block
of an aircraft that has rejected a D-Taxi clearance opens the readout area and displays the reason
for the rejection. The readout area will indicate DATA COMM REJECTED if the pilot refuses
the clearance, DATA COMM TIMEOUT if the message times out, or DATA COMM FAILURE
if the data communication equipment fails. The controller can address a rejected or failed D-Taxi
clearance by either reissuing the clearance or establishing voice contact with the pilot.
Figure 37. The DCI on the Integrated (left) and P-S (right) TODDS, indicating that the pilot has
rejected the D-Taxi clearance or the digital communications has failed.
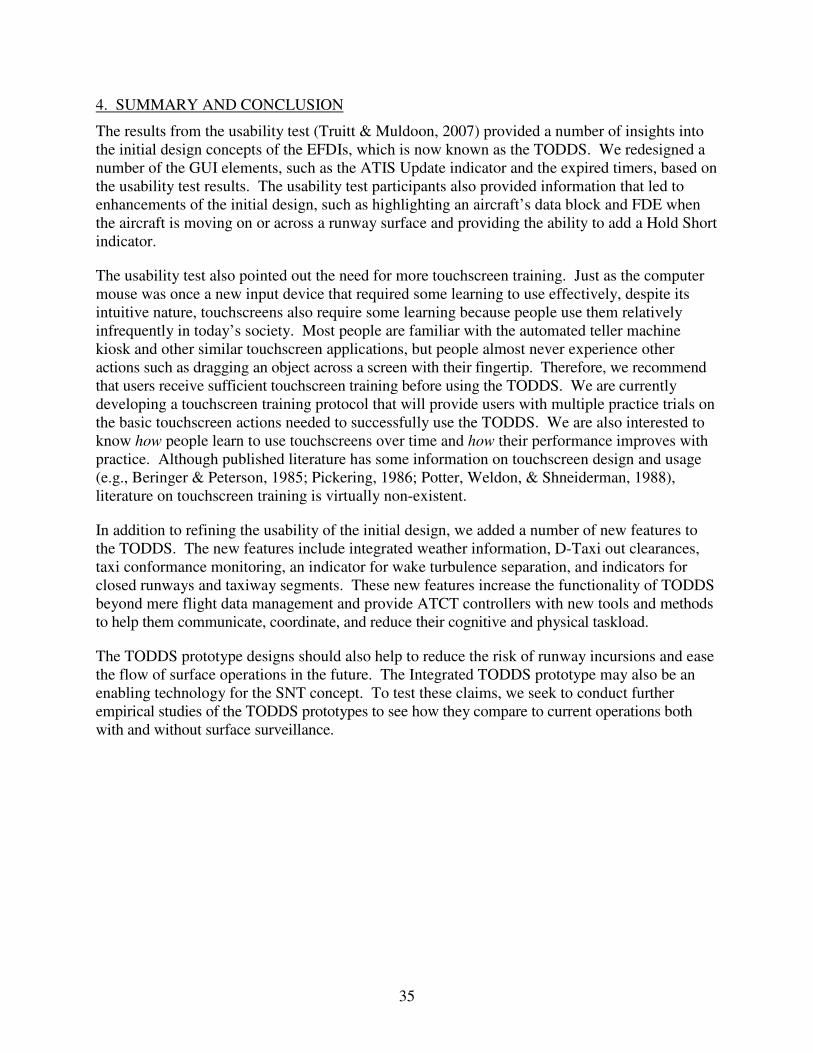
If the pilot accepts the D-Taxi clearance, the DCI appears as a circle and the TODDS automatically
acknowledges the ATIS Update indicator box on the aircraft’s FDE. If the clearance includes hold
short instructions, the TODDS automatically places a Hold Short indicator on the aircraft’s data
block (see Figure 38).
33
Figure 38. The DCI on the Integrated (left) and P-S (right) TODDS, indicating that the pilot has
accepted the D-Taxi clearance and will comply with all instructions including holding
short of the active runway.
The controller can review a D-Taxi clearance for an aircraft by selecting the aircraft FDE or data
block, and the clearance will appear in the readout area (see Figure 39). As the readout area
shows, the D-Taxi clearance includes the current ATIS code, turn-by-turn taxi instructions, hold
short instructions, and the next frequency to contact after completing the taxi clearance.
Figure 39. The readout area showing the D-Taxi clearance.
Once the pilot has accepted the D-Taxi clearance, the controller then establishes radio contact
with the aircraft and instructs the pilot to execute the clearance with a simple command such as
begin taxi. Establishing radio contract ensures that voice communication is operational in case
the controller must provide immediate instructions to the pilot (e.g., stop). Establishing radio
contact also allows the controller to maintain positive aircraft control and ensures that the pilot
will begin the taxi procedure in the timely manner that accommodates the planned flow of
surface traffic. Without positive control, it would be impossible for the controller to know when
the pilot would begin the taxi procedure because of the variable delay in transmitting, reviewing,
accepting, and acting upon the D-Taxi clearance. This lack of positive control would reduce the
efficiency of surface movements and eliminate the controller’s ability to plan and execute
departure sequences.1 The controller moves the FDE from the pending bay to the outbound bay
after issuing the resume taxi clearance, and the TODDS automatically assigns a taxi clearance
time to the aircraft.
1 We devised our own D-Taxi clearance procedures based on SME and sponsor input because no established
procedures existed at the time of our prototype design.

34
The controller can cancel a D-Taxi clearance at anytime by selecting an aircraft’s FDE or data
block and then selecting the Cancel button. The DCI will return to its neutral state indicating
that data communication is available, as shown in Figure 31. The D-Taxi Cancel button is
available only when the controller selects an FDE or data block associated with an aircraft that
is in the process of receiving or has already received a D-Taxi clearance.
3.5 Integrated TODDS – Taxi Conformance Monitoring
The ability to issue D-Taxi clearances also enables taxi conformance monitoring at airports that
have a surface surveillance capability. Once the controller issues a D-Taxi clearance, that
information could propagate throughout the NAS, and surface surveillance technology such as
ASDE-X could monitor an aircraft’s movement to ensure compliance. The Integrated TODDS
could alert controllers about an aircraft turning onto a wrong or closed taxiway or runway. Such
a taxi conformance monitoring system may have mitigated the crash at Lexington, Kentucky, on
August 27, 2006, (NTSB Identification: DCA06MA064; NTSB, 2007) and numerous other
incursions and accidents that have occurred due to pilots making a wrong turn on the airport
surface.
We implemented taxi conformance monitoring with the Integrated TODDS prototype to take
advantage of the D-Taxi clearance capability. The taxi conformance monitoring function is
fairly simple in that TODDS knows what route an aircraft that has received a D-Taxi clearance is
supposed to travel, and it can compare that route to the actual route traveled. If an aircraft takes
an unexpected turn or otherwise deviates from its D-Taxi clearance, the Integrated TODDS
notifies both the ground and local controllers by flashing the aircraft’s data block and FDE text.
The data block and FDE text flashes between red and its current ownership color and continues
to flash until a controller acknowledges it. A controller can acknowledge a flashing data block
from either the ground or local controller position by selecting the aircraft’s FDE or data block.
Once acknowledged, the FDE text and data block remain red until the aircraft returns to
conformance or until a controller cancels the D-Taxi clearance, as previously described. Figure
40 shows an aircraft’s FDE and data block that the TODDS has identified as not being in
conformance with an accepted D-Taxi clearance.
Figure 40. An FDE and data block highlighted in red, indicating that the aircraft is not
conforming to the D-Taxi clearance.
35
4. SUMMARY AND CONCLUSION
The results from the usability test (Truitt & Muldoon, 2007) provided a number of insights into
the initial design concepts of the EFDIs, which is now known as the TODDS. We redesigned a
number of the GUI elements, such as the ATIS Update indicator and the expired timers, based on
the usability test results. The usability test participants also provided information that led to
enhancements of the initial design, such as highlighting an aircraft’s data block and FDE when
the aircraft is moving on or across a runway surface and providing the ability to add a Hold Short
indicator.
The usability test also pointed out the need for more touchscreen training. Just as the computer
mouse was once a new input device that required some learning to use effectively, despite its
intuitive nature, touchscreens also require some learning because people use them relatively
infrequently in today’s society. Most people are familiar with the automated teller machine
kiosk and other similar touchscreen applications, but people almost never experience other
actions such as dragging an object across a screen with their fingertip. Therefore, we recommend
that users receive sufficient touchscreen training before using the TODDS. We are currently
developing a touchscreen training protocol that will provide users with multiple practice trials on
the basic touchscreen actions needed to successfully use the TODDS. We are also interested to
know how people learn to use touchscreens over time and how their performance improves with
practice. Although published literature has some information on touchscreen design and usage
(e.g., Beringer & Peterson, 1985; Pickering, 1986; Potter, Weldon, & Shneiderman, 1988),
literature on touchscreen training is virtually non-existent.
In addition to refining the usability of the initial design, we added a number of new features to
the TODDS. The new features include integrated weather information, D-Taxi out clearances,
taxi conformance monitoring, an indicator for wake turbulence separation, and indicators for
closed runways and taxiway segments. These new features increase the functionality of TODDS
beyond mere flight data management and provide ATCT controllers with new tools and methods
to help them communicate, coordinate, and reduce their cognitive and physical taskload.
The TODDS prototype designs should also help to reduce the risk of runway incursions and ease
the flow of surface operations in the future. The Integrated TODDS prototype may also be an
enabling technology for the SNT concept. To test these claims, we seek to conduct further
empirical studies of the TODDS prototypes to see how they compare to current operations both
with and without surface surveillance.
36
References
Alexander, J. R., Alley, V. L., Ammerman, H. L., Fairhurst, W. S., Hostetler, C. M., & Jones, G.
W., et al. (1989). FAA air traffic control operations concepts – Vol. 7: ATC tower
controllers (FAA Report No. DOT/FAA/AP-87-01). Washington, DC: Federal Aviation
Administration.
Ammerman, H. L., Becker, E. S., Jones, G. W., Tobey, W. K., & Phillips, M. D. (1987). FAA air
traffic control operations concept – Vol. 1: ATC background and analysis methodology
(FAA Report No. DOT/FAA/AP-87-01). Washington, DC: Federal Aviation
Administration.
Beringer, D. B., & Peterson, J. G. (1985). Underlying behavior parameters of the operation of
touch-input devices: Biases, models, and feedback. Human Factors, 27(4), 445-458.
Federal Aviation Administration. (2008). Air Traffic Control (DOT/FAA/Order 7110.65S).
Washington, DC: Author.
Joint Planning and Development Office. (2007, July). Next generation air transportation system
research and development plan FY 2009-2013. Washington, DC: Author.
National Transportation Safety Board. (1997, July 28). Brief of accident. Retrieved April 23, 2008,
from http://www.ntsb.gov/ntsb/GenPDF.asp?id=MIA96LA107&rpt=fi
National Transportation Safety Board. (2007, September 27). Brief of accident. Retrieved April
23, 2008, from http://www.ntsb.gov/ntsb/GenPDF.asp?id=DCA06MA064&rpt=fi
Pickering, J. A. (1986). Touch-sensitive screens: The technologies and their applications.
International Journal of Man-Machine Studies, 25, 249-269.
Potter, R. L., Weldon, L. J., & Shneiderman, B. (1988). Improving the accuracy of touch screens:
An experimental evaluation of three strategies. ACM SIGCHI, Proceedings of the
Conference on Human Factors in Computing Systems (pp. 27-32).
Truitt, T. R. (2006a). Concept development and design description of electronic flight data
interfaces for Airport Traffic Control Towers (DOT/FAA/TC-TN-06/17). Atlantic City
International Airport, NJ: FAA William J. Hughes Technical Center.
Truitt, T. R. (2006b). Electronic flight data in Airport Traffic Control Towers: Literature review
(DOT/FAA/CT-05/13). Atlantic City International Airport, NJ: FAA William J. Hughes
Technical Center.
Truitt, T. R., & Muldoon, R. (2007). New electronic flight data interface designs for Airport
Traffic Control Towers: Initial usability test (DOT/FAA/TC-07/16). Atlantic City
International Airport, NJ: FAA William J. Hughes Technical Center.
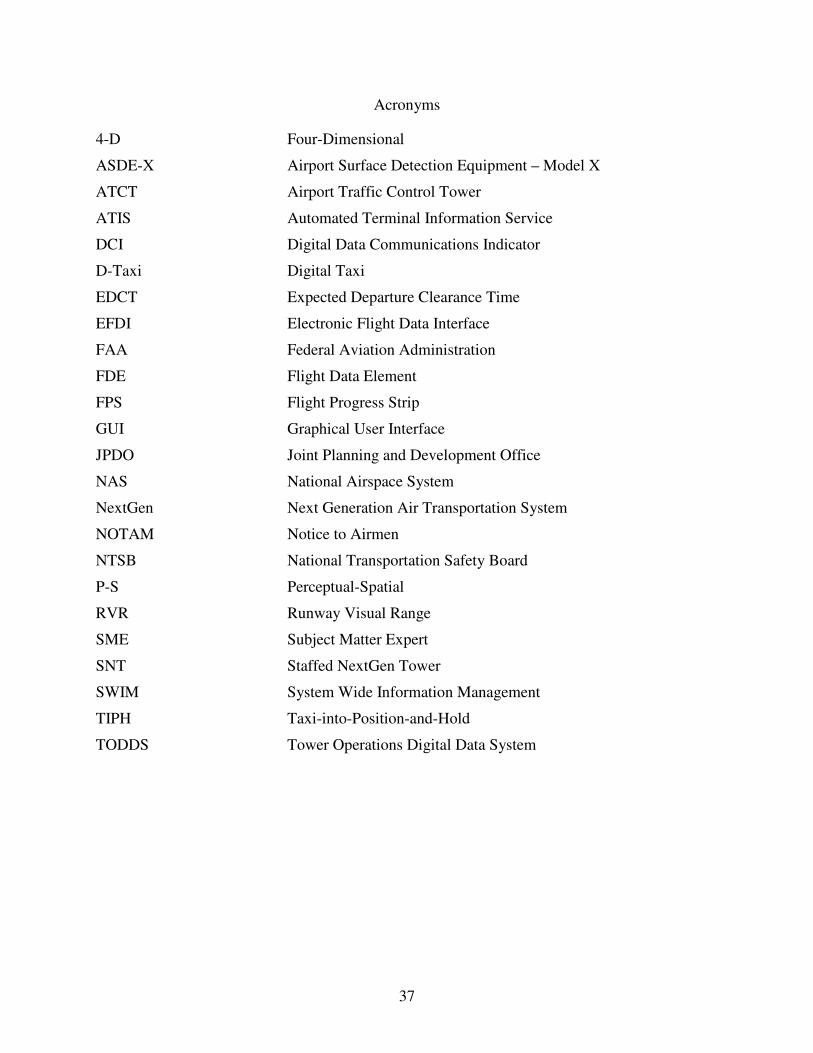
37
Acronyms
4-D Four-Dimensional
ASDE-X Airport Surface Detection Equipment – Model X
ATCT Airport Traffic Control Tower
ATIS Automated Terminal Information Service
DCI Digital Data Communications Indicator
D-Taxi Digital Taxi
EDCT Expected Departure Clearance Time
EFDI Electronic Flight Data Interface
FAA Federal Aviation Administration
FDE Flight Data Element
FPS Flight Progress Strip
GUI Graphical User Interface
JPDO Joint Planning and Development Office
NAS National Airspace System
NextGen Next Generation Air Transportation System
NOTAM Notice to Airmen
NTSB National Transportation Safety Board
P-S Perceptual-Spatial
RVR Runway Visual Range
SME Subject Matter Expert
SNT Staffed NextGen Tower
SWIM System Wide Information Management
TIPH Taxi-into-Position-and-Hold
TODDS Tower Operations Digital Data System