Towards Tropical and Temperate Testers Genetic Diversity ...
16
Page 1/16 Genetic Diversity and Heterotic Orientation of South Africa Maize Inbred Lines Towards Tropical and Temperate Testers Siphiwokuhle Funani Shandu Agricultural Research Council John Derera ( [email protected] ) IITA: International Institute of Tropical Agriculture https://orcid.org/0000-0003-3715-0689 Kingston Mashingaidze ARC: Agricultural Research Council Edmore Gasura University of Zimbabwe Original Article Keywords: Heterotic groups, maize inbred lines, single nucleotide polymorphism, specic combining ability, temperate and tropical maize testers Posted Date: February 4th, 2021 DOI: https://doi.org/10.21203/rs.3.rs-173281/v1 License: This work is licensed under a Creative Commons Attribution 4.0 International License. Read Full License Version of Record: A version of this preprint was published at Euphytica on July 20th, 2021. See the published version at https://doi.org/10.1007/s10681-021- 02896-8.
Transcript of Towards Tropical and Temperate Testers Genetic Diversity ...

Page 1/16
Genetic Diversity and Heterotic Orientation of South Africa Maize Inbred LinesTowards Tropical and Temperate TestersSiphiwokuhle Funani Shandu
Agricultural Research CouncilJohn Derera ( [email protected] )
IITA: International Institute of Tropical Agriculture https://orcid.org/0000-0003-3715-0689Kingston Mashingaidze
ARC: Agricultural Research CouncilEdmore Gasura
University of Zimbabwe
Original Article
Keywords: Heterotic groups, maize inbred lines, single nucleotide polymorphism, speci�c combining ability, temperate and tropical maize testers
Posted Date: February 4th, 2021
DOI: https://doi.org/10.21203/rs.3.rs-173281/v1
License: This work is licensed under a Creative Commons Attribution 4.0 International License. Read Full License
Version of Record: A version of this preprint was published at Euphytica on July 20th, 2021. See the published version at https://doi.org/10.1007/s10681-021-02896-8.
Page 2/16
AbstractAn e�cient hybrid breeding program de�nes and utilizes few heterotic groups. The objectives of this study were to determine genetic diversity and alignmentof South Africa maize inbred lines collection towards tropical and temperate testers. Forty-two maize inbred lines were genotyped with 56110 singlenucleotide polymorphism (SNP) DNA markers, using the Illumina MaizeSNP50 Bead chip. The 42 lines were crossed to two tropical and two temperate inbredline testers. The testcrosses were evaluated across seven environments, in South Africa, during 2014-2016. Genotypes and speci�c combining ability (SCA)effects of hybrids were signi�cantly different (P<0.05) for grain yield. There was a weak correlation between molecular genetic distances and both grain yieldmean and speci�c combining ability effects of hybrids, indicating that productivity of maize inbred lines could not be reliably determined based on moleculargenetic distances. The SCA data was capable of classifying these maize inbred lines into three heterotic groups with respect to both tropical and temperatetesters. Only a few lines could not be grouped on the basis of SCA data. The study also indicated high level of diversity among the maize inbred lines, whichwas shown by both the dendogram and molecular genetic distances. The SNP marker data classi�ed the inbred lines into 11 clusters that could be simpli�edinto three major groups of normal maize endosperm and two groups of quality protein maize (QPM) endosperm types. However, the SNP data indicated thatmaize lines were more aligned towards tropical than temperate inbred testers. This information would be useful for simplifying heterotic classi�cation of thelines with profound implications for breeding progress.
IntroductionAdvances in maize breeding have an important role in continually developing and deploying new maize cultivars, exhibiting improved grain yield and desirableagronomic characters. The strength and success of any breeding program depends on a well-established and properly arranged germplasm (Rajendran et al.,2014), which provides potential exploitation of maximum heterosis in crosses (Bidhendi et al., 2012; Librando and Magulama, 2008). Therefore, identi�cationof heterotic groups (HGs) and heterotic patterns is the principal step towards developing a well-established germplasm (Barata and Carena, 2006; Delucchi etal., 2012) for a hybrid oriented breeding programme. Melchinger and Gumber (1998) de�ned a heterotic group as a group of related or unrelated genotypesfrom the same or different populations, which show similar combining ability and heterotic response when crossed with genotypes from other geneticallydifferent groups, whereas heterotic pattern is observed when a cross between a speci�c pair of two heterotic groups expresses high level of heterosis.
Classi�cation of germplasm into heterotic groups offers several advantages in most breeding programs. When inbred lines from different known andunknown origins are used, a large number of hybrid combinations are made which are later evaluated in multi-location environments (Bidhendi et al., 2012).However, this is labour-intensive, lengthy and costly (Aguiar et al., 2008). However, when heterotic groups are formed, undesirable combinations are avoided bycrossing inbred lines from the existing and divergent groups (Aguiar et al., 2008). This allows the exploitation of maximum heterosis (Melchinger and Gumber,1998) among selected lines in hybrid combination, reduces the chance of missing superior hybrids and subsequently improves breeding e�ciency. Accordingto Fan et al. (2009) breeding e�ciency is the percentage of superior hybrids, which are obtained relative to the total number of crosses made between linesfrom distinct heterotic groups in a breeding program. The employment of simple heterotic groups would simplify germplasm management (Fan et al., 2003).Selecting parental lines from de�ned heterotic groups is rapid and e�cient (Kanyamasoro et al., 2012). The information on simpli�ed heterotic orientation iscrucial for setting up an e�cient maize breeding program.
Knowledge of combining ability among maize inbred lines in the program is paramount for establishing heterotic orientations. General combining ability(GCA) and speci�c combining ability (SCA) as de�ned by Sprague and Tatum (1942) data are used to determine utility of maize inbred lines. They reveal theability of inbred lines to combine amongst each other during hybridization and transmit the desirable genes to the F1 crosses (Fasahat et al., 2016). A surveyof the literature indicates that SCA data is an important statistical tool for classifying maize germplasm into heterotic groups. The SCA data has a highpredictive value for F1 grain yield than heterosis data (Betran et al., 2003). However, the SCA data can be used together with other methods that are cheaperand even more precise, because they are not affected by genotype x environment interaction effects. This includes molecular markers such as SNPgenotyping.
Genotyping maize inbred lines with molecular markers and pedigree analyses are some of the methods which can be used to establish levels of diversity andclassifying germplasm into potential heterotic groups. These methods have been reported in the literature (Parentoni et al., 2001; de Pinto et al., 2003; Fan etal., 2003; Fan et al., 2004; Menkir et al., 2004; Barata and Carena, 2006; Aguiar et al., 2008; Badu-Apraku et al., 2013; Rajendran et al., 2014). Effectiveness ofthese methods in classifying germplasm is mainly validated by estimating SCA of the hybrids using the line by tester method. The line x tester mating schemeutilizes a few divergent testers of known heterotic groups to determine heterotic orientation of inbred lines. Among other tools, the line x tester mating schemehas been widely used and reported in the literature (Vasal et al., 1992; Menkir et al., 2003; Li et al., 2007; Aguiar et al., 2008; Fan et al., 2010; Rajendran et al.,2014; Fasahat et al., 2016).
The public maize germplasm lines in South Africa have been maintained in at least seven heterotic groups since the beginning of professional maize breedingin the country. These heterotic groups have been utilised extensively in different combinations to develop commercial maize hybrids, since the Saunders andGevers eras (Fourie and Gevers, 1987; Gevers and Whythe, 1987; Gevers and Lake, 1998). The use of a large number of heterotic groups from differentpopulations complicates the breeding process and decision making during selection of parental lines. Employment of many heterotic groups is associatedwith several major drawbacks, including high costs of making and evaluating hybrids, and extended timeline to obtain results (de Pinto et al., 2003; Aguiar etal., 2008; Bidhendi et al., 2012) and subsequent reduction in breeding e�ciency (Fan et al., 2014). This prompts the need to simplify the heterotic classi�cationof the lines in South Africa for use in breeding.
Due to climate change, there is need to continuously introgress and incorporate germplasm from other countries, such as tropical Africa, tropical SouthAmerica and USA temperate maize inbred lines. This would enhance genetic diversity and adaptation of the lines to climate change effects, such asincreasing frequency and severity of drought, and global warming among other challenges.
Page 3/16
Given the foregoing, the objectives of the current study were to determine diversity of South Africa maize inbred lines, and investigate their orientation towardsthe widely utilized tropical and temperate testers. The use of tropical and temperate testers was prudent because South Africa maize production falls withinsubtropical to warm temperate conditions. In this regard, both tropical and temperate maize germplasm could be exploited to develop productive hybrids,using a simpli�ed heterotic classi�cation system.
Materials And Methods
GermplasmForty-two maize inbred lines were selected from the Agricultural Research Council of South Africa maize germplasm database. Six representative maize inbredlines were randomly selected from each of the seven traditional heterotic groups. The seven heterotic groups were described by fore-bearers of the publicmaize breeding programs in the region, such as Saunders, Gevers, Olver, Fourie and others (Gevers and Whythe, 1987; Gevers and Lake, 1998; Olver, 1998) andFourie (2017, personal communication). According to the literature, the inbred lines used were developed from germplasm which was introduced from the USA,Australia and also mainly from the local open-pollinated varieties which mostly originated from the USA corn-belt (Saunders, 1942; Gevers, 1997). There is apossibility of infusion of temperate and tropical genetic backgrounds through both incorporation and introgression of USA’s temperate germplasm, in SouthAfrica. Therefore, it was prudent that the 42 lines were crossed with four testers, representing the heterotic Groups A and B of both tropical and temperateorigin. The maize inbred line testers were represented by the International Maize and Wheat Improvement Center’s (CIMMYT) tropical testers from Group A(CML312) and Group B (CML444). The temperate testers were represented by the Group A (B73) and Group B (MO17) inbred lines of the USA. These testersand their derivatives are widely used worldwide. The B73 and MO17 maize testers are temperate inbred lines representing the US Reid (heterotic Group A) andLancaster heterotic groups (heterotic group B), respectively. These testers were developed by the University of Missouri and Iowa State University, respectively.The CML312 and CML444 are CIMMYT tropical maize inbred lines that were developed by the CIMMYT breeding program in Mexico and Harare in Zimbabwe,respectively. The CML312 is an intermediate maturing and subtropical line that is drought tolerant. The CML444 is a late maturing and mid-altitude orsubtropical adapted inbred line. According to CIMMYT (2001), the heterotic Group A to which CML312 belongs consists of the pro-Tuxpeno (Mexico), Kitale(Kenya), BSSS and N3 (Zimbabwe) germplasm types. Most of the germplasm which is aligned to this group is of more dent grain texture. The CML444 is thecounterpart of the CML312 in CIMMYT’s heterotic Group B. It corresponds to the ETO, Ecuador 573, Lancaster and the SC (Zimbabwe) germplasm (CIMMYT,2001). The germplasm lines in this group tend to be of a �int grain texture type in the CIMMYT heterotic system. CML444 is drought and low nitrogen tolerant(CIMMYT, 2001). The N3 and SC heterotic pattern has been reviewed and discussed in detail (Derera and Musimwa, 2015; Musimwa and Derera, 2015).
Experimental Design and ManagementField experiments were conducted at the Agricultural Research Council’s Summer Grain Crops Institute station, in Potchefstroom (26.740S; 27.080E; altitude1349 m) and the Cedara Research Station (29.540S; 30.260E; altitude 1068 m), in South Africa, during the 2014/15 and 2015/16 summer season. Rainfallamount was below average of the long-term weather data of the previous 29 growing seasons (29 years). During the 2015/16 season, the PotchefstroomStation received 67% and Cedara got 78% of the long term average total rainfall of 541 mm and 662 mm, respectively; while both stations received 93–95% ofthe long term total rainfall in the 2014/15 season. The 2015/16 season was characterised by the El Nino associated drought, which affected the wholeSouthern Africa region. Maximum daily average temperatures were at least 20C above the long term average of 290C and 250C at Potchefstroom and Cedarastations, respectively. The average night or minimum temperatures were at least 10C below the long-term average of 150C and 140C at Potchefstroom andCedara, respectively.
All trials were laid out as α-lattice design with two replicates within the sites. A compound fertiliser (NPK, 3:2:1) was applied as a basal fertiliser prior tosowing, at a rate of 25 kg N ha− 1, 17 kg P ha− 1 and 8 kg K ha− 1. Each hybrid entry was planted to a two-row plot of 4 m length, and the intra-and inter-rowspacing were 0.25 m and 0.75 m, respectively. Thirty-four seeds (two per hill) were initially sown and later thinned to 17 vigorous plants per row to achieve 53333 plants ha− 1. Lime ammonium nitrate (LAN, 33% N) was applied as a top dressing at a rate of 150 kg ha− 1, at four weeks after crop emergence. Weedswere controlled using pre-emergence herbicide, Bateleur Gold 650EC (Flumetsulam (sulfonanilide), s – metalachlor), at 1.3 L ha− 1 and post-emergenceherbicide, Basagran (480 g/L bendioxide (thiadiazine)) at 2.5 L ha− 1. This was augmented by occasional manual weeding when needed. Insecticides wereapplied to control stalk-borer, using Karate (50 g/L lambda-cyhalothrin) at 70 ml ha− 1. Due to the below normal total rainfall, which was experienced at bothstations, supplementary irrigation water was applied to augment rainfall amount until crops reached the physiological maturity, especially during the 2015/16season. Grain yield per plot was estimated and converted to tonnes ha− 1 at 12.5 % grain moisture content in line with the standard practice for maizeproduction, in South Africa.
Field Data Analysis and Classi�cation of LinesAnalysis of variance (ANOVA) was performed on plot means for grain yield data across sites for each season. Lines that did not cross successfully with alltesters were not included in the analysis, hence 31 lines were used to perform the line x tester analysis. Speci�c combining ability effects for grain yield wereestimated using the line by tester procedure, which is embedded in the Analyses of Genetic Designs computer software with ‘R’ (AGD-R, version 3.0) (Rodriguezet al., 2015). Lines and testers were treated as �xed effects. The statistical model used for the combined analysis was as follows:
Yijkl = µ + Li + Tj + (L×T)ij + El + (L×E)il + (T×E)jl + Rk(El) + (L×T×E)ijl + eijkl,
where Yijkl is the measured grain yield data of the testcross of the ith line crossed to jth tester in the lth site and kth replicate; µ is the grand mean; Li is the effect
of the ith line; Tj is the effect of the jth tester; El is the effect of the lth site; (L×T)ij is the interaction effect of the cross between the ith line and the jth tester;
Page 4/16
(L×E)il is the interaction effect of the ith line and the lth site; (T×E)jl is the interaction effect of the jth tester and the lth site; Rk (El) is the effect of the kth replicate
nested in the lth site; (L×T×E)ijl is the interaction effect of the ith line, jth tester and the lth site and Eijkl is the random error term.
Classi�cation of lines into heterotic groups was based on the speci�c combining ability (SCA) value of a line and a tester for grain yield as proposed by Vasalet al. (1992). Lines that showed negative SCA effects for grain yield when crossed to a particular tester were deemed to belong to the same heterotic groupwith the tester; whereas lines that exhibited positive SCA effects with one tester indicate that those lines belong to the opposite heterotic group. The linesdisplaying positive SCA with both testers (A and B) were allocated to the AB heterotic group and those displaying negative SCA with both testers could not beclassi�ed on the basis of SCA data.
SNP Genotyping and Diversity AnalysisThe 42 maize inbred lines were planted in the glasshouse for DNA sampling. Leaf samples bulked from four plants of each inbred were taken at two weeksafter planting. Genomic DNA was extracted at the Agricultural Research Council-Grain Crops laboratory, following a modi�ed CTAB procedure (Doyle, 1987).DNA samples were sent to the Agricultural Research Council-Biotechnology platform in South Africa for genotyping using the single nucleotide polymorphism(SNP) markers. Genotyping was carried out using the Illumina MaizeSNP50 Bead chip, which was derived from the B73 reference genome(www.illumina.com). The protocol provided 56110 SNP markers, which were densely covering all the ten chromosomes of the maize genome. The geneticdistance (dissimilarity) estimates among inbred lines were calculated based on the Gower’s distance (Gower, 1971). Genotypes were subsequently grouped bythe Unweighted Pair Group Method using Arithmetic average (UPGMA) algorithm, using the R studio Software version 3.3 (RStudio Team, 2015).
Results
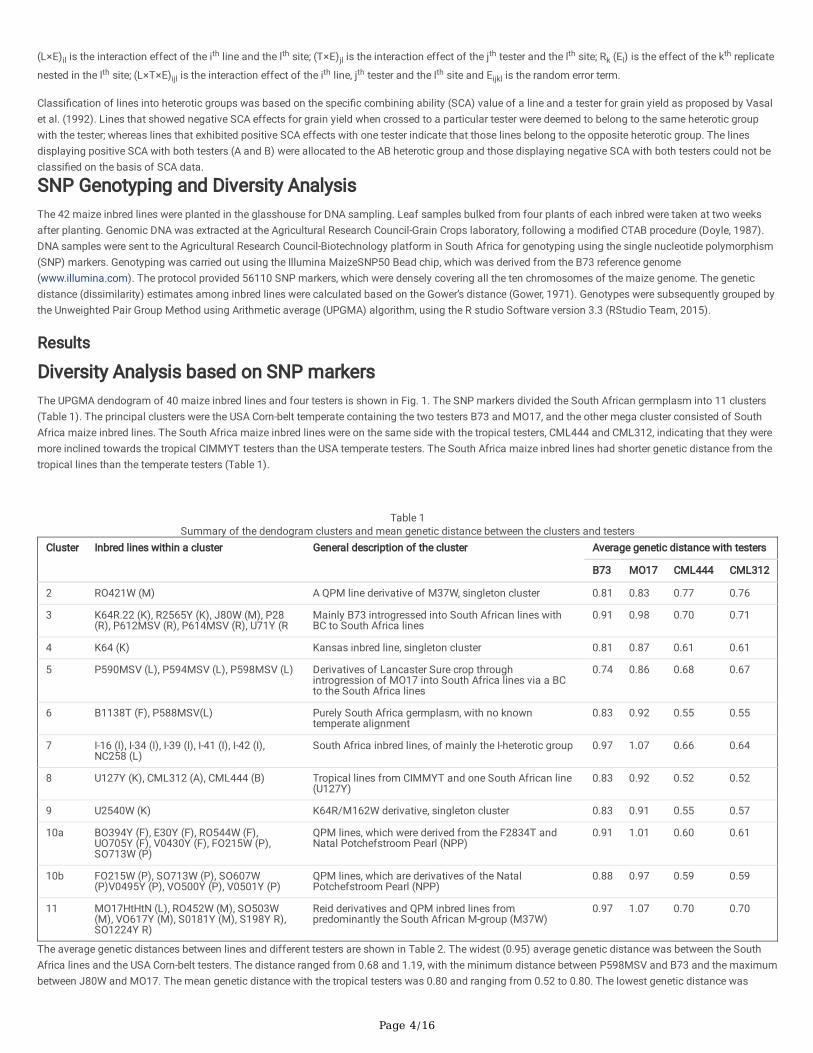
Diversity Analysis based on SNP markersThe UPGMA dendogram of 40 maize inbred lines and four testers is shown in Fig. 1. The SNP markers divided the South African germplasm into 11 clusters(Table 1). The principal clusters were the USA Corn-belt temperate containing the two testers B73 and MO17, and the other mega cluster consisted of SouthAfrica maize inbred lines. The South Africa maize inbred lines were on the same side with the tropical testers, CML444 and CML312, indicating that they weremore inclined towards the tropical CIMMYT testers than the USA temperate testers. The South Africa maize inbred lines had shorter genetic distance from thetropical lines than the temperate testers (Table 1).
Table 1Summary of the dendogram clusters and mean genetic distance between the clusters and testers
Cluster Inbred lines within a cluster General description of the cluster Average genetic distance with testers
B73 MO17 CML444 CML312
2 RO421W (M) A QPM line derivative of M37W, singleton cluster 0.81 0.83 0.77 0.76
3 K64R.22 (K), R2565Y (K), J80W (M), P28(R), P612MSV (R), P614MSV (R), U71Y (R
Mainly B73 introgressed into South African lines withBC to South Africa lines
0.91 0.98 0.70 0.71
4 K64 (K) Kansas inbred line, singleton cluster 0.81 0.87 0.61 0.61
5 P590MSV (L), P594MSV (L), P598MSV (L) Derivatives of Lancaster Sure crop throughintrogression of MO17 into South Africa lines via a BCto the South Africa lines
0.74 0.86 0.68 0.67
6 B1138T (F), P588MSV(L) Purely South Africa germplasm, with no knowntemperate alignment
0.83 0.92 0.55 0.55
7 I-16 (I), I-34 (I), I-39 (I), I-41 (I), I-42 (I),NC258 (L)
South Africa inbred lines, of mainly the I-heterotic group 0.97 1.07 0.66 0.64
8 U127Y (K), CML312 (A), CML444 (B) Tropical lines from CIMMYT and one South African line(U127Y)
0.83 0.92 0.52 0.52
9 U2540W (K) K64R/M162W derivative, singleton cluster 0.83 0.91 0.55 0.57
10a BO394Y (F), E30Y (F), RO544W (F),UO705Y (F), V0430Y (F), FO215W (P),SO713W (P)
QPM lines, which were derived from the F2834T andNatal Potchefstroom Pearl (NPP)
0.91 1.01 0.60 0.61
10b FO215W (P), SO713W (P), SO607W(P)V0495Y (P), VO500Y (P), V0501Y (P)
QPM lines, which are derivatives of the NatalPotchefstroom Pearl (NPP)
0.88 0.97 0.59 0.59
11 MO17HtHtN (L), RO452W (M), SO503W(M), VO617Y (M), S0181Y (M), S198Y R),SO1224Y R)
Reid derivatives and QPM inbred lines frompredominantly the South African M-group (M37W)
0.97 1.07 0.70 0.70
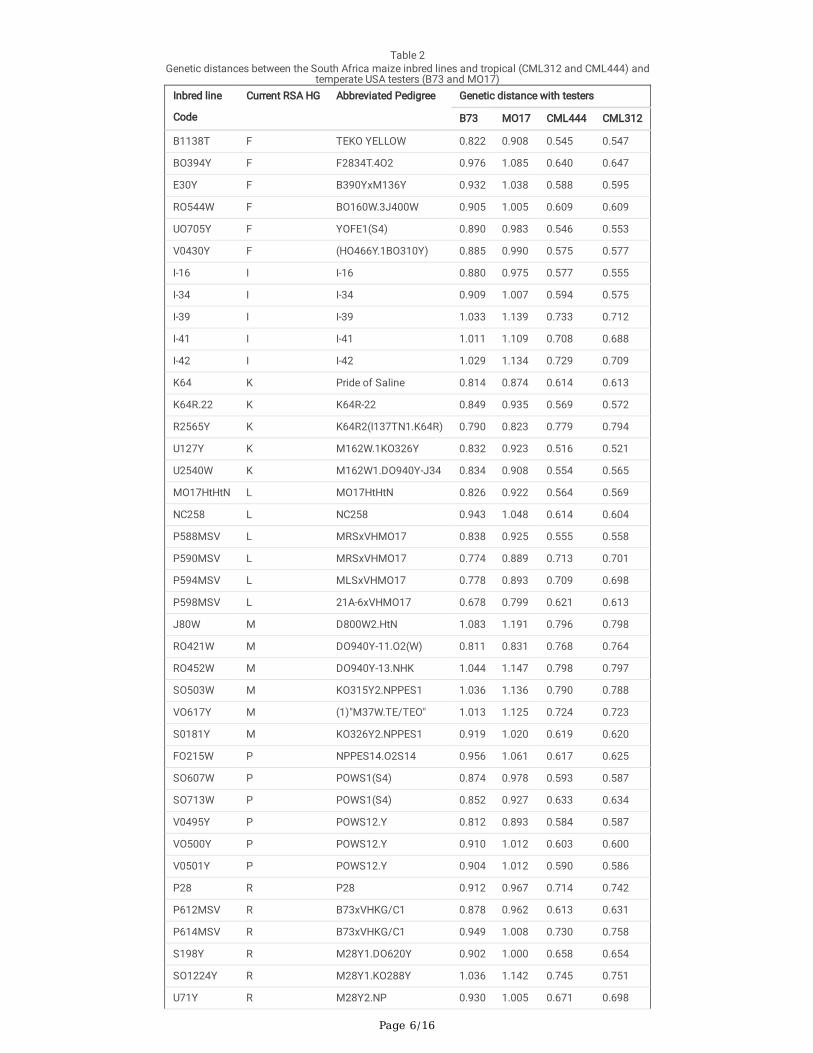
The average genetic distances between lines and different testers are shown in Table 2. The widest (0.95) average genetic distance was between the SouthAfrica lines and the USA Corn-belt testers. The distance ranged from 0.68 and 1.19, with the minimum distance between P598MSV and B73 and the maximumbetween J80W and MO17. The mean genetic distance with the tropical testers was 0.80 and ranging from 0.52 to 0.80. The lowest genetic distance was

Page 5/16
estimated between U127Y and both CIMMYT testers, CML312 and CML444, while the largest genetic distance was found between J80W with both tropicaltesters, and between RO452W and CML444.
Page 6/16
Table 2Genetic distances between the South Africa maize inbred lines and tropical (CML312 and CML444) and
temperate USA testers (B73 and MO17)Inbred line
Code
Current RSA HG Abbreviated Pedigree Genetic distance with testers
B73 MO17 CML444 CML312
B1138T F TEKO YELLOW 0.822 0.908 0.545 0.547
BO394Y F F2834T.4O2 0.976 1.085 0.640 0.647
E30Y F B390YxM136Y 0.932 1.038 0.588 0.595
RO544W F BO160W.3J400W 0.905 1.005 0.609 0.609
UO705Y F YOFE1(S4) 0.890 0.983 0.546 0.553
V0430Y F (HO466Y.1BO310Y) 0.885 0.990 0.575 0.577
I-16 I I-16 0.880 0.975 0.577 0.555
I-34 I I-34 0.909 1.007 0.594 0.575
I-39 I I-39 1.033 1.139 0.733 0.712
I-41 I I-41 1.011 1.109 0.708 0.688
I-42 I I-42 1.029 1.134 0.729 0.709
K64 K Pride of Saline 0.814 0.874 0.614 0.613
K64R.22 K K64R-22 0.849 0.935 0.569 0.572
R2565Y K K64R2(I137TN1.K64R) 0.790 0.823 0.779 0.794
U127Y K M162W.1KO326Y 0.832 0.923 0.516 0.521
U2540W K M162W1.DO940Y-J34 0.834 0.908 0.554 0.565
MO17HtHtN L MO17HtHtN 0.826 0.922 0.564 0.569
NC258 L NC258 0.943 1.048 0.614 0.604
P588MSV L MRSxVHMO17 0.838 0.925 0.555 0.558
P590MSV L MRSxVHMO17 0.774 0.889 0.713 0.701
P594MSV L MLSxVHMO17 0.778 0.893 0.709 0.698
P598MSV L 21A-6xVHMO17 0.678 0.799 0.621 0.613
J80W M D800W2.HtN 1.083 1.191 0.796 0.798
RO421W M DO940Y-11.O2(W) 0.811 0.831 0.768 0.764
RO452W M DO940Y-13.NHK 1.044 1.147 0.798 0.797
SO503W M KO315Y2.NPPES1 1.036 1.136 0.790 0.788
VO617Y M (1)"M37W.TE/TEO" 1.013 1.125 0.724 0.723
S0181Y M KO326Y2.NPPES1 0.919 1.020 0.619 0.620
FO215W P NPPES14.O2S14 0.956 1.061 0.617 0.625
SO607W P POWS1(S4) 0.874 0.978 0.593 0.587
SO713W P POWS1(S4) 0.852 0.927 0.633 0.634
V0495Y P POWS12.Y 0.812 0.893 0.584 0.587
VO500Y P POWS12.Y 0.910 1.012 0.603 0.600
V0501Y P POWS12.Y 0.904 1.012 0.590 0.586
P28 R P28 0.912 0.967 0.714 0.742
P612MSV R B73xVHKG/C1 0.878 0.962 0.613 0.631
P614MSV R B73xVHKG/C1 0.949 1.008 0.730 0.758
S198Y R M28Y1.DO620Y 0.902 1.000 0.658 0.654
SO1224Y R M28Y1.KO288Y 1.036 1.142 0.745 0.751
U71Y R M28Y2.NP 0.930 1.005 0.671 0.698

Page 7/16
Inbred line
Code
Current RSA HG Abbreviated Pedigree Genetic distance with testers
B73 MO17 CML444 CML312
Average 0.901 0.993 0.647 0.648
Min 0.678 0.799 0.516 0.521
Max 1.083 1.191 0.798 0.798
There were generally large average genetic distances between lines within clusters, ranging from 0.31 to 0.58 (Table 3). The minimum distance was betweenthe temperate inbred lines in cluster 1, whereas the maximum was in clusters 3 and 6. The distance between lines within cluster 11 showed the widest range(0.17 to 0.70). The average genetic distance between clusters ranged from 0.70 to 0.86. The minimum genetic distance was recorded between clusters 6 and 8and clusters 8 and 9; while the maximum genetic distance was between clusters 1 and 12 (Table 3).
Table 3Average genetic distances (GD) between maize germplasm clusters and within clusters
Cluster 1 2 3 4 5 6 7 8 9 10a 10b 11 Average GD between lines withinclusters
GD Range
within acluster
1 - 0.31
2 0.83 - Singleton
3 0.84 0.81 - 0.54 0.45–1.06
4 0.79 0.76 0.78 - Singleton
5 0.80 0.77 0.78 0.73 - 0.40 0.07–0.51
6 0.79 0.75 0.77 0.72 0.73 - 0.54
7 0.85 0.81 0.83 0.78 0.79 0.77 - 0.42 0.05–0.59
8 0.78 0.74 0.76 0.71 0.72 0.70 0.76 - 0.51 0.49–0.52
9 0.79 0.75 0.77 0.72 0.73 0.71 0.77 0.70 - Singleton
10a 0.82 0.79 0.80 0.76 0.76 0.75 0.81 0.74 0.75 - 0.45 0.31–0.58
10b 0.81 0.78 0.79 0.74 0.75 0.74 0.80 0.73 0.74 0.77 - 0.48 0.38–0.54
11 0.86 0.83 0.84 0.79 0.80 0.79 0.85 0.78 0.79 0.82 0.81 0.48 0.17–0.70
The average distances among the current South African heterotic groups and among tester lines are shown in Table 4. The average genetic distance betweenthe South Africa heterotic groups ranged from 0.74 (L and K) to 0.86 (I and M as well as M and R). The average genetic distance between the South Africaheterotic groups and the tester maize inbred lines was the highest (0.97) between group R and temperate testers, while the minimum genetic distance (0.59)was between heterotic group F and the tropical testers. The distance between testers was generally large, ranging from 0.31 for B73 and MO17 to 0.91 forMO17 and CML444 (Table 4).
Table 4Average genetic distances between current South African heterotic groups and between testers
HG F I K L M P R B73 MO17 CML444 CML312
F -
I 0.80 -
K 0.75 0.79 -
L 0.76 0.79 0.74 -
M 0.83 0.86 0.81 0.82 -
P 0.77 0.80 0.75 0.76 0.83 -
R 0.80 0.84 0.78 0.79 0.86 0.80 -
B73 0.90 0.97 0.82 0.81 0.98 0.88 0.93 -
MO17 1.00 1.07 0.89 0.91 1.08 0.98 1.01 0.31 -
CML444 0.58 0.67 0.61 0.63 0.75 0.60 0.69 0.83 0.91 -
CML312 0.59 0.65 0.61 0.62 0.75 0.60 0.71 0.81 0.90 0.49 -
The analysis of variance results of yield in 2014/15 and 2015/16 are presented in Table 5. During the 2014/15 season, the mean squares associated with thesites main effects was highly signi�cant (P < 0.001) for grain yield. The results also showed signi�cant differences due to lines main effects (P < 0.05) andtesters main effects (P < 0.001). Although the genotype x site interaction effects were not signi�cant (P > 0.05), the site main effects and tester interaction

Page 8/16
effects were highly signi�cant (P < 0.001) for grain yield data. The mean squares associated with the line x tester interaction effects was not signi�cant (P > 0.05) for grain yield, and site x line and site x line x tester interaction effects were not signi�cant (P > 0.05). There were no signi�cant differences between sitesmain effects, testers main effects and tester x sites interaction effects, during the 2015/16 season (Table 5). However, the mean squares associated withgenotypes, lines main effects and the interaction between sites x lines were highly signi�cant (P < 0.001) for grain yield, during the 2015/16 season. Theinteractions between lines x testers, sites x genotypes were also signi�cant (P < 0.01) during the 2015/16 season. The mean squares associated with site x linex tester interaction effects was also signi�cant (P < 0.05). The results indicated the presence of su�cient variability among the lines to be classi�ed intoheterotic groups.
Table 5Analysis of variance of maize hybrids for grain yield at two sites in each of the 2014/15 and 2015/16 summer
season, in South AfricaSource DF MS DF MS
2014/15 2015/16
Site 1 35.81*** 1 0.09
Rep(site) 2 5.03 2 10.24
Genotypes 41 4.90** 71 5.71***
Line 13 5.22* 17 7.61***
Tester 2! 26.85*** 3 0.32
Line × tester 26 3.05 51 5.40**
Site × genotypes 41 3.28 71 5.20**
Site × line 13 3.15 17 7.93***
Site × tester 2 29.06*** 3 2.81
Site × line × tester 26 1.36 51 4.44*
Residuals 82 2.38 142 3.09
***, **, * Data signi�cant at P < 0.001, 0.01 and 0.05, respectively; DF - degree of freedom;! Testers excluding MO17.
Heterotic grouping of lines based on SCA effectsClassi�cation of 26 South African maize inbred lines in accordance with their speci�c combining ability effects with tropical testers is shown in Table 6.Heterotic classi�cation of South Africa maize inbred lines based on their SCA with the tropical CIMMYT maize inbred testers indicated that 10 maize inbredlines were oriented towards CML312 and were �tted in heterotic Group A, 12 inbred lines with negative SCA with CML444 were placed in Group B; while twoinbred lines which exhibited positive SCA with both tropical testers were classi�ed as heterotic Group AB. Only two lines, which displayed negative SCA effectswith both tropical testers, were not classi�ed on the basis of SCA data. The results indicated a weak correlation (r < 0.30) between genetic distance with bothgrain yield mean and speci�c combining ability data of the testcrosses of South Africa lines with tropical inbred testers (Table 6).

Page 9/16
Table 6Heterotic orientation of 26 South Africa maize inbred lines towards tropical maize inbred testers based on SCA data
No. Line HG SCA
(t ha− 1)
Orientation Genetic distance Testcross mean yield
(t ha− 1)
CML312 (A) CML444 (B) CML312 CML444 CML312 CML444
1 B1138T F 0.88 -1.47* B 0.547 0.545 6.65 4.26
2 E30Y F 0.90 -0.82 B 0.595 0.588 6.91 5.34
3 RO544W F 2.05* -1.3 B 0.609 0.609 7.72 4.51
4 I-16 I -0.10 1.58 A 0.555 0.577 5.98 7.82
5 I-42 I -0.20 0.75 A 0.709 0.729 4.96 6.05
6 I-39 I -1.04 1.12 A 0.712 0.733 5.84 7.96
7 K64 K -0.98 0.87 A 0.613 0.614 5.52 7.32
8 K64R-22 K -0.15 0.89 A 0.572 0.569 5.42 6.41
9 M162W K -2.32* 0.72 A 3.39 6.57
10 U127Y K 0.18 -0.68 B 0.521 0.516 4.86 4.14
11 U2540W K 0.02 -0.15 B 0.565 0.554 5.92 5.90
12 MO17HtHtN L 0.69 -1.16 B 0.569 0.564 6.06 4.35
13 P594MSV L -0.75 0.01 A 0.698 0.709 5.82 6.53
14 J80W M -0.55 0.96 A 0.798 0.796 4.58 6.23
15 RO421W M -1.90* -0.76 - 0.764 0.768 5.76 7.05
16 RO452W M 0.22 -0.17 B 0.797 0.798 5.92 5.67
17 SO181Y M 0.80 -0.77 B 0.620 0.619 6.76 5.34
18 FO215W P -0.78 3.01** A 0.625 0.617 6.19 10.13
19 VO495Y P 1.40 -0.29 B 0.587 0.584 7.58 6.04
20 SO713W P 0.23 -1.14 B 0.634 0.633 7.26 5.83
21 VO500Y P 0.20 0.05 AB 0.600 0.603 6.56 6.37
22 P614MSV R 1.40 -0.83 B 0.758 0.73 7.16 5.08
23 S198Y R -0.29 -0.47 - 0.654 0.658 5.92 5.89
24 U71Y R -0.20 0.83 A 0.698 0.671 6.20 7.38
25 SO1224Y R 0.44 -0.14 B 0.751 0.745 6.21 5.59
26 P612MSV R 1.11 0.21 AB 0.631 0.613 7.35 6.41
Correlation with GD -0.26 0.10 - -0.13 0.16
*Signi�cant at P < 0.05; SCA, Speci�c combining ability; GD, Genetic distance; SCASE (P < 0.05) = 0.98
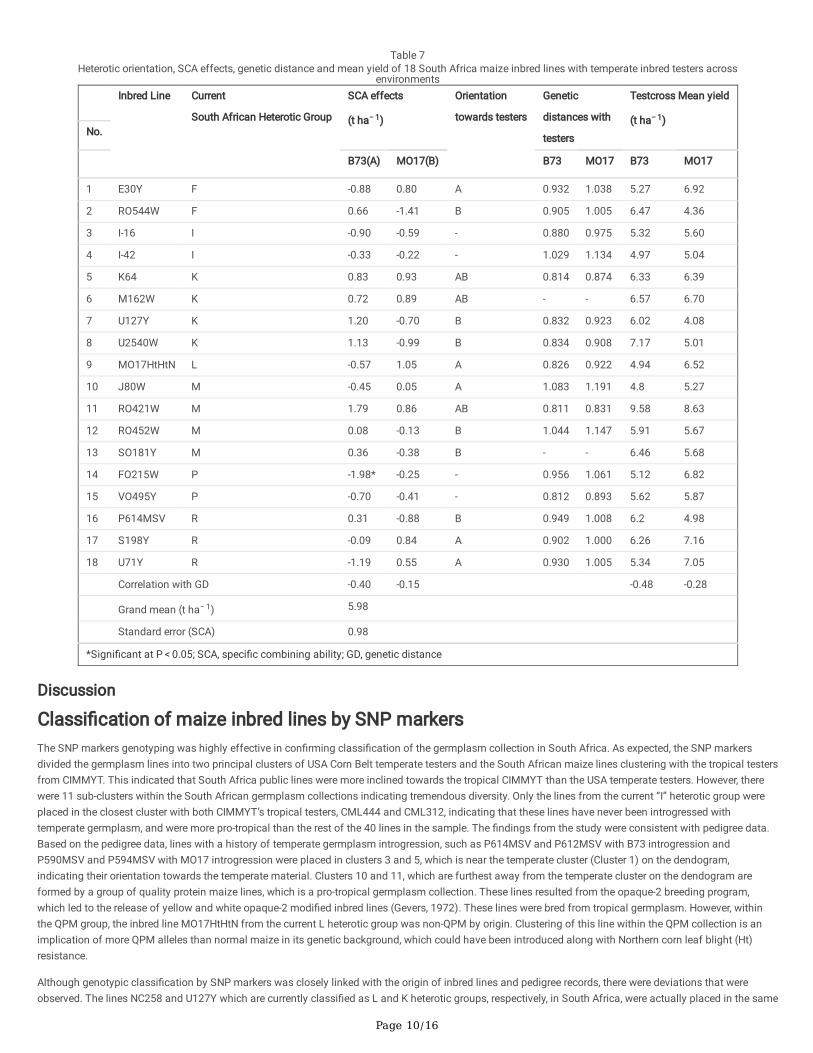
Heterotic orientation of 18 South Africa maize inbred lines on the basis of their SCA effects with temperate USA corn-belt testers is shown in Table 7. Fiveinbred lines which showed negative SCA with B73 were �tted into heterotic group A, while six inbred lines, which showed negative SCA with MO17, were put inGroup B. Three inbred lines, which exhibited positive SCA with both temperate testers, were allocated to the Group AB. Four maize inbred lines, which showednegative SCA with both temperate testers, could not be �tted into any of the heterotic groups on the basis of SCA data.
Page 10/16
Table 7Heterotic orientation, SCA effects, genetic distance and mean yield of 18 South Africa maize inbred lines with temperate inbred testers across
environments
Inbred Line Current
South African Heterotic Group
SCA effects
(t ha− 1)
Orientation
towards testers
Genetic
distances with
testers
Testcross Mean yield
(t ha− 1)No.
B73(A) MO17(B) B73 MO17 B73 MO17
1 E30Y F -0.88 0.80 A 0.932 1.038 5.27 6.92
2 RO544W F 0.66 -1.41 B 0.905 1.005 6.47 4.36
3 I-16 I -0.90 -0.59 - 0.880 0.975 5.32 5.60
4 I-42 I -0.33 -0.22 - 1.029 1.134 4.97 5.04
5 K64 K 0.83 0.93 AB 0.814 0.874 6.33 6.39
6 M162W K 0.72 0.89 AB - - 6.57 6.70
7 U127Y K 1.20 -0.70 B 0.832 0.923 6.02 4.08
8 U2540W K 1.13 -0.99 B 0.834 0.908 7.17 5.01
9 MO17HtHtN L -0.57 1.05 A 0.826 0.922 4.94 6.52
10 J80W M -0.45 0.05 A 1.083 1.191 4.8 5.27
11 RO421W M 1.79 0.86 AB 0.811 0.831 9.58 8.63
12 RO452W M 0.08 -0.13 B 1.044 1.147 5.91 5.67
13 SO181Y M 0.36 -0.38 B - - 6.46 5.68
14 FO215W P -1.98* -0.25 - 0.956 1.061 5.12 6.82
15 VO495Y P -0.70 -0.41 - 0.812 0.893 5.62 5.87
16 P614MSV R 0.31 -0.88 B 0.949 1.008 6.2 4.98
17 S198Y R -0.09 0.84 A 0.902 1.000 6.26 7.16
18 U71Y R -1.19 0.55 A 0.930 1.005 5.34 7.05
Correlation with GD -0.40 -0.15 -0.48 -0.28
Grand mean (t ha− 1) 5.98
Standard error (SCA) 0.98
*Signi�cant at P < 0.05; SCA, speci�c combining ability; GD, genetic distance
Discussion
Classi�cation of maize inbred lines by SNP markersThe SNP markers genotyping was highly effective in con�rming classi�cation of the germplasm collection in South Africa. As expected, the SNP markersdivided the germplasm lines into two principal clusters of USA Corn Belt temperate testers and the South African maize lines clustering with the tropical testersfrom CIMMYT. This indicated that South Africa public lines were more inclined towards the tropical CIMMYT than the USA temperate testers. However, therewere 11 sub-clusters within the South African germplasm collections indicating tremendous diversity. Only the lines from the current “I” heterotic group wereplaced in the closest cluster with both CIMMYT’s tropical testers, CML444 and CML312, indicating that these lines have never been introgressed withtemperate germplasm, and were more pro-tropical than the rest of the 40 lines in the sample. The �ndings from the study were consistent with pedigree data.Based on the pedigree data, lines with a history of temperate germplasm introgression, such as P614MSV and P612MSV with B73 introgression andP590MSV and P594MSV with MO17 introgression were placed in clusters 3 and 5, which is near the temperate cluster (Cluster 1) on the dendogram,indicating their orientation towards the temperate material. Clusters 10 and 11, which are furthest away from the temperate cluster on the dendogram areformed by a group of quality protein maize lines, which is a pro-tropical germplasm collection. These lines resulted from the opaque-2 breeding program,which led to the release of yellow and white opaque-2 modi�ed inbred lines (Gevers, 1972). These lines were bred from tropical germplasm. However, withinthe QPM group, the inbred line MO17HtHtN from the current L heterotic group was non-QPM by origin. Clustering of this line within the QPM collection is animplication of more QPM alleles than normal maize in its genetic background, which could have been introduced along with Northern corn leaf blight (Ht)resistance.
Although genotypic classi�cation by SNP markers was closely linked with the origin of inbred lines and pedigree records, there were deviations that wereobserved. The lines NC258 and U127Y which are currently classi�ed as L and K heterotic groups, respectively, in South Africa, were actually placed in the same

Page 11/16
sub-cluster with the I and CIMMYT’s tropical testers, respectively. This indicates that the classi�cation of South African lines in the whole collection mightrequire con�rmation with SNP genotyping. In the same vein, lines RO421W (M), K64 (K) and U2540W (K) which were expected to cluster with the current M andK heterotic groups of South Africa, formed singleton clusters, and were not associated with any of the South African lines. They have also displayed a lack ofassociation with the USA temperate and tropical CIMMYT lines, qualifying them as representing distinct germplasm groups within the South African inbredlines collection.
Classi�cation based on Speci�c combining abilityBased on speci�c combining ability effects for yield data, inbred lines were grouped into three heterotic groups by both temperate and tropical testers, whichwas consistent with the system that was described by previous researchers. The SCA value reveals the genetic relationship between two parents or between aline and a tester (Vasal et al., 1992). High SCA value (positive) between two parents indicates a distant relationship and low (negative SCA) value is anindication of close relationship (Fan et al., 2003). The tropical testers were capable of discriminating the lines, such that six lines were allocated into tropicalgroup A, indicating that they were oriented towards CML312, whereas nine lines placed into tropical group B indicating their orientation towards CML444. Onlythree lines which showed negative SCA with both tropical testers could not be classi�ed on the basis of SCA data. The classi�cation of the South Africa linesusing their interaction (SCA effects) with the temperate testers allocated �ve lines into temperate group A, indicating that they were B73-orientated; while sixlines were placed in temperate group B indicating that they were orientated towards MO17. Three lines, which exhibited positive SCA with both B73 and MO17,were classi�ed as temperate AB group on the basis of SCA data; while four lines, which displayed negative SCA effects with both temperate testers, could notbe classi�ed.
Relationship between SNP and SCA-based classi�cationHeterotic orientation of inbred lines under non-stress environments corresponded with the SNP marker classi�cation. It was noted that lines that did notbelong to any heterotic group when tropical testers were used could be classi�ed clearly using temperate testers and vice versa. For example, in SNP clusteranalysis, the I-group representatives were more aligned to both tropical testers. However, heterotic orientation by temperate testers did not classify them intoany heterotic group, as revealed by negative SCA effects with both B73 and MO17. The grouping of the I-group lines with only tropical testers was anindication of a distant relationship between the I heterotic group and the temperate lines. This was further supported by the maximum average geneticdistance between the I-group and both temperate testers, B73 (0.97) and MO17 (1.07). Therefore, delineation of inbred lines by either temperate or tropicallines is in�uenced by the predominance of either temperate or tropical genome in their genetic background, which was clearly con�rmed by the SNPs markerdata. Findings from this study are consistent with previous reports. Adetimirin et al. (2008) also observed that markers clearly discriminated temperate fromtropical germplasm. They further observed that some lines that were known to be temperate x tropical were aligned with the tropical lines, indicating that theywere more closely related to the tropical than temperate material. In this study, some lines were consistent in their heterotic orientation by both USA temperateand CIMMYT tropical lines. However, the strongest relationship towards either temperate or tropical lines was observed from the magnitude of SCA effectsand their placement in the dendogram.
There are inbred lines including RO421W, K64 and U254OW that formed distinct singleton clusters. Use of the SCA heterotic orientation approach did notclearly classify these lines. For example, RO421W did not belong to any heterotic group under tropical classi�cation, while classi�cation based on temperatetesters allocated this line into heterotic the temperate group AB. The inbred line K64 was assigned into temperate AB group by temperate testers and intoheterotic tropical group A by tropical testers.
Grouping lines by SCA effects therefore revealed that when inbred lines are classi�ed into heterotic groups using two sets of testers, failure of one set oftesters to classify lines could be an indication of distant relationship between a line and a particular set of testers. Alternatively, classi�cation of some linesmight not be clear with both sets, such lines could represent distinct germplasm groups within the germplasm collection. Therefore, when the molecular datais not available for validation, there should be no preference for any set of testers over another. However, inclusion of two sets of testers could be a moreaccurate approach, especially in distinguishing germplasm like the South African collection with a history of both tropical and temperate introgression.
The inbred lines used in the study were pooled from seven known South African heterotic groups to minimise the number of heterotic groups for improvedbreeding e�ciency. The 11 clusters obtained could be simpli�ed into a broader group of normal endosperm maize and quality protein maize lines. Normalmaize endosperm lines may be grouped into three groups, with one group forming temperate germplasm (clusters 1 and 3) with pro-MO17 and B73. Thesecond group is a group of South African lines in clusters �ve and six, with no temperate or tropical alignment, while the I-group lines and those lines withtropical alignment formed the third group. The QPM lines on the far right of the dendogram could be split into two groups (clusters 10 and 11). Intra-groupcombinations among the normal maize groups and between the QPM groups are expected to give high heterosis in crosses. Cross combinations betweennormal maize and some lines in the QPM group, particularly the white versions are also recommended to maximise heterosis. The heterotic potential of thesegroups was shown by a cross between FO215W from the QPM cluster and the tropical tester, CML444 (data not presented). Lines that represented distinctgermplasm should also be considered for utilisation in crosses; for example in the current study, high heterosis was revealed by crosses RO421W x B73 andRO421W x MO17. Previous investigations revealed high heterosis in crosses including F and I, M and K, K and P, M and P and crosses between M and F and Rand L group combinations (Gevers and Whythe, 1987). Based on the new clusters formed, these combinations also included temperate x tropical lines. Theidenti�ed groups will likely result in superior tropical × temperate combinations with new favourable alleles, wider genetic base, and consequentlyimprovement in agronomic performance and adaptation of local varieties.
From the current seven heterotic groups of South Africa studied, some groups clearly clustered into the identi�ed clusters. The study therefore indicated thatthe established patterns would be bene�cial in inferring the classi�cation of lines that were not included in the study, but represented in the seven heteroticgroups. The F, P and M group lines and the rest of the Opaque-2 modi�ed lines from other South African heterotic groups belong to the QPM group. Lines fromthe L- group form a distinct group of normal maize endosperm lines; the I-group lines form a distinct group closest to the CIMMYT lines, while the temperategroup include the R lines and K-group lines with a normal maize endosperm type. However, classi�cation of some South African heterotic groups, particularly

Page 12/16
the K-group lines may not be straightforward as lines from this group were distributed in different clusters. Such deviations may be an indication of thepresence of diversity within the K-group; this also suggests that inbred lines extracted from the same population do not always cluster together. This was alsoobserved in many previous investigations (Vasal et al., 1992; Yu et al., 2001; Fan et al., 2003; Barata and Carena, 2006) that reported that maize inbred lineswhich were derived from the same population classi�ed differently.
Genetic distancesGenetic distances summarise the extent of genetic differences between populations or species (Dogan and Dogan, 2016). Genetic distances were estimated todetermine the relatedness among inbred lines studied. The average genetic distances computed between clusters, South African heterotic groups, inbred lineswithin clusters and among tester inbred lines indicated the presence of su�cient variability between the identi�ed clusters and therefore the possibility ofobtaining superior hybrid combinations from inter-cluster crosses. The average genetic distances between lines within clusters clearly indicated that lines thatformed the same cluster were genetically related by distance, as the average genetic distance ranged from 0.31 to 0.58 between clusters. However, for someclusters, the genetic distance range of inbred lines showed a considerable diversity within a cluster. For example, the genetic distance in cluster 11 rangedfrom 0.17 to 0.70. This therefore showed that the collection of QPM lines that formed cluster 11 were derived from distinct genetic backgrounds. Themaximum average genetic distance between clusters 1 and 11, further demonstrated the reliability of SNP markers in distinguishing between inbred lines.Genetic distances between testers clearly revealed that both temperate USA Corn-belt testers, MO17 and B73, are closely related which re�ected theirtemperate adaptation domain. The closest relationship was further con�rmed by the grouping together of these inbred testers on the dendogram. Similarly, theclose genetic relationship between tropical CIMMYT testers, CML312 and CML444, was con�rmed by the minimum genetic distance between them, and theirplacement within the same cluster, indicating their tropical adaptation domain.
The genetic differences among the current South African heterotic groups were generally large, indicating the presence of diversity within the South Africangermplasm collection. The largest genetic distance was between group R and M, and I and M, indicating genetic dissimilarity between these South Africanheterotic groups. The R group lines were grouped in cluster 3, with temperate alignment, whereas the M group lines were mainly grouped along with the QPMlines in cluster 11; the M group also showed the highest genetic dissimilarity with the I group. Inbred lines from heterotic Group I formed a distinct group incluster 7, that was closest to the tropical testers, and were thus not closely associated with the M-group lines. The highest average genetic distance betweenthese heterotic crops thus indicated that they are the most distinct heterotic groups within the seven South African heterotic groups. The minimum distancebetween the South African heterotic groups K and L was an indication of genetic similarity. Although these groups did not cluster together, their placement bythe SNP markers in closest clusters, for example allocation of the K lines in clusters 3 and 4 and the L-group lines in cluster 5, could be an explanation of theminimum genetic distance estimates between them. Overall, the average genetic distance was generally large between South Africa inbred lines andtemperate testers than with the tropical testers, indicating that although some lines may be aligned towards temperate than tropical testers, the lines are ofSouth Africa origin and were closer to the tropical testers. This is expected because South Africa falls within the subtropical to a warm temperate environment,which places its germplasm between tropical and temperate although with a bias placement towards tropical orientation.
Correlation of genetic distance with grain yield and speci�c combining abilityThere were low correlations detected between genetic distance with grain yield mean and speci�c combining ability data, indicating that hybrid performancecould not be e�ciently predicted using molecular marker-based genetic distances. The low predictive value of genetic distance was also con�rmed by thedegree of heterosis observed in crosses (data not shown). For example, a pair of lines that showed the widest range of genetic distances did not necessarilyshow maximum heterosis in their testcrosses. These observations are in agreement with previous studies where poor (Makumbi, 2005; Parentoni et al., 2001;Xu et al., 2004) to no (Rajendran et al., 2014) correlation was demonstrated between genetic distance with grain yield and SCA. The low correlation observedin several studies has been associated with the markers used to compute genetic distances. The markers used are generally many, evenly distributed on thegenome, and may not be closely linked to grain yield and associated quantitative characters (Melchinger, 1999). This therefore reduces the associationbetween genetic distances and heterosis. Furthermore, the genetic differences between parents are due to many traits and loci which may not all be correlatedwith yield. Zhang et al. (2010) thus suggested the use of only yield-related markers to analyse genetic differences, and subsequently to reliably predict hybridperformance.
In sharp contrast to �ndings in the current study, Schrag et al. (2010) and Gichuru et al. (2017) reported high predictive value of molecular maker geneticdistances in heterosis; the observed degree of correlation was associated with the genetic differences and complementary traits of lines used. The ability ofgenetic distance to predict heterosis in crosses therefore varies with germplasm used (Betran et al., 2003) and probably the set of molecular markers used. Inthe current study, the observed levels of correlations therefore underlines the need for conducting �eld trials to evaluate hybrid performance, irrespective ofknown genetic distances between inbred lines. However, despite the inability of genetic distances to reliably predict hybrid performance, their usefulness as aguide during selection of inbred lines for hybrid make-ups is underscored.
ConclusionThe study con�rmed existence of high level of genetic diversity among the South Africa line collection. These lines have shown alignment towards bothtropical and temperate testers. However, they were more inclined towards the tropical than temperate testers. The SNP markers genotyping was highlyeffective in con�rming classi�cation of the germplasm collection in South Africa. On the basis of SNP genotyping data the germplasm could be simpli�ed intotwo broader groups, which are consistent with biochemical composition of the grain endosperm type. The �rst group comprised quality protein maize (QPM)lines and the second group is normal endosperm type of maize inbred lines. However, there are further sub-divisions within these broad germplasm groupsindicating that the program in South Africa has maintained the diversity in both quality protein and normal endosperm maize germplasm. The SNP data wascomplemented by SCA data which grouped the germplasm into three heterotic groups (A, B and AB), indicating that South Africa germplasm lines have

Page 13/16
orientation towards both tropical and temperate testers, and that some lines showed heterosis with both testers within the two broad adaptation groups.These �ndings have profound implications for optimising breeding programmes that target the warm temperate production environments in South Africa.
Declarations
CONFLICT OF INTERESTThe authors have no con�ict of interest.
ACKNOWLEDGEMENTThe maize germplasm used in the study were provided by the Agricultural Research Council (ARC) of South Africa and the International Maize ImprovementCenter (CIMMYT). We are indeed grateful for support which was provided by the Agricultural Research Council through postgraduate funding of the seniorauthor and use of its SNP genotyping platform, in Pretoria.
ReferencesAdetimirin, V.O., I. Vroh-Bi, C. The, A. Menkir, S.E. Mitchell, and S. Kresovich. 2008. Diversity analysis of elite maize inbred lines adapted to West and Centralafrica using SSR markers. Maydica 53: 143-149.
Aguiar, C.G., I. Schuster, A.T. Amaral-Junior, C.A. Scapim, and E.S.N. Vieira. 2008. Heterotic groups in tropical maize germplasm by test crosses and simplesequence repeat markers. Genetics and Molecular Research 7: 1233-1244.
Aslam, M., F.S. Awan, I.A. Khan, and A.I. Khan. 2009. Estimation of genetic distance between 10 maize accessions with varying response to different levels ofsoil moisture. Genetics and Molecular Research 4: 1459-1465.
Badu-Apraku, B., M. Oyekunle, M.A.B. Fakorede, I. Vroh, R.O. Akinwale, and M. Aderounmu. 2013. Combining ability, heterotic patterns and genetic diversity ofextra-early yellow inbreds under contrasting environments. Euphytica 192: 413-433.
Badu-Apraku, B., M.A.B. Fakorede, M. Gedil, B. Annor, A.O. Talabi, I.C. Akaogu, M. Oyekunle, R.O. Akinwale, and T.Y. Fasanmade. 2016. Heterotic patterns of IITAand CIMMYT early-maturing yellow maize inbreds under contrasting environments. Agronomy Journal 108: 1321-1336.
Banziger, M., G.O. Edmeades, D. Beck, and M. Bellon. 2000. Breeding for drought and Nitrogen stress tolerance in maize: From theory to practice. CIMMYT,Mexico, D.F.
Barata, C., and M. Carena. 2006. Classi�cation of North Dakota maize inbred lines into heterotic groups based on molecular and testcross data. Euphytica 51:339-349.
Betran, F.J., J.M. Ribaut, D. Beck, and D.G. de Leon. 2003. Genetic diversity speci�c combining ability and heterosis in tropical maize under stress andnonstress environments. Crop Science 43: 797-806.
Bidhendi, M.Z., R. Choukan, F. Darvish, K. Mostafavi, and E. Majidi. 2012. Classifying of maize inbred lines into heterotic groups using diallel analysis. WorldAcademy of Science, Engineering and Technology 6: 1161-1164.
CIMMYT. 2001. Maize inbred lines released by CIMMYT: A Compilation of 454 CIMMYT Maize Lines (CMLs), CML1-CML454, August 2001, Second draft.CIMMYT, Mexico, D.F.
DAFF. 2014. Maize market value chain pro�le. Department of Agriculture, Forestry and Fisheries, Directorate Plant Production. Pretoria, South Africa.http://www.nda.agric.za/doaDev/sideMenu/Marketing/Annual%20Publications/Commodity%20Pro�les/�eld%20crops/Maize%20Market%20value%20Chain%(Accessed 15/09/2016).
de Pinto, M.C.R., C.I. de Souza Jr, L.A. Carlini-Garcia, A.A.F. Garcia, and A.P. de Souza. 2003. Comparison between molecular markers and diallel crosses in theassignment of maize lines to heterotic groups. Maydica 48: 63-73.
Delucchi, C., G. Eyherabide, R.D. Lorea, D.A. Presello, M.E. Otegui, and C.G. Lopez. 2012. Classi�cation of Argentina maize landraces in heterotic groups.Maydica 57: 26-33.
Derera, J., and T.R. Musimwa. 2015. Why SR52 is such a great maize hybrid? I. Heterosis and generation mean analysis. Euphytica 205: 121-135.
Dhliwayo, T., K. Pixley, A. Menkir, and M. Warburton. 2009. Combining ability, genetic distances and heterosis among elite CIMMYT and IITA tropical maizeinbred lines. Crop science 49: 1201-1210.
Dogan, I., and N. Dogan. 2016. Genetic distance measures: Review. Turkiye Klinikleri Journal of Biostatistics 8: 87-93.
Doyle, J.J. 1987. A rapid DNA isolation procedure for small quantities of fresh leaf tissue. Phytochemical Bulletin 19: 11-15.

Page 14/16
Fan, X.M., H.M. Chen, J. Tan, C.X. Xu, Y.D. Zhang, L.M. Luo, Y.X. Huang, and M.S. Kang. 2008. Combining abilities for yield and yield components in maize.Maydica 53: 39-46.
Fan, X.M., J. Tan, H.M. Chen, and J.Y. Yang. 2003. Heterotic grouping for tropical and temperate maize inbreds by analysing combining ability and SSRmarkers. Maydica 48: 251-257.
Fan, X.M., J. Tan, J.Y. Yang, and H.M. Chen. 2004. Combining ability and heterotic grouping of ten temperate subtropical and tropical quality protein maizeinbreds. Maydica 49: 267–272.
Fan, X.M., Y.D. Zhang, L. Liu, H.M. Chen, W.H. Yao, M. Kang, and J.Y. Yang. 2010. Screening tropical germplasm by temperate inbred testers. Maydica 55: 55-63.
Fan, X.M., Y.D. Zhang, W.H. Yao, Y.Q. Bi, L. Liu, H.M. Chen, and M.S. Kang. 2014. Reciprocal diallel crosses impact combining ability, variance estimation, andheterotic group classi�cation. Crop Science 54: 89–97.
Fan, X.M., Y.M. Zhang, W.H. Yao, H.M. Chen, J. Tan, C.X. Xu, X.L. Han, L.M. Luo, and M.S. Kang. 2009. Classifying maize inbred lines into heterotic groupsusing a factorial mating design. Agronomy Journal 101: 106–112.
Fasahat, P., A. Rajabi, J.M. Rad, and J. Derera. 2016. Principles and utilization of combining ability in plant breeding. Biometrics & Biostatistics InternationalJournal 4: 1-24.
Fourie, A.P., and H.O. Gevers. 1987. Adaptation patterns in crosses between South African and US Corn Belt maize breeding material. pp 17-21. In: Fourie, A.P.,and J.D. Duplessis (eds.). Proceedings of the seventh South African maize breeding Symposium, 1986. Summer Grain Centre, Grain Crops Research Institute,Potchefstroom.
Gerdes, J.T., C.F. Behr, J.G. Coors, and W.F. Tracy. 1993. Compilation of North American Breeding Germplasm. In: W. F. Tracy, J. G. Coors and J. L. Geadelmann(eds.). Crop Science Society of America, Madison, USA.
Gevers, H.O. 1972. Breeding for improved protein quality in maize. Transactions of the Royal Society of South Africa: 81-92.
Gevers, H.O. 1997. Patterns of heterosis in South Africa maize breeding. pp 102-103. In: Listman, M (ed.). Book of abstracts. The genetics and exploitation ofheterosis in crops. An international symposium, 17-22 August 1997. CIMMYT, Mexico, D.F.
Gevers, H.O., and I.V. Whythe. 1987. Patterns of heterosis in South African maize breeding material. pp 21-26. In: Fourie, A.P., and J.G. Duplessis (eds.).Proceedings of the Seventh South African Maize Breeding Symposium 1986. Summer Grain Centre, Grain Crops Research Institute, Potchefstroom.
Gevers, H.O., and J.K. Lake. 1998. The Natal maize breeding programme: 1948 -1993. pp 16 – 22. In: Gevers, H.O (ed.). Proceedings of eleventh South Africanmaize breeding symposium, 1994. Cedara Agricultural development Institute, Summer Grain Sub-Centre, Pietermaritzburg, KZN.
Gichuru, L., J. Derera, P. Tongoona, and M. Mwimali. 2017. Combining ability and molecular genetic distances in tropical maize lines for grain yield andagronomic traits. South African Journal of Plant and Soil 34: 175-183.
Gower, J.C. 1971. A general coe�cient of similarity and some of its properties. Biometrics 27: 857-874.
Kanyamasoro, M.G., J. Karung, G. Asea, and P. Gibson. 2012. Determination of the heterotic groups of maize inbred lines and the inheritance of their resistanceto the maize weevil. African Crop Science Journal 20: 99-104.
Li, M.S., X.H. Li, L.W. Deng, D.G. Zhang, L. Bai, and S.H. Zhang. 2007. Comparisons of four testers in evaluating 27 CIMMYT and Chinese maize populations.Maydica 52: 173-179.
Librando, R.P., and E.F. Magulama. 2008. Classifying white inbred lines into heterotic groups using yield combining ability effects. USM R & D A Journal 16: 99-103.
Makumbi, D. 2005. Phenotypic and genotypic characterization of white maize inbreds, hybrids and synthetics under stress and non-stress environments. PhDthesis. Texas A&M University.
Melani, M.D., and M.J. Carena. 2005. Alternative maize heterotic patterns for the Northern corn belt. Crop Science 45: 2186–2194.
Melchinger, A.E. 1999. Genetic diversity and heterosis. In: Coors, J.G. and S. Pandey (eds.). The genetics and exploitation of heterosis in crops. pp 99–118.American Society of Agronomy, Madison, Wisconsin.
Melchinger, A.E., and R.K. Gumber. 1998. Overview of heterosis and heterotic groups in agronomic crops. pp 29-44. In: K. R. Lamkey and J. E. Staub (eds.). Inconcepts and breeding of heterosis in crop plants. Madison, WI.
Menkir, A., A. Melake-Berhan, A.C. The, I. Ingelbrecht, and A. Adepoju. 2004. Grouping of tropical mid-altitude maize inbred lines on the basis of yield data andmolecular markers. Theoretical and Applied Genetics 108: 1582-1590.
Menkir, A., B. Badu-Apraku, C. The, and A. Adepoju. 2003. Evaluation of heterotic patterns of IITA's lowland white maize inbred lines. Maydica 48: 161-170.

Page 15/16
Musimwa, T.R., and J. Derera. 2017. Why SR52 is such a great maize hybrid? II. Heritability, correlation and path-coe�cient analyses. Euphytica 213: 1-14.
Mwimali, M.G. 2014. Genetic analysis and response to selection for resistance to two stem borers, Busseola fusca and Chilo partellus, in tropical maizegermplasm. PhD Thesis. University of KwaZulu-Natal, Pietermaritzburg.
Nyombayire, A., J. Derera, J. Sibiya, E. Gasura, and C. Ngaboyisonga. 2016. Genetic diversity among maize inbred lines selected for the midaltitudes andhighlands of Rwanda. Maydica 61: 1-7.
Olver, R.C. 1998. Maize breeding in Zimbabwe. pp 22-27. In: H. O. Geverseditor (eds.). Proceedings of Eleventh South African Maize Breeding Symposium,1994. Cedara Agricultural development Institute, Summer grain Sub-Centre, Pietermaritzburg, KZN.
Parentoni, S.N., J.V. Magalhaes, C.A.P. Pacheco, M.X. Santos, T. Abadie, E.E.G. Gama, P.E.O. Guimaraes, W.F. Meirelles, M.A. Lopes, M.J.V. Vasconcelos, and E.Paiva. 2001. Heterotic groups based on yield-speci�c combining ability data and phylogenetic relationship determined by RAPD markers for 28 tropical maizeopen pollinated varieties. Euphytica 121: 197–208.
Qi-Lun, Y., F. Ping, K. Ke-Cheng, and P.G. Tang. 2008. Genetic diversity based on SSR markers in maize (Zea mays L.) landraces from Wuling mountain regionin China. Journal of Genetics 87: 287-291.
Rajendran, A., A. Muthiah, J. Joel, P. Shanmugasundaram, and D. Raju. 2014. Heterotic grouping and patterning of quality protein maize inbreds based ongenetic and molecular marker studies. Turkish Journal of Biology 38: 10-20.
Reif, J.C., A.R. Hallauer, and A.E. Melchinger. 2005. Heterosis and heterotic patterns in maize. Maydica 50: 215-223.
Rodriguez, F., G. Alvarado, A. Pacheco, J. Crossa, and J. Burgue. 2015. “AGD-R (Analysis of Genetic Designs with R for Windows) Version 3.0”,http://hdl.handle.net/11529/10202 International Maize and Wheat Improvement Center [Distributor] V11 [Version].
RStudio Team (2015). RStudio: Integrated Development for R. RStudio, Inc., Boston, MA URL http://www.rstudio.com/.
Schrag, T.A., J. Mohring, A. Melchinger, B. Kusterer, B.S. Dhillon, H.P. Piepho, and M. Frisch. 2010. Prediction of hybrid performance in maize using molecularmarkers and joint analyses of hybrids and parental inbreds. Theoretical and applied genetics 120: 451-461.
Semagn, K., C. Magorokosho, B.S. Vivek, D. Makumbi, Y. Beyene, S. Mugo, B.M. Prasanna, and M.L. Warburton. 2012. Molecular characterization of diverseCIMMYT maize inbred lines from Eastern and Southern Africa using single nucleotide polymorphic markers. BMC Genomics 13: 1-13.
Sprague, G.F., and L.A. Tatum. 1942. General versus speci�c combining ability in single crosses of corn. American Society of Agronomy 34: 923-932.
Srdic, J., S.M. Drinic, Z. Pajic, and M. Filipovic. 2007. Characterisation of maize inbred lines based on molecular markers, heterosis and pedigree data.Genetica 39: 355-363.
Suwarno, W.B., K.V. Pixley, N. Palacios-Rojas, S.M. Kaeppler, and R. Babu. 2014. Formation of heterotic groups and understanding genetic effects in aprovitamin A bioforti�ed maize breeding program. Crop Science 54: 14-24.
Vasal, S.K., G. Srinivasan, S. Pandey, H.S. Cordova, G.C. Han, and C. Gonzalez. 1992. Heterotic patterns of ninety-two white tropical CIMMYT maize lines.Maydica 37: 259-270.
XU, S., J. Liu, and G.S. Liu. 2004. The use of SSRs for predicting the hybrid yield and yield heterosis in 15 key inbred lines of Chinese maize. Hereditas 141:207-215.
Yu, J., H. Lu, and R. Bernardo. 2001. Inconsistencies between SSR grouping and genetic background of white corn inbreds. Maydica 46: 133-139.
Zhang, T., X.L. Ni, K.F. Jiang, Q.H. Yang, L. Yang, X.Q. Wan, Y.J. Cao, and J. Zheng. 2010. Correlation between heterosis and genetic distance based onmolecular markers of functional genes in rice. Rice Science 17: 1-7.
Figures

Page 16/16
Figure 1
UPGMA dendogram based on the analysis of 40 maize inbred lines and four testers using the Gower’s distance (Gower, 1971)