
Towards Greener Households: Waste - Policy Highlights 2014
4
BETTER POLICIES FOR BETTER POLICY HIGHLIGHTS Towards greener households Waste
description
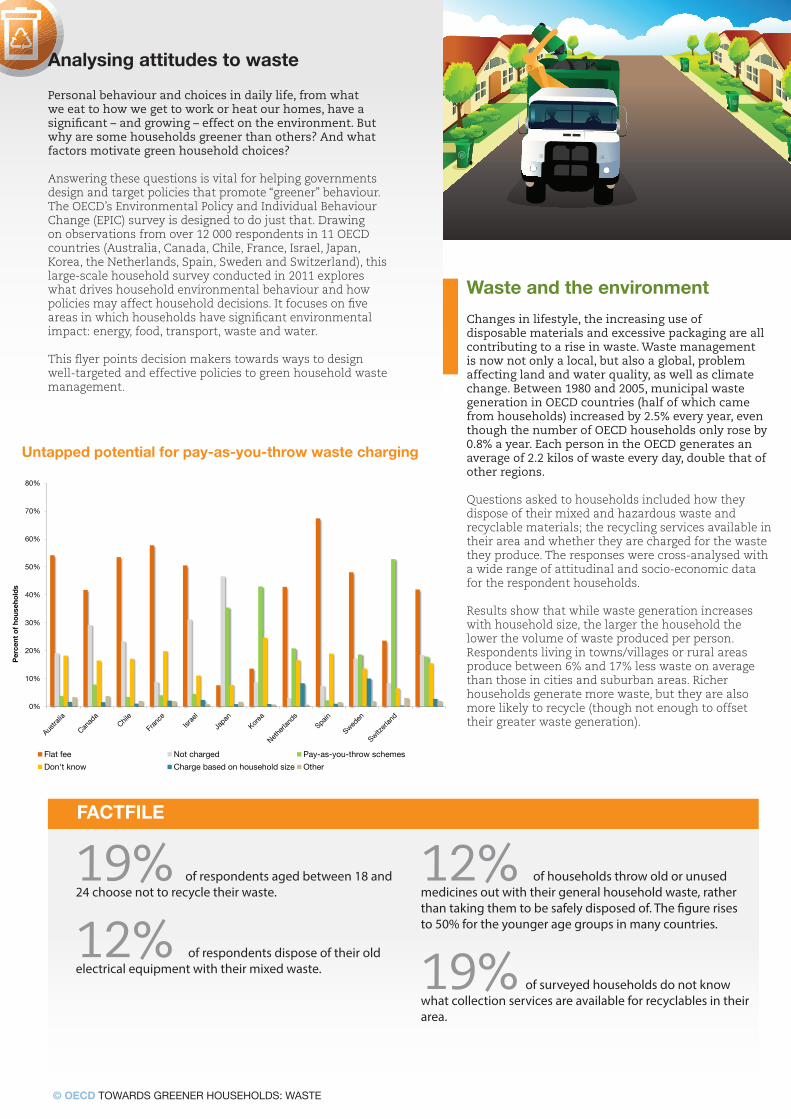
Changes in lifestyle, the increasing use of disposable materials and excessive packaging are all contributing to a rise in waste. Waste management is now not only a local, but also a global, problem affecting land and water quality, as well as climate change. Between 1980 and 2005, municipal waste generation in OECD countries (half of which came from households) increased by 2.5% every year, even though the number of OECD households only rose by 0.8% a year. Each person in the OECD generates an average of 2.2 kilos of waste every day, double that of other regions.
Transcript of Towards Greener Households: Waste - Policy Highlights 2014
BETTER POLICIES FOR BETTER
POLICY HIGHLIGHTS
Towards greener
households
Waste
© OECD TOWARDS GREENER HOUSEHOLDS: WASTE
Changes in lifestyle, the increasing use of disposable materials and excessive packaging are all contributing to a rise in waste. Waste management is now not only a local, but also a global, problem affecting land and water quality, as well as climate change. Between 1980 and 2005, municipal waste generation in OECD countries (half of which came from households) increased by 2.5% every year, even though the number of OECD households only rose by 0.8% a year. Each person in the OECD generates an average of 2.2 kilos of waste every day, double that of other regions.
Questions asked to households included how they dispose of their mixed and hazardous waste and recyclable materials; the recycling services available in their area and whether they are charged for the waste they produce. The responses were cross-analysed with a wide range of attitudinal and socio-economic data for the respondent households.
Results show that while waste generation increases with household size, the larger the household the lower the volume of waste produced per person. Respondents living in towns/villages or rural areas produce between 6% and 17% less waste on average than those in cities and suburban areas. Richer households generate more waste, but they are also more likely to recycle (though not enough to offset their greater waste generation).
Untapped potential for pay-as-you-throw waste charging
Waste and the environment
FACTFILE
19% of respondents aged between 18 and 24 choose not to recycle their waste.
12% of respondents dispose of their old electrical equipment with their mixed waste.
12% of households throw old or unused medicines out with their general household waste, rather than taking them to be safely disposed of. The figure rises to 50% for the younger age groups in many countries.
19% of surveyed households do not know what collection services are available for recyclables in their area.
Analysing attitudes to waste
Personal behaviour and choices in daily life, from what we eat to how we get to work or heat our homes, have a significant – and growing – effect on the environment. But why are some households greener than others? And what factors motivate green household choices?
Answering these questions is vital for helping governments design and target policies that promote “greener” behaviour. The OECD’s Environmental Policy and Individual Behaviour Change (EPIC) survey is designed to do just that. Drawing on observations from over 12 000 respondents in 11 OECD countries (Australia, Canada, Chile, France, Israel, Japan, Korea, the Netherlands, Spain, Sweden and Switzerland), this large-scale household survey conducted in 2011 explores what drives household environmental behaviour and how policies may affect household decisions. It focuses on five areas in which households have significant environmental impact: energy, food, transport, waste and water.
This flyer points decision makers towards ways to design well-targeted and effective policies to green household waste management.
0%
10%
20%
30%
40%
50%
60%
70%
80%
Per
cent
of
hous
eho
lds
Flat fee Not charged Pay-as-you-throw schemes
Don't know Charge based on household size Other
© OECD TOWARDS GREENER HOUSEHOLDS: WASTE
POLICY H
IGH
LIGH
TS
What determines green behaviour?
Waste charges. Households charged for the amount of waste they generate tend to throw out between 20% and 30% less than those charged a flat rate. Charging also encourages households to compost and to reduce packaging. A large majority of respondents indicated “collecting refunds or reducing waste charges” as a major motivation for recycling. Yet the potential of these “pay-as-you-throw” schemes remains largely unexploited (see figure above).
Convenience. The presence of recyclable material collection services reduces waste generation and increases the amount of sorting of recyclable waste done by households. In Canada, the Netherlands, Sweden and Switzerland, introducing door-to-door recycling collection seems to have helped reduce waste volumes by between 23 and 27%. Combining pay-as-you-throw (PAYT) waste charging with waste collection and door-to-door recycling collection could reduce mixed waste generation by as much as 50%.
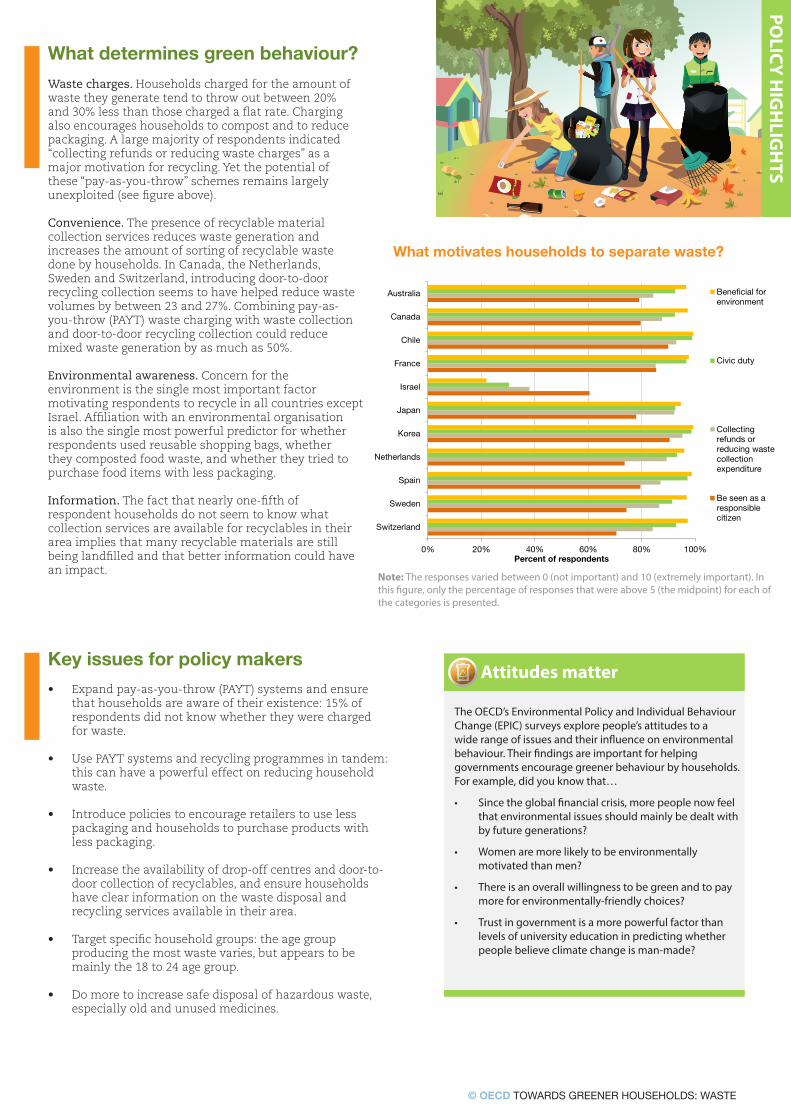
Environmental awareness. Concern for the environment is the single most important factor motivating respondents to recycle in all countries except Israel. Affiliation with an environmental organisation is also the single most powerful predictor for whether respondents used reusable shopping bags, whether they composted food waste, and whether they tried to purchase food items with less packaging.
Information. The fact that nearly one-fifth of respondent households do not seem to know what collection services are available for recyclables in their area implies that many recyclable materials are still being landfilled and that better information could have an impact.
Key issues for policy makers
• Expand pay-as-you-throw (PAYT) systems and ensure that households are aware of their existence: 15% of respondents did not know whether they were charged for waste.
• Use PAYT systems and recycling programmes in tandem: this can have a powerful effect on reducing household waste.
• Introduce policies to encourage retailers to use less packaging and households to purchase products with less packaging.
• Increase the availability of drop-off centres and door-to-door collection of recyclables, and ensure households have clear information on the waste disposal and recycling services available in their area.
• Target specific household groups: the age group producing the most waste varies, but appears to be mainly the 18 to 24 age group.
• Do more to increase safe disposal of hazardous waste, especially old and unused medicines.
Attitudes matter
The OECD’s Environmental Policy and Individual Behaviour Change (EPIC) surveys explore people’s attitudes to a wide range of issues and their influence on environmental behaviour. Their findings are important for helping governments encourage greener behaviour by households. For example, did you know that…
• Since the global financial crisis, more people now feel that environmental issues should mainly be dealt with by future generations?
• Women are more likely to be environmentally motivated than men?
• There is an overall willingness to be green and to pay more for environmentally-friendly choices?
• Trust in government is a more powerful factor than levels of university education in predicting whether people believe climate change is man-made?
What motivates households to separate waste?
0% 20% 40% 60% 80% 100%
Switzerland
Sweden
Spain
Netherlands
Korea
Japan
Israel
France
Chile
Canada
Australia
Percent of respondents
Beneficial forenvironment
Civic duty
Collectingrefunds orreducing wastecollectionexpenditure
Be seen as aresponsiblecitizen
Note: The responses varied between 0 (not important) and 10 (extremely important). In this figure, only the percentage of responses that were above 5 (the midpoint) for each of the categories is presented.
BETTER POLICIES FOR BETTER LIVES
For more information:
www.oecd.org/
www.oecd.org/env/consumption-innovation/ greening-household-behaviour-2014.htm
Photos: © Artisticco/Shutterstock.com
This work is published on the responsibility of the Secretary-General of the OECD. The opinions expressed and arguments employed herein do not necessarily reflect the official views of the Organisation or of the governments of its member countries. This document and any map included herein are without prejudice to the status of or sovereignty over any territory, to the delimitation of international frontiers and boundaries and to the name of any territory, city or area.
December 2014
OECD (2014), Greening Household Behaviour: Overview from the 2011 Survey, Revised Edition, OECD Studies on Environmental Policy and Household Behaviour, OECD Publishing, Paris,DOI: http://dx.doi.org/10.1787/97892641 81373-en.
ALSO IN THIS POLICY HIGHLIGHTS SERIES:
• Towards greener households: energy
• Towards greener households: food
• Towards greener households: transport
• Towards greener households: water