
Towards Energy Efficient Workload Placement in …walpole/class/cs533/papers/raniarpe.pdfTowards...
20
Towards Energy Efficient Workload Placement in Data Centers Rania Elnaggar, Portland State University [email protected] Abstract. A new era of computing is being defined by a shift to aggregate computing resources into large-scale data centers (DCs) that are shared by a global pool of users. In this paradigm, DCs' operational energy costs are a rising concern as they continue an upward trend that is poised to surpass the capital cost of equipment in a typical lifetime usage model. A DC is a complex distributed system comprised of a hierarchy of numerous components; thus, power and energy management can be performed at many levels of granularity and through various techniques. We contend that the energy efficiency problem in DCs should be addressed through a holistic, end- to-end approach that accounts for the many, and sometimes-conflicting, parameters. In this paper, we discuss workload placement strategies as a model for a holistic approach. Earlier research that addressed workload placement, capitalized on a maximum- idle approach that seeks to maximize both spatial and temporal idleness. We show that the underlying concept for that approach does not hold as a basis for energy-efficient placement; we investigate current and future system power expenditure with respect to system load and analyze the contributing factors. We then utilize our analysis to introduce a framework for energy-efficient load placement strategies in DCs. Comparing our approach to maximum-idle-based placement shows gains in compute energy efficiency. Finally, we discuss how our new approach affects DC thermals and the energy required for cooling. 1 Introduction Energy efficiency of has always been a first-class design goal in the mobile and embedded fields due to battery-life limitations. However, until recently, it has been less of a concern for servers and data centers. We witnessed waves of interest in DC energy efficiency with the advent of new technologies such as WWW, clusters, grid, utility compute models. The interest is now renewed with the inception of Cloud Computing [2] [8], given the massive scale anticipated in future DCs. Cloud Computing is charcterized by a move to aggregate computing resources (in terms of hardware, software and services) into large-scale data centers that are shared by a global pool of users. Those data centers are typically owned and run by third-party entities and export a wide array of services and applications ranging from individual consumer-oriented services to enterprise-class offerings.
Transcript of Towards Energy Efficient Workload Placement in …walpole/class/cs533/papers/raniarpe.pdfTowards...

Towards Energy Efficient Workload Placement in Data
Centers
Rania Elnaggar,
Portland State University
Abstract. A new era of computing is being defined by a shift to aggregate
computing resources into large-scale data centers (DCs) that are shared by a
global pool of users. In this paradigm, DCs' operational energy costs are a rising
concern as they continue an upward trend that is poised to surpass the capital
cost of equipment in a typical lifetime usage model.
A DC is a complex distributed system comprised of a hierarchy of numerous
components; thus, power and energy management can be performed at many
levels of granularity and through various techniques. We contend that the
energy efficiency problem in DCs should be addressed through a holistic, end-
to-end approach that accounts for the many, and sometimes-conflicting,
parameters. In this paper, we discuss workload placement strategies as a model
for a holistic approach.
Earlier research that addressed workload placement, capitalized on a maximum-
idle approach that seeks to maximize both spatial and temporal idleness. We
show that the underlying concept for that approach does not hold as a basis for
energy-efficient placement; we investigate current and future system power
expenditure with respect to system load and analyze the contributing factors.
We then utilize our analysis to introduce a framework for energy-efficient load
placement strategies in DCs. Comparing our approach to maximum-idle-based
placement shows gains in compute energy efficiency. Finally, we discuss how
our new approach affects DC thermals and the energy required for cooling.
1 Introduction
Energy efficiency of has always been a first-class design goal in the mobile and
embedded fields due to battery-life limitations. However, until recently, it has been
less of a concern for servers and data centers. We witnessed waves of interest in DC
energy efficiency with the advent of new technologies such as WWW, clusters, grid,
utility compute models. The interest is now renewed with the inception of Cloud
Computing [2] [8], given the massive scale anticipated in future DCs. Cloud
Computing is charcterized by a move to aggregate computing resources (in terms of
hardware, software and services) into large-scale data centers that are shared by a
global pool of users. Those data centers are typically owned and run by third-party
entities and export a wide array of services and applications ranging from individual
consumer-oriented services to enterprise-class offerings.
In this new paradigm, computing energy costs are a rising concern. This is
especially the case in DCs where energy costs continue an upward trend that is poised
to surpass the cost of the equipment itself in a typical lifetime usage model [6]. In
2005, DCs consumed an estimated total of about 50 billion kWh in the U.S., and
around 130 billion kWh for the world. These figures accounted for 1.2% and 0.8% of
the total electricity consumption of the U.S. and the world respectively [24]. The U.S.
Environmental Protection Agency (EPA) estimates that if current energy-efficiency
trends continue, DCs will consume more than 120 billion kWh in the U.S. alone [13].
While cutting down operational costs of data centers is a chief concern, the
environmental impact of this spiraling computing energy expenditure is equivalently
important. It is projected that improving DC efficiency beyond current trends can
reduce carbon dioxide emissions by 15 to 47 million metric tons in 2011 [13].
A data center is a complex entity that can be partitioned into two inter-dependent
systems; the IT system and the facilities system. The IT system is comprised of
compute related parts such as servers, networks and management components. The
facilities system delivers the power and cooling needed by IT equipment as well as
other facilities overhead such as lighting. As servers’ performance grows, they
generate increasing amounts of heat [3] which in turn demands progressively demand
more cooling [6]. In fact, cooling and power delivery energy expenditure already
surpasses compute energy use in a great percentage of data centers [6]. DCs are
usually cooled using Computer Room Air Conditioning (CRAC) units, and are
typically arranged in a hot-aisle, cold-aisle configuration [47].
In this paper we contend that achieving improved energy-efficiency for a DC
should be driven by a holistic that takes into consideration all system components to
achieve maximum synergetic energy savings. This strategy governs a set of local
policies and protocols that effectively use existing power-saving features within each
system component in a way that is proportional to the workload of the component and
of the overall system.
Though ultimately, we are interested in defining an end-to-end global energy
optimization strategy over a generalized model of a multi-level distributed system, the
focus of our short-term research effort is on defining such a strategy for DCs, as a key
subset of the larger problem. We consider a DC workload that is a mix of online and
offline workloads that are mostly characterized as massively parallel, or throughput-
oriented.
In defining such strategies, we will initially examine just the compute-related part
of the DC, thus excluding networking, cooling and power delivery overheads. While
we recognize that these overheads are critically important, we also observe that, in
many cases, they are proportional to computing power expenditure in modern data
centers. Expanding our work to explicitly consider those other components is a topic
for future research.
The rest of this paper is organized as follows. In section 2 we present research
background and review related work. In section 3 we present our hypotheses and
outline an investigation methodology. In section 4 we present results and analysis. In
section 5 we introduce a framework for energy efficient workload placement. In
section 6 we conclude the paper and present direction for future research.

2 Background
A DC’s compute system is
where power management can be performed at many levels of
shown in Fig. 1 below.
Fig. 1. Scale and hierarchy of power management in a DC
We recognize three power
consumption for each component
idle power and dynamic power range
maximum workload of a component. Idle power is the power consumed when a
component has no workload but is powered
response to increasing workload. The dynamic power range defines the
between peak power and idle power, and it i
the workload of the component [
When addressing the power consumption problem in
cost components: the capital cost of power provisioning in
operational power cost during the life span of the DC.
directly related to expected maximum power consumption and is a pressing issue as
more DCs are built and typically
operators such as Google are
workload mix that keeps maximum utilization within a decreased power envelope
[13]. Decreasing operational
body of other research.
Approaches to decrease
the three power attribute
broadly classified into three categories: scaling solutions that track utilization le
sleep solutions that shut off parts of t
that combine the two former
On the component level,
been widely researched and applied to CPUs in particular as
percentage of the overall system power.
have been introduced for various platform components
utilized in wide-spread commercial products such as
AMD [1]. The Advanced
to standardize power management for different platforms
and accelerators has also been
of operating system timers
uninterrupted sleep [44]. Conserving disk drive
been explored through scaled
In the computer networks domain, the concept of maximizing idleness through
sleep states has also been the corner stone of a large body of research that includes
DC’s compute system is comprised of a hierarchy of components of different scale,
where power management can be performed at many levels of that hierarchy,
. Scale and hierarchy of power management in a DC
We recognize three power-related attributes that affect the average power
component, as well as, the overall system; namely: peak power
dynamic power range. Peak power is the power consumed at the
of a component. Idle power is the power consumed when a
component has no workload but is powered-on and active, thus has low-latency
response to increasing workload. The dynamic power range defines the distance
between peak power and idle power, and it is desirable for it to scale proportionally to
the workload of the component [3].
When addressing the power consumption problem in a DC, we identify two main
ponents: the capital cost of power provisioning in the infrastructure, and
operational power cost during the life span of the DC. The capital cost component is
directly related to expected maximum power consumption and is a pressing issue as
typically amortized over an average of 15 years. Large DC
operators such as Google are exploring ways to cut down on that cost through a
workload mix that keeps maximum utilization within a decreased power envelope
operational power, however, is our area of interest and of a large
Approaches to decrease operational (also termed average) power have focused
power attributes we identified earlier. The solutions proposed can be
classified into three categories: scaling solutions that track utilization levels;
off parts of the system at low utilization; and hybrid solutions
former approaches.
On the component level, Dynamic Voltage and Frequency Scaling (DVFS) has
been widely researched and applied to CPUs in particular as they consume a large
percentage of the overall system power. Also, clock gating and system sleep states
have been introduced for various platform components. These techniques have been
spread commercial products such as those produced by Intel [22] and
Configuration and Power Interface (ACPI) [20] was defined
to standardize power management for different platforms. Use of heterogeneous cores
been explored to enhance energy efficiency [27], and the use
perating system timers has been scrutinized to enable longer periods of
Conserving disk drive related energy consumption has also
scaled-speed and sleep modes [9].
In the computer networks domain, the concept of maximizing idleness through
sleep states has also been the corner stone of a large body of research that includes
of a hierarchy of components of different scale,
erarchy, as
power
peak power,
Peak power is the power consumed at the
of a component. Idle power is the power consumed when a
latency
distance
for it to scale proportionally to
main
infrastructure, and the
The capital cost component is
directly related to expected maximum power consumption and is a pressing issue as
an average of 15 years. Large DC
ways to cut down on that cost through a
workload mix that keeps maximum utilization within a decreased power envelope
is our area of interest and of a large
ed on
olutions proposed can be
vels;
hybrid solutions
has
they consume a large
o, clock gating and system sleep states
s have been
] and
defined
Use of heterogeneous cores
, and the use
longer periods of
has also
In the computer networks domain, the concept of maximizing idleness through
sleep states has also been the corner stone of a large body of research that includes
putting network devices and interfaces to sleep during periods of low traffic [19].
Since network chatter can prevent connected workstations from going to sleep,
proxying has been explored [18], as has explicitly waking-up sleeping devices [26].
Other research efforts have focused on selecting a workload-dependant best policy to
manage a device from a pool of candidate policies [40] [45]. Buffering has also been
introduced to create bursty/idle cycles to allow enough sleep time for systems of low
to moderate utilization [53], and the use of burstiness has been investigated for mobile
devices [30].
Power management policies can be largely classified as heuristic policies, or
stochastic policies. Heuristic policies are simpler to adapt [21] [46], while stochastic
policies can offer performance guarantees only for stationary workloads [34] [45].
Application-level work load profiling has been discussed in [15] to guide power
management for meeting user-defined QoS goals such as a battery-life objective.
Addressing cluster-level power management through workload distribution is
usually attempted by powering-off some servers according to the total DC workload
[36] [33]. In [12], a Vary-On Vary-Off policy is introduced and combined with
Dynamic Voltage Scaling (DVS) and also Coordinated DVS (CVS), with the latter
policy shown not to be worthwhile. An economic resource distribution model through
bidding is introduced in [10], and utilizes a cost-based on-off model that powers on
machines if utility exceeds cost. It is well-understood that the on-off model is limited
by the high latency, and decreasing it is instrumental to maintain QoS performance
levels [25].
In earlier research, the on-off approach suffered from a lack of means for live
workload migration in order to consolidate server and power-off lightly loaded
machines. This problem was alleviated by the emergence of virtualization
technologies such as Xen [52] and VMWare [50]. Resource provisioning and
isolation became critical in such a virtualized environment as discussed in [37]. Also,
translating power management directives from different VMs on the same hardware
becomes tricky and the need arises for a standardized method to interface and
coordinate VM power management [31].
Ensemble-level power management in the data centers provides greater
opportunity to maximize energy-efficiency as outlined in [49]. However, the need for
coordination between different power management modules arises and is investigated
through control theory in [35]. Such problems are optimization problems that are
difficult to solve for large-scale data centers [23]. Additionally, optimizing power-
usage is subject to QoS requirements as problem constraints. In [43], the authors
present a QoS-based workload placement approach that reduces average power
consumption by running tasks as slowly as possible within performance bounds.
As we have outlined in section 1, the magnitude of cooling costs in DCs is in the
same order as IT cost and thus has received much attention. Researchers have
investigated reducing cooling costs through controlling the heat load generated in the
DC. As heat recirculation and equipment layout create distinct thermal conditions in
each DC, thermal-aware workload placement strategies were introduced. In [29],
zonal heat distribution and recirculation are factored in selecting a set of servers to
run the workload. In [42] a thermal multiplier is generated to capture DC thermal
conditions and is then used to assign priority workload placement. The same concept

of thermal profiling is used in [48] to design scheduling algorithms aimed at reducing
server inlet temperatures. The scale of the thermal-aware placement approach is
further expanded in [32] to be used for choosing a particular DC among many in a
grid environment. As exceeding thermal limits is always a concern with increased
heat densities, DC-level thermal throttling and capping is also investigated as in [51].
3 Energy Efficient Workload Placement
3.1 The case for energy efficient placement
Reviewing the body of research outlined in section 2 shows particular focus on
maximizing both temporal and spatial idleness through workload placement. In the
spatial dimension, servers’ workloads are consolidated to run a set of active servers at
their maximum utilization, while idle servers are powered off. In the time dimension,
we observe a strategy to maximize idle periods and allow a few consolidated peak
utilization periods. We refer to these approaches as maximum-idle or (MI). Many
researchers have shown reductions in average power consumption by using variants
of MI.
In [43] researches break from the pack and discuss a strategy based on running
workloads as slowly as possible within certain performance constraints for meeting
deadlines. Their hypothesis is that running slower will reduce average power
consumption through DVFS in server systems. While we agree that there is a price tag
associated with increased performance, contrary to MI, we contend,, that the energy
consumption might not be reduced by such approach as we discuss below.
As we stated earlier, we our research goal is to reduce energy consumption, and
not average power consumption. Evidently, energy-based measurements are
inherently difficult to work with as they are scenario-based and will track a task from
start to finish. We lack quantization and benchmarking of energy efficiency albeit
some efforts such as the JouleSort benchmark presented in [41]. Researchers and
system designers have always resorted to the use of a power metric in lieu of an
energy metric, as power is a an average rate that is easy to deal with. Lower average
power doesn’t necessarily translate into lower energy expenditure; the time needed to
complete a given task may be lengthened, with a slower rate corresponding to lower
average power, such that the total energy expenditure increases. This concept is
illustrated in Fig. 2, where a task is run twice at two different power rates. The energy
consumed in each case, corresponds to the two areas under the curve, A1 and A2. Since
A2 is greater than A1, the total energy consumed in the second run of the task is
increased, even though the average power consumption has decreased. The necessary,
and sufficient condition for a lower-power strategy to translate into a lower-energy
strategy is for the performance difference (which is a time-based metric) to be less
than the power difference.

Fig. 2. Total energy consumed is the area under the curve
In order to investigate the underlying basis for MI success we must look at the
power behavior with varying workload levels and be able to compare that across
different systems. There are some inherent difficulties with this
− As different kinds of workload
different manners, the power behavior observed will be workload dependent.
− It is difficult to standardize a method t
utilization as it is also workload dependent.
can be specified by CPU utilization levels, while memory
be specified by memory bandwidth
one utilization form cannot
− If we try to standardize workloads for
performance benchmarks will typically exercise underlying systems at near peak
utilization levels and hence cannot produce power traces that are valid to study
graduated behavior.
workloads for repeatable
Addressing these issues led to the development of
described and characterized
transactional, throughput
applications. Also, high performance computing applications that are massively or
embarrassingly parallel fit into that category as well
compute tasks into small throughput
[16] developed primarily for their web search application
percentage of workloads that can be transformed into this category
Choosing throughput as representative of utilization is indeed helpful as it
eliminates the need to associate
utilization. For these reasons
particular, to represent workloads in this paper. Although the throughput workload we
are considering here is a specific kind of w
can be equally represented by a throughput metric.
Total energy consumed is the area under the curve
In order to investigate the underlying basis for MI success we must look at the
power behavior with varying workload levels and be able to compare that across
There are some inherent difficulties with this approach:
of workload will utilize different parts of server platforms in
, the power behavior observed will be workload dependent.
It is difficult to standardize a method to specify graduated levels of platform
utilization as it is also workload dependent. CPU-bound workloads for example
can be specified by CPU utilization levels, while memory-bound workloads can
be specified by memory bandwidth utilized. Power behavior corresponding to
cannot be compared or aggregated with another.
try to standardize workloads for the sake of comparison we see that existing
performance benchmarks will typically exercise underlying systems at near peak
levels and hence cannot produce power traces that are valid to study
In fact, capturing a representative set of real data center
for repeatable experiments is a challenging task [28].
led to the development of SPEC Power benchmark that is
and characterized in [17]. The workload used in SPEC Power is a
throughput-oriented workload that is characteristic of web-based
Also, high performance computing applications that are massively or
embarrassingly parallel fit into that category as well. Frameworks to transform
compute tasks into small throughput-oriented jobs, such as Google’s MapReduce [39
developed primarily for their web search application [5], are expanding the
percentage of workloads that can be transformed into this category.
Choosing throughput as representative of utilization is indeed helpful as it
eliminates the need to associate with workload specific metrics such as CPU
For these reasons we chose throughput, in general, and SPEC Power, in
particular, to represent workloads in this paper. Although the throughput workload we
are considering here is a specific kind of web-based small requests, many workload
can be equally represented by a throughput metric.
In order to investigate the underlying basis for MI success we must look at the
power behavior with varying workload levels and be able to compare that across
parts of server platforms in
o specify graduated levels of platform
bound workloads for example
bound workloads can
responding to
sake of comparison we see that existing
performance benchmarks will typically exercise underlying systems at near peak
levels and hence cannot produce power traces that are valid to study
In fact, capturing a representative set of real data center
SPEC Power benchmark that is
The workload used in SPEC Power is a
based
Also, high performance computing applications that are massively or
Frameworks to transform
39]
expanding the
Choosing throughput as representative of utilization is indeed helpful as it
workload specific metrics such as CPU
we chose throughput, in general, and SPEC Power, in
particular, to represent workloads in this paper. Although the throughput workload we
workloads
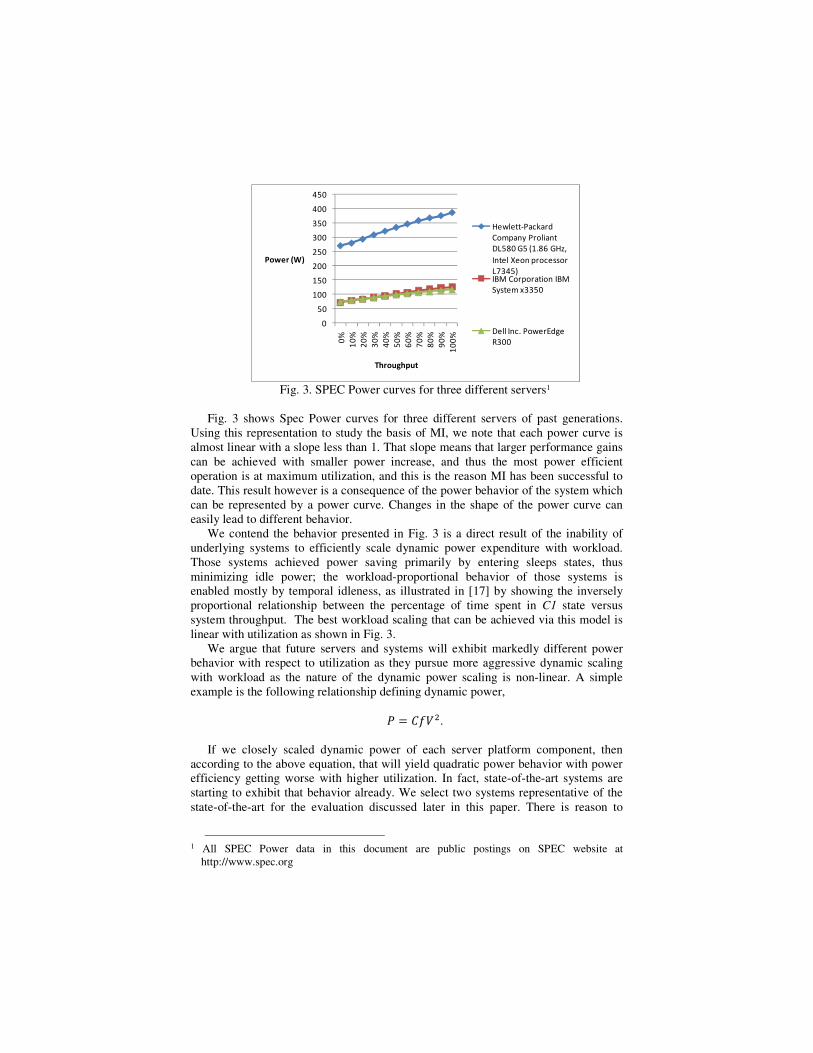
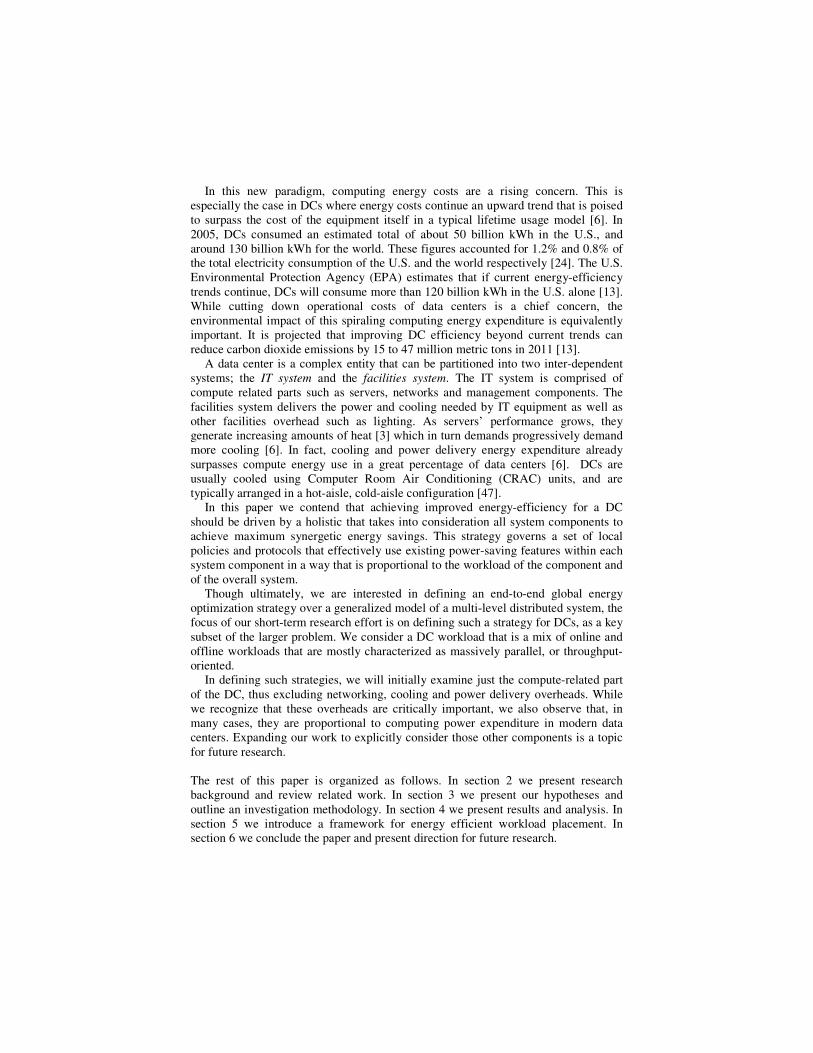
Fig. 3. SPEC Power curves for three different servers1
Fig. 3 shows Spec Power curves for three different servers of past generations.
Using this representation to study the basis of MI, we note that each power curve is
almost linear with a slope less than 1. That slope means that larger performance gains
can be achieved with smaller power increase, and thus the most power efficient
operation is at maximum utilization, and this is the reason MI has been successful to
date. This result however is a consequence of the power behavior of the system which
can be represented by a power curve. Changes in the shape of the power curve can
easily lead to different behavior.
We contend the behavior presented in Fig. 3 is a direct result of the inability of
underlying systems to efficiently scale dynamic power expenditure with workload.
Those systems achieved power saving primarily by entering sleeps states, thus
minimizing idle power; the workload-proportional behavior of those systems is
enabled mostly by temporal idleness, as illustrated in [17] by showing the inversely
proportional relationship between the percentage of time spent in C1 state versus
system throughput. The best workload scaling that can be achieved via this model is
linear with utilization as shown in Fig. 3.
We argue that future servers and systems will exhibit markedly different power
behavior with respect to utilization as they pursue more aggressive dynamic scaling
with workload as the nature of the dynamic power scaling is non-linear. A simple
example is the following relationship defining dynamic power,
� = ����.
If we closely scaled dynamic power of each server platform component, then
according to the above equation, that will yield quadratic power behavior with power
efficiency getting worse with higher utilization. In fact, state-of-the-art systems are
starting to exhibit that behavior already. We select two systems representative of the
state-of-the-art for the evaluation discussed later in this paper. There is reason to
1 All SPEC Power data in this document are public postings on SPEC website at
http://www.spec.org
0
50
100
150
200
250
300
350
400
450
0%
10
%
20
%
30
%
40
%
50
%
60
%
70
%
80
%
90
%
10
0%
Power (W)
Throughput
Hewlett-Packard
Company Proliant
DL580 G5 (1.86 GHz,
Intel Xeon processor
L7345)IBM Corporation IBM
System x3350
Dell Inc. PowerEdge
R300

believe this non-linear behavior will only get more pronounced in the future, as
hardware system developers pursue more aggressive power savings.
Given the above arguments, it is clear that the underlying principles of MI are
unlikely to hold in future systems. Evidently, we contend that there exists a workload
placement distribution corresponding to the utilization level of a DC, which
minimizes total energy expenditure, and that does not necessarily coincide with MI
placement.
The overall energy envelope of the data center consists of both IT power, which is
used to power severs and network, and facilities power that is used for cooling, power
provisioning and overheads. In our research we distinguish between two types of
energy-related costs; first, the cost of power, cooling and facilities provisioning in
capital expenditure; and second, the operational energy cost of powering servers,
cooling and facilities equipment in operational expenditure. The CapEx cost
component is proportional to peak power and set power budget, while the OpEx
component is proportional to average power. Our goal in the research is to focus on
improving operational energy expenditure and hence will not discuss efficiencies
related to under/over capacity provisioning. In this paradigm, the operational cooling
cost is dependent on the heat generated by IT equipment and hence, their power
expenditure. Subsequently, we will focus on discussing energy-efficient expenditure
in servers and correlate its effect on DC thermals and cooling.
To summarize our research directions, we believe that achieving maximum energy-
efficiency in data centers should be driven by a holistic strategy that takes into
consideration all system components to achieve maximum synergetic power savings.
This strategy seeks to effectively use existing power-management features within
each system component in a way that is proportional to the workload of the
component and of the overall system.
We contend that such holistic strategy can be achieved and coordinated through
intelligent workload placement. The workload placement strategy is informed of the
energy-proportionality of each individual subsystem (a server in this case) and will
assign workloads in a manner that achieves maximum energy efficiency over the
entire DC. We are not addressing thermal-aware workload placemat at this point, but
rather a placement based on finding the most efficient load distribution and that is
thermal-friendly, i.e., does not cause undesirable rise in cooling costs due to localized
increase in heat generation (formation of hot spots).
3.2 Methodology and Limitations
As outlined in the previous section, we contend that there exists a workload
distribution strategy that will maximize energy efficiency in the data center, and that
doesn’t necessarily coincide with MI. We identified normalized throughput-based
characterizations of workload, such as achieved by SPEC Power, to be a valid
representation of a system’s power proportionality. This is an optimization problem
that is seeks to minimize energy consumption as workloads are being assigned. In
order to investigate our hypothesis we constructed a profiling simulator written in

C++ to experiment with different settings. In order to simplify the problem we only
consider homogeneous DCs in the simulator. We will show in the results analysis
how to easily expand our framework to incorporate heterogeneous DCs and we intend
to incorporate that in our future work.
The Simulator has a cost matrix for each server type that is constructed from the
SPEC Power profiling of the server. Each cost matrix has 11 values corresponding to
power usage by the server at utilization levels ranging from 0% (active idle) to 100%
of maximum throughput. The number of servers in the DC is given as input to the
simulator for each run. Simulation runs exercise the DC in a normalized graduated
utilization manner at 10% increments of the DC’s maximum throughput workload.
Maximum DC workload is determined by multiplying the number of servers in the
DC by the maximum throughput of each server. DC throughput directly corresponds
to the arrival rate of jobs. We assume that for arrival rates higher than the total DC
capacity, jobs are queued at the workload dispatcher. The simulator finds all possible
combinations of workload distributions at each utilization level, and calculates the
aggregate corresponding cost over the entire DC. The simulator then identifies
minimum, maximum and MI cost values for each workload level, corresponding to
minimum, maximum and MI aggregate power consumption. To limit the search
space, we assume that workloads can only be distributed to servers in chunks of 10%
of the maximum server load.
Note that the slow-down factor we identified as a necessary condition to translate
power efficiency into energy efficiency, is not present in this framework; that is
because the requested workload throughput is not scaled or throttled but is be kept
constant as the server scales its power consumption accordingly.
The purpose of the profiling simulation is to characterize the DC’s aggregate
power behavior versus throughput, as well as, to compare and contrast different
machine configurations and varying number of machines. Profiling results can be
used to develop heuristics aiding in designing workload placement policies in DCs.
4 Results and Analysis
For presenting this section, we consider three different servers as building blocks for a
DC system of varying number of machines. The three server systems are respectively
named: m1, m2 and m3. The SPEC Power profiles of the three systems under
investigation are presented in Fig. 4 below. Note that both m1 and m2 exhibit the non-
linear power scaling we outlined in section 3, while m3 has a mostly linear power
curve.

Fig. 4. SPEC Power profile of the three machines under study.
We run the profiling simulator on three DC systems that are homogeneous
collections of the three machines. We use the graduated workload methodology
outlined in the section 3.2, to vary the DC throughput. The number of machines in
each DC is varied between 2 and 8. Nonetheless, we will show later that the results
are valid for larger configurations. The purpose of the simulations is to find a
minimum workload distribution at each DC throughput-level and study the properties
of this distribution. In Fig. 5 below we plot the minimum power distribution against
normalized DC utilization for a number of machines n ranging from 2 to 8 in a DC
system of m1. Fig. 6 shows the percentage increase of power savings above MI
placement, achieved by finding the minimum power distributions at each DC
utilization level.
Fig. 5. Minimum power versus throughput for different DC configurations, m1.
0
50
100
150
200
250
Power
Throuput
Hewlett-Packard Company
ProLiant DL380 G6 (2.26GHz, Intel
Xeon L5520 processor), m1
Dell Inc. PowerEdge R710 (Intel
Xeon X5570, 2.93 GHz), m2
Fujitsu Siemens Computers
PRIMERGY TX150 S6 (Intel Xeon
L3360), m3
0
200
400
600
800
1000
1200
1400
1600
0%
10
%
20
%
30
%
40
%
50
%
60
%
70
%
80
%
90
%
10
0%
Power (W)
DC Throughput
n = 2
n = 3
n = 4
n = 5
n = 6
n = 7
n = 8

Fig. 6. Percentage power savings versus MI, m1.
Examining Fig. 5 and Fig. 6 shows that, for an m1-based DC, there is a minimum
aggregate power workload distribution different than MI and computes the amount of
savings obtained at various utilization levels and with different numbers of machines.
We obtain analogous results for m2, while for m3, MI proves to always coincide with
the minimum as suggested by the shape of its power profile in Fig. 4. The above
figures, however, do not provide insights into the properties of the minimum power
distribution and additional analysis is needed.
Taking the analysis further, we normalize the resulting minimum power curve to
the value obtained at maximum throughput. This is akin to the way we normalized
throughput and thus we can compare the aggregate minimum power of different DC
configurations. The results of this approach are presented in Fig. 7, Fig. 8 and Fig. 9,
for m1, m2 and m3 respectively.
Fig. 7. Normalized percentage minimum aggregate power versus DC throughput
for m1-based DC.
0%
1%
2%
3%
4%
5%
6%
0% 10% 20% 30% 40% 50% 60% 70% 80% 90% 100%
Power
DC Throughput
n = 8
n = 7
n = 6
n = 5
n = 4
n = 3
n = 2
0%
10%
20%
30%
40%
50%
60%
70%
80%
90%
100%
Power
DC Throughput
n = 2
n = 3
n = 4
n = 5
n = 6
n = 7
n = 8
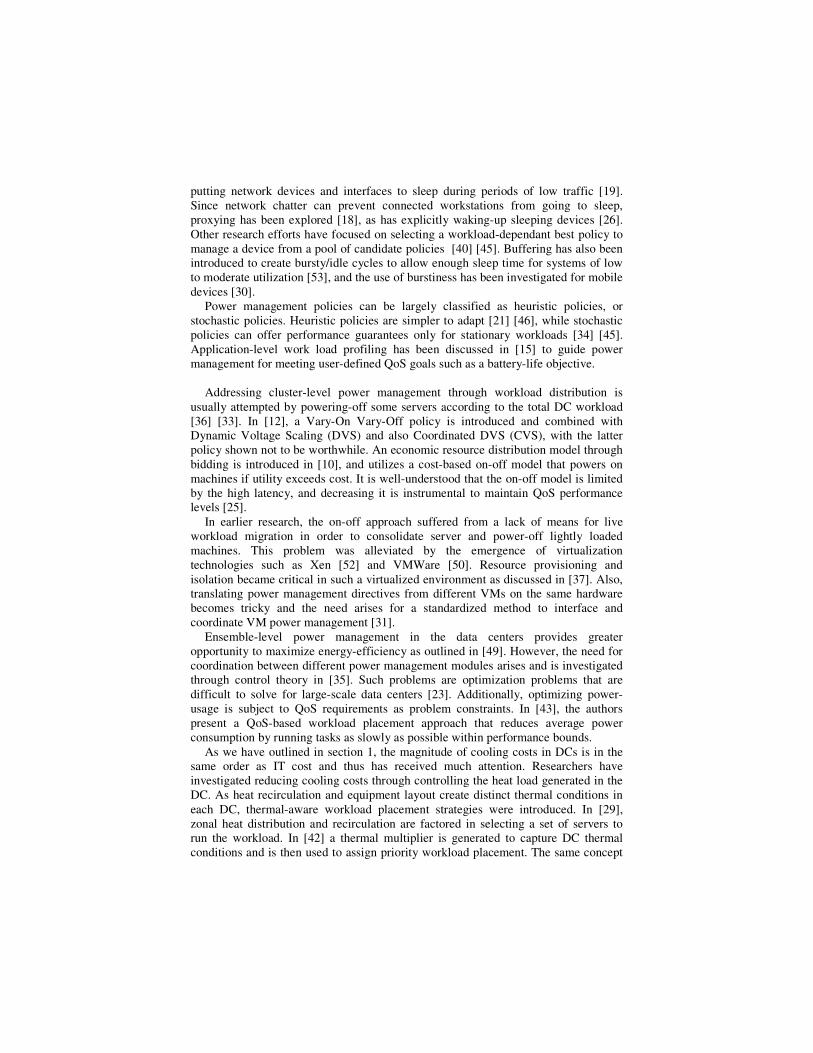
Fig. 8. Normalized percentage minimum aggregate power versus DC throughput
for m2-based DC.
Fig. 9. Normalized percentage minimum aggregate power versus DC throughput
for m3-based DC.
The above charts show that varying the number of machines in the DC doesn’t
change the shape of the normalized aggregate minimum power curve obtained
through workload placement. The shape of that curve changes though with different
server base as we see by considering m1, m2 and m3. That means that the power
profile (or behavior) of the DC is independent of the number of machines for a
homogeneous system of a fixed workload type such as the system profiled.
We examine the power savings obtained by seeking minimum workload
distribution versus MI, and we plot that against throughput for both m1 and m2 while
fixing n. We ignore m3 because those savings always amount to zero in this case. Fig.
10, Fig. 11 and Fig. 12 show those savings for n = 2, n = 6 and n = 8 respectively.
0%
10%
20%
30%
40%
50%
60%
70%
80%
90%
100%
0% 10% 20% 30% 40% 50% 60% 70% 80% 90%
n = 2
n = 3
n = 4
n = 5
n = 6
n = 7
n = 8
0%
20%
40%
60%
80%
100%
120%
0% 10% 20% 30% 40% 50% 60% 70% 80% 90%
n = 2
n = 3
n = 4
n = 5
n = 6
n = 7
n = 8

Fig. 10. Percentage of power saved versus MI, n = 4.
Fig. 11. Percentage of power saved versus MI, n = 6.
Fig. 12. Percentage of power saved versus MI, n = 8.
From the above figures, we observe that there is a sweet spot in the DC utilization
level that will result in a workload distribution corresponding to a maximum power
0%
1%
2%
3%
4%
5%
6%
7%
8%
9%
Power saved
DC Throughput
m1
m2
0%
1%
2%
3%
4%
5%
6%
7%
0%
10
%
20
%
30
%
40
%
50
%
60
%
70
%
80
%
90
%
10
0%
Power saved
DC Throughput
m1
m2
0%
1%
2%
3%
4%
5%
6%
0%
10
%
20
%
30
%
40
%
50
%
60
%
70
%
80
%
90
%
10
0%
Power saved
DC Throughput
m1
m2

savings over MI. The location of that sweet spot is independent of the machine type,
but dependent on the number of machines.
In the results above, we find a workload distribution that minimizes energy
consumption given a fixed DC configuration according to the number machines. This
approach however does not scale well as the size of the DC grows. We need to find a
way to further constrict the search space in the problem. Accordingly, we investigate
another approach to optimization of workload placement, by aggregating machines
into a hierarchy of nodes and distributing the workload between the top-most nodes in
the hierarchy at each level until bottom nodes (individual servers) are reached. That
hierarchy is similar to a tree structure with a constant branching factor equal to the
number of nodes at each level. We use our profiling simulator to test this strategy and
produce the DC power profiles as shown earlier. Simulations seek the most efficient
placement at each node level. We setup an experiment with a DC of 8 servers
organized in a node hierarchy of 3 levels with a branching factor of 2 at each level.
Fig. 13 shows the resulting normalized power curve at each hierarchal level and for a
DC of 8 at top most level.
Fig. 13. Normalized power curve for a DC of 8 nodes and a branching factor of 2 in
3 levels of hierarchy, m2.
Looking at the above chart we conclude that the aggregate power behavior of the
DC doesn’t change by breaking down the best placement decision into a hierarchy of
nodes. The trade-off between the branching factors and the depth of the hierarchy can
be used to reduce exhaustive search time for best placement. This observation can be
used to find best placement in a DC with a large number of servers. We also consider
using profiling to find adequate placement heuristics for a given branching factor, and
then repeatedly applying that across the hierarchy.
In fact, such an approach can be generalized to partition a heterogeneous DC into
several homogeneous clusters and treat them as end nodes at the top-most level for
workload distribution. We intend to investigate the heterogeneous structure in our
future work.
0%
10%
20%
30%
40%
50%
60%
70%
80%
90%
100%
0% 10% 20% 30% 40% 50% 60% 70% 80% 90%
Power
DC Throughput
Level 2
Level 1
Level 0
n = 8

5 Recommended Framework
In section 4, we profiled the problem of finding a minimum power workload
distribution in homogeneous DCs for fixed transactional workloads. We showed that
the aggregate power behavior of the DC, when normalized, is independent of the
number of machines. On the other hand, the maximum power savings obtained from
such a distribution corresponds to a certain DC utilization level that depends on the
total number of machines. We also showed how to structure the DC into a hierarchy
of nodes and thus limit the problem to the set of nodes at each level, in a repeatable
fashion.
It is worth noting that in our simulations we considered only active idle power at
0% utilization and didn’t power-off machines to get a power cost of zero. There is no
doubt that turning machines off will save more power at low utilization levels.
However, we only consider an active set of servers among a pool of all available
servers in the DC. Machines outside the active set are considered to be shutdown and
thus have no contribution to workload distribution problem. Machines are brought up
as the size of the active set expands and are turned off as it contracts. The size of this
active set should have enough servers to guard against rapid workload growth, and
thus to stay within latency thresholds. We intend to investigate the trade-offs between
the active-set size and DC energy-efficiency in our future work.
DC cooling cost is directly proportional to the maximum heat load generated. As
MI seeks to run servers at their maximum utilization through workload consolidation,
this will likely result in an increased heat load that is likely to affect cooling cost.
Our approach, however, distributes workloads such that servers avoid operating at
peak utilization; this is because of the increased energy cost of peak utilization present
in the power curves of well-power-managed systems. Hence, we expect our approach
to be thermal-friendly, albeit not thermal-aware as it does not capture the thermal
conditions in the DC.
We also consider spatially rotating the active set by adding and dropping servers to
it, to decrease localized heat densities. The active set of servers should also be
spatially dispersed for the same reason.
6 Conclusions and Future Work
The problem of reducing energy consumed by DCs is a chief concern as DCs grow in
size and complexity. Previous research has typically addressed this problem through
power management techniques that capitalize on maximizing both spatial and
temporal idleness.
In this paper we investigate the contributing factors to the energy expenditure in
the DC, and analyze power behavior corresponding to different levels of workloads.
We illustrate, through using power profiles, the reason MI was believed to offer best
workload distribution and how that is changing in future systems due to pursuing
aggressive dynamic power management. We discuss the differences between
minimizing energy and minimizing average power and show they are not
synonymous. We use a throughput metric to characterize both DC and server
utilization. Subsequently, we employ the corresponding power curves to design a new
cost-based workload placement strategy that seeks to minimize power usage at each
DC utilization level. As the throughput is kept constant, and not scaled or throttled
down, we ensure that the minimum power placement corresponds to a minimum
energy placement. We evaluate our new strategy through a profiling simulator that we
have developed, and study the power behavior of various DC configurations
employing three different server types. We validate our strategy through simulation
and show that it finds a minimum-power workload distribution that does not
necessarily coincide with MI. We then expand the result to show that that there is a
sweet spot for DC utilization where the power savings are maximized. Afterwards, we
show how to scale down the problems by arranging the DC into a hierarchy of nodes
with a given branching factor at each level. We expect that result to be very useful
when applied to large scale DCs, as well as, to heterogeneous configurations. We then
refine the framework introduced by introducing the concept of a rotating, spatially-
dispersed active set of servers. Although this approach is not thermally-aware, we
believe it is thermal-friendly as it avoids the increased localized heat loads.
Heterogeneity in both server type and workload type is a natural expansion of the
approach presented in this paper, and we plan to tackle in future work. We propose to
address heterogeneity by aggregating similar servers/workloads into groups in a
hierarchy of top-level heterogeneous nodes.
Another good area for future investigation is incorporating cost metrics
corresponding to energy consumption in other DC systems, such as: networking,
workload migration, heat generation, heat recirculation and thermal layout. We
believe, however, that the cost contribution of both heat recirculation and thermal
layout can be eliminated by careful DC design. Modern DCs already exhibit this
feature by tunneling hot or cold air in isolation, as well as a host of other techniques..
References
1. AMD Opteron Processor Power and Thermal Data sheet, publication #30417,
http://www.amd.com/us-en/Processors/TechnicalResources/0,,30_182_739_
9003,00.html
2. Armbrust, M., Fox, A., Griffith, R., Joseph, A., Katz, R., Konwinski, A., et al.:
Above the Clouds: A Berkeley View of Cloud Computing. University of
California, Berkeley, Technical. Report (2009)
3. Barroso, L. A.: The Price of Performance. ACM Queue , vol. 3, pp. 48-53. ACM,
New York (2005)
4. Barroso, L., & Holzle, U.: The case for energy-proportional computing.
Computer, IEEE Computer Society, vol. 40, no. 33. IEEE Press, New York
(2007)
5. Barroso, L., Dean, J., & Holzle, U.: Web search for a planet: The Google cluster
architecture. IEEE micro , vol. 23, pp. 22-28. IEEE Press, New York (2003)
6. Belady, C., & Malone, C.: Metrics and an Infrastructure Model to Evaluate Data
Center Efficiency. In proceedings of the ASME InterPACK, Vancouver, BC.
(2007)
7. Bohrer, P., Elnozahy, E., Keller, T., Kistler, M., Lefurgy, C., McDowell, C., et
al.: The case for power management in web servers. Power Aware Computing,
pp. 261. Kluwer Academic Publishers (2002)
8. Buyya, R., Yeo, C., Venugopal, S., Ltd, M., & Melbourne, A.: Market-oriented
cloud computing: Vision, hype, and reality for delivering it services as computing
utilities. In proceedings of the 10th IEEE International Conference on High
Performance Computing and Communications (HPCC). IEEE CS Press, Los
Alamitos, CA, USA (2008)
9. Carrera, E., Pinheiro, E., & Bianchini, R.: Conserving disk energy in network
servers. In proceedings of the 17th annual international conference on
Supercomputing, pp. 86-97. ACM New York, NY, USA (2003)
10. Chase, J., Anderson, D., Thakar, P., Vahdat, A., & Doyle, R.: Managing energy
and server resources in hosting centers. In proceedings of the eighteenth ACM
symposium on Operating systems principles ,pp. 103-116. ACM New York, NY,
USA (2001)
11. Dhiman, G., & Rosing, T.: Dynamic power management using machine learning.
In proceedings of the 2006 IEEE/ACM international conference on Computer-
aided design, pp. 747-754. ACM New York, NY, USA (2006).
12. Elnozahy, E., Kistler, M., & Rajamony, R.: Energy-efficient server clusters.
Lecture Notes in Computer Science , Vol. 2325/2003, pp. 179-196. Spriger,
Hiedelberg (2003)
13. Envorinmental Protection Agency (EPA): Report to Congress on Server and Data
Center Energy Efficiency Public Law 109-431 (2007)
14. Fan, X., Weber, W., & Barroso, L.: Power provisioning for a warehouse-sized
computer. In Proceedings of the 34th annual international symposium on
Computer architecture, pp. 13-23. ACM, New York, NY, USA (2007)
15. Flinn, J., & Satyanarayanan, M.: Managing battery lifetime with energy-aware
adaptation. ACM Transactions on Computer Systems (TOCS) , vol. 22, pp. 137-
179. ACM, New York (2004)
16. Ghemawat, S., & Dean, J.: MapReduce: Simplified Data Processing on Large
Clusters. In Proceedings of the Sixth Symposium on Operating System Design
and Implementation vol. 6, p. 10. (2004)
17. Gray, L., Kumar, A., & Li, H.: Characterization of SPECpower_ssj2008
benchmark. SPEC Benchmark Workshop. (2008)
18. Gunaratne, C., Christensen, K., & Nordman, B.: Managing energy consumption
costs in desktop PCs and LAN switches with proxying, split TCP connections,
and scaling of link speed. Internationa Journal on Network Management , vol. 15,
p.p 297-310. (2005)
19. Gupta, M., Grover, S., & Singh, S.: A feasibility study for power management in
LAN switches. In proceedings of the 12th IEEE International Conference on
Network Protocols (ICNP), pp. 361-371. (2004)
20. HP, Intel, Microsoft, Phoenix, Toshiba: Advanced configuration and power
interface specification. ACPI Specification Document, Revision 3. (2004)

21. Hwang, C., & Allen, C.: A predictive system shutdown method for energy saving
of event-driven computation. ACM Transactions on Design Automation of
Electronic Systems (TODAES) ,vol. 5, pp. 226-241. (2000)
22. Intel Xeon Processor 7400 Series datasheet,
http://www.intel.com/products/processor/xeon7000/documentation.htm?iid=prod
ucts_xeon7000+tab_techdocs. (2008)
23. Keeton, K., Kelly, T., Merchant, A., Santos, C., Wiener, J., Zhu, X., et al.: Don’t
settle for less than the best: use optimization to make decisions. In proceedings of
the 11th USENIX workshop on Hot topics in Operating Systems. USENIX
Association Berkeley, CA, USA (2007)
24. Koomey, J.: Estimating total power consumption by servers in the US and the
world. Final report. (2007)
25. Meisner, D., Gold, B., & Wenisch, T.: PowerNap: Eliminating Server Idle Power.
SIGPLAN Notices, vol. 44, pp. 205-216. ACM, New York, USA. (2008)
26. Mishra, N., Chebrolu, K., Raman, B., & Pathak, A.: Wake-on-WLAN. In
proceedings of the 15th international conference on World Wide Web, pp. 761-
769. ACM New York, NY, USA (2006)
27. Mogul, J., Mudigonda, J., Binkert, N., Ranganathan, P., & Talwar, V.: Using
Asymmetric Single-ISA CMPs to Save Energy on Operating Systems. IEEE
Micro , vol. 28, pp. 26-41. IEEE Press (2008)
28. Moore, J., Chase, J., Farkas, K., & Ranganathan, P.: Data center workload
monitoring, analysis, and emulation. In proceedings of Eighth Workshop on
Computer Architecture Evaluation using Commercial Workloads (2005)
29. Moore, J., Chase, J., Ranganathan, P., & Sharma, R.: Making scheduling “cool”:
Temperature-aware resource assignment in data centers. In proceedings of
Proceedings of the USENIX Annual Technical Conference (2005)
30. Nathuji, R., & Schwan, K.: Reducing system level power consumption for mobile
and embedded platforms. In proceedings of the International Conference on
Architecture of Computing Systems (ARCS) (2005)
31. Nathuji, R., & Schwan, K.: Virtualpower: Coordinated power management in
virtualized enterprise systems. ACM SIGOPS Operating Systems Review, vol.
21, no. 6, pp. 265-278..ACM New York, NY, USA. (2007)
32. Patel, C., Sharma, R., Bash, C., & Graupner, S.: Energy Aware Grid: Global
Workload Placement based on Energy Efficiency. In proceesings of IMECE (
2003)
33. Pinheiro, E., Bianchini, R., Carrera, E., & Heath, T.: Load balancing and
unbalancing for power and performance in cluster-based systems. In processing
of Workshop on Compilers and Operating Systems for Low Power, vol. 180, pp.
182-195 (2001)
34. Qiu, Q., & Pedram, M.: Dynamic power management based on continuous-time
Markov decision processes. In proceedings of the 36th ACM/IEEE conference on
Design automation, pp. 555-561. ACM New York, NY, USA (1999)
35. Raghavendra, R., Ranganathan, P., Talwar, V., Wang, Z., & Zhu, X.: No" power"
struggles: coordinated multi-level power management for the data center. In
proceedings of ASLOPS (2008)
36. Rajamani, K., Lefurgy, C., Res, I., & Austin, T.: On evaluating request-
distribution schemes for saving energy in server clusters. In proceedings of the

IEEE International Symposium on Performance Analysis of Systems and
Software, pp. 111-122. (2003)
37. Ramakrishnan, L., Irwin, D., Grit, L., Yumerefendi, A., Iamnitchi, A., & Chase,
J.: Toward a doctrine of containment: grid hosting with adaptive resource control.
In proceedings of the ACM/IEEE conference on Supercomputing. ACM New
York, NY, USA (2006)
38. Ranganathan, P., Leech, P., Irwin, D., & Chase, J.: Ensemble-level power
management for dense blade servers. In proceedings of the 33rd International
Symposium on Computer Architecture (ISCA), pp. 66-77. IEEE Computer
Society Washington, DC, USA (2006)
39. Ranger, C., Raghuraman, R., Penmetsa, A., Bradski, G., & Kozyrakis, C.:
Evaluating MapReduce for multi-core and multiprocessor systems. In
proceedings of IEEE 13th International Symposium on High Performance
Computer Architecture, pp. 13-24. IEEE Computer Society Washington, DC,
USA (2007)
40. Ren, Z., Krogh, B., & Marculescu, R.: Hierarchical adaptive dynamic power
management. IEEE Transactions on Computers , vol. 54, pp. 409-420. IEEE
Press (2005)
41. Rivoire, S., Shah, M., Ranganathan, P., & Kozyrakis, C.: Joulesort: a balanced
energy-efficiency benchmark. In proceedings of the 2007 ACM SIGMOD
international conference on Management of data, pp. 365-376. ACM New York,
NY, USA (2007)
42. Sharma, R., Bash, C., Patel, C., Friedrich, R., & Chase, J.: Balance of power:
Dynamic thermal management for internet data centers. IEEE Internet
Computing ,vol. 9, pp. 42-49. IEEE Press (2005)
43. Sharma, V., Thomas, A., Abdelzaher, T., Skadron, K., & Lu, Z.: Power-aware
QoS management in web servers. In proceedings of 24th IEEE Real-Time
Systems Symposium, pp. 63-72. IEEE Press (2003)
44. Siddha, S., Pallipadi, V., & De, A. V.: Getting maximum mileage out of tickless.
In proceedings of Linux Synposium, pp. 201-208. (2007).
45. Simunic, T., Benini, L., Glynn, P., & Micheli, G. D.: Event-driven power
management. IEEE Transactions on Computer-Aided Design of Integrated
Circuits and Systems , vol. 20, pp. 840-857. IEEE Press (2001)
46. Srivastava, M., Chandrakasan, A., & Brodersen, R.: Predictive system shutdown
and other architectural techniques for energy efficient programmable
computation. IEEE Transactions on Very Large Scale Integration (VLSI)
Systems ,vol. 4, pp. 42-55. IEEE Press (1996)
47. Sullivan, R.: Alternating cold and hot aisles provides more reliable cooling for
server farms. Uptime Institute (2000)
48. Tang, Q., Gupta, S., & Varsamopoulos, G.: Energy-Efficient Thermal-Aware
Task Scheduling for Homogeneous High-Performance Computing Data Centers:
A Cyber-Physical Approach. IEEE Transactions on Parallel and Distributed
Systems , vol. 19, pp. 1458-1472. IEEE Press (2008)
49. Tolia, N., Wang, Z., Marwah, M., Bash, C., Ranganathan, P., & Zhu, X.:
Delivering Energy Proportionality with Non Energy-Proportional Systems--
Optimizing the Ensemble. In proceedings of the 1st Workshop on Power Aware
Computing and Systems (HotPower) (2008)

50. VM Ware, http://www.vmware.com
51. Weissel, A., & Bellosa, F.: Dynamic thermal management for distributed
systems. In proceedings of the First Workshop on Temperature-Aware Computer
Systems (2004)
52. Xen, http://www.xen.org/
53. Yavatkar, R., & Krishnamurthy, L.: Method and apparatus for managing energy
usage of processors while executing protocol state machines. US Patent App.
10/056,160 (2002)