Environmental Impacts Assess- ment and Economic Efficiency ...
Upload
pete-smithCategory
view
212download
0
REV I EW
Towards an integrated global framework to assess theimpacts of land use and management change on soilcarbon: current capability and future visionPETE SM ITH * , CHR I ST IAN A . DAV IE S † , S T EPHEN OGLE ‡ , G IUL IANA ZANCHI § ,J E S S ICA BELLARBY * , NE I L B IRD § , ROBERT M . BODDEY ¶ , N IALL P . MCNAMARA* * ,
DAV ID POWLSON † † , ANNETTE COWIE ‡ ‡ , ME INE V AN NOORDWI JK § § , SARAH C .
DAV I S ¶ ¶ , DAN IEL D E B . R ICHTER * * * , L EN KRYZANOWSK I † † † , MARK T . V A N WI JK ‡ ‡ ‡ , § § § ,J UD I TH STUART ¶ ¶ ¶ , AK IRA K IRTON* * * * , DUNCAN EGGAR † † † † , GERALD INE
NEWTON-CROSS * * * * , TAPAN K . ADHYA ‡ ‡ ‡ ‡ and ADEMOLA K. BRAIMOH§§§§
*Institute of Biological and Environmental Sciences, School of Biological Sciences, University of Aberdeen, Aberdeen, AB24 3UU,
UK, †Shell Global Solutions (UK), Shell Technology Centre Thornton, PO Box 1, Chester, CH1 3SH, UK, ‡Natural Resources
Ecology Laboratory and Department of Ecosystem Science and Sustainability, Colorado State University, Fort Collins, CO 80523,
USA, §Resources – Institute for Water, Energy and Sustainability, Joanneum Research, A-8010, Graz, Austria, ¶ Embrapa
Agrobiologia, Seropedica, 23890-000, Rio de Janeiro Brazil, **The Centre for Ecology and Hydrology, Lancaster Environment
Centre, Lancaster, LA1 4AP, UK, ††Department of Sustainable Soils and Grassland Systems, Rothamsted Research, Harpenden,
AL5 2JQ, UK, ‡‡National Centre for Rural Greenhouse Gas Research, University of New England, Armidale, NSW 2351,
Australia, §§World Agroforestry Centre (ICRAF) Situ Gede, Sindang Barang, Bogor 16115, PO Box 161, Bogor, 16001, Indonesia,
¶¶Department of Plant Biology, University of Illinois at Urbana-Champaign, Urbana, IL 61801, USA, ***Environmental Sciences
and Policy, Nicholas School of the Environment, Duke University, Durham, NC 27708, USA, †††Land Use Section, Government
of Alberta Agriculture and Rural Development, Edmonton, T6H 5T6, Alberta Canada, ‡‡‡Plant Production Systems Group,
Wageningen University, Droevendaalsesteeg 1, 6708 PB, Wageningen, NL, §§§International Livestock Research Institute (ILRI),
Box 30709, Nairobi, Kenya, ¶¶¶Soils Policy Team, Defra, Area 3C, Nobel House, 17 Smith Square, London, SW1P 3JR, UK,
****The Energy Technologies Institute, Holywell Building, Holywell Park, Loughborough, LE11 3UZ, UK, ††††BBSRC, PolarisHouse, North Star Avenue, Swindon, SN2 1UH, UK, ‡‡‡‡Central Rice Research Institute, Cuttack, Orissa 753 006, India,
§§§§World Bank, 1818 H Street, NW, Washington DC, USA
Abstract
Intergovernmental Panel on Climate Change (IPCC) Tier 1 methodologies commonly underpin project-scale carbon
accounting for changes in land use andmanagement and are used in frameworks for Life Cycle Assessment and carbon
footprinting of food and energy crops. These methodologies were intended for use at large spatial scales. This can intro-
duce error in predictions at finer spatial scales. There is an urgent need for development and implementation of higher
tier methodologies that can be applied at fine spatial scales (e.g. farm/project/plantation) for food and bioenergy crop
greenhouse gas (GHG) accounting to facilitate decisionmaking in the land-based sectors. Higher tier methods have been
defined by IPCC and must be well evaluated and operate across a range of domains (e.g. climate region, soil type, crop
type, topography), and must account for land use transitions and management changes being implemented. Further-
more, the data required to calibrate and drive the models used at higher tiers need to be available and applicable at fine
spatial resolution, covering the meteorological, soil, cropping system andmanagement domains, with quantified uncer-
tainties. Testing the reliability of themodelswill require data either from siteswith repeatedmeasurements or from chro-
nosequences.We review current global capability for estimating changes in soil carbon at fine spatial scales and present a
vision for a framework capable of quantifying land use change andmanagement impacts on soil carbon, which could be
used for addressing issues such as bioenergy and biofuel sustainability, food security, forest protection, and direct/indi-
rect impacts of land use change. The aim of this framework is to provide a globally accepted standard of carbonmeasure-
ment andmodelling appropriate forGHGaccounting that could be applied at project to national scales (allowing outputs
to be scaledup to a country level), to address the impacts of land use and landmanagement change on soil carbon.
Keywords: land use, land use change, model, monitoring, soil carbon
Received 14 November 2011; revised version received 28 February 2012 and accepted 4 March 2012
Correspondence: Pete Smith, tel. + 44 0 1224 272 702, fax + 44 0 1224 272 703, e-mail: [email protected]
All authors contributed equally to this work
© 2012 Blackwell Publishing Ltd 1
Global Change Biology (2012), doi: 10.1111/j.1365-2486.2012.02689.x

Introduction
Land use changes and soil degradation have played a
significant role in increasing the atmospheric CO2 con-
centration, with estimates of the global historic loss of
carbon (C) from soils varying from 41 Pg C (Houghton
& Skole, 1990) to 55 Pg C (IPCC, 2000). Monitoring soil
C is important for scientific understanding of the
C-cycle and is becoming critical for a variety of policy
objectives such as mitigation of greenhouse gas emis-
sions, food and energy security and biodiversity protec-
tion, and assessing the feedbacks between soil carbon
and climate change. The Intergovernmental Panel on
Climate Change (IPCC, 2006b) has developed standard
methods for estimating soil organic carbon (SOC)
stocks through time, which are used by countries for
reporting to the United Nations Framework Conven-
tion on Climate Change (UNFCCC). The methods are
characterized by flexibility that ranges from a Tier 1
default method prescribed by the IPCC, to methods
that incorporate local information to estimate C stock
changes at a Tier 2 level, or more advanced modelling
and/or measurement-based networks at the Tier 3
level. The simplest Tier 1 method only requires moni-
toring of the land use and management activity that
influences soil C, and spatial data on soil types and
climates. The annual change in SOC is calculated by
multiplying a reference SOC stock by a series of dimen-
sionless factors representing land use or land use
change type, management regime and input of organic
matter; equations, default factor values and C change
rates are provided in the guidelines (IPCC, 2006b).
Lokupitiya & Paustian (2006) reviewed the applica-
tion of IPCC methods in national inventory reporting
to the UNFCCC and found that only about 30% of the
Annex I (i.e. industrialized) countries reported soil C
stock changes for mineral soils, and half of those were
using Tier 1 methods. However, the Tier 1 level is not
necessarily appropriate for assessing soil C in all situa-
tions. This method is intended for application in coun-
tries for which soil C stock change is not a significant
contributor to national emissions or removals, and
countries that have limited capacity to provide coun-
try-specific data. The latter is a common limitation in
non-Annex I (nonindustrialized) countries. The C stock
change rates for the Tier 1 method are derived from a
global dataset of experimental results (Ogle et al.,
2005), but they are highly uncertain for most regional
monitoring applications, particularly in tropical
regions, and stocks under native vegetation are also
uncertain (Batjes, 2011). The IPCC recommends that
Tier 2 or 3 methods be used as a good practice for
inventory reporting, particularly for key sources of
greenhouse gas emissions (IPCC, 2006c). Tier 2 meth-
ods have been used to develop C offset market proto-
cols for soil C sequestration based on soil tillage
practice changes (Goddard et al., 2008; Haak, 2008) that
is currently being used in the Alberta, Canada. Tier 2
and 3 will provide more accurate results, if there are
sufficient data to support their application. Tier 2
methods apply country-specific emissions factors to
the same equations used in Tier 1. Tier 3 methods may
use detailed direct measurement, but are likely to be
unaffordable for most countries using current technol-
ogies for soil C measurement, though new techniques
such as visible and near infrared reflectance spectros-
copy may provide less expensive methods to measure
SOC (Zimmermann et al., 2007). Tier 3 methods based
on modelling are more affordable and offer multiple
advantages, such as the potential for application at a
range of scales from national down to the individual
landholder.
Similar Tiers are used for estimating non-CO2 GHG
fluxes from the land i.e. nitrous oxide (N2O) and meth-
ane (CH4), with Tier 1 methods using activity data (such
as fertilizer use) to estimate emissions. Tier 2 methods
allow regionally specific emission factors (EFs) to be
used with similar activity data to Tier 1, and at Tier 3,
more complex methods can be used (IPCC, 2006b,c; Del
Grosso et al., 2010). Under the 2006 IPCC Guidelines for
National Greenhouse Gas Inventories (IPCC, 2006b),
methods for accounting for soil C change and for GHG
emissions under all land uses are brought together
under the sector of Agriculture, Forestry and Other
Land Use (AFOLU), which aims to harmonize methods
for soil C and GHG accounting across all land uses. In
this paper, we focus on assessing changes in soil C.
Our objective is to review the current availability of
data to support application of the IPCC methods in
various regions of the world. The required data
include spatial climate, soil, vegetation and land
cover and land use and management datasets, and
measurements of soil C stock changes and CO2 fluxes
from various experiments and networks. We discuss
the availability of these data in the context of meth-
ods that can be applied at the three methodological
tiers provided by the IPCC. Given the current capa-
bility, we provide a short and longer term vision for
the future that would allow for soil C estimation
using the greater rigour of the IPCC Tier 2 and 3
methods. Progression to the higher tiers will provide
more accuracy and precision for quantifying the con-
tribution of soils to the global C and nitrogen cycles,
and support a growing number of policies influencing
C stock changes due to land use and management
activity.
© 2012 Blackwell Publishing Ltd, Global Change Biology, doi: 10.1111/j.1365-2486.2012.02689.x
2 P. SMITH et al.

Spatial data necessary for a soil C monitoring and
accounting framework
Estimating soil C stock changes using Tier 2 or model-
based Tier 3 methods requires country-specific data on
the factors that govern C stock: first, the fundamental
edaphic and climatic factors that determine organic
matter inputs and turnover rates, and second, the
anthropogenic factors that modify their influence, that
is, land management and land use change. Tier 1 meth-
ods utilize simplified relationships between these driv-
ers, provided by the IPCC (2006a,b,c), and therefore
application of Tier 1 methods requires only land use,
soil type, and broad climatic data. Global datasets exist
for some of these factors, but the quality is variable,
and the coverage for some attributes such as land man-
agement is limited to developed countries. In this sec-
tion, we review data availability and the consequences
for application of higher Tier IPCC methods.
Global climate/weather data
IPCC Tier 2 methods require a classification of climate,
while most soil carbon models that could be used in a
Tier 3 method work on a monthly basis and need
monthly weather inputs. Availability of global climate
and monthly weather data has improved dramatically
over the last few years. Several on-line databases are
available, for example WorldClim, NEO and CRU.
WorldClim is a set of global climate layers (climate
grids) with a spatial resolution of a square kilometre
(Hijmans et al., 2005). The database presents spatially
interpolated weather data of the last 50 years and also
projections to the future based on IPCC AR4. NEO also
provides other remotely sensed observation, for exam-
ple concerning vegetation in addition to the most
important climatic variables. Some of these datasets go
back to 1880 and the resolution of these data differs
with the highest spatial resolution of a square kilome-
tre. The CRU dataset is a lower resolution dataset of
only 0.5 degree but supplies data back to 1901. Tempo-
rally more detailed historical climate data from 1971
onwards can be accessed through results of the ERA40
project (Dee et al., 2011). In general, there are sufficient
climate or weather data available for developing a Tier
2 or 3 method for soil C.
Global soil datasets
IPCC Tier 2 methods require taxonomic data to classify
soils into general categories for assignment of EFs. Soils
data are used in most soil carbon models that could be
used in Tier 3 methods to simulate key processes influ-
encing carbon dynamics. In particular, the influence of
texture on microbial decomposition is represented in
many models (e.g. Jenkinson & Rayner, 1977; Parton
et al., 1987). Soils data can also provide information on
soil C stocks which can be useful for Tier 2 methods
(IPCC, 2006b). There are several global datasets that
include estimates of soil C to a depth of 1 m, though
these are not all fully independent from each other.
Generally, there are two different approaches to creat-
ing such datasets: (1) estimation of C stocks under natu-
ral, or mostly undisturbed, vegetation using climate
and ecological life zones (e.g. Zinke et al., 1984; Siltanen
et al., 1997); (2) extrapolation of soil C data from
measurement in soil profiles using soil type (FAO-
UNESCO), e.g. IGBP-DIS, NRCS and WISE, the
Harmonised World Soils Database (HWSD).
The HWSD is the most recent, highest resolution glo-
bal soils dataset available. It was compiled by the Food
and Agriculture Organization of the United Nations
(FAO) and the International Institute for Applied
Systems Analysis (IIASA) and uses vast volumes of
recently collected regional and national soil infor-
mation to supplement the 1 : 5 000 000 scale FAO-
UNESCO Digital Soil Map of the World (FAO/IIASA/
ISRIC/ISS-CAS/JRC, 2009 – see Supporting Informa-
tion, Appendix S1). The HWSD combines the FAO Soil
Map of the World, regional SOTER databases, the Euro-
pean Soils Database, the Northern Circumpolar Soil
Map, the Soil Map of China 1 : 1 Million scale and ver-
sion 2 of the WISE database. It provides soil parameter
estimates for topsoil (0–30 cm) and subsoil (30–100 cm), at (maximum) 30 arc-second resolution aggre-
gated to 16112 soil mapping units (SMUs; Appendix
S1). Work is ongoing to create new global, high-resolu-
tion soil property maps under the GlobalSoilMap.net
project, and could provide an even global better soil
map (Sanchez et al., 2009).
Generally, the soil databases are based on a limited
number of soil profiles and extrapolated to other areas
according to soil type. Climate or land cover and man-
agement are usually not considered so that these data
have high associated uncertainty. These datasets give
the best available estimate at a global scale, but at
regional scale, the use of local data is preferable
Table 1.
Global land use/land cover/vegetation datasets
Land use and land use change probably have the most
significant impact on the C stock changes in managed
land (Houghton et al., 1983; IPCC, 2000). Therefore,
land use is a key variable in any approach to estimating
changes in soil C stocks, regardless of the Tier (IPCC,
2006b). Land cover maps are often used to determine
land use and land use transitions. Freely available land
© 2012 Blackwell Publishing Ltd, Global Change Biology, doi: 10.1111/j.1365-2486.2012.02689.x
A GLOBAL FRAMEWORK FOR ESTIMATING SOIL C 3

cover datasets are shown in Table 2 and these were
reviewed by Mccallum et al. (2006).
The most recent land cover project is GLOBCOVER
which uses MERIS image data from 2005 and 2006 and
has a spatial resolution of 300 m. It builds on a thor-
ough understanding of existing datasets (Table 2), with
the aim of updating and complementing these. Cur-
rently the most recent data is from 2009 released at the
end of 2010 as version 2.3. GLOBCOVER has only been
made available recently. Several of the categories in the
GLOBCOVER product are mixtures of different land
uses, which may limit its utility for determining land
use change with high levels of accuracy.
Land cover maps are often used to determine land
use and land use change transitions. For this purpose
Ramankutty & Foley (1998) developed time series of
historical cropland and pasture data from 1700 to 2007,
which has recently been fully revised. Further, there
are a variety of future land use scenarios available to
the year 2100, for example in preparation for the
fifth Assessment Report (AR5) (http://luh.unh.edu/).
As with soils, there have been attempts to produce
harmonized land cover datasets (Jung et al., 2006; Gold-
ewijk et al., 2007; Ramankutty et al., 2008). Jung et al.
(2006) developed the land cover map SYNMAP by syn-
thesizing GLCC-IGBP, GLC2000 and MODIS. This was
specifically designed for C cycling but has not been as
fully validated as the land cover maps it is based on.
Ramankutty et al. (2008) produced a validated map
using the MODIS and GLC2000 land cover products.
These were combined and validated against agricul-
tural statistical data available from 15 990 administra-
tive units, thus providing validation at a local/regional
level. It is also a considerable improvement to an earlier
effort by the same group (Ramankutty & Foley, 1998).
Goldewijk et al. (2007) created a map using the same
approach, but based on GLCC-IGBP and GLC2000 and
using FAO statistics only. A drawback of both of these
maps is that they have the much coarser resolution of
5 min, compared to the 1 km2 of MODIS and GLC2000.
The sources of variability between land cover maps
have been summarized by Jung et al. (2006), which
includes sensor capabilities, raw data processing,
acquisition period, classification system (land cover
legend), selection of input data for classification, classi-
fication procedure and validation of the final product.
The classification system contributes considerably to
differences between the maps as land cover types are
based on different thresholds, so that, for example,
GLC2000 requires a tree cover of 60% whereas MODIS
only requires a tree cover of 15% to assign the land
cover type as forest (Fritz & See, 2008). Consequently,
there will probably be more forest cover when using
MODIS as input, although there is no difference in the
remotely sensed raw data. This is important when
assessing differences among land cover maps. The
impact on the use of different land use and land cover
inputs on the resulting model output needs to be
assessed.
There is no perfect global land cover map as different
regions will be best represented by different products
(Fritz et al., 2008); recent efforts have begun to produce
regional land cover maps, such as FAO’s Africover pro-
ject. The best suited land cover map may also depend
on its purpose. Land cover maps should be evaluated
in conjunction with vegetation biomass C, since this
will be an important parameter in any framework to
estimate changes in total ecosystem C.
Estimates of vegetation biomass and C (which could
be used by some soil C models) are often derived from
land cover datasets. Consequently, any uncertainties
related to land cover will have a direct effect on bio-
mass estimates. Vegetation biomass is greatest in for-
ests. In contrast, only a small proportion of C stock in
croplands is contained in vegetation. Vegetation C is
not only determined by the forest area. Other factors
Table 1 Freely available global soil datasets (see Appendix
S1 for list of acronyms and abbreviations)
Product Year Format
HWSD 2009 0.3 and 1 m depth at 30 arc-second
resolution
WISE ver1 2006 20 cm intervals up to 1 m depth at
5 min resolution
WISE ver3 2005 0.3 and 1 m depth at 30 min resolution
NRCS 2000 1 m depth at 2 min resolution
IGBP-DIS 2000 1 m depth at 5 min resolution
Zinke et al. 1984 Soil profiles
Siltanen et al. 1997 Soil profiles
Table 2 Freely available global land cover/land use/vegeta-
tion cover datasets (see Appendix S1 for list of acronyms and
abbreviations)
Product Year Data type
Goldewijk et al. (2007) 2007 % cropland and pasture
Ramankutty & Foley
(1998)
1700–2007 % cropland and pasture
GLOBCOVER 2007 Landcover
MODIS (MOD44b) 2006 % forest
MODIS (BU) 2000 Landcover
GLC2000 2000 Landcover
FRA2010 2000 % forest
UMD 1992 Landcover
GLCC_IGBP 1992 Landcover
© 2012 Blackwell Publishing Ltd, Global Change Biology, doi: 10.1111/j.1365-2486.2012.02689.x
4 P. SMITH et al.

include, for example, selective wood harvest and forest
fragmentation (Houghton, 2005). This alone can make a
large difference as Pinard & Putz (1996) found in
Borneo. Here, average aboveground biomass have
been found to be 400 Mg ha�1 for undisturbed/well
managed forests and 200 Mg ha�1 for degraded/badly
managed forests (Pinard & Putz, 1996). Kindermann
et al. (2008) recently used aggregated results from the
country-level global Forest Resources Assessment from
2005 (FRA 2005) to produce the first half degree global
spatial forest dataset. They integrated NPP, a factor for
human influence, FRA statistics, GLC2000 land cover
and CIESIN land area to map forest biomass and C
stocks (Kindermann et al., 2008) (data available at:
http://www.iiasa.ac.at.Research/FOR). Generally, the
available land cover data is sufficient for Tier 2 and Tier
3 methods. However, the high sensitivity of C stocks
to land use change would make it preferable to use
information at a regional/local scale if available.
Global land management data
Although management does not typically have as large
an impact on soil C stocks as land use change, the influ-
ence is not insignificant and forms the basis for much
of interest in C sequestration and possible credits for
mitigation of greenhouse gas emissions (Smith et al.,
2007). While opportunities exist to improve manage-
ment, accounting for these impacts requires sufficient
activity data on past and current management activity.
Management activity data required for soil C estima-
tion at the Tier 1 and 2 levels include crop type and
rotation; mineral and organic fertilizer usage, tillage
practices, irrigation management, lime applications,
use of bare or vegetated fallows or cover crops in rota-
tions (IPCC, 2006b). The Tier 3 inputs will typically be
more detailed, including factors such as planting and
harvest schedules, specific rates of fertilization and lim-
ing, as well as irrigation timing and rates. Although
some data rich regions, such as the United States (Ogle
et al., 2010) and Europe (Leip et al., 2008), have begun
to compile this information, it can only be inferred at
poor spatial resolution from country-level statistics
(e.g. for nitrogen fertilization rates) or not at all (e.g. till-
age practice) in many less-developed regions. This
remains a large source of uncertainty for developing a
soil C estimation system at the global scale, and a
gap that global organizations such as the UN Food
and Agriculture Organisation (FAO) are keen to fill
(Francesco Tubiello, personal communication); FAO is
supporting WOCAT (World Overview of Conservation
Approaches and Technologies) to develop a global map
of sustainable land management implementation
(Liniger & Critchley, 2007).
Data used for developing and testing Tier 2 and 3
methods and models
Long-term soil experiments
Experimental and monitoring data provide the basis for
our understanding of land use change and manage-
ment impacts on soil C dynamics. Soil C stocks change
in response to the balance between C inputs and out-
puts (Smith & Fang, 2010). The inputs are driven pri-
marily by the net primary production and external
additions of C such as organic amendments, while the
outputs are largely driven by the rate of microbial
decomposition. Our mechanistic understanding of
these processes is based on laboratory and field studies,
but ultimately the latter is needed to parameterize and
evaluate models for the Tier 3 methods, and also to
derive regionally specific EFs for Tier 2 methods (see
examples in Ogle et al., 2005, 2006; Maia et al., 2010a).
Field experiments date from the 19th century and for
the last several decades, results of several dozen of
these field studies have been instrumental to improving
competence and performance of global C models and
in helping to better resolve human effects on soil C stor-
age. These field studies have a limited history of net-
working and collaboration but in the late 20th century,
several attempts were made to promote such interac-
tions (Barnett et al., 1995); most notably with respect to
soil C were the SOMNET and EuroSOMNET programs,
two ambitious attempts to couple long-term observa-
tional data with C-cycle models to promote the science
of C modelling and better resolve agriculture’s role in
contributing to atmospheric CO2 (Smith et al., 1997a,
2000). SOMNET evolved into an on-line, real-time
inventory project with a web-site known as LTSEs,
Long-Term Soil-Ecosystems Experiments, which now
has collected metadata on well over 200 long-term soil
experiments (http://ltse.env.duke.edu/), in an effort
described in Richter et al. (2007).
Two firm conclusions can be reached from a review
of the LTSE inventory and metadata of the world’s soil
field studies (Richter & Yaalon, in press). First is how
valuable the world’s long-term field studies are for our
understanding of soil and of soil’s sustainability. The
second is a much more sobering conclusion. For as
valuable as these field studies are, they can be useful to
the larger global framework for only some questions
about soil C. Nearly all (>80%) of the world’s long-term
field studies address agricultural research questions,
and the preponderance of the field studies test agricul-
tural questions in the temperate zone. Land use change
can have a large influence on both the C inputs and out-
puts to soils, but there are few field experiments evalu-
ating the impact of land use change on soil C, and the
© 2012 Blackwell Publishing Ltd, Global Change Biology, doi: 10.1111/j.1365-2486.2012.02689.x
A GLOBAL FRAMEWORK FOR ESTIMATING SOIL C 5

majority have been conducted in North America
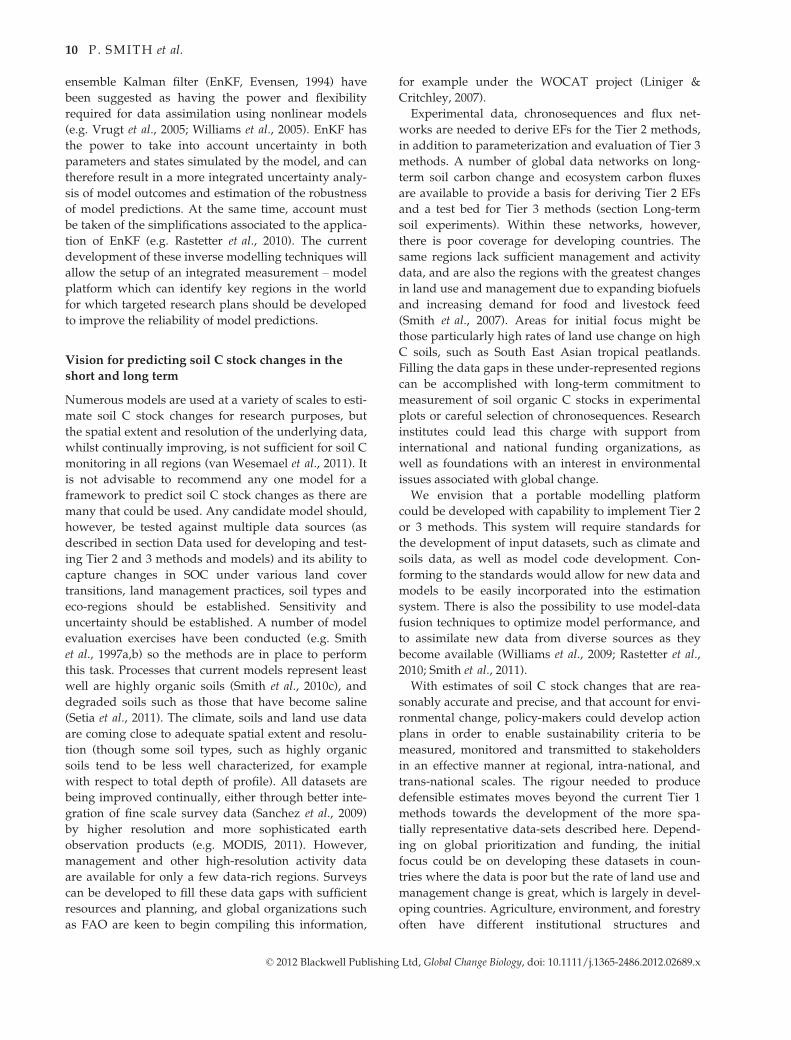
(Fig. 1a). Agronomic practices can also influence soil C
stocks, such as crop selection and rotation; tillage
and residue management; nutrient management and
organic amendments; water management (irrigation
and drainage); temporary set-aside of cropland in
reserve; and agroforestry (Smith et al., 2007, 2008a). Till-
age and residue management experiments evaluating
the impact on soil C stocks are more widely distributed
than the land use studies, with relatively high densities
in North America (Paustian et al., 1997), Europe (Smith
et al., 2002), southern South America and eastern
Australia (Fig. 1b). Experiments evaluating the influ-
ence of other agronomic practices are also relatively
common in the same regions (Fig. 1c).
Chronosequence soil C data
Medium-term, and especially long-term, studies are the
gold standard for accurately estimating changes in soil
C stocks and of immense value to parameterize and
evaluate models. They do however have some limita-
tions. Often the crop rotations in the experiments and
their management do not represent on-farm reality and
there are very few experiments undertaken at a scale
that encompasses variation in land form, altitude, soil
type and climatic conditions. For this reason the use of
on-farm studies using chronosequences combined with
appropriate modelling, is another suitable strategy for
assessing soil-C stock changes on the scale of individual
properties or groups of smallholders (e.g. Bayer et al.,
2000; Amado et al., 2001; Machado & Silva, 2001; Freixo
et al., 2002; Sisti et al., 2004; Jantalia et al., 2007; Boddey
et al., 2010).
The chronosequence approach uses a series of sites
on which the current land use has been undertaken for
different time periods, in lieu of repeated measure-
ments over time. Sites are selected that have the same
underlying features (soil type, landscape position) and
the same land use history prior to conversion to the
current land use. Therefore, it is assumed that the C
stocks before the change in/management were identi-
cal. Equivalence of the sites can be tested by examining
similarities in soil texture (e.g. Moraes et al., 1996;
Jantalia et al., 2007), bulk density (S. P. Braz, unpub-
lished data) or 13C natural abundance of C in the profile
as an indicator of the similarity to the original vegeta-
tion (Cerri et al., 1985). However, land use and manage-
ment history prior to the adoption of the crop/
management practice of interest in the chronosequence
can be difficult to determine in some cases, and will
lead to uncertainty when using these data for model
evaluation. Similar limitations arise from other site-
level monitoring approaches, where soil C stock
changes are measured over time along with quantifica-
tion of land use and management activities, but outside
of a controlled experimental environment. Such ‘low-
tech’ approaches are actively being discussed in the
research and policy communities, so need to be consid-
ered. Whilst such approaches do not provide the same
quality of data as do controlled experiments, a wide
distribution of such sites could complement research at
experimental sites, trading data quality for wider
spatial coverage.
Long-term data on ecosystem C fluxes
Another source of experimental data is the FLUXNET
global network of micrometeorological tower sites that
use eddy covariance methods to measure the exchanges
of carbon dioxide, water vapour, and energy between
terrestrial ecosystems and the atmosphere (FLUXNET,
2011). More than 500 tower sites from about 30 regional
networks across five continents are currently operating
on a long-term basis (Fig. 1d). The main aim of FLUX-
NET is to provide information for validating remote
sensing products for net primary productivity (NPP),
evaporation, and energy absorption, but the data have
been used extensively in model calibration (Rastetter
et al., 2010) and model testing (Morales et al., 2005; Wat-
tenbach et al., 2010). The FLUXNET website (FLUX-
NET, 2011) provides information about tower location,
site characteristics, data availability, and where to
obtain the data, and also provides links to the many
publications utilizing FLUXNET data, which have been
used in many global level analyses of terrestrial C
fluxes (e.g. Stoy et al., 2009). FLUXNET data have
improved our understanding of ecosystem C fluxes, but
in this context, these data are most valuable in testing of
soil C models for evaluating net primary production
and carbon inputs to soils that are predicted by the Tier
3 methods. Estimation of soil C stock changes from the
towers is indirect and highly uncertain due to the small
net change in soil C pools relative to the biomass and
litter over the time frame of most flux data currently
available (annual to a few years; Smith et al., 2008b),
and because it can be difficult to attribute measured dif-
ferences to different drivers. Despite the uncertainties
in flux measurements, and the desirability of supple-
mentary measures (SOC change, soil respiration, etc.) at
these sites (Smith et al., 2010a), ecosystem C flux
measurements have proved extremely useful if model
testing and development (e.g. Morales et al., 2005).
Data gaps for long-term data
There are additional experiments in other regions, such
as China (e.g. Yan et al., 2011) and India (Pathak et al.,
© 2012 Blackwell Publishing Ltd, Global Change Biology, doi: 10.1111/j.1365-2486.2012.02689.x
6 P. SMITH et al.

(a)
(b)
(c)
(d)
Fig. 1 (a) Distribution of land use change experiments evaluating the impact on soil C stocks. (b) The distribution of tillage experi-
ments evaluating the impacts on soil C stocks. (c) Distribution of experiments evaluating the influence of different agronomic practices
on soil C stocks. (d) Distribution of FLUXNET flux sites.
© 2012 Blackwell Publishing Ltd, Global Change Biology, doi: 10.1111/j.1365-2486.2012.02689.x
A GLOBAL FRAMEWORK FOR ESTIMATING SOIL C 7

2011), but there appear to be a few studies in the south-
ern hemisphere, particularly in the tropical latitudes,
and there are also considerably larger uncertainties in
estimating soil C stock changes in these regions, espe-
cially with the Tier 1 method (Ogle et al., 2005; IPCC,
2006b) due to sparse data coverage. Moreover, much of
the expansion in bioenergy and traditional commodity
crop production is likely to occur in these regions
(Smith et al., 2010b). Therefore, the global framework
will need to champion the great need to substantiate
and expand the application of field studies to the devel-
oping world, with contemporary agricultural systems,
and to nonagricultural land uses as well (Richter &
Yaalon, in press). In the best of all worlds, dedicated
field experimentalists with guidance from modellers
and quantitative ecologists could have several dozen
new high-impact field studies with two decades of
observational data by the year 2035. Instead of confin-
ing our understanding largely to soil C dynamics in the
temperate region, by 2035, scientists could substantially
increase the certainties about soil C changes across a
wide range of ecosystems and land uses, from the bor-
eal zone to the tropics, from contemporary agricultural
systems to urban and residential influences.
Data on short-term C fluxes
Short-term in situ experiments concerning the fate of
recently assimilated C to the belowground components
of root, soil and microbial pools can yield valuable data
required for predicting ecosystem respiration fluxes.
Under land use and management change, these pools
are not in equilibrium and an important experimental
challenge therefore is to quantify the residence and tra-
jectory of C in these pools. Many C allocation studies
that have focused on land use change and management
have taken advantage of stable C isotope tracer
approaches to achieve this (e.g. Johnson et al., 2002;
Rangel-Castro et al., 2004; Leake et al., 2006; Wang et al.,
2007; Ward et al., 2009; De Deyn et al., 2011). The most
common field approach is through the exposure of
plants to isotopically enriched 13C in CO2 at ambient
(Ostle et al., 2000; De Deyn et al., 2011) or above ambi-
ent concentrations (Hogberg et al., 2008; Ward et al.,
2009) for several hours in chambers or tents. The photo-
assimilation of 13CO2 during this pulse labelling is then
tracked through soil and plant materials and into respi-
ratory fluxes during the following days to months. The
technique has often been referred to as the ‘13CO2 pulse
chase’ approach due to the intensive nature of the field
sampling that follows the isotope addition. For land
use change and management studies this 13C approach
has primarily been used for grassland and peatland
ecosystems with short stature vegetation (Johnson et al.,
2002; Rangel-Castro et al., 2004; Leake et al., 2006; Wang
et al., 2007; Ward et al., 2009; De Deyn et al., 2011).
However, recent 13C pulse chase experiments on whole
tree (Hogberg et al., 2008; Epron et al., 2011), crowns of
trees (Plain et al., 2009; Dannoura et al., 2011) and large
energy crop grass (Travi et al., 2009) have demonstrated
the application of this technique in taller vegetation
systems.
The short-term 13C tracer approach does not overide
the utility of using long-term monitoring networks or
space-for-time experiments (i.e. chronosequences);
rather, it provides a new level of process information
for calibration and verification of ecosystem C models,
which will be used in Tier 3 methods. The 13C pulse
chase approach provides valuable data for C allocation
to belowground ecosystem components (Epron et al.,
2011); the contribution of photosynthate to heterotro-
phic and autotrophic fluxes (Subke et al., 2009); time
lags between assimilation and soil respiration (Bahn
et al., 2009) and the transfer of C to microbial and fun-
gal pathways (Ostle et al., 2003; Leake et al., 2006). A
potential limitation of the approach, being short term in
nature, is that several hours of 13CO2 exposure may not
introduce a measurable amount of new C into more
recalcitrant soil pools (Carbone et al., 2007; Carbone &
Trumbore, 2007; Kuzyakov, 2011). However, 13CO2
additions over extended periods of time (days to
months in FACE or large chamber experiments) or
using very low and safe levels of radioactive 14CO2
tracers in combination with measurements by Acceler-
ated Mass Spectrometry can override these limitations
(Carbone et al., 2007; Carbone & Trumbore, 2007).
Application of methods for soil C accounting
Existing Tier 2 and Tier 3 methods
IPCC Tier 2 or 3 methods are both possibilities for
advancing soil C accounting. For a Tier 2 method, mea-
surements are typically combined from several sites to
estimate an EF specific to a region or country (e.g. Van-
denbygaart et al., 2004; Ogle et al., 2006; Maia et al.,
2010b). Meta-analytic approaches can be used to derive
factors and estimate uncertainty in the resulting factors
(Maia et al., 2010a). Sufficient measurements are needed
to estimate EFs, and many regions of the world cur-
rently lack the necessary measurements to estimate EFs
representing the influence of land use and management
(Fig. 1a–c).However, experiments could be designed and imple-
mented within the next decade that could form the
basis for advancing Tier 2 methods. Sufficient land use
data are also probably available to support Tier 2 meth-
ods, or could be developed from existing remote
© 2012 Blackwell Publishing Ltd, Global Change Biology, doi: 10.1111/j.1365-2486.2012.02689.x
8 P. SMITH et al.

sensing imagery archives. Weather and soils data are
also likely to be available. Land management data are
more problematic because much of these data are not
collected in surveys. As with gaps in experimental data,
surveys could be developed and implemented within
the next decade to provide this information. WOCAT
has developed a standard land management survey
system, and is assembling relevant databases. Expert
knowledge could also be used in the short-term to fill
activity data gaps (IPCC, 2006a; Maia et al., 2010b).
Remote imaging spectroscopy has also shown promise
in estimating crop residue quantity and inferring tillage
intensity (Serbin et al., 2009), and can provide other
information, such as the crop species present, pres-
ence/absence of fallow season cover crops, presence/
absence of irrigation and estimation of above-ground
biomass and productivity, all of which are useful as
inputs for soil C models.
Tier 3 methods are likely to produce more precise
and accurate results, compared to Tier 2 methods,
which in turn are likely more accurate and precise than
Tier 1 methods. For example, Del Grosso et al. (2011)
compared results from Tier 1, Tier 2 and Tier 3 methods
(CENTURY) that were applied to US agricultural lands
(Ogle et al., 2006, 2010), and found that the Tier 3
method using a process-based model produced esti-
mates with a precision of ±16%, compared to ±40% and
±59% for estimates derived with Tier 2 and 1 methods,
respectively. Several process-based models exist that
could be used in a Tier 3 method, such as CENTURY
(Parton et al., 1987; Ogle et al., 2010), RothC (Coleman
& Jenkinson, 1996; Jenkinson & Rayner, 1977), EPIC-
CENTURY (Izaurralde et al., 2007), DNDC (Li et al.,
2003) and many others. Over 10 years ago, Smith (2002)
reviewed 33 SOC models which could be adapted for
use in such a framework, and more models (and deri-
vations of earlier models) have become available since.
Some systems already exist for regional application
such as Austrialia’s Tier 3 national inventory which
uses RothC (Paul & Polglase, 2004), and the GEFSOC
system which uses RothC and CENTURY (Easter et al.,
2007). Many potential Tier 3 models have been tested
for their ability to characterize changes in soil carbon
(e.g. Smith et al., 1997b). Whilst models vary in their
performance, and in the degree of parameterization
they require, many have been shown to reproduce
historical changes effectively (Smith et al., 1997b;
Izaurralde et al., 2007). Data is critical for both model
testing and, where necessary, for model parameteriza-
tion and calibration.
Process-based models rely on measurements for
parameterization and evaluation of model results
(IPCC, 2006a), and measurements can be used to quan-
tify uncertainties in model parameterization and algo-
rithms (e.g. Ogle et al., 2010). Consequently, a sufficient
number of experiments must be available for this pur-
pose and many regions of the world lack the necessary
data at this time (Fig. 1a–c). Assuming model evalua-
tion is possible and the results are adequate, the models
can be used to estimate dynamic EFs that change
through time and space, based on current process-level
understanding of C dynamics. This contrasts with the
Tier 2 method which utilizes experimental data or mod-
els to calculate a country or region-specific emissions
factor, which is then applied across a region or through
time. In contrast to Tier 2, the Tier 3 method requires
considerably more activity data, and this will probably
be the greatest limitation to applying the highest Tier
method. Activity data may include planting and har-
vesting dates, tillage implements and passes, organic
and synthetic fertilization rates, irrigation timing and
rates, in addition to crop types, rotation practices and
other data required for the Tier 2 method. Surveys can
be developed to fill these data gaps with sufficient
resources and planning, as planned under WOCAT
(see section Global land management data).
Advancing Tier 3 methods with models that can learn
Recent years have seen important advances in methods
to improve the estimation of model parameters, and the
quantification of model uncertainty, the latter deter-
mined both by uncertainty in parameters but also in
process descriptions (e.g. Fox et al., 2009). These meth-
ods can be used to advance Tier 3 methods by assessing
the robustness of process-based model outcomes, and
identifying the entry points to improve their perfor-
mance and reliability. Parameter estimation using
inverse modelling (i.e. the process of iteratively adjust-
ing model parameters so that the model approximates,
as closely and consistently as possible, the observed
response of the system under study during some histor-
ical period of time; Vrugt et al., 2005) accommodates
more flexible experimental conditions than typically
available in laboratory experiments and thereby facili-
tates estimating values of soil properties associated to
the scale of interest. These inverse modelling methods
can be completely automated, although at the cost of a
substantial amount of computer power. An important
weaknesses of these calibration methods is that they
attribute all model uncertainty to the model parame-
ters, often without an explicit treatment of input, out-
put, and model structural uncertainties. In the past few
years, ensemble-forecasting techniques based on
sequential data assimilation methods have become
increasingly popular due to their potential ability to
explicitly handle the various sources of uncertainty in
geophysical modelling. Techniques based on the
© 2012 Blackwell Publishing Ltd, Global Change Biology, doi: 10.1111/j.1365-2486.2012.02689.x
A GLOBAL FRAMEWORK FOR ESTIMATING SOIL C 9
ensemble Kalman filter (EnKF, Evensen, 1994) have
been suggested as having the power and flexibility
required for data assimilation using nonlinear models
(e.g. Vrugt et al., 2005; Williams et al., 2005). EnKF has
the power to take into account uncertainty in both
parameters and states simulated by the model, and can
therefore result in a more integrated uncertainty analy-
sis of model outcomes and estimation of the robustness
of model predictions. At the same time, account must
be taken of the simplifications associated to the applica-
tion of EnKF (e.g. Rastetter et al., 2010). The current
development of these inverse modelling techniques will
allow the setup of an integrated measurement – model
platform which can identify key regions in the world
for which targeted research plans should be developed
to improve the reliability of model predictions.
Vision for predicting soil C stock changes in the
short and long term
Numerous models are used at a variety of scales to esti-
mate soil C stock changes for research purposes, but
the spatial extent and resolution of the underlying data,
whilst continually improving, is not sufficient for soil C
monitoring in all regions (van Wesemael et al., 2011). It
is not advisable to recommend any one model for a
framework to predict soil C stock changes as there are
many that could be used. Any candidate model should,
however, be tested against multiple data sources (as
described in section Data used for developing and test-
ing Tier 2 and 3 methods and models) and its ability to
capture changes in SOC under various land cover
transitions, land management practices, soil types and
eco-regions should be established. Sensitivity and
uncertainty should be established. A number of model
evaluation exercises have been conducted (e.g. Smith
et al., 1997a,b) so the methods are in place to perform
this task. Processes that current models represent least
well are highly organic soils (Smith et al., 2010c), and
degraded soils such as those that have become saline
(Setia et al., 2011). The climate, soils and land use data
are coming close to adequate spatial extent and resolu-
tion (though some soil types, such as highly organic
soils tend to be less well characterized, for example
with respect to total depth of profile). All datasets are
being improved continually, either through better inte-
gration of fine scale survey data (Sanchez et al., 2009)
by higher resolution and more sophisticated earth
observation products (e.g. MODIS, 2011). However,
management and other high-resolution activity data
are available for only a few data-rich regions. Surveys
can be developed to fill these data gaps with sufficient
resources and planning, and global organizations such
as FAO are keen to begin compiling this information,
for example under the WOCAT project (Liniger &
Critchley, 2007).
Experimental data, chronosequences and flux net-
works are needed to derive EFs for the Tier 2 methods,
in addition to parameterization and evaluation of Tier 3
methods. A number of global data networks on long-
term soil carbon change and ecosystem carbon fluxes
are available to provide a basis for deriving Tier 2 EFs
and a test bed for Tier 3 methods (section Long-term
soil experiments). Within these networks, however,
there is poor coverage for developing countries. The
same regions lack sufficient management and activity
data, and are also the regions with the greatest changes
in land use and management due to expanding biofuels
and increasing demand for food and livestock feed
(Smith et al., 2007). Areas for initial focus might be
those particularly high rates of land use change on high
C soils, such as South East Asian tropical peatlands.
Filling the data gaps in these under-represented regions
can be accomplished with long-term commitment to
measurement of soil organic C stocks in experimental
plots or careful selection of chronosequences. Research
institutes could lead this charge with support from
international and national funding organizations, as
well as foundations with an interest in environmental
issues associated with global change.
We envision that a portable modelling platform
could be developed with capability to implement Tier 2
or 3 methods. This system will require standards for
the development of input datasets, such as climate and
soils data, as well as model code development. Con-
forming to the standards would allow for new data and
models to be easily incorporated into the estimation
system. There is also the possibility to use model-data
fusion techniques to optimize model performance, and
to assimilate new data from diverse sources as they
become available (Williams et al., 2009; Rastetter et al.,
2010; Smith et al., 2011).
With estimates of soil C stock changes that are rea-
sonably accurate and precise, and that account for envi-
ronmental change, policy-makers could develop action
plans in order to enable sustainability criteria to be
measured, monitored and transmitted to stakeholders
in an effective manner at regional, intra-national, and
trans-national scales. The rigour needed to produce
defensible estimates moves beyond the current Tier 1
methods towards the development of the more spa-
tially representative data-sets described here. Depend-
ing on global prioritization and funding, the initial
focus could be on developing these datasets in coun-
tries where the data is poor but the rate of land use and
management change is great, which is largely in devel-
oping countries. Agriculture, environment, and forestry
often have different institutional structures and
© 2012 Blackwell Publishing Ltd, Global Change Biology, doi: 10.1111/j.1365-2486.2012.02689.x
10 P. SMITH et al.
funding channels with the implication that data needs
are addressed separately. Success would, however, be
more likely if actions were coordinated across national
(e.g. national agricultural centres of excellence, depart-
ments for foreign and international development) and
transnational (World Bank, UN, IPCC, IEA, G20, World
Economic Forum, etc.) groups. There is potential to
pool resources from several quarters to aid this endeav-
our: Maintenance of SOC is recognized as critical for
sustainable land management, and therefore to manag-
ing land degradation and biodiversity conservation; the
UNCCD and CBD have both identified the need to
monitor soil C as an indicator of sustainable land man-
agement, and the benefits of combining effort and
resources to build capacity for monitoring soil C under
the three major environmental conventions have been
noted (Cowie et al., 2011).
The importance of this endeavour should not be
under-estimated. Without sufficient progress on filling
the gaps identified, it is unlikely that policies and pro-
grams that encourage expansion of biofuel production,
changes in land use and management to meet future
food security demands, or use for conservation, will
account for the impact on soil carbon stocks. At best,
the uncertainties will be much greater, as the alterna-
tive would be a systematic application of Tier 1. The
methods and data necessary to meet this vision are in
various states of readiness, and a blend of public, pri-
vate and development funding, especially in under-
represented regions, would yield great benefits in terms
of our ability to quantify the changes in carbon, that
have confounded our ability to deliver consistent
policies in the past (e.g. Searchinger et al., 2008).
Acknowledgements
We are grateful to the UK Biotechnology and Biological SciencesResearch Council (BBSRC) and the Energy Technologies Insti-tute (ETI) for co-funding the expert meeting at Rothamsted inthe United Kingdom, in March 2011, from which this paperarose. Pete Smith is a Royal Society-Wolfson Research MeritAward holder. We thank Dr Dario Papale for location data ofFluxnet sites used in Fig. 1d and Dr Jim Penman of DECC forhelpful comments on early drafts, and three anonymousreviewers for comments that helped us to improve themanuscript.
References
Amado TJC, Bayer C, Eltz FLF, Brum AC (2001) Potencial de culturas de cobertura
em acumular carbono e nitrogenio no solo no plantio direto e a melhoria da quilid-
ade ambiental. Revista Brasileira da Ciencia do Solo, 25, 189–197.
Bahn M, Schmitt M, Siegwolf R, Bruggemann N (2009) Does photosynthesis affect
grassland soil-respired CO2 and its carbon isotope composition on a diurnal time-
scale? New Phytologist, 182, 451–460.
Barnett V, Payne R, Steiner R (1995) Agricultural Sustainability. John Wiley & Sons,
New York.
Batjes NH (2009) Harmonized soil profile data for applications at global and conti-
nental scales: updates to the WISE database. Soil Use and Management, 25, 124–127.
Batjes NH (2010) IPCC Default Soil Classes Derived from the Harmonized World Soil Data
Base (Ver. 1.1). Carbon Benefits Project (CBP) and ISRIC - World Soil Information,
Wageningen, pp. 34.
Batjes NH (2011) Soil organic carbon stocks under native vegetation - revised esti-
mates for use with the simple assessment option of the Carbon Benefits Project
system. Agriculture, Ecosystems & Environment, 142, 365–373.
Bayer C, Martin-Neto L, Mielniczuk J, Ceretta CA (2000) Effect of no-till cropping sys-
tems on soil organic matter in a sandy clay loam Acrisol from Southerrn Brazil
monitored by electron spin resonance and nuclear magnetic resonance. Soil and
Tillage Research, 53, 95–104.
Boddey RM, Jantalia CP, Zanatta JA et al. (2010) Carbon accumulation at depth in
Ferralsols under zero-till subtropical agriculture in southern Brazil. Global Change
Biology, 16, 784–795.
Carbone MS, Trumbore SE (2007) Contribution of new photosynthetic assimilates to
respiration by perennial grasses and shrubs: residence times and allocation pat-
terns. New Phytologist, 176, 124–135.
Carbone MS, Czimczik CI, Mcduffee KE, Trumbore SE (2007) Allocation and resi-
dence time of photosynthetic products in a boreal forest using a low-level 14C
pulse-chase labelling technique. Global Change Biology, 13, 466–477.
Cerri CC, Feller C, Balesdent J, Victoria R, Plenecassegne A (1985) Application du
tracage isotopique naturel en 13C, a redute de la dynamique de la matiere orga-
nique dans les sols. Comptes Rendus Academie Sciences Paris Ser. D, 11, 424–428.
Coleman K, Jenkinson DS (1996) RothC26.3 A model for the turnover of carbon in
soil. In: Evaluation of Soil Organic Matter Models Using Existing Long-Term Datasets
(eds Powlson DS, Smith P, Smith JU), pp. 237–246. Springer-Verlag, Heidelberg,
Germany.
Cowie A, Penman T, Gorissen L et al. (2011) Towards sustainable land management
in the drylands: scientific connections in monitoring and assessing dryland degra-
dation, climate change and biodiversity. Land Degradation and Development, 22,
248–260.
Dannoura M, Maillard P, Fresneau C et al. (2011) In situ assessment of the velocity of
carbon transfer by tracing 13C in trunk CO2 efflux after pulse labeling: variations
among tree species and seasons. New Phytologist, 190, 181–192.
De Deyn GB, Quirk H, Oakley S, Ostle N, Bardgett RD (2011) Rapid transfer of photo-
synthetic carbon through the plant-soil system in differently managed species-rich
grasslands. Biogeosciences, 8, 1131–1139.
Dee DP, Uppala SM, Simmons AJ et al. (2011) The ERA-Interim reanalysis: configura-
tion and performance of the data assimilation system. Quarterly Journal of the Royal
Meteorological Society, 137, 553–597.
Del Grosso S, Ogle SM, Parton WJ, Breidt FJ (2010) Estimating uncertainty in N2O
emissions from US cropland soils. Global Biogeochemical Cycles, 24, GB1009, doi:
10.1029/2009GB003544.
Del Grosso SJ, Ogle SM, Parton WJ (2011) Soil organic matter cycling and greenhouse
gas accountingmethodologies, Chapter 1. In:Understanding Greenhouse Gas Emissions
from Agricultural Management (eds Guo L, Gunasekara A, McConnell L), pp. 3–13.
AmericanChemical Society,Washington, DC, doi: 10.1021/bk-2011-1072.ch001.
Doraiswamy P, Mccarty G, Huntjr E, Yost R, Doumbia M, Franzluebbers A (2007)
Modeling soil carbon sequestration in agricultural lands of Mali. Agricultural Sys-
tems, 94, 63–74.
Easter M, Paustian K, Killian K et al. (2007) The GEFSOC soil carbon modelling sys-
tem: a tool for conducting regional-scale soil carbon inventories and assessing the
impacts of land use change on soil carbon. Agriculture, Ecosystems & Environment,
122, 13–25.
Epron DM, Ngao J, Dannoura M et al. (2011) Seasonal variations of belowground car-
bon transfer assessed by in situ 13CO2 pulse labelling of tress. Biogeosciences, 8,
1153–1168.
Evensen G (1994) Sequential data assimilation with a nonlinear quasi geostrophic
model using Monte Carlo methods to forecast error statistics. Journal of Geophysical
Research, 99, 10143–10162.
Fox A, Williams M, Richardson AD et al. (2009) The REFLEX project: comparing dif-
ferent algorithms and implementations for the inversion of a terrestrial ecosystem
model against eddy covariance data. Agricultural and Forest Meteorology, 149, 1597–
1615.
Freixo AA, Machado PLOA, Santos HPD, Silva CA, Fadigas FDS (2002) Soil organic
carbon and fractions of a Rhodic Ferrasol under the influence of tillage and crop
rotation systems in southern Brazil. Soil and Tillage Research, 64, 221–230.
Fritz S, See L (2008) Identifying and quantifying uncertainty and spatial disagreement
in the comparison of Global Land Cover for different applications. Global Change
Biology, 14, 1057–1075.
© 2012 Blackwell Publishing Ltd, Global Change Biology, doi: 10.1111/j.1365-2486.2012.02689.x
A GLOBAL FRAMEWORK FOR ESTIMATING SOIL C 11

Fritz S, See L, Rembold F (2008) Comparison of global and regional land cover maps
with statistical information for the agricultural domain in Africa. International Jour-
nal of Remote Sensing, 31, 2237–2256.
Goddard T, Haugen-Kozyra K, Ridge A (2008) Alberta: North America’s first compli-
ance carbon offset market. In: Proc. Conservation Agriculture Carbon Offset Consulta-
tion. Oct. 28–30, 2008. FAO–CTIC, West Lafayette, IN, USA.
Goldewijk KK, Van Drecht G, Bouwman AF (2007) Mapping contemporary global
cropland and grassland distributions on a 5 x 5 minute resolution. Journal of Land
Use Science, 2, 167–190.
Haak D (2008) A comparison of no till protocols for agricultural carbon offset projects
in Canada. In: Proc. Conservation Agriculture Carbon Offset Consultation. Oct. 28 – 30,
2008. FAO – CTIC, West Lafayette, IN, USA.
Hijmans RJ, Cameron SE, Parra JL, Jones PJ, Jarvis A (2005) Very high resolution
interpolated climate surfaces for global land areas. International Journal of Climatol-
ogy, 25, 1965–1978.
Hogberg P, Hogberg MN, Gottlicher SG et al. (2008) High temporal resolution tracing
of photosynthate carbon from the tree canopy to forest soil microorganisms. New
Phytologist, 177, 220–228.
Houghton RA (2005) Aboveground forest biomass and the global carbon balance. Glo-
bal Change Biology, 11, 945–958.
Houghton R, Skole D (1990) Carbon. In: The Earth as Transformed by Human Action
(eds Turner S, Clark W, Kates R, Richards J, Mathcws J, Mcycrs W), pp. 393–408.
Cambridge University Press, New York.
Houghton RA, Hobbie JE, Melillo JM, Moore B, Peterson BJ, Shaver GR, Woodwell
GM (1983) Changes in the carbon content of terrestrial biota and soils between
1860 and 1980: a net release of CO2 to the atmosphere. Ecological Monographs, 53,
235–262.
IPCC (2000) Land Use, Land-Use Change, and Forestry. Cambridge University Press,
Cambridge, UK.
IPCC (2006a) Approaches to data collection. In: 2006 IPCC Guidelines for National
Greenhouse Gas Inventories (eds Eggleston H, Buendia L, Miwa K, Ngara T,
Tanabe K). Intergovernmental Panel on Climate Change, Hayama, Kanagawa, Japan.
IPCC (2006b) Generic methodologies applicable to multiple land use categories. In:
2006 IPCC Guidelines for National Greenhouse Gas Inventories (eds Eggleston H,
Buendia L, Miwa K, Ngara T, Tanabe K). Intergovernmental Panel on Climate
Change, Hayama, Kanagawa, Japan.
IPCC (2006c) Introduction to the 2006 IPCC guidelines. In: 2006 IPCC Guidelines for
National Greenhouse Gas Inventories (eds Eggleston H, Buendia L, Miwa K, Ngara T,
Tanabe K). Intergovernmental Panel on Climate Change, Hayama, Kanagawa,
Japan.
Izaurralde R, Williams J, Post WM, Thomson A, Mcgill W, Owens L, Lal R (2007)
Long term modeling of soil carbon erosion and sequestration at the small
watershed scale. Climatic Change, 80, 73–90.
Jantalia CP, Resck DVS, Alves BJR, Urquiaga S, Boddey RM (2007) Effect of tillage
intensity on carbon stocks under a soybean based crop rotation in the Brazilian
Cerrado. Soil and Tillage Research, 85, 97–109.
Jenkinson DS, Rayner JH (1977) The turnover of soil organic matter in some of the
Rothamsted classical experiments. Soil Science, 123, 298–305.
Johnson D, Leake JR, Ostle N, Ineson P, Read DJ (2002) In situ 13CO2 pulse-labelling
of upland grassland demonstrates a rapid pathway of carbon flux from arbuscular
mycorrhizal mycelia to the soil. New Phytologist, 153, 327–334.
Jung M, Henkel K, Herold M, Churkina G (2006) Exploiting synergies of global land
cover products for carbon cycle modeling. Remote Sensing of Environment, 101, 534–
553.
Kindermann GE, Mccarty GW, Fritz S, Obersteiner M (2008) A global forest growing
stock, biomass and carbon map based on FAO statistics. Silva Fennica, 42, 387–396.
Kuzyakov Y (2011) How to link soil carbon pools with CO2 fluxes? Biogeosciences, 8,
1523–1537.
Leake JR, Ostle NJ, Rangel-Castro JI, Johnson D (2006) Carbon fluxes from plants
through soil organisms determined by field 13CO2 pulse-labelling in an upland
grassland. Applied Soil Ecology, 33, 152–175.
Leip A, Marchi G, Koeble R, Kempen M, Britz W, Li C (2008) Linking an economic
model for European agriculture with a mechanistic model to estimate nitrogen
and carbon losses from arable soils in Europe. Biogeosciences, 5, 73–94.
Li CS, Zhuang YH, Frolking S et al. (2003) Modeling soil organic carbon change in
croplands of China. Global Biogeochemical Cycles, 16, doi: 10.1029/2001GB001425.
Liniger HP, Critchley W (2007) Where the Land Is Greener: Case Studies and Analysis of
Soil and Water Conservation Initiatives Worldwide (WOCAT). CTA, UNEP, FAO and
CDE, Berne, pp. 504.
Lokupitiya E, Paustian K (2006) Agricultural soil greenhouse gas emissions: a review
of National Inventory Methods. Journal of Environmental Quality, 35, 1413–1427.
Machado PLOA, Silva CA (2001) Soil management under no-tillage systems in the
tropics with special reference to Brazil. Nutrient Cycling in Agroecosystems, 61, 119–
130.
Maia SMF, Ogle SM, Cerri CC, Cerri CEP (2010a) Changes in soil organic carbon stor-
age under different agricultural management systems in the southwestern Ama-
zon region of Brazil. Soil and Tillage Research, 106, 177–184.
Maia SMF, Ogle SM, Cerri CEP, Cerri CC (2010b) Soil organic carbon stock change
due to land use activity along the agricultural frontier of the southwestern Ama-
zon, Brazil between 1970 and 2002. Global Change Biology, 16, 2775–2788.
Mccallum I, Obersteiner M, Nilsson S, Shvidenko A (2006) A spatial comparison of
four satellite derived 1 km global land cover datasets. International Journal of
Applied Earth Observation and Geoinformation, 8, 246–255.
Moraes JFLD, Volkoff B, Cerri CC, Bernoux M (1996) Soil properties under Amazon
forest and changes due to pasture installation in Rondonia, Brazil. Geoderma, 70,
63–81.
Morales P, Sykes MT, Prentice IC et al. (2005) Comparing and evaluating process-
based ecosystem model predictions of carbon and water fluxes in major European
forest biomes. Global Change Biology, 11, 2211–2233.
Ogle SM, Breidt FJ, Paustian K (2005) Agricultural management impacts on soil
organic carbon storage under moist and dry climatic conditions of temperate and
tropical regions. Biogeochemistry, 72, 87–121.
Ogle SM, Breidt FJ, Paustian K (2006) Bias and variance in model results associated
with spatial scaling of measurements for parameterization in regional assess-
ments. Global Change Biology, 12, 516–523.
Ogle SM, Breidt FJ, Easter M, Williams S, Killian K, Paustian K (2010) Scale and
uncertainty in modeled soil organic carbon stock changes for US croplands using
a process-based model. Global Change Biology, 16, 810–820.
Ostle N, Ineson P, Benham D, Sleep D (2000) Carbon assimilation and turnover in
grassland vegetation using an in situ 13CO2 pulse labelling system. Rapid Communi-
cations in Mass Spectrometry, 14, 1345–1350.
Ostle N, Whiteley AS, Bailey MJ, Sleep D, Ineson P, Manefield M (2003) Active micro-
bial RNA turnover in a grassland soil estimated using a 13CO2 spike. Soil Biology &
Biochemistry, 35, 877–885.
Parton WJ, Schimel DS, Cole CV, Ojima DS (1987) Analysis of factors controlling soil
organic matter dynamics in an agroecosystem. Soil Science Society of America Jour-
nal, 51, 1173–1179.
Pathak H, Byjesh K, Chakrabarti B, Aggarwal PK (2011) Potential and cost of carbon
sequestration in Indian agriculture: estimates from long-term field experiments.
Field Crops Research, 120, 102–111.
Paul KI, Polglase PJ (2004) Calibration of the RothC model to turnover of soil carbon
under eucalypts and pines. Australian Journal of Soil Research, 42, 883–895.
Paustian K, Collins HP, Paul EA (1997) Management controls on soil carbon. In: Soil
Organic Matter in Temperate Agroecosystems: Long-Term Experiments in North America
(eds A. PE, Paustian K, Cole CV), pp. 15–49. CRC Press, Boca Raton.
Pinard MA, Putz FE (1996) Retaining forest biomass by reducing logging damage.
Biotropica, 28, 278–295.
Plain C, Gerant D, Maillard P et al. (2009) Tracing of recently assimilated carbon in
respiration at high temporal resolution in the field with a tuneable diode laser
absorption spectrometer after in situ 13CO2 pulse labelling of 20-year-old beech
trees. Tree Physiology, 29, 1433–1447.
Ramankutty N, Foley JA (1998) Characterizing patterns of global land use: an analysis
of global croplands data. Global Biogeochemical Cycles, 12, 667–685.
Ramankutty N, Evan AT, Monfreda C, Foley JA (2008) Farming the planet: 1. Geo-
graphic distribution of global agricultural lands in the year 2000. Global Biogeo-
chemical Cycles, 22, GB1003, doi: 10.1029/2007GB002952.
Rangel-Castro JI, Prosser JI, Scrimgeour CM et al. (2004) Carbon flow in an upland
grassland: effect of liming on the flux of recently photosynhtesized carbon to rhi-
zosphere soil. Global Change Biology, 10, 2100–2108.
Rastetter EB, Williams M, Griffin KL et al. (2010) Processing arctic eddy-flux data
using a simple carbon-exchange model embedded in the ensemble Kalman filter.
Ecological Applications, 20, 1285–1301.
Richter DdeB, Yaalon D (in press) The changing model of soil. Soil Science Society of
America Journal, 76.
Richter DdeB, Hofmockel M, Callaham MA, Powlson DS, Smith P (2007) Long-term
soil experiments: keys to managing Earth’s rapidly changing ecosystems. Soil Sci-
ence Society of America Journal, 71, 266–279.
Sanchez PA, Ahamed S, Carre F et al. (2009) Digital soil map of the world. Science,
325, 680–681.
Searchinger T, Heimlich R, Houghton RA, Dong F, Elobeid A, Fabiosa J (2008) Use of
U.S. croplands for biofuels increases greenhouse gases through emissions from
land use change. Science, 319, 1238–1240.
© 2012 Blackwell Publishing Ltd, Global Change Biology, doi: 10.1111/j.1365-2486.2012.02689.x
12 P. SMITH et al.
Serbin G, Daughtry CST, Hunt ER Jr, Brown DJ, McCarty GW (2009) Effect of soil
spectral properties on remote sensing of crop residue cover. Soil Science Society of
America, 73, 1545–1558.
Setia R, Smith P, Marschner P, Baldock J, Chittleborough D, Smith JU (2011) Introduc-
ing a decomposition rate modifier in the Rothamsted carbon model to predict soil
organic carbon stocks in saline soils. Environmental Science and Technology, 45,
6396–6403.
Siltanen RM, Apps MJ, Zoltai SC, Mair RM, Strong WL (1997) A Soil Profile and
Organic Carbon Data Base for Canadian Forest and Tundra Mineral Soils. Natural
Resources Canada, Canadian Forest Service, Northern Forestry Centre, Edmonton,
Alberta, pp. 50.
Sisti CPJ, Santos HPD, Kochhann RA, Alves BJR, Urquiaga S, Boddey RM (2004)
Change in carbon and nitrogen stocks in soil under 13 years of conventional or
zero tillage in southern Brazil. Soil and Tillage Research, 76, 39–58.
Smith P (2002) Soil organic matter modeling. In: Encyclopedia of Soil Science (ed Lal R),
pp. 917–924. Marcel Dekker Inc, New York.
Smith P, Fang C (2010) A warm response to soils. Nature, 464, 499–500.
Smith P, Powlson DS, Smith JU, Elliott ET (1997a) Evaluation and comparison of soil
organic matter models using datasets from seven long-term experiments. Geoder-
ma, 81, 1–225.
Smith P, Smith JU, Powlson DS et al. (1997b) A comparison of the performance of
nine soil organic matter models using seven long-term experimental datasets.
Geoderma, 81, 153–225.
Smith P, Powlson DS, Smith JU, Falloon PD, Coleman K (2000) Meeting Europe’s cli-
mate change commitments: quantitative estimates of the potential for carbon miti-
gation by agriculture. Global Change Biology, 6, 525–539.
Smith P, Falloon PD, Korschens M et al. (2002) EuroSOMNET - a European database
of long-term experiments on soil organic matter: the WWW metadatabase. Journal
of Agricultural Science, Cambridge, 138, 123–134.
Smith P, Martino D, Cai Z et al. (2007) Agriculture. In: Climate change 2007: Mitigation.
Contribution of Working Group III to the Fourth Assessment Report of the Intergovern-
mental Panel on Climate Change (eds Metz B, Davidson O, Bosch P, Dave R, Meyer
L), pp. 497–540. Cambridge University Press, New York, NY, USA.
Smith P, Martino D, Cai Z et al. (2008a) Greenhouse gas mitigation in agriculture.
Philosophical Transactions of the Royal Society, B., 363, 789–813.
Smith P, Fang C, Dawson JJC, Moncreiff JB (2008b) Impact of global warming on soil
organic carbon. Advances in Agronomy, 97, 1–43.
Smith P, Lanigan G, Kutsch WL et al. (2010a) Measurements necessary for assessing
the net ecosystem carbon budget of croplands. Agriculture, Ecosystems & Environ-
ment, 139, 302–315.
Smith P, Gregory P, Van Vuuren D et al. (2010b) Competition for land. Philosophical
Transactions of the Royal Society, B., 365, 2941–2957.
Smith JU, Gottschalk P, Bellarby J et al. (2010c) Estimating changes in national soil
carbon stocks using ECOSSE – a new model that includes upland organic soils.
Part I. Model description and uncertainty in national scale simulations of Scotland.
Climate Research, 45, 179–192.
Smith P, Albanito F, Bell M et al. (2011) Systems approaches in global change and bio-
geochemistry research. Philosophical Transactions of the Royal Society, B., 367, 311–
321.
Stoy PC, Richardson AD, Baldocchi DD et al. (2009) Biosphere-atmosphere exchange
of CO2 in relation to climate: a cross-biome analysis across multiple time scales.
Biogeosciences, 6, 2297–2312.
Subke JA, Vallack HW, Magnusson T, Keel SG, Metcalfe DB, Hogberg P, Ineson P
(2009) Short term dynamics of abiotic and biotic soil 13CO2 effluxes after in situ13CO2 pulse labelling of a boreal pine forest. New Phytologist, 183, 349–357.
Travi NM, Biasi C, Kontro M, Lokko K, Martikainen PJ (2009) Studying soil microbial
communities by 13C-PLFA analysis - combining form and function. In:
ISOCOMPOUND ‘09 - Advances in Analyses and Applications of Compound-Specific
Stable Isotopes in Ecology, Ecosystem- and Earth Sciences, 1–5 June 2009. Potsdam,
Germany. Available at: http://isocompound2009.files.wordpress.com/2009/01/
tavi-et-al1.pdf (accessed 27 February 2012).
Vandenbygaart AJ, Gregorich EG, Angers DA, Stoklas UF (2004) Uncertainty analysis
of soil organic carbon stock change in Canadian cropland from 1991 to 2001. Global
Change Biology, 10, 983–994.
Vrugt JA, Diks CGH, Gupta HV, Bouten W, Verstraten JM (2005) Improved treatment
of uncertainty in hydrologic modeling: combining the strengths of global optimi-
zation and data assimilation. Water Resource Research, 41, W01017, 17 pp, doi:
10.1029/2004WR003059.
Wang ZP, Li LH, Han XG, Li ZQ, Chen QS (2007) Dynamics and allocation of recently
photo-assimilated carbon in an inner Mongolia temperate steppe. Environmental
and Experimental Botany, 59, 1–10.
Ward SE, Bardgett RD, Mcnamara NP, Ostle NJ (2009) Plant functional group identity
influences short-term peatland ecosystem carbon flux: evidence from a plant
removal experiment. Functional Ecology, 23, 454–462.
Wattenbach M, Vuichard N, Lehuger S et al. (2010) The carbon balance of European
croplands: a cross-site comparison of simulation models. Agriculture, Ecosystems &
Environment, 319, 419–453.
van Wesemael B, Paustian K, Andren O et al. (2011) How can soil monitoring net-
works be used to improve predictions of organic carbon pool dynamics and CO2
fluxes in agricultural soils? Plant and Soil, 338, 247–259.
Williams M, Schwarz PA, Law BE, Irvine J, Kurpius MR (2005) An improved analysis
of forest carbon dynamics using data assimilation. Global Change Biology, 11, 89–105.
Williams M, Richardson AD, Reichstein M et al. (2009) Improving land surface mod-
els with FLUXNET data. Biogeosciences, 6, 1341–1359.
Yan XY, Cai Z, Wang SW, Smith P (2011) Direct measurement of soil organic carbon
content change in the croplands of China. Global Change Biology, 17, 1487–1496.
Zimmermann M, Leifeld J, Fuhrer J (2007) Quantifying soil organic carbon fractions
by infrared-spectroscopy. Soil Biology & Biochemistry, 39, 224–231.
Zinke PJ, Stangenberger AG, Post WM, Emanuel WR, Olson JS (1984) Worldwide
organic soil carbon and nitrogen data. Technical Report number ORNL/TM-8857,
Oak Ridge National Laboratory, TN, USA, pp. 146.
Supporting Information
Additional Supporting Information may be found in theonline version of this article:
Appendix S1. List of acronyms, abbreviations and Weblinks (all URLs accessed 27 February 2012).
Please note: Wiley-Blackwell are not responsible for the con-tent or functionality of any supporting materials suppliedby the authors. Any queries (other than missing material)should be directed to the corresponding author for thearticle.
© 2012 Blackwell Publishing Ltd, Global Change Biology, doi: 10.1111/j.1365-2486.2012.02689.x
A GLOBAL FRAMEWORK FOR ESTIMATING SOIL C 13