
Towards Accurate and Fast Evaluation of Multi-Stage Log ... · Towards Accurate and Fast Evaluation...
27
Towards Accurate and Fast Evaluation of Multi-Stage Log-Structured Designs Hyeontaek Lim David G. Andersen, Michael Kaminsky † Carnegie Mellon University † Intel Labs
Transcript of Towards Accurate and Fast Evaluation of Multi-Stage Log ... · Towards Accurate and Fast Evaluation...
Towards Accurate and Fast Evaluation of Multi-Stage Log-Structured Designs
Hyeontaek Lim
David G. Andersen, Michael Kaminsky†
Carnegie Mellon University
†Intel Labs

Multi-Stage Log-Structured (“MSLS”) Designs
2
(Naïve) Log-structured design ➪ Fast writes with sequential I/O
Compaction ➪ Fewer table count ➪ Less space use ➪ Heavy I/O required
Multi-stage design ➪ Cheaper compaction
by segregating fresh and old data
➪ Slow query speed ➪ Large space use
Example: LevelDB, RocksDB, Cassandra, HBase, … Y X X
Item inserts
X Y Sorted table
X Z
Sorted table
X Y Z Merged sorted table
X Y
Sorted table
fresh
old old old
Sorted in memory Written sequentially

MSLS Design Evaluation Needed
3
Mobile app Filesystem Desktop app Data-intensive computing
Diverse workloads Large design space
Many tunable knobs
Problem: How to evaluate and tune MSLS designs for a workload?
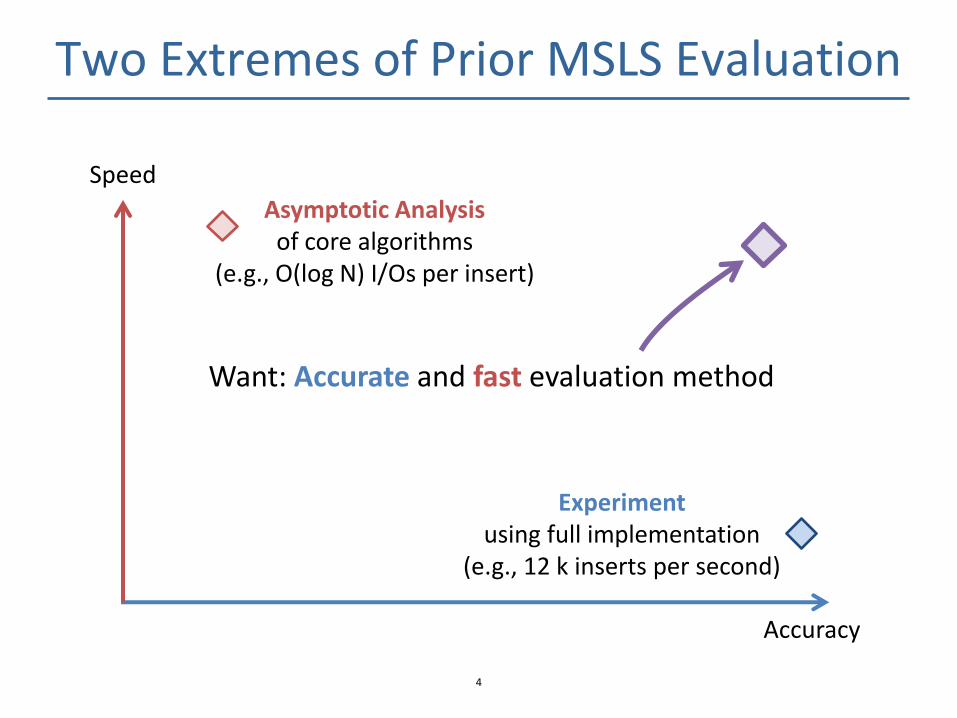
Two Extremes of Prior MSLS Evaluation
4
Speed
Accuracy
Asymptotic Analysis of core algorithms
(e.g., O(log N) I/Os per insert)
Experiment using full implementation
(e.g., 12 k inserts per second)
Want: Accurate and fast evaluation method
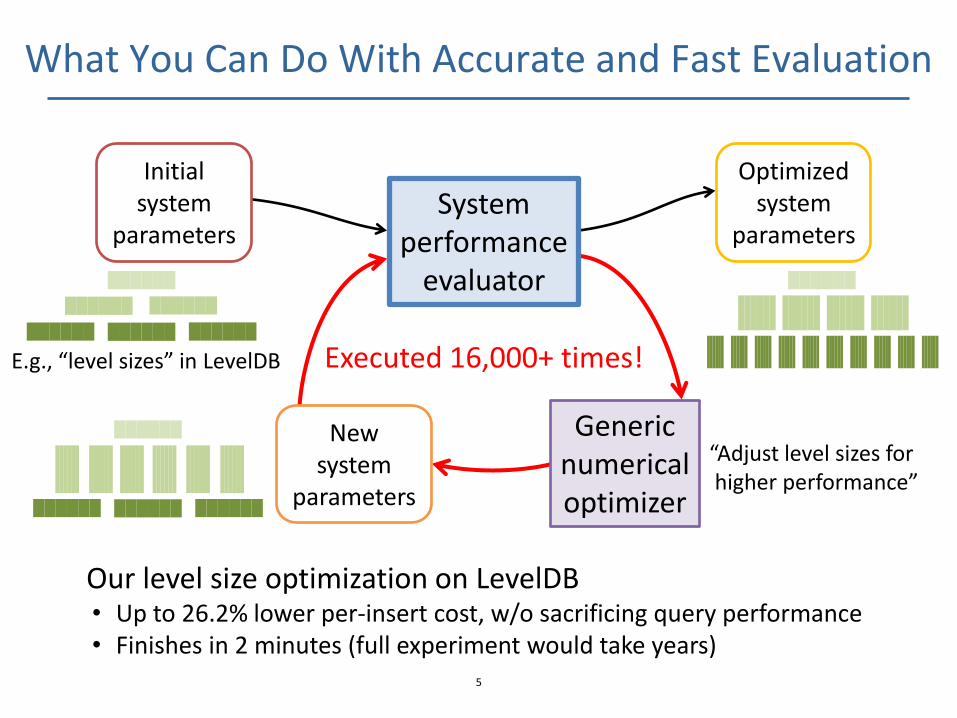
What You Can Do With Accurate and Fast Evaluation
5
Initial system
parameters System
performance evaluator
Optimized system
parameters
New system
parameters
Generic numerical optimizer
Our level size optimization on LevelDB • Up to 26.2% lower per-insert cost, w/o sacrificing query performance • Finishes in 2 minutes (full experiment would take years)
Executed 16,000+ times! E.g., “level sizes” in LevelDB
“Adjust level sizes for higher performance”
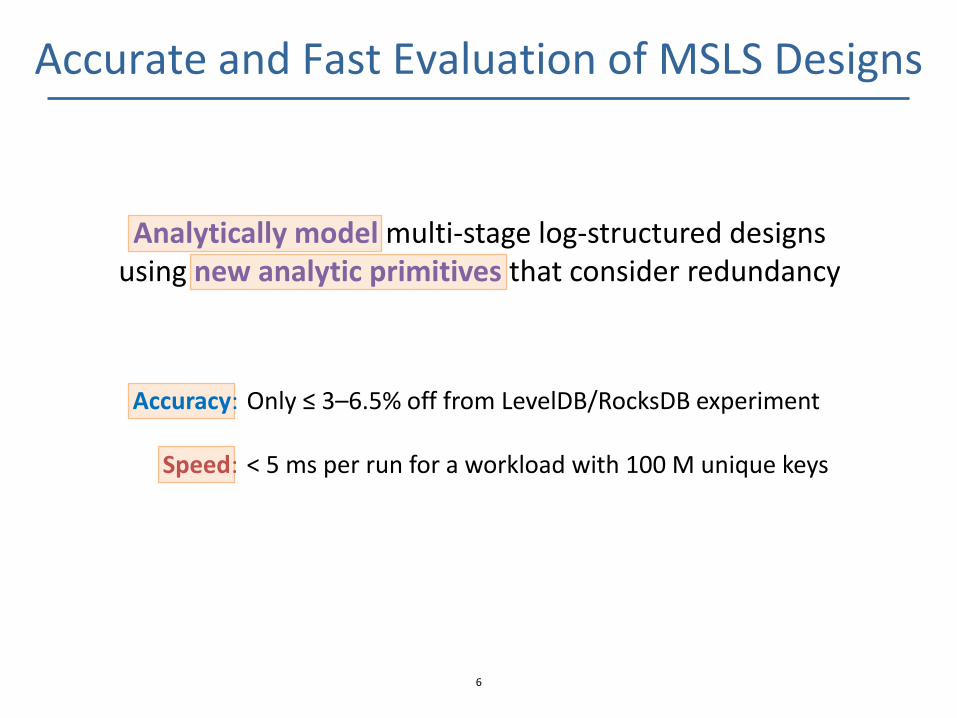
Accurate and Fast Evaluation of MSLS Designs
6
Analytically model multi-stage log-structured designs using new analytic primitives that consider redundancy
Accuracy: Only ≤ 3–6.5% off from LevelDB/RocksDB experiment Speed: < 5 ms per run for a workload with 100 M unique keys
Performance Metric to Use
7
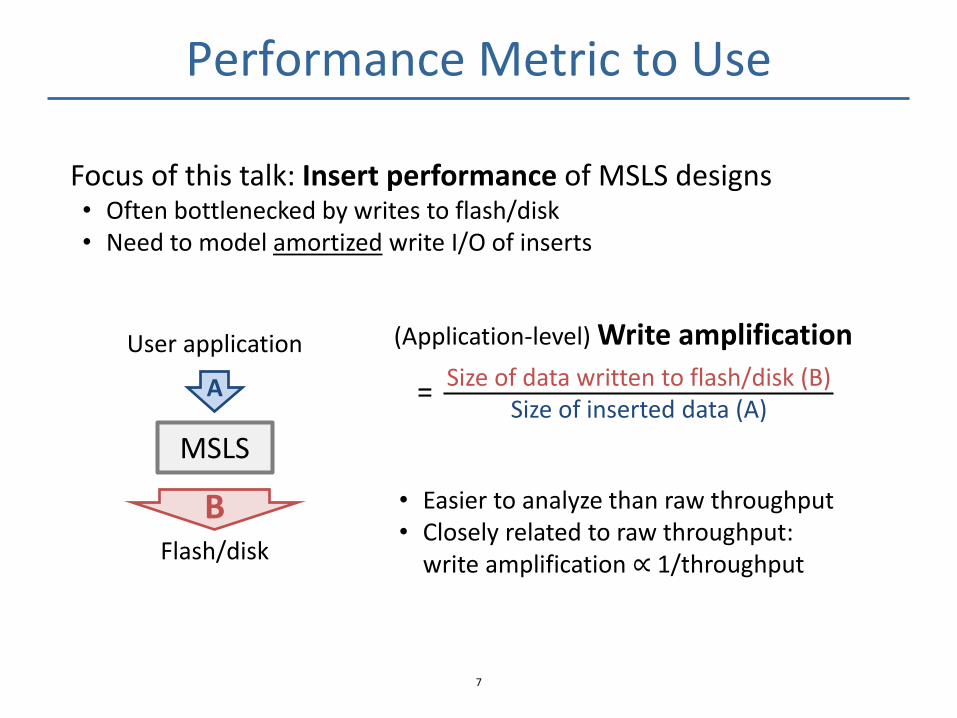
(Application-level) Write amplification
Size of data written to flash/disk (B) Size of inserted data (A)
• Easier to analyze than raw throughput • Closely related to raw throughput:
write amplification ∝ 1/throughput
Focus of this talk: Insert performance of MSLS designs • Often bottlenecked by writes to flash/disk • Need to model amortized write I/O of inserts
MSLS
Flash/disk
User application
B
A =
Divide-and-Conquer to Model MSLS Design
8
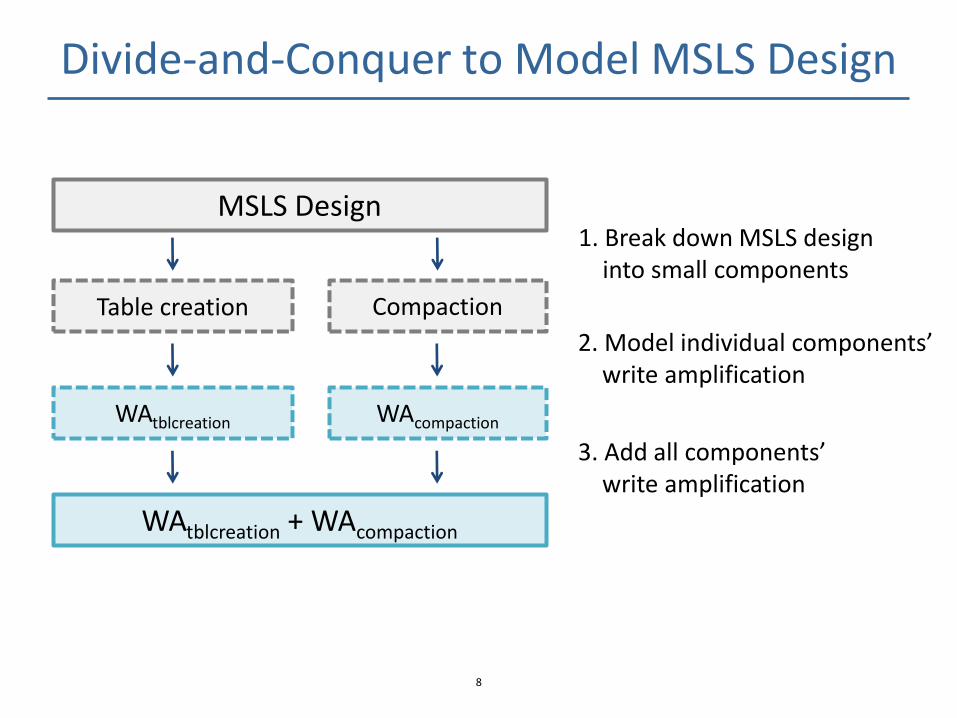
MSLS Design
Table creation
1. Break down MSLS design into small components
2. Model individual components’ write amplification
3. Add all components’ write amplification
Compaction
WAtblcreation WAcompaction
WAtblcreation + WAcompaction
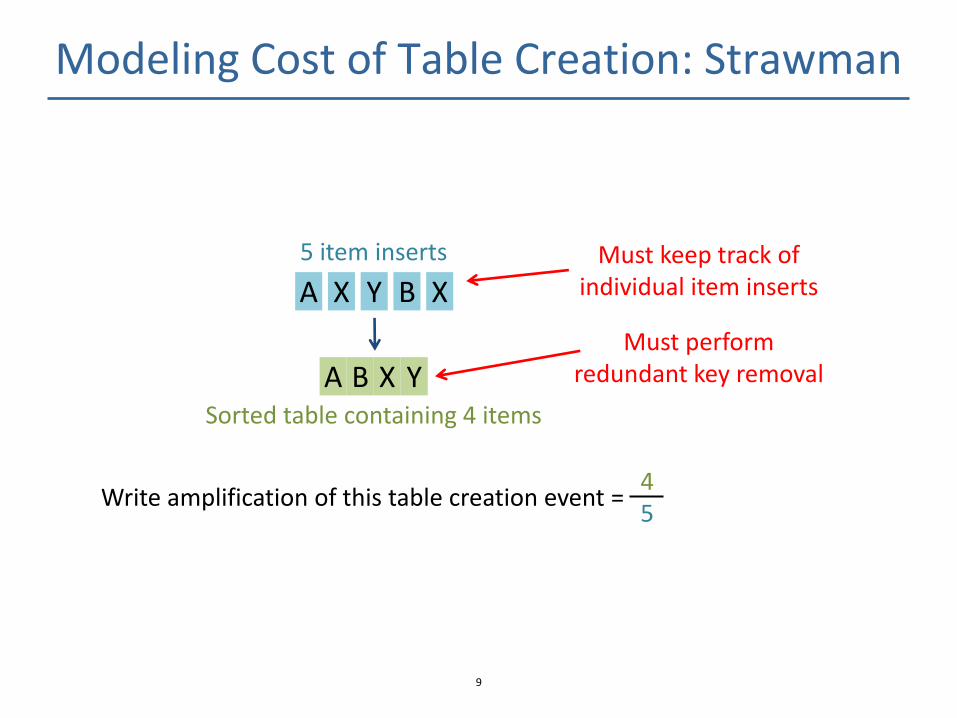
Modeling Cost of Table Creation: Strawman
Y B X A X
5 item inserts
B X Y A Sorted table containing 4 items
Write amplification of this table creation event = 4 5
9
Must keep track of individual item inserts
Must perform redundant key removal
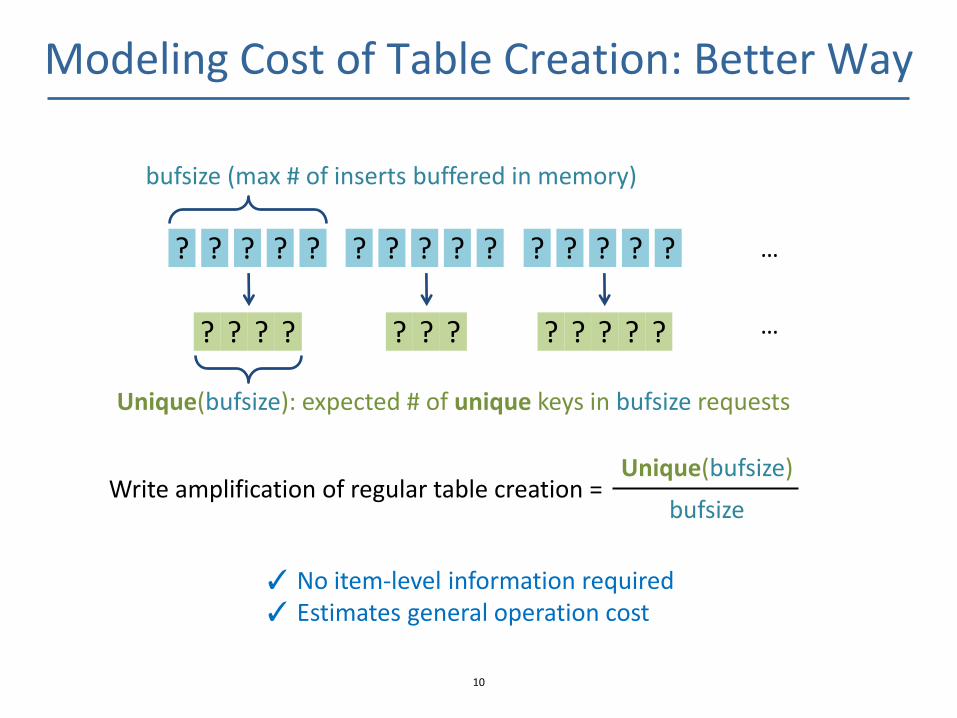
Modeling Cost of Table Creation: Better Way
Unique(bufsize): expected # of unique keys in bufsize requests
? ? ? ? ? ? ? ? ? ?
? ? ? ? ? ? ?
10
bufsize (max # of inserts buffered in memory)
Write amplification of regular table creation = Unique(bufsize)
…
…
✓ No item-level information required ✓ Estimates general operation cost
? ? ? ? ?
? ? ? ? ?
bufsize
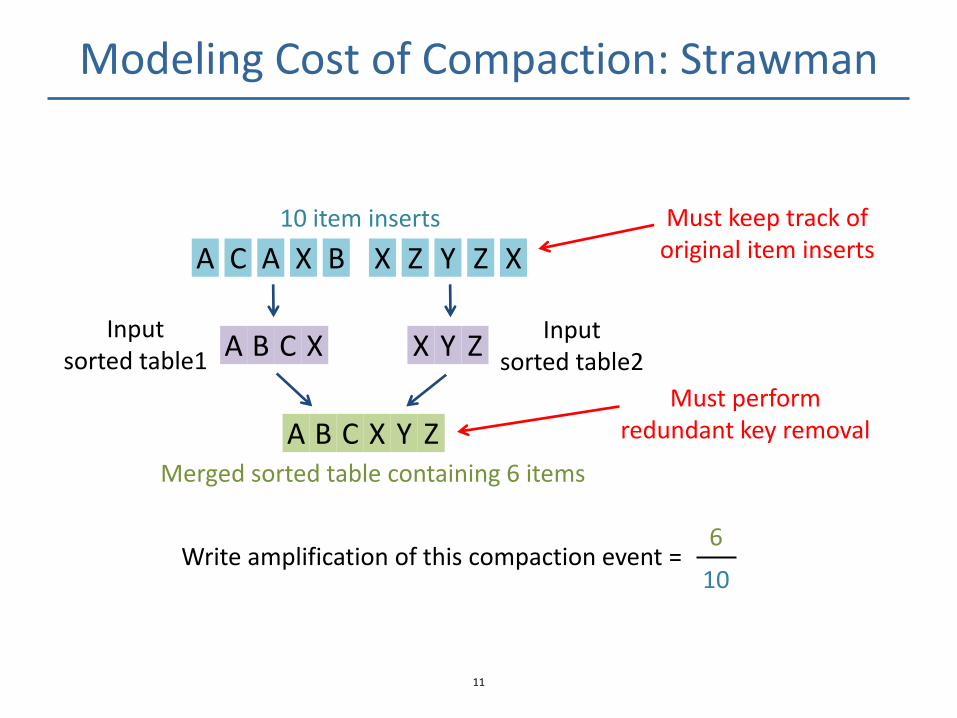
Modeling Cost of Compaction: Strawman
11
C X A B Input
sorted table1
C X Y Z A B Merged sorted table containing 6 items
X Y Z Input
sorted table2
A X B A C Y Z X X Z
10 item inserts
Write amplification of this compaction event = 6
Must keep track of original item inserts
Must perform redundant key removal
10

Unique-1(tblsize2): expected # of requests containing tblsize2 unique keys i.e., Unique(Unique-1(tblsize2)) = tblsize2
Modeling Cost of Compaction: Better Way
12
? ? ? ? tblsize1
? ? ? ? ? ?
? ? ? tblsize2
? ? ? ? ? ? ? ? ? ?
Unique-1(tblsize1)
Merge(tblsize1, tblsize2): expected # of unique keys in input tables whose sizes are tblsize1 and tblsize2
Write amplification of 2-way compaction = Merge(tblsize1, tblsize2)
✓ No item-level information required ✓ Estimates general operation cost
Unique-1(tblsize1) + Unique-1(tblsize2)
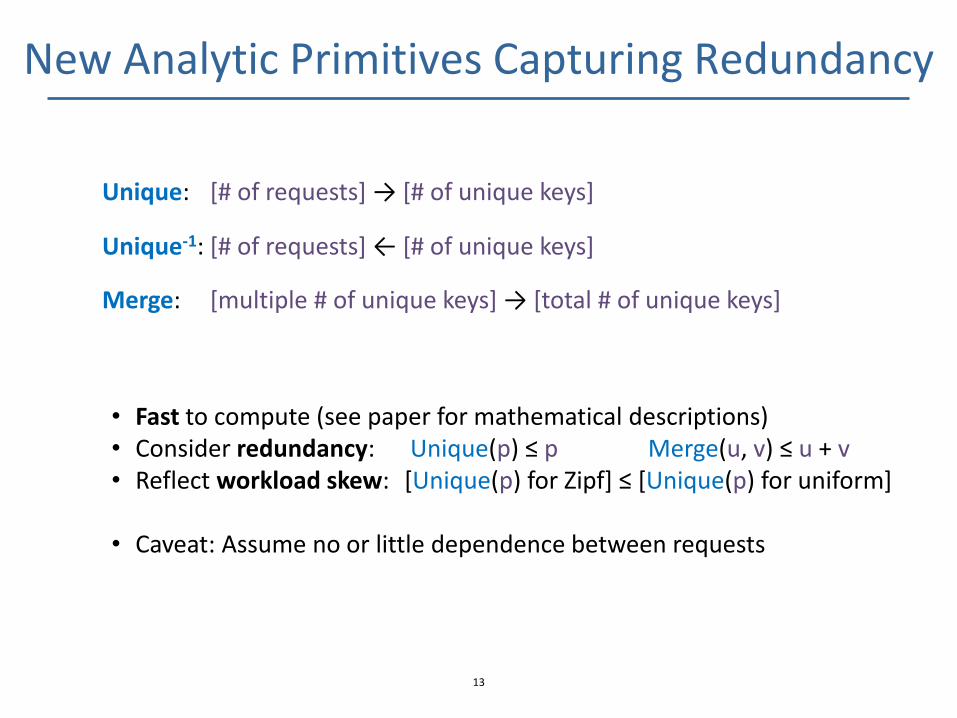
New Analytic Primitives Capturing Redundancy
13
Unique-1: [# of requests] ← [# of unique keys]
Merge: [multiple # of unique keys] → [total # of unique keys]
• Fast to compute (see paper for mathematical descriptions) • Consider redundancy: Unique(p) ≤ p Merge(u, v) ≤ u + v • Reflect workload skew: [Unique(p) for Zipf] ≤ [Unique(p) for uniform]
• Caveat: Assume no or little dependence between requests
Unique: [# of requests] → [# of unique keys]
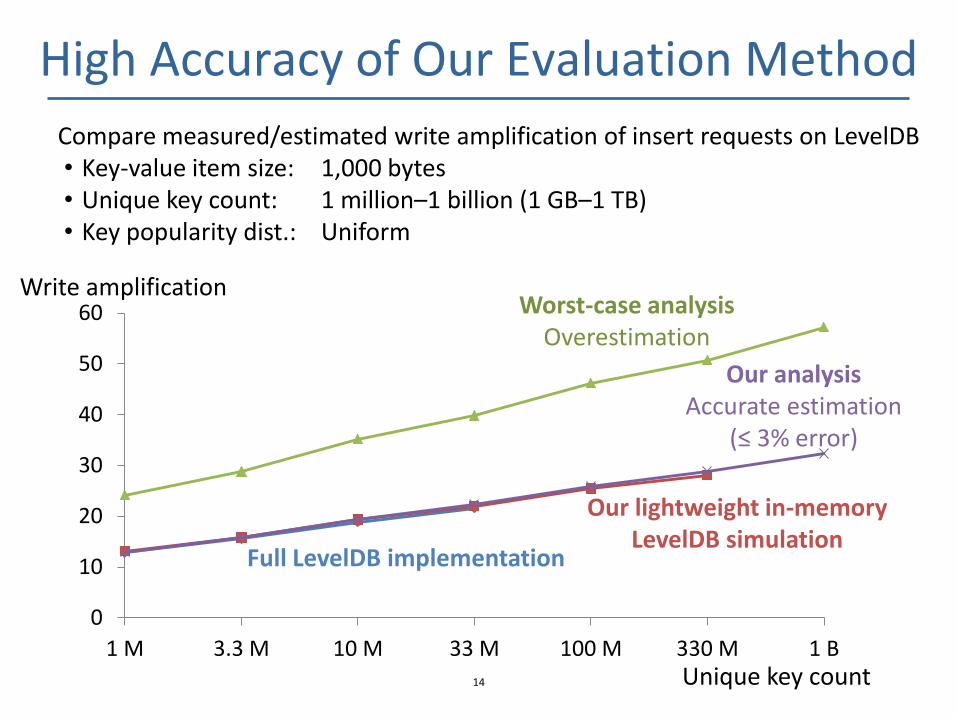
High Accuracy of Our Evaluation Method
14
Compare measured/estimated write amplification of insert requests on LevelDB • Key-value item size: 1,000 bytes • Unique key count: 1 million–1 billion (1 GB–1 TB) • Key popularity dist.: Uniform
0
10
20
30
40
50
60
1 M 3.3 M 10 M 33 M 100 M 330 M 1 B
Our analysis Accurate estimation
(≤ 3% error)
Unique key count
Write amplification Worst-case analysis
Overestimation
Full LevelDB implementation
Our lightweight in-memory LevelDB simulation
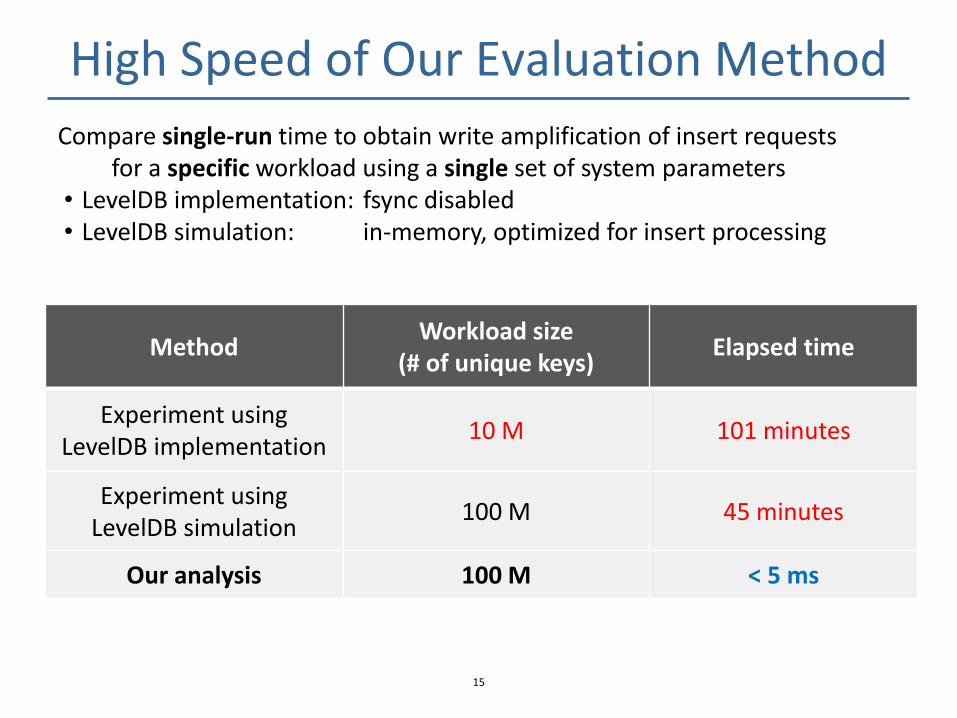
High Speed of Our Evaluation Method
15
Compare single-run time to obtain write amplification of insert requests for a specific workload using a single set of system parameters • LevelDB implementation: fsync disabled • LevelDB simulation: in-memory, optimized for insert processing
Method Workload size
(# of unique keys) Elapsed time
Experiment using LevelDB implementation
10 M 101 minutes
Experiment using LevelDB simulation
100 M 45 minutes
Our analysis 100 M < 5 ms
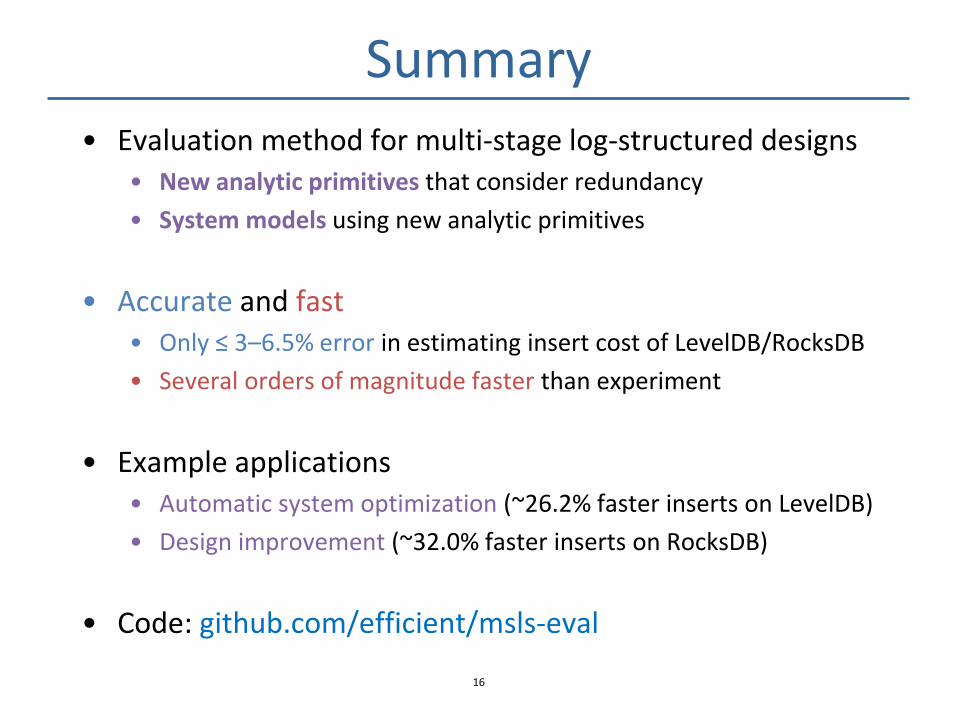
Summary • Evaluation method for multi-stage log-structured designs
• New analytic primitives that consider redundancy
• System models using new analytic primitives
• Accurate and fast • Only ≤ 3–6.5% error in estimating insert cost of LevelDB/RocksDB
• Several orders of magnitude faster than experiment
• Example applications • Automatic system optimization (~26.2% faster inserts on LevelDB)
• Design improvement (~32.0% faster inserts on RocksDB)
• Code: github.com/efficient/msls-eval
16

Backup Slides
17
X
Sorted table
X Y Merged sorted table
X Y
Sorted table
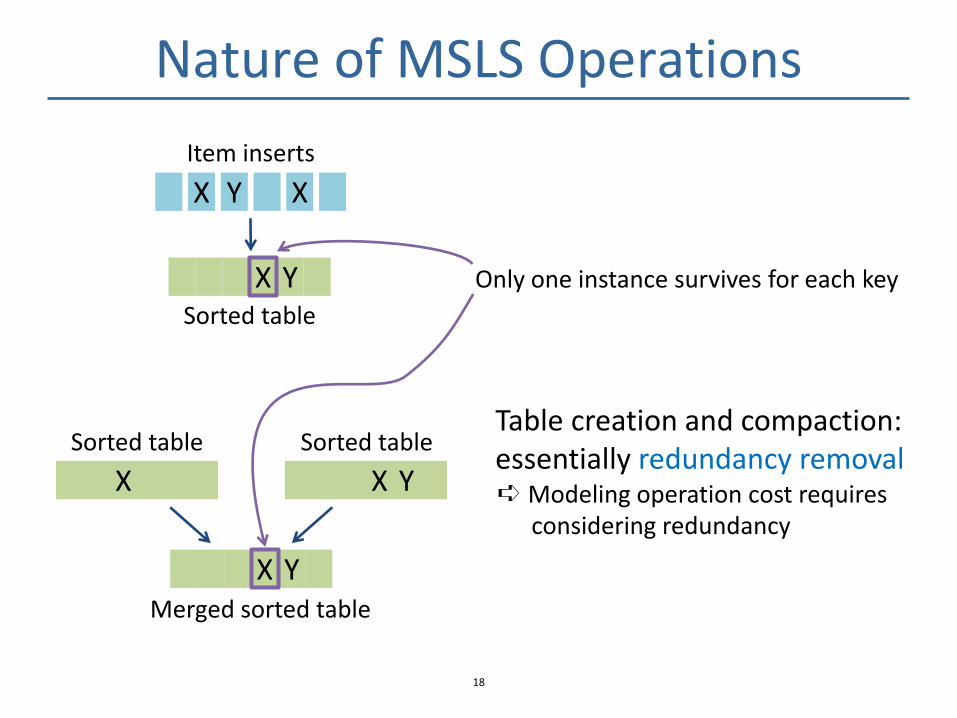
Nature of MSLS Operations
18
Only one instance survives for each key
Table creation and compaction: essentially redundancy removal ➪ Modeling operation cost requires
considering redundancy
Y X X
Item inserts
X Y Sorted table

Write Amplification vs. Throughput
19
Compare measured write amplification/throughput of insert requests on LevelDB • Key-value item size: 1,000 bytes • Unique key count: 1 million–10 million (1 GB–10 GB) • Key popularity dist.: Uniform, Zipf (skew=0.99)
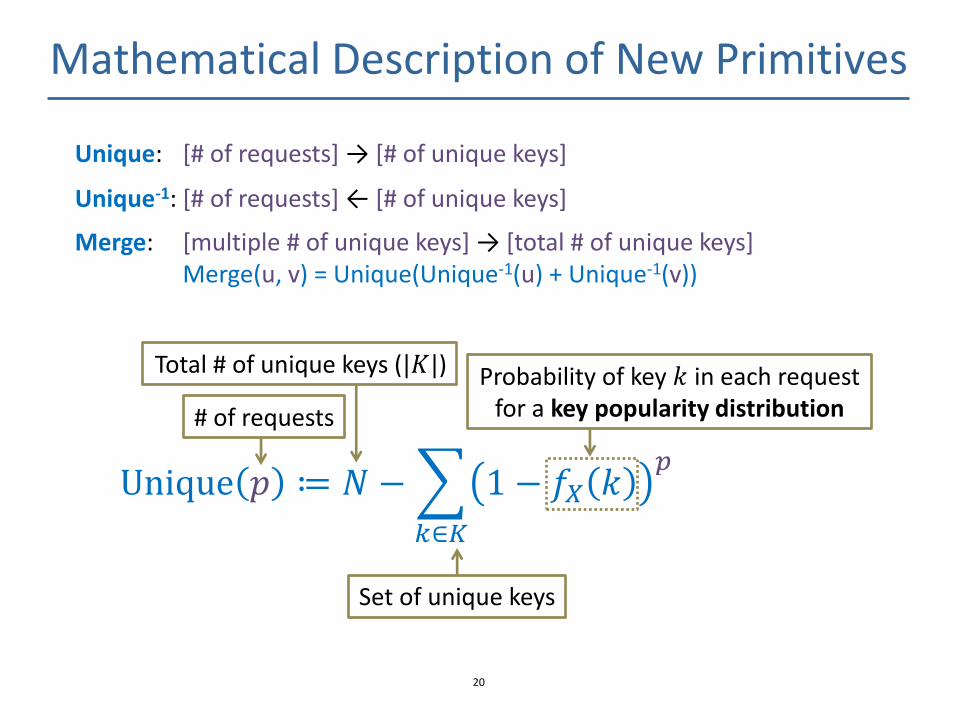
Mathematical Description of New Primitives
20
Unique-1: [# of requests] ← [# of unique keys]
Merge: [multiple # of unique keys] → [total # of unique keys] Merge(u, v) = Unique(Unique-1(u) + Unique-1(v))
Unique: [# of requests] → [# of unique keys]
Unique 𝑝 ≔ 𝑁 − 1− 𝑓𝑋 𝑘𝑝
𝑘∈𝐾
# of requests
Total # of unique keys (|𝐾|)
Set of unique keys
Probability of key 𝑘 in each request for a key popularity distribution

Unique as a Function of Request Count
21
Uniform key popularity
Skewed key popularity
Compare measured write amplification/throughput of insert requests on LevelDB • Key-value item size: 1,000 bytes • Unique key count: 100 M (100 GB) • Request count: 0–1 billion • Key popularity dist.: Uniform, Zipf (skew=0.99)
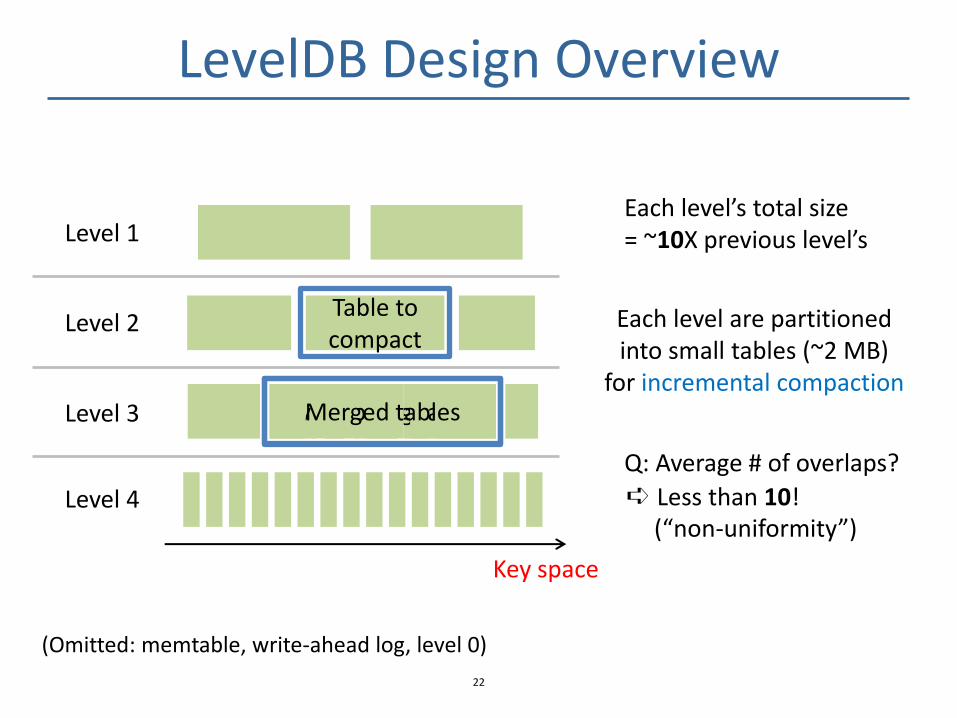
LevelDB Design Overview
22
Level 1
Level 2
Level 3
Level 4
Key space
(Omitted: memtable, write-ahead log, level 0)
Each level are partitioned into small tables (~2 MB)
for incremental compaction
Each level’s total size = ~10X previous level’s
Table to compact
Overlapping tables Merged tables
Q: Average # of overlaps?
➪ Less than 10! (“non-uniformity”)
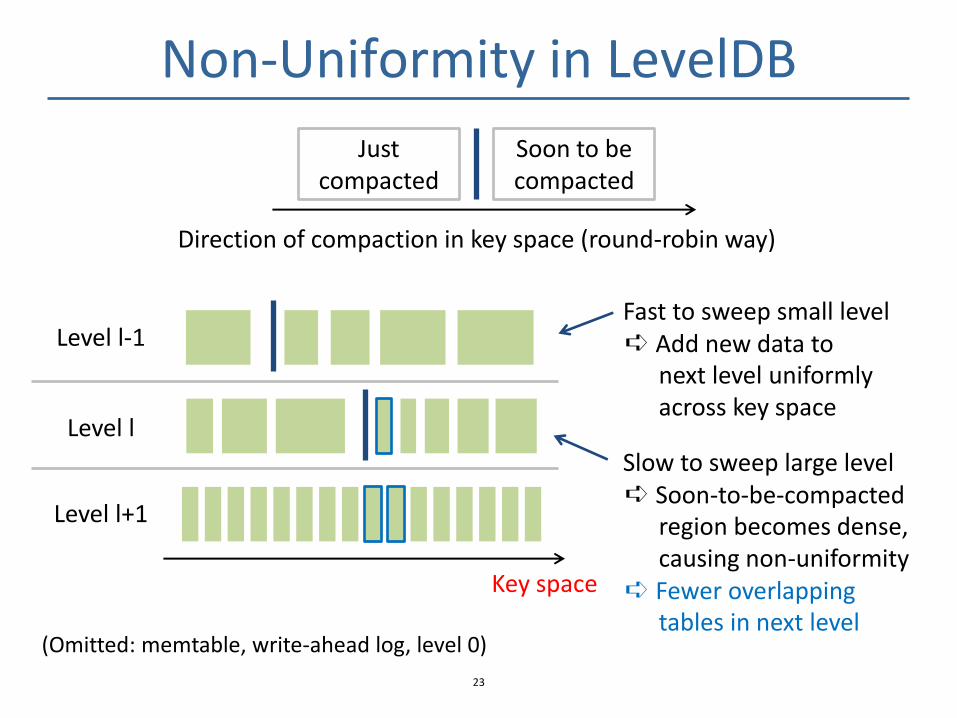
Non-Uniformity in LevelDB
23
Level l-1
Level l
Level l+1
Key space
(Omitted: memtable, write-ahead log, level 0)
Fast to sweep small level ➪ Add new data to
next level uniformly across key space
Slow to sweep large level ➪ Soon-to-be-compacted
region becomes dense, causing non-uniformity
➪ Fewer overlapping tables in next level
Just compacted
Soon to be compacted
Direction of compaction in key space (round-robin way)
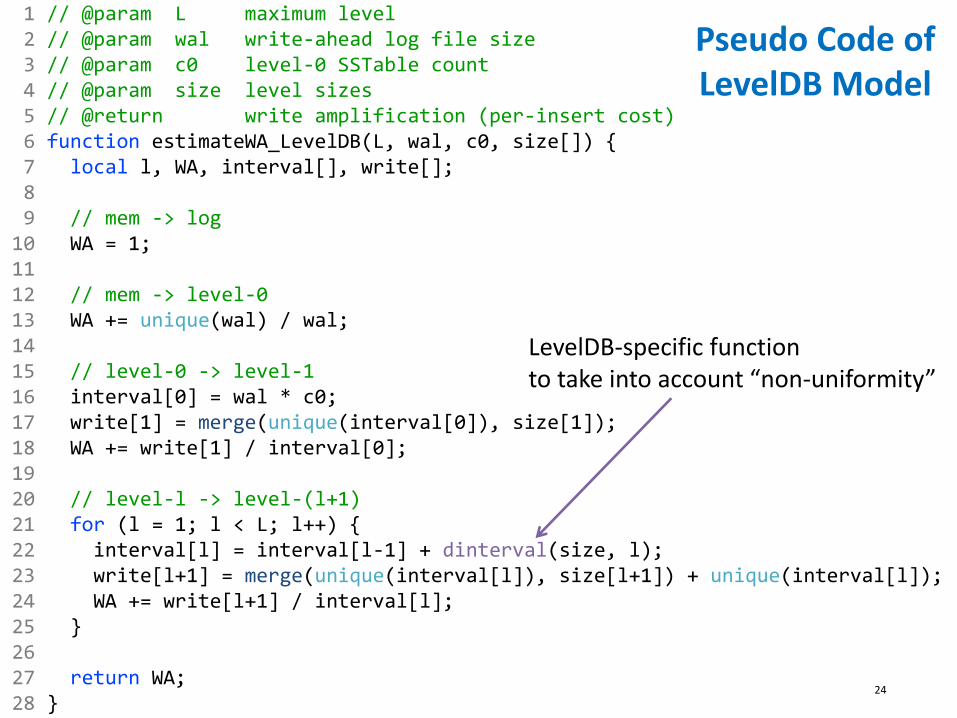
1 // @param L maximum level 2 // @param wal write-ahead log file size 3 // @param c0 level-0 SSTable count 4 // @param size level sizes 5 // @return write amplification (per-insert cost) 6 function estimateWA_LevelDB(L, wal, c0, size[]) { 7 local l, WA, interval[], write[]; 8 9 // mem -> log 10 WA = 1; 11 12 // mem -> level-0 13 WA += unique(wal) / wal; 14 15 // level-0 -> level-1 16 interval[0] = wal * c0; 17 write[1] = merge(unique(interval[0]), size[1]); 18 WA += write[1] / interval[0]; 19 20 // level-l -> level-(l+1) 21 for (l = 1; l < L; l++) { 22 interval[l] = interval[l-1] + dinterval(size, l); 23 write[l+1] = merge(unique(interval[l]), size[l+1]) + unique(interval[l]); 24 WA += write[l+1] / interval[l]; 25 } 26 27 return WA; 28 }
24
LevelDB-specific function to take into account “non-uniformity”
Pseudo Code of LevelDB Model
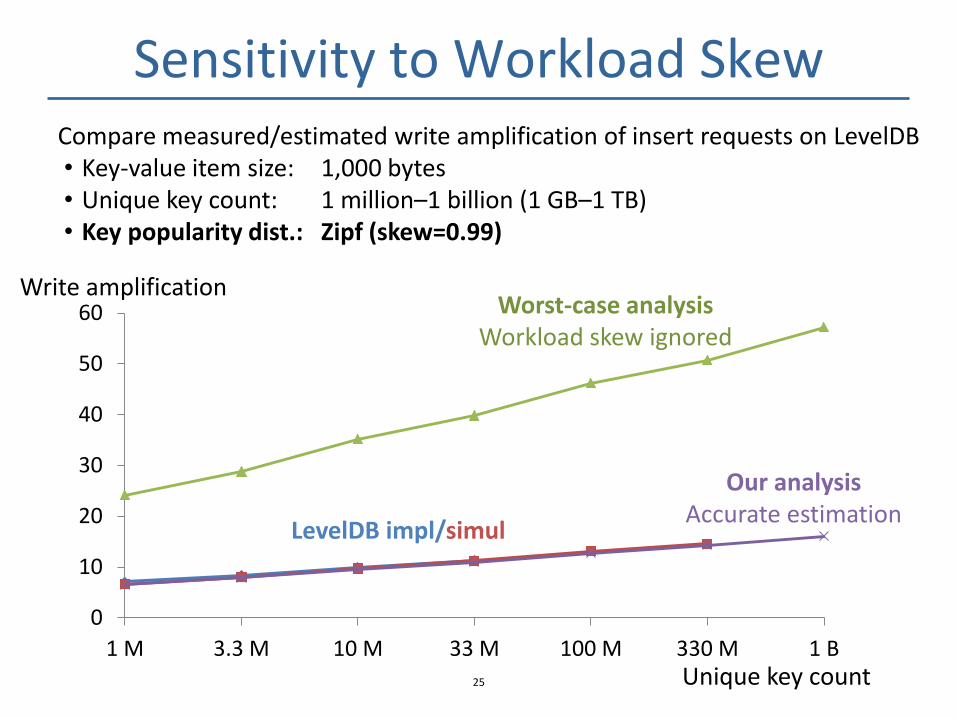
Sensitivity to Workload Skew
25
Compare measured/estimated write amplification of insert requests on LevelDB • Key-value item size: 1,000 bytes • Unique key count: 1 million–1 billion (1 GB–1 TB) • Key popularity dist.: Zipf (skew=0.99)
0
10
20
30
40
50
60
1 M 3.3 M 10 M 33 M 100 M 330 M 1 BUnique key count
Write amplification
LevelDB impl/simul
Our analysis Accurate estimation
Worst-case analysis Workload skew ignored
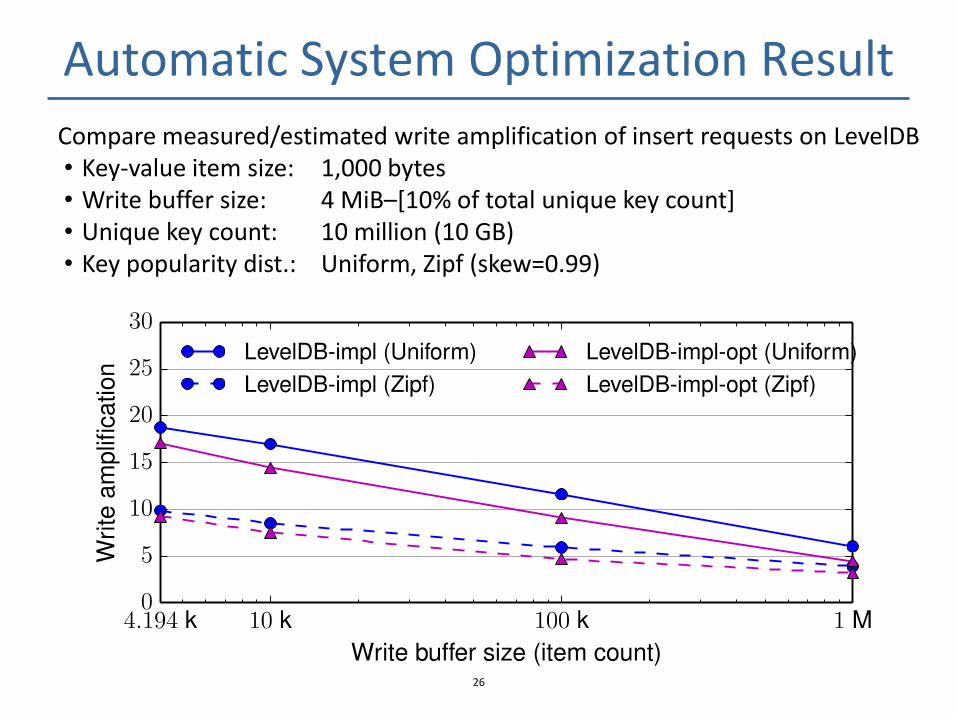
Automatic System Optimization Result
26
Compare measured/estimated write amplification of insert requests on LevelDB • Key-value item size: 1,000 bytes • Write buffer size: 4 MiB–[10% of total unique key count] • Unique key count: 10 million (10 GB) • Key popularity dist.: Uniform, Zipf (skew=0.99)

End of Slides
27