Towards a harmonised methodology for
30
Part 1: Indicator typologies and terminologies 2014 edition Towards a harmonised methodology for statistical indicators Manuals and guidelines ISSN 1681-4789 ISSN 2315-0815
Transcript of Towards a harmonised methodology for
Part 1: Indicator typologies and terminologies
2014 edition
Towards a harmonised methodology for statistical indicators
Exer in vulla faci blamconse euis nibh el utat dip ex elestisim
Rilis augiati siscilit venis nim
Manuals and guidelines
ISSN 1681-4789
2013 editio
n
ISSN 2315-0815

Part 1: Indicator typologies and terminologies
2013 edition
Towards a harmonised methodology forstatistical indicators
Manuals and guidelines
2014 edition

Europe Direct is a service to help you find answersto your questions about the European Union.
Freephone number (*):
00 800 6 7 8 9 10 11(*) The information given is free, as are most calls (though some operators, phone
boxes or hotels may charge you).
More information on the European Union is available on the Internet (http://europa.eu).
Luxembourg: Publications Office of the European Union, 2014
ISBN 978-92-79-40322-4ISSN 2315.0815doi:10.2785/56118Cat. No: KS-GQ-14-011-EN-N
Theme 1: General and regional statisticsCollection: Manuals and guidelines
© European Union, 2014Reproduction is authorised provided the source is acknowledged.

Foreword
Towards a harmonised methodology for statistical indicators 3
Foreword Indicators constitute an essential resource for policy-makers, business leaders and the general public.
They assist us in making evidence-based decisions, allow comparisons to be made over time and between
policies and programmes, countries and regions, social groups and industries, and contribute to increased
transparency and accountability. Indicators also provide a very powerful way of communicating
information.
Indicators are used in many areas of social and environmental science, economics, business, and project
management. We do not, however, have a common language for referring to indicators. The variety of
adjectives which often accompany the word ‘indicator’ provides a good illustration of this: headline,
principal, key, core, main, primary, synthetic, composite, contextual, operational, complementary,
explanatory, input, output, outcome and process — to name just a few.
Navigating a route through this jungle of definitions is made much easier when we have some signposts
marking the way. While recognising the importance of preserving the heterogeneity of uses and
terminology specific to each domain, this paper aims to provide a point of reference for general questions
about indicators and indicator sets: why do we use them? what can they measure? and how do they
represent reality? These questions will allow us to distinguish between some of the main types of
indicators.
This paper addresses these questions by referring to the existing literature on indicators and to concrete
examples drawn from the experience of Eurostat and the European Commission as a whole, as well as
other national and international institutions.
This paper is the first in a series of papers on statistical indicators being published by Eurostat. While in
this paper we attempt to provide a general introduction to the characteristics and typologies of indicators,
papers later in the series will examine in more depth issues such as communicating with indicators and
the relationship between indicators and policy-making.
Walter Radermacher
Director-General, Eurostat
Chief Statistician of the European Union
Contents
Towards a harmonised methodology for statistical indicators 4
Contents Foreword ......................................................................................................................................... 3
Table of contents ............................................................................................................................. 4
1. About indicators ........................................................................................................................... 6
From data to statistical indicators ................................................................................................ 7
Why, what and how about indicators ........................................................................................ 10
2. Why do we use indicators? ....................................................................................................... 11
3. What do we use indicators to measure? ................................................................................... 12
The economic cycle framework ................................................................................................. 12
The environment protection framework ..................................................................................... 12
The sustainable development framework ................................................................................. 13
The project framework ............................................................................................................... 14
Policy-derived frameworks ........................................................................................................ 14
How do we combine different indicators? ................................................................................. 17
4. How do indicators represent reality? ......................................................................................... 19
How precisely can we measure reality with indicators? ............................................................ 19
How objectively can we measure reality with indicators? ......................................................... 19
5. Conclusions ............................................................................................................................... 22
Bibliography ................................................................................................................................... 24

Contents
Towards a harmonised methodology for statistical indicators 5
List of tables Table 1: Use of indicators for description or measurement of performance Table 2: The economic cycle framework Table 3: The driving forces, pressure, state, impact and response framework Table 4: The logical framework Table 5: The EU sustainable development indicators Table 6: Direct and indirect indicators Table 7: Objective and subjective indicators Table 8: Quantitative and qualitative indicators
List of boxes Box 1: Indicators and policy Box 2: Using indicators as a way of communicating information Box 3: Constructing indicator frameworks Box 4: Composite indicators: advantages and disadvantages Box 5: Quality criteria for indicators
List of figures Figure 1: Statistical data, accounting systems and indicators Figure 2: Policy evaluation cycle Figure 3: Using indicators as a way of communicating information
About indicators 1
Towards a harmonised methodology for statistical indicators 6
1. About indicators The term ‘indicator’ has its roots in the Latin words indicare (to point out, to show, to indicate) and
index, literally meaning ‘anything used for pointing’ and ‘the finger used for pointing’. Several modern
languages have inherited the latter meaning. We have, for example, the English index finger, the French
index, the Italian dito indice, the Spanish dedo indice, and the Portuguese dedo indicador.
In the same way as a pointing finger, an indicator provides information, and also guidance. A finger
pointing in this or that direction helps us to find, in our range of vision, a specific object, e.g. a road sign,
an exit or a person who can assist us. An indicator likewise provides information that simplifies reality,
for example by extracting data for a specific question or aggregating data on a number of different
variables. By doing so, an indicator can help reveal trends and simplify complex phenomena. (1)
The use of indicators has spread to many areas of social and environmental science, economics, business,
and project management. The knowledge we gain from indicators is not only used to uncover social,
environmental or economic phenomena and to establish connections between them; it also provides a
basis for influencing and controlling such phenomena. Today’s society continuously observes and
assesses itself, setting itself a course towards specific targets (2).
Indicators can provide warning signals and thus improve our ability to take early action, contain risks or
solve existing problems. Indicators assist us in making evidence-based decisions by allowing us to assess
the success of a given policy in achieving its desired objectives (3). In addition, they allow comparisons
over time and between programmes and policies, countries and regions, social groups and industries,
contribute to increased transparency in making and assessing policies, and make policy-makers more
accountable to citizens. Indicators also provide a powerful way of communicating information.
There are, however, some limitations in the use of indicators. First, indicators only ‘indicate’, i.e. they
make us aware of trends, but they do not necessarily provide an explanation. Determining that a change
has taken place does not necessarily give us the reason behind it (4). Secondly, when taken out of context
and considered in isolation, indicators are of limited use. A finger pointing in a certain direction is of no
help to us unless we know the question which the pointing finger is meant to answer — while also being
aware of the questions that the finger cannot answer.
Furthermore, depending on the context, the same indicator can point in opposite directions, i.e. to both
positive and negative developments. For example, in some countries, a high fertility rate could be positive
from the point of view of pension system sustainability, but may not necessarily be so from the point of
view of environmental sustainability (5). Lastly, given that indicators are often used to simplify complex
phenomena, it is important to choose representative indicators, a process which is, to some extent,
inherently subjective and dependent on personal judgment (6).
(1) European Commission, Directorate-General for Agriculture, From Land Cover to Landscape Diversity in the European Union, 2000
(2) Feller-Länzlinger, R., Haefeli, U., Rieder, S., Biebricher, M., Weber, K., Messen, werten, steuern. Indikatoren — Entstehung und Nutzung in der Politik, TA-SWISS, TA-SWISS-Studie TA-54/2010, Bern 2010, p. 19
(3) In 2014, Eurostat released Getting Messages Across: A handbook based on experiences from assessing Sustainable Development Indicators, which provides a classification of methods in the area of indicator-based assessment. The handbook is the result of the work of the Expert Group on Indicator-based Assessment, created in 2010 at the initiative of the Swiss Federal Statistical Office and mandated by the Eurostat Working Group on Sustainable Development Indicators
(4) United Nations Development Programme, RBM in UNDP: Selecting Indicators, Signposts of Development, 2002
(5) European Commission, Eurostat, Sustainable Development in the European Union: 2011 monitoring report of the EU sustainable development strategy, Publications Office for the European Union, Luxembourg, 2011, p. 171.
(6) Bartelmus, P., Sustainability Economics: An introduction, Reutledge, London and New York, 2013, p. 14, see also Engle Merry, S., ‘Measuring the World: Indicators, human rights, and global governance’, Current Anthropology, Volume 52, Supplement 3, April 2011.
About indicators 1
Towards a harmonised methodology for statistical indicators 7
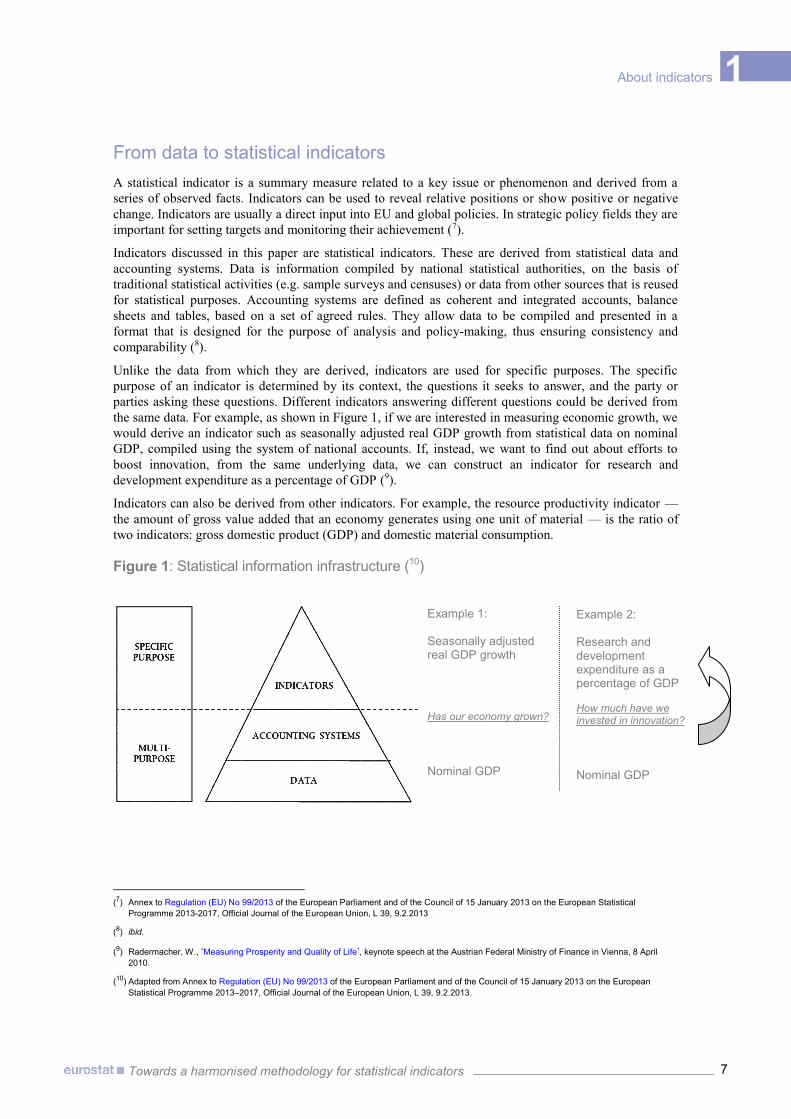
From data to statistical indicators A statistical indicator is a summary measure related to a key issue or phenomenon and derived from a
series of observed facts. Indicators can be used to reveal relative positions or show positive or negative
change. Indicators are usually a direct input into EU and global policies. In strategic policy fields they are
important for setting targets and monitoring their achievement (7).
Indicators discussed in this paper are statistical indicators. These are derived from statistical data and
accounting systems. Data is information compiled by national statistical authorities, on the basis of
traditional statistical activities (e.g. sample surveys and censuses) or data from other sources that is reused
for statistical purposes. Accounting systems are defined as coherent and integrated accounts, balance
sheets and tables, based on a set of agreed rules. They allow data to be compiled and presented in a
format that is designed for the purpose of analysis and policy-making, thus ensuring consistency and
comparability (8).
Unlike the data from which they are derived, indicators are used for specific purposes. The specific
purpose of an indicator is determined by its context, the questions it seeks to answer, and the party or
parties asking these questions. Different indicators answering different questions could be derived from
the same data. For example, as shown in Figure 1, if we are interested in measuring economic growth, we
would derive an indicator such as seasonally adjusted real GDP growth from statistical data on nominal
GDP, compiled using the system of national accounts. If, instead, we want to find out about efforts to
boost innovation, from the same underlying data, we can construct an indicator for research and
development expenditure as a percentage of GDP (9).
Indicators can also be derived from other indicators. For example, the resource productivity indicator —
the amount of gross value added that an economy generates using one unit of material — is the ratio of
two indicators: gross domestic product (GDP) and domestic material consumption.
Figure 1: Statistical information infrastructure (10)
(7) Annex to Regulation (EU) No 99/2013 of the European Parliament and of the Council of 15 January 2013 on the European Statistical
Programme 2013-2017, Official Journal of the European Union, L 39, 9.2.2013
(8) ibid.
(9) Radermacher, W., ‘Measuring Prosperity and Quality of Life’, keynote speech at the Austrian Federal Ministry of Finance in Vienna, 8 April 2010.
(10) Adapted from Annex to Regulation (EU) No 99/2013 of the European Parliament and of the Council of 15 January 2013 on the European Statistical Programme 2013–2017, Official Journal of the European Union, L 39, 9.2.2013.
Example 1: Seasonally adjusted real GDP growth Has our economy grown? Nominal GDP
Example 2: Research and development expenditure as a percentage of GDP How much have we invested in innovation? Nominal GDP

About indicators 1
Towards a harmonised methodology for statistical indicators 8
Box 1: Indicators and policy
Evidence-based policy-making implies not only that all assumptions and parameters of policy development must be based on the latest knowledge. It also requires thorough planning, monitoring and evaluation, i.e. ex-ante, interim and ex-post assessment. Statistics and especially indicators can help to translate the often intangible, abstract objectives set by policies into measurable targets against which progress can be monitored. Indicators can be used throughout the subsequent phases of the policy cycle.
Figure 2: Policy evaluation cycle (11)
The second paper in this series will examine the relevance of indicators to policy in more detail. It will discuss how indicators are used in policy-making and their importance in ensuring transparency in making and assessing policies for the benefit of citizens.
(11) Adapted from Balthasar, A., Evaluationssynthesen: Bedingungen, Möglichkeiten und Grenzen, LeGes — Gesetzgebung & Evaluation, 11(1),
2000, p. 13–25.
Concept
Objectives Processes Action taken by governments
Reaction or modification of behaviour
On - economy, e.g. income - society, e.g. education, - environment, e.g. air quality
Imple-mentation
Output
Outcome
Impact

About indicators 1
Towards a harmonised methodology for statistical indicators 9
Box 2: Using indicators as a way of communicating information
As well as allowing us to measure progress against objectives, statistical indicators also play an important role in communication. Using indicators as a way of communicating information contributes to the democratic governance of today’s society by encouraging the general public to monitor the different aspects of public life in general, and also to look critically at measures being taken by policy-makers.
In view of this, communication should be understood not merely as the dissemination of indicators, but rather as a two-way process in which civil society is provided with indicators and is at the same time involved, by means of public consultations and dialogue with policy-makers, in the development of indicators.
Figure 3: Using indicators as a way of communicating information
The third paper in this series will examine more closely various aspects of communication using indicators. It will focus on:
clarity and simplicity of the message, accessibility of the message, and its relevance to the personal and societal concerns of various groups in society; and
democratic accountability and ownership of the indicators.

About indicators 1
Towards a harmonised methodology for statistical indicators 10
Why, what and how about indicators There are various ways of classifying indicators. One way is by asking the question ‘why do we use
indicators?’ Alternatively, we could consider what exactly is being measured by the indicators, and then
classify them accordingly. Another possible way would be to compare how objectively and directly
indicators represent reality. We will use these three approaches to discuss indicator typologies. As we will
see, however, the approaches are not mutually exclusive, but address three dimensions of the same
phenomenon.
Why do we use indicators?
Why?
How? How objectively and directly do indicators
represent reality?
What? What do we use
indicators to measure?

Why do we use indicators? 2
Towards a harmonised methodology for statistical indicators 11
2. Why do we use indicators? From a strictly functional perspective, indicators can be used either to describe a situation or trend
(descriptive indicators) or to provide an assessment of progress towards established objectives and targets
(performance indicators). Very often, descriptive and performance indicators are used together: we could
measure a phenomenon with the latter, whilst using the former to obtain additional explanation.
In policy-making, the definition of an indicator is often closely related to the concept of performance.
National and international administrations alike use indicators in planning, monitoring and evaluating
their policies. The European Commission, for example, has an obligation to report annually to the
European Parliament and the Council on actions and developments relating to its financial instruments. It
uses performance indicators to monitor achievement of its objectives (12).
A large number of EU policies and initiatives — including the Europe 2020 strategy, the sustainable
development strategy, the macroeconomic imbalance procedure, the excessive budget deficit procedure,
the resource-efficiency flagship initiative, measuring quality of life, and many others — use performance
indicators, descriptive indicators or a mix of the two.
Table 1: Use of indicators for description or measurement of performance
Indicator Description Example
Descriptive (or contextual or situational) indicator
The indicator describes a situation or trend; it provides further explanation of a phenomenon. It reflects the situation as it is, without reference to how the situation should be (13).
Average number of persons per household — used in the context of sustainable development, this indicator is helpful for understanding consumption patterns in various sectors (e.g. electricity, land, transport and waste).
Performance (or normative) indicator
The indicator allows statements to be made describing the situation as better or worse than previously. It shows progress, or the lack of it, towards established objectives and targets or a desired end-state (14).
Greenhouse gas emissions — in view of agreed reduction targets, this is a widely used indicator of performance.
It should be noted that, depending on the context, the same data can be used as both a descriptive and a
performance indicator. For example, the level of literacy could be an indicator of performance in the
context of an educational reform policy. In the context of an awareness campaign, however, it could also
be a descriptive indicator, used to better understand the reaction of a given target group to different forms
of communication, e.g. written as opposed to oral. For this reason, it is always important to clarify the
framework of reference in which an indicator is being used (see next section).
(12) Regulation (EU, Euratom) No 966/2012 of the European Parliament and of the Council of 25 October 2012 on the financial rules applicable to
the general budget of the Union and repealing Council Regulation (EC, Euratom) No 1605/2002.
(13) European Environment Agency, Environmental indicators: Typology and overview, Technical report No 25/1999, Prepared by Smeets E. and Weterings R. (TNO Centre for Strategy, Technology and Policy, The Netherlands), 1999.
(14) Brungger, H., Indicators: spotlights or smokescreen, paper presented at the opening session of the 23rd Nordic Statistical Conference, Turku (Finland), 18 to 21 August 2004.

What do we use indicators to measure? 3
Towards a harmonised methodology for statistical indicators 12
3. What do we use indicators to measure? Indicators are often used to understand multifaceted and complex phenomena, such as the performance of
the economy, the sustainable development of society, quality of life, poverty, resource-efficiency, or
simply the impact of a project or of specific measures taken. Faced with the task of understanding such
phenomena, we need a framework which will help us to determine exactly what we want to measure, its
key dimensions and the links between them, and which indicators to use (15). Frameworks play an
important role in structuring indicator sets. In this second section, we will look at some examples of
frameworks and related indicators. While the list of examples is not exhaustive, it covers some of the
most common frameworks.
The economic cycle framework In the area of economic analysis, the selection of indicators is based either on a framework rooted in
economic theory or on an empirically derived economic model. The economic theory of cycles, for
example, presupposes that the basic business cycle can be defined as a series of economic expansions and
contractions. The theory distinguishes between three types of phenomena: those that usually change
before the economy as a whole changes (leading), those that change at the same time as the whole
economy (coincident), and those that change only after the economy has changed (lagging). By making
use of this theory, it is possible to select leading, coincident and lagging indicators associated with each
stage of the cycle.
Table 2: The economic cycle framework
Indicator Description Examples
Leading indicator The indicator changes before a change is seen in general economic conditions and can therefore be used to predict turning points in the business cycle.
Stock prices, business and consumer expectations.
Coincident indicator
The indicator changes (more or less) simultaneously with general economic conditions and therefore reflects the current status of the economy.
Industrial production or turnover.
Lagging indicator The indicator changes after macroeconomic conditions have changed. Lagging indicators are used to confirm economic trends that have already been predicted by leading indicators or shown by coincident indicators.
Unemployment figures, profits, interest rates.
The environment protection framework In the area of environment protection, one of the first frameworks used to establish cause-and-effect
relationships between the various components of a system and its related indicators is the pressure, state
and response framework developed by the OECD. The European Environmental Agency has further
expanded on this earlier work to create a framework of driving forces, pressures, states, impacts and
responses (the DPSIR framework) which is the most commonly used in Europe (16).
(15) United Nations, Indicators of Sustainable Development: Guidelines and Methodologies, Third Edition, United Nations, 2007, p. 39.
(16) European Environment Agency, Environmental indicators: Typology and overview, Technical report No 25/1999, Prepared by Smeets E. and Weterings R. (TNO Centre for Strategy, Technology and Policy, The Netherlands), 1999.

What do we use indicators to measure? 3
Towards a harmonised methodology for statistical indicators 13
Table 3: The driving forces, pressure, state, impact and response framework
Indicator Description Examples
Driving force indicator
The indicator describes the social, demographic or economic developments in societies and the corresponding changes in lifestyles and overall levels of consumption and production patterns.
Population dynamics or GDP.
Pressure indicator The indicator describes developments in the release of substances, physical and biological agents, the use of resources and the use of land.
CO2 emissions, use of natural resources, land use.
State indicator The indicator provides a description of the quantity and quality of physical, biological and chemical variables in a certain area.
Global mean temperature, species diversity and atmospheric CO2 concentrations.
Impact indicator The indicator describes the relevance of changes in the state of the environment and corresponding implications for ecosystems, the economy, human well-being and health.
Percentage of the population exposed to noise above particular thresholds or drinking water below quality standards.
Response indicator The indicator refers to responses by society and policymakers that attempt to prevent, compensate, ameliorate, or adapt to changes in the state of the environment.
Environmental expenditure and recycling rates.
The DPSIR framework allows further classification of indicators, namely ‘efficiency indicators’ which
express the relation between separate elements of the causal chain. The most relevant examples of
efficiency indicators are those that relate environmental pressures to human activities, i.e. efficiency in
terms of the resources used, the emissions and waste generated per unit of desired output (17).
The sustainable development framework The joint task-force of the United Nations Economic Commission for Europe, Eurostat and the
Organisation for Economic Cooperation and Development on measuring sustainable development
presented a conceptual framework for measuring sustainable development based on three dimensions: the
human wellbeing of the present generation in a country (referred to as ‘here and now’), the wellbeing of
future generations in that country (‘later’) and the wellbeing of people living in other countries
(‘elsewhere’). The framework looks at four types of capital stock (economic, natural, human and social)
and how current and future developments may affect them, as well as how developments in one country
may affect another (18).
An alternative to the above is offered by the ‘thematic approach’, used for example for the EU’s
sustainable development indicators. Under this approach, the framework of reference is based on the
various areas being investigated (see Table 5).
(17) ibid.
(18) Joint Task-Force of the United Nations Economic Commission for Europe, Eurostat and the Organisation for Economic Cooperation and Development on measuring sustainable development, Framework and suggested indicators to measure sustainable development, 27 May 2013.

What do we use indicators to measure? 3
Towards a harmonised methodology for statistical indicators 14
The project framework In the area of project management, a typical example of the type of approach taken is the logical
framework (consisting of input, output, outcome and impact). This is based on a linear chain of causal
relations going from the initial resources set aside for a given project (input) to its outputs, the outcomes
on its target group and finally the broader and more long-term impacts. Indicators used for the different
elements of the framework measure how a system, process, policy or programme works, the cause-and-
effect relationships that exist between its different elements, and its efficiency and effectiveness.
Table 4: The logical framework
Indicator Description (19) Examples (20)
Input indicator The indicator measures the financial, human and material resources used in a given policy, programme or project.
Proportion of the budget devoted to education.
Output indicator The indicator measures the products, capital goods or services that result from a given policy, programme or project.
Number of schools built, number of teachers trained.
Outcome indicator The indicator measures the output’s effects, in the short or medium term, on the target group, for instance, in the form of behavioural change.
School enrolment rates, fall in dropout rates.
Impact indicator The indicator measures the positive and negative, primary and secondary long-term effects produced, whether directly or indirectly and whether intended or unintended.
Literacy rates.
The logical framework has been widely used in public sector programmes and often forms the basis for
evaluations (21). Improving the measurement of services provided by governments is particularly
important in times of budgetary constraints, when they are often faced with the question of how to spend
less and do more. The report by the Commission on the Measurement of Economic Performance and
Social Progress (22) explains that ‘traditionally, for government-provided non-market services, measures
have been based on the inputs used to produce these services, rather than on the actual outputs produced.
An immediate consequence is that productivity change for government-provided services is ignored […]
Work has started in many countries to develop output measures for these government-provided services
that are independent of inputs, but the task is formidable’.
Policy-derived frameworks The majority of frameworks and related indicators are not based on purely conceptual foundations, but
are also derived from policies. Typical examples are the UN millennium development goals and the EU
sustainable development strategy. Policy-derived frameworks should ideally be the result of interaction
between the political, the scientific and the statistical worlds. Objectives set at political level give the
framework credibility, the underpinning scientific theory gives it conceptual soundness, and the
(19) Based on the definitions in the Organisation for Economic Cooperation and Development’s Glossary of Key Terms in Evaluation and Results-
Based Management, 2002.
(20) Based on the examples in the European Commission’s Project Cycle Management Guidelines, 2004.
(21) European Commission, Evaluating EU Activities: A practical guide for the Commission services, Office for Official Publications of the European Communities, Luxembourg, 2004.
(22) Stiglitz, J. E., Sen, A., Fitoussi, J-P., Report by the Commission on the Measurement of Economic Performance and Social Progress, 2009, p. 27.
What do we use indicators to measure? 3
Towards a harmonised methodology for statistical indicators 15
availability of statistical indicators makes it measurable. Balancing the three elements ensures that the
framework is politically relevant, is consistent with current theory, and that its targets are measurable (see
Box 3).
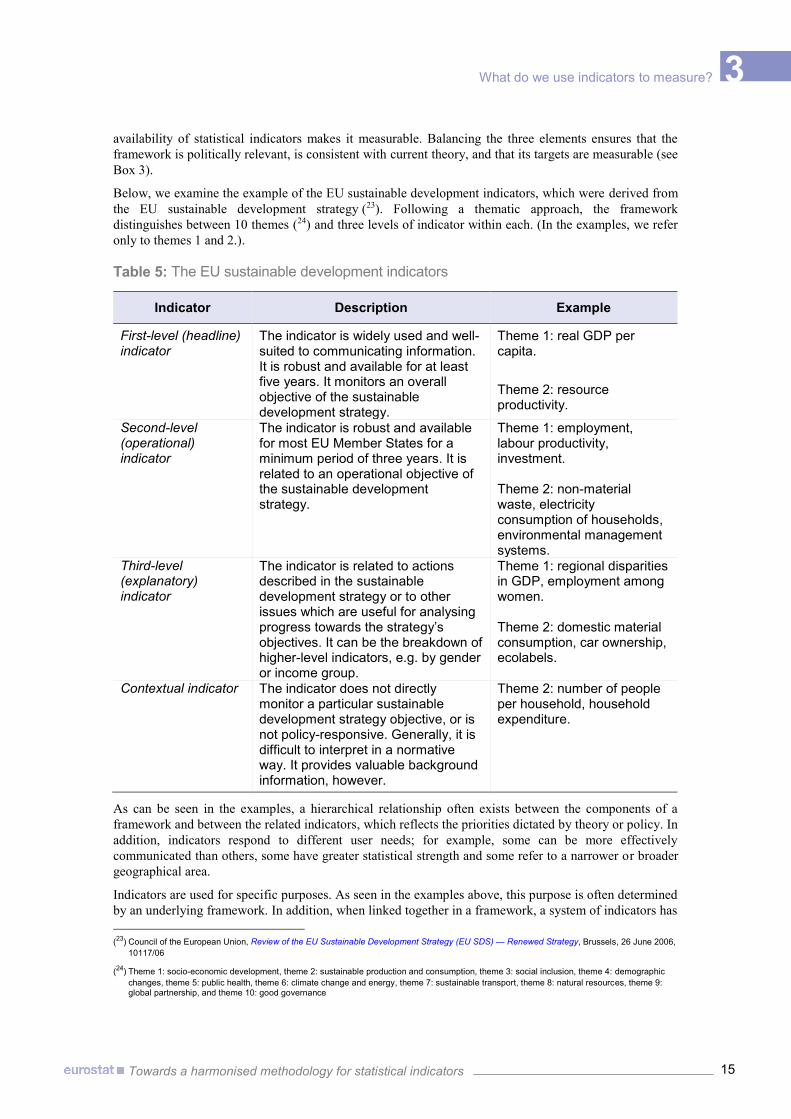
Below, we examine the example of the EU sustainable development indicators, which were derived from
the EU sustainable development strategy (23). Following a thematic approach, the framework
distinguishes between 10 themes (24) and three levels of indicator within each. (In the examples, we refer
only to themes 1 and 2.).
Table 5: The EU sustainable development indicators
Indicator Description Example
First-level (headline) indicator
The indicator is widely used and well-suited to communicating information. It is robust and available for at least five years. It monitors an overall objective of the sustainable development strategy.
Theme 1: real GDP per capita. Theme 2: resource productivity.
Second-level (operational) indicator
The indicator is robust and available for most EU Member States for a minimum period of three years. It is related to an operational objective of the sustainable development strategy.
Theme 1: employment, labour productivity, investment. Theme 2: non-material waste, electricity consumption of households, environmental management systems.
Third-level (explanatory) indicator
The indicator is related to actions described in the sustainable development strategy or to other issues which are useful for analysing progress towards the strategy’s objectives. It can be the breakdown of higher-level indicators, e.g. by gender or income group.
Theme 1: regional disparities in GDP, employment among women. Theme 2: domestic material consumption, car ownership, ecolabels.
Contextual indicator The indicator does not directly monitor a particular sustainable development strategy objective, or is not policy-responsive. Generally, it is difficult to interpret in a normative way. It provides valuable background information, however.
Theme 2: number of people per household, household expenditure.
As can be seen in the examples, a hierarchical relationship often exists between the components of a
framework and between the related indicators, which reflects the priorities dictated by theory or policy. In
addition, indicators respond to different user needs; for example, some can be more effectively
communicated than others, some have greater statistical strength and some refer to a narrower or broader
geographical area.
Indicators are used for specific purposes. As seen in the examples above, this purpose is often determined
by an underlying framework. In addition, when linked together in a framework, a system of indicators has
(23) Council of the European Union, Review of the EU Sustainable Development Strategy (EU SDS) — Renewed Strategy, Brussels, 26 June 2006,
10117/06
(24) Theme 1: socio-economic development, theme 2: sustainable production and consumption, theme 3: social inclusion, theme 4: demographic changes, theme 5: public health, theme 6: climate change and energy, theme 7: sustainable transport, theme 8: natural resources, theme 9: global partnership, and theme 10: good governance
What do we use indicators to measure? 3
Towards a harmonised methodology for statistical indicators 16
a greater value than the sum of its individual parts.
Nonetheless, there are inevitably limitations in the use of indicator frameworks. Indicators are useful as a
way of representing reality, but the real world is far too complex to be fully captured by an underlying
framework or system of indicators.
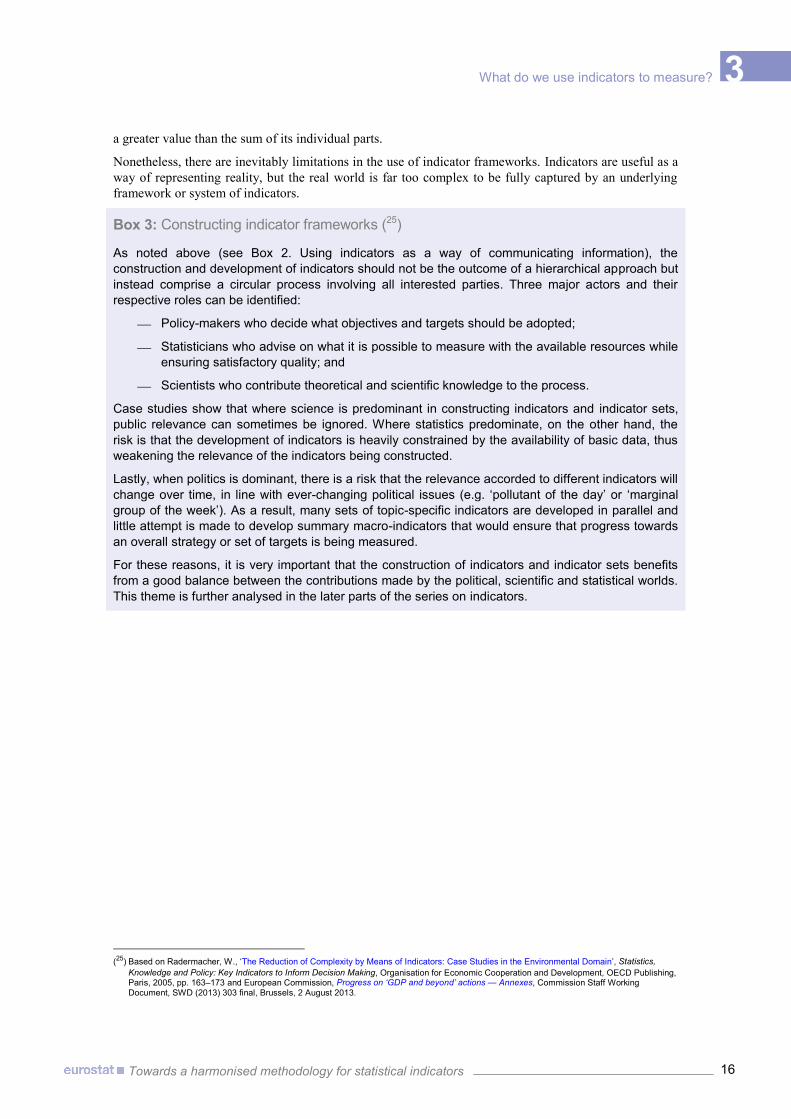
Box 3: Constructing indicator frameworks (25)
As noted above (see Box 2. Using indicators as a way of communicating information), the construction and development of indicators should not be the outcome of a hierarchical approach but instead comprise a circular process involving all interested parties. Three major actors and their respective roles can be identified:
Policy-makers who decide what objectives and targets should be adopted;
Statisticians who advise on what it is possible to measure with the available resources while ensuring satisfactory quality; and
Scientists who contribute theoretical and scientific knowledge to the process.
Case studies show that where science is predominant in constructing indicators and indicator sets, public relevance can sometimes be ignored. Where statistics predominate, on the other hand, the risk is that the development of indicators is heavily constrained by the availability of basic data, thus weakening the relevance of the indicators being constructed.
Lastly, when politics is dominant, there is a risk that the relevance accorded to different indicators will change over time, in line with ever-changing political issues (e.g. ‘pollutant of the day’ or ‘marginal group of the week’). As a result, many sets of topic-specific indicators are developed in parallel and little attempt is made to develop summary macro-indicators that would ensure that progress towards an overall strategy or set of targets is being measured.
For these reasons, it is very important that the construction of indicators and indicator sets benefits from a good balance between the contributions made by the political, scientific and statistical worlds. This theme is further analysed in the later parts of the series on indicators.
(25) Based on Radermacher, W., ‘The Reduction of Complexity by Means of Indicators: Case Studies in the Environmental Domain’, Statistics,
Knowledge and Policy: Key Indicators to Inform Decision Making, Organisation for Economic Cooperation and Development, OECD Publishing, Paris, 2005, pp. 163–173 and European Commission, Progress on ‘GDP and beyond’ actions — Annexes, Commission Staff Working Document, SWD (2013) 303 final, Brussels, 2 August 2013.

What do we use indicators to measure? 3
Towards a harmonised methodology for statistical indicators 17
How do we combine different indicators? The examples above show that more than a single indicator is required if we are to understand complex
phenomena. Focusing only on one indicator, for example GDP, which has often been treated as if it were
a measure of economic wellbeing although in reality it mainly measures production (26), can be
misleading. To understand complex phenomena, we need entire systems of indicators representing the
different facets of the subject under investigation (27).
For these reasons, statistics are increasingly published in the form of sets of indicators. A set of
indicators is a multivariate collection of indicators which have a broader field of application or cover a
political area (rather than measuring progress towards one target only). A set is more than the sum of its
individual parts. It is conceived within a reference framework, so that the set as a whole provides a
complete picture of the phenomenon in question. Each indicator is designed to paint a part of this picture,
but will often need to be interpreted in relation to others. The selection of an appropriate framework is
crucial to the usefulness of a set of indicators. An optimal mix of theory-driven and policy-driven
indicators is often critical. Some examples, as already mentioned, are the Millennium Development Goals
indicators and the EU sustainable development indicators. It is also important to restrict a set of indicators
to those that are necessary, to avoid diluting key information.
Sets of indicators are often referred to as scoreboards or dashboards. Usually, scoreboards are concise
lists of key performance indicators (often derived from a larger set) which are used to assess progress
against specific targets. Dashboards, on the other hand, do not necessarily have a normative function.
What is critical in establishing a dashboard of indicators is that different information must be displayed
separately. The report by the Commission on the Measurement of Economic Performance and Social
Progress uses the analogy of a car with a meter aggregating in a single value the speed of the vehicle and
the remaining level of petrol. Such a meter would be of no use to drivers as ‘both pieces of information
are critical and need to be displayed in distinct, clearly visible areas of the dashboard’ (28).
Another way of combining different indicators is by using a composite indicator or index. A composite
indicator is created when individual indicators with different units of measurement are combined into a
single measure. Composite indicators are often used to measure multidimensional and in many cases
abstract concepts which cannot be captured by basic components (29). A classic example is the UN’s
human development index, which combines statistics on life expectancy, education and income in a
single number.
It should be noted that the construction and use of composite indicators presents some considerable
difficulties (see Box 4). They are not suitable in cases where the information in question can be more
usefully displayed as distinct basic indicators. In general, the more complex the phenomenon being
described, the more attention is needed to produce a composite indicator (a process which involves the
selection of the component indicators, the aggregation process and the weighting of the different
components). The information provided by composite indicators may vary according to the methodology
used for their construction and, as a result, they may be more sensitive and more susceptible to
manipulation.
An alternative way of combining indicators is by using a synthetic indicator. A synthetic indicator is
also obtained by aggregating several basic indicators, but it is different from a composite indicator
because the aggregation takes place at the level of the ‘individual’. A synthetic indicator can measure a
uni-dimensional or multi-dimensional underlying theoretical concept that is well-defined in the literature.
One example of a uni-dimensional synthetic indicator, being developed as one of Eurostat’s quality of life
(26) European Commission, GDP and beyond — measuring progress in a changing world, Communication for the Commission to the Council and
the European Parliament, COM(2009)433 of 20 August 2009.
(27) Feller-Länzlinger, R., Haefeli, U., Rieder, S., Biebricher, M., Weber, K., Messen, werten, steuern. Indikatoren — Entstehung und Nutzung in der Politik, TA-SWISS, TA-SWISS-Studie TA-54/2010, Bern 2010.
(28) Stiglitz, J. E., Sen, A., Fitoussi, J-P., Report by the Commission on the Measurement of Economic Performance and Social Progress, 2009, p. 27.
(29) European Commission, Eurostat, Terminology Relating to the Implementation of the Vision on the Production Method of EU Statistics.
What do we use indicators to measure? 3
Towards a harmonised methodology for statistical indicators 18
indicators, is ‘social contacts’, which is constructed from the frequency of contact with and of getting
together with relatives and friends (30). An example of a multi-dimensional synthetic indicator is ‘people
at risk of poverty and social exclusion’, which combines information on people who are at risk of
poverty, people who are materially deprived, and people living in households with very low work
intensity.
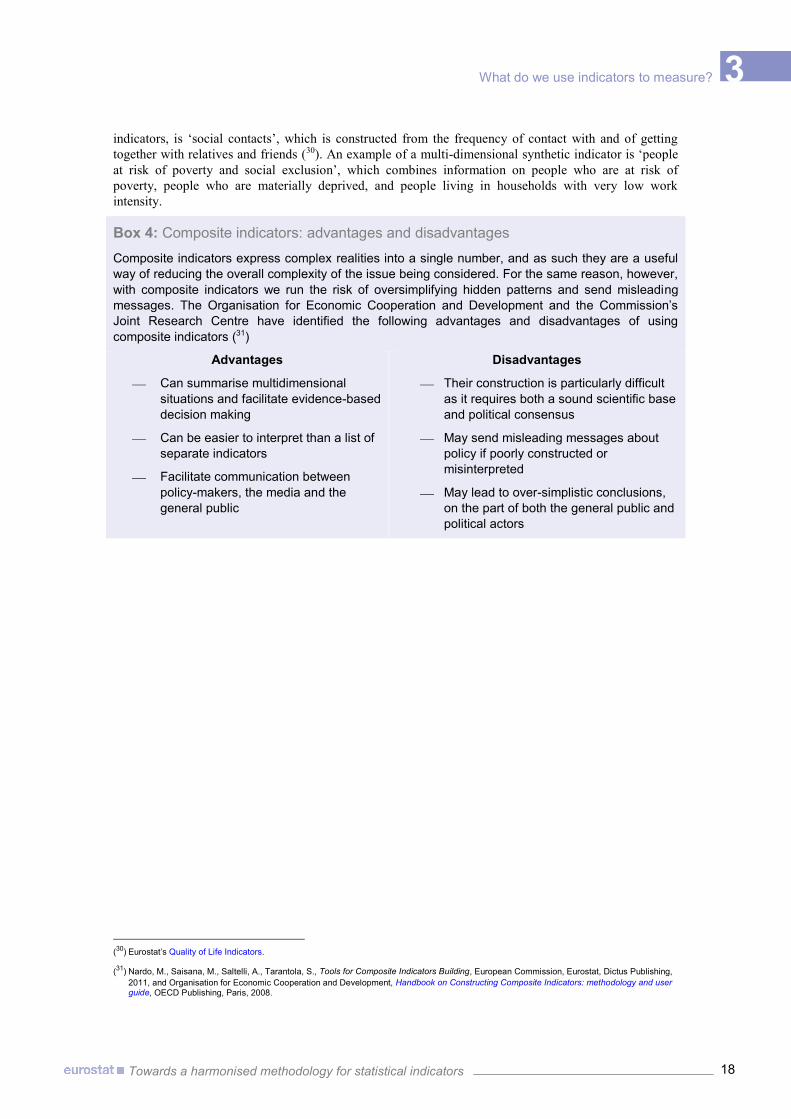
Box 4: Composite indicators: advantages and disadvantages
Composite indicators express complex realities into a single number, and as such they are a useful way of reducing the overall complexity of the issue being considered. For the same reason, however, with composite indicators we run the risk of oversimplifying hidden patterns and send misleading messages. The Organisation for Economic Cooperation and Development and the Commission’s Joint Research Centre have identified the following advantages and disadvantages of using composite indicators (31)
Advantages
Can summarise multidimensional situations and facilitate evidence-based decision making
Can be easier to interpret than a list of separate indicators
Facilitate communication between policy-makers, the media and the general public
Disadvantages
Their construction is particularly difficult as it requires both a sound scientific base and political consensus
May send misleading messages about policy if poorly constructed or misinterpreted
May lead to over-simplistic conclusions, on the part of both the general public and political actors
(30) Eurostat’s Quality of Life Indicators.
(31) Nardo, M., Saisana, M., Saltelli, A., Tarantola, S., Tools for Composite Indicators Building, European Commission, Eurostat, Dictus Publishing, 2011, and Organisation for Economic Cooperation and Development, Handbook on Constructing Composite Indicators: methodology and user guide, OECD Publishing, Paris, 2008.
Conclusions
Towards a harmonised methodology for statistical indicators 19
4. How do indicators represent reality? We have seen that there are different ways of classifying indicators. We can approach the question by
asking why we are using an indicator to observe reality, whether the indicator is used simply to describe
the situation or whether it helps us to assess progress towards a target. Alternatively, we can consider
exactly what aspects and dimensions of a situation indicators are helping us to measure and understand.
In this third section, we explore the third way of classifying indicators, by asking how precisely they can
measure reality, and how objectively.
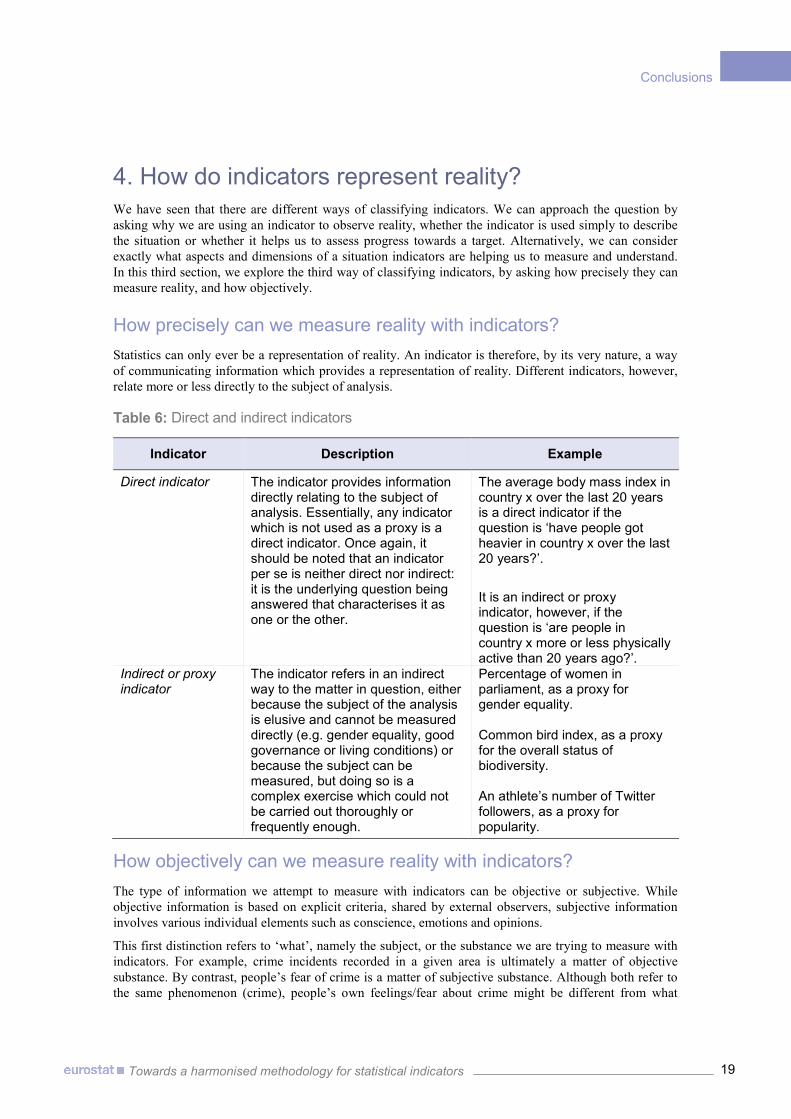
How precisely can we measure reality with indicators? Statistics can only ever be a representation of reality. An indicator is therefore, by its very nature, a way
of communicating information which provides a representation of reality. Different indicators, however,
relate more or less directly to the subject of analysis.
Table 6: Direct and indirect indicators
Indicator Description Example
Direct indicator The indicator provides information directly relating to the subject of analysis. Essentially, any indicator which is not used as a proxy is a direct indicator. Once again, it should be noted that an indicator per se is neither direct nor indirect: it is the underlying question being answered that characterises it as one or the other.
The average body mass index in country x over the last 20 years is a direct indicator if the question is ‘have people got heavier in country x over the last 20 years?’. It is an indirect or proxy indicator, however, if the question is ‘are people in country x more or less physically active than 20 years ago?’.
Indirect or proxy indicator
The indicator refers in an indirect way to the matter in question, either because the subject of the analysis is elusive and cannot be measured directly (e.g. gender equality, good governance or living conditions) or because the subject can be measured, but doing so is a complex exercise which could not be carried out thoroughly or frequently enough.
Percentage of women in parliament, as a proxy for gender equality. Common bird index, as a proxy for the overall status of biodiversity. An athlete’s number of Twitter followers, as a proxy for popularity.
How objectively can we measure reality with indicators? The type of information we attempt to measure with indicators can be objective or subjective. While
objective information is based on explicit criteria, shared by external observers, subjective information
involves various individual elements such as conscience, emotions and opinions.
This first distinction refers to ‘what’, namely the subject, or the substance we are trying to measure with
indicators. For example, crime incidents recorded in a given area is ultimately a matter of objective
substance. By contrast, people’s fear of crime is a matter of subjective substance. Although both refer to
the same phenomenon (crime), people’s own feelings/fear about crime might be different from what

Conclusions
Towards a harmonised methodology for statistical indicators 20
actual crime incidences might suggest.
The distinction between objective and subjective substance is different from the question of ‘how’ we
measure it, the distinction between subjective or objective assessment methods. Looking once again at the
example of crime, one could assess its levels by looking at police records (objective measurement), or by
asking people how high they think crime levels are (subjective measurement) (32). Noise provides another
example, we could measure its level with a machine (objective measurement) or by asking people
whether they suffer from it (subjective measurement). When referring to objective and subjective
indicators, it is important to clarify between what is being measured and how it is being measured.
Table 7: Objective and subjective indicators
What How
Objective substance Subjective measurement Objective measurement
Subjective substance Subjective measurement Objective measurement
Inevitably, all objective indicators carry a subjective value load inherent in the process of collection,
selection and presentation of statistics, and subjective indicators borrow objective modes of grouping,
ranking and partitioning the data (33).
The distinction between objective and subjective indicators is different from the distinction between
quantitative and qualitative indicators, which refers to how data is collected and ultimately presented.
Although very often objective measurement leads to quantitative indicators, it can also result in a
qualitative result, for example in the form of a yes or no answer or category classification related to an
objective fact which is verified by external observers. The same is also true for the opposite. For example,
a subjective indicator derived from a survey could produce an agree/disagree result (qualitative) or a
scoring (quantitative).
Table 8: Quantitative and qualitative indicators
Indicator Description Examples
Quantitative indicator The indicator is derived from a counting process; it is a measure of quantity (e.g. number, ratio, proportion or percentile).
Number of participants in a training programme.
Qualitative indicator The indicator is derived from a quality assessment, e.g. in the form of a yes/no question or a question about category (e.g. gender, nationality).
Type and level of skills obtained in a training programme.
(32) European Commission, Eurostat, Feasibility study for well-being indicators: Task 4: Critical review, p. 15.
(33) Horn, R. V., Statistical indicators for the economic and social sciences, Cambridge University Press 1993, p. 9.

Conclusions
Towards a harmonised methodology for statistical indicators 21
Box 5: Quality criteria for indicators
Indicators are summary measures derived from data and accounting systems. In addition, frameworks play an important role in structuring indicator sets. Therefore, a distinction could be made between three aspects: the quality of the data and accounting systems from which indicators are derived; the quality of the indicators themselves; and the quality of the indicators in relation to the framework of reference and other indicators within a given set.
The Quality Assurance Framework of the European Statistical System develops ten quality principles related to the institutional environment (commitment to quality), statistical production processes (sound methodology, appropriate procedures, non-excessive burden on respondents, cost-effectiveness) and statistical output (relevance, accuracy and reliability, timeliness and punctuality, coherence and comparability, accessibility and clarity) (34).
With regard to individual indicators, Eurostat has adopted a quality grading system based on three concepts: 1) comparability over time, 2) comparability between countries and 3) accuracy. The system can lend three ratings: high, medium or low (35). The quality grading is displayed in the indicator profile, together with background information on the indicator.
With regard to the process of selecting indicators for a set, existing practice (36) refers to the following ideal criteria:
Relevance and utility for users
The indicator provides a representative picture of the phenomenon it describes and, in the case of performance indicators, is clearly linked to the target it purports to measure
The indicator is responsive to changes and, in the case of performance indicators, policy interventions
The indicator provides basis for international comparisons and is able to show trends over time
The indicator is easy to understand for policy-makers, the general public and other stakeholders
Methodological soundness
The indicator should be robust and statistically validated
The indicator should be based to the greatest extent possible on existing agreed definitions, classifications, standards, recommendations and best practices
The methodology behind the indicator should be well documented and readily available
Measurability
The indicator should be measured in a cost-effective and practical manner. A regular data collection mechanism has been or can be developed with reasonable costs
The indicator should be updated at regular intervals in accordance with reliable procedures
A meaningful trend analysis is possible
Criteria for the indicator set
Indicators should be consistent with and complementary to each other (coherence)
Indicators should be limited in number (parsimony)
(34)European Statistical System, Quality Assurance Framework of the European Statistical System; and European Statistical System, European
Statistics Code of Practice
(35)Eurostat’s Quality Grading System
(36)The list has been created taking into account Organisation for Economic Cooperation and Development, OECD Core set of indicators for environmental performance reviews - A synthesis report by the Group on the State of the Environment, OECD Publishing, 1993; and United Nations, Lessons learnt from MDG Monitoring for a Statistical Perspective, Report of the Task Team on Lessons Learned from MDG Monitoring of the IAE-MDG, March 2013
Conclusions
Towards a harmonised methodology for statistical indicators 22
Conclusions Indicators are very useful as a way of communicating information. They can simplify reality, for
example, by extracting data for a specific question or aggregating data on a number of different variables.
By doing so, indicators can help reveal trends and simplify complex phenomena. They assist us in
making evidence-based decisions, allow comparisons to be made over time and between programmes and
policies, countries and regions, and also contribute to increased transparency and accountability. In
addition, indicators provide a very powerful way of communicating information.
There are, however, some limitations in the use of indicators. Firstly, indicators only ‘indicate’, i.e. they
make us aware of trends, but they do not necessarily provide an explanation. Secondly, when taken out of
context and considered in isolation, indicators are of limited use. Indicators serve a specific and precise
purpose, depending on the context in which they are used, the questions they seek to answer, and the
reason for which these questions are being asked. Failing to understand the underlying framework on
which indicators or indicator sets are constructed can lead to misleading results.
This paper is the first in a series of papers on statistical indicators being published by Eurostat. While in
this paper we have attempted to provide a general introduction to the characteristics and typologies of
indicators, the upcoming papers in the series will examine issues such as communicating with indicators
and the relationship between indicators and policy in more depth.
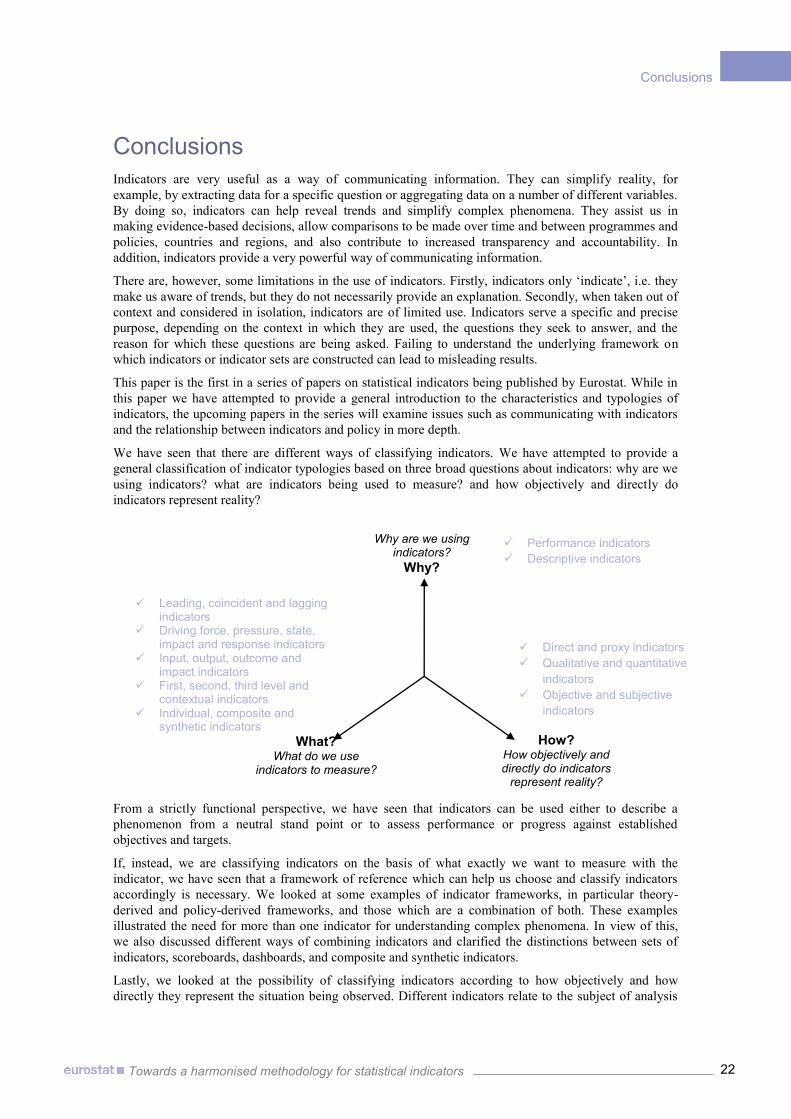
We have seen that there are different ways of classifying indicators. We have attempted to provide a
general classification of indicator typologies based on three broad questions about indicators: why are we
using indicators? what are indicators being used to measure? and how objectively and directly do
indicators represent reality?
From a strictly functional perspective, we have seen that indicators can be used either to describe a
phenomenon from a neutral stand point or to assess performance or progress against established
objectives and targets.
If, instead, we are classifying indicators on the basis of what exactly we want to measure with the
indicator, we have seen that a framework of reference which can help us choose and classify indicators
accordingly is necessary. We looked at some examples of indicator frameworks, in particular theory-
derived and policy-derived frameworks, and those which are a combination of both. These examples
illustrated the need for more than one indicator for understanding complex phenomena. In view of this,
we also discussed different ways of combining indicators and clarified the distinctions between sets of
indicators, scoreboards, dashboards, and composite and synthetic indicators.
Lastly, we looked at the possibility of classifying indicators according to how objectively and how
directly they represent the situation being observed. Different indicators relate to the subject of analysis
Why are we using indicators?
Why?
How? How objectively and directly do indicators
represent reality?
What? What do we use
indicators to measure?
Performance indicators Descriptive indicators
Leading, coincident and lagging indicators
Driving force, pressure, state, impact and response indicators
Input, output, outcome and impact indicators
First, second, third level and contextual indicators
Individual, composite and synthetic indicators
Direct and proxy indicators Qualitative and quantitative
indicators Objective and subjective
indicators
Conclusions
Towards a harmonised methodology for statistical indicators 23
with different degrees of directness — hence the distinction between direct and indirect or proxy
indicators. In addition, the information provided by an indicator can be objective or subjective. It is
important not to confuse the distinction between objective and subjective information with the distinction
between quantitative and qualitative indicators. The former often refers to the subject of analysis, i.e.
what we want to understand or measure, whereas the latter refers to the way in which the subject is
measured. Qualitative and quantitative indicators can in principle be combined to measure objective or
subjective phenomena, though not without some limitations.
We have also seen that these typologies of indicators are not mutually exclusive. We could, for example,
use a proxy indicator, e.g. the common bird index, to understand the overall state of biodiversity (as a
state indicator in a driving force, pressure, state, impact and response framework). Likewise, we could
also use an indicator with a target (a performance indicator) which is based on qualitative data (thus a
qualitative indicator) to assess the outcome of a given project (as an outcome indicator in a logical
framework), e.g. user satisfaction with a given training programme (subjective indicator).
Bibliography
Towards a harmonised methodology for statistical indicators 24
Bibliography Balthasar, A., Evaluationssynthesen: Bedingungen, Möglichkeiten und Grenzen, LeGes — Gesetzgebung
& Evaluation, 11(1), 2000
Bartelmus, P., Sustainability Economics: An introduction, Reutledge, London and New York, 2013
Brungger, H., Indicators: spotlights or smokescreen, Paper presented at the opening session of the 23rd
Nordic Statistical Conference, Turku, Finland, 18 to 21 August 2004
Council of the European Union, Review of the EU Sustainable Development Strategy (EU SDS) — Renewed Strategy, Brussels, 26 June 2006, 10117/06
Engle Merry, S., ‘Measuring the World: Indicators, human rights, and global governance’, Current
Anthropology, Volume 52, Supplement 3, April 2011
European Commission, Directorate-General for Agriculture, From Land Cover to Landscape Diversity in the European Union, 2000
European Commission, Directorate-General for Development Cooperation, Project Cycle Management Guidelines, 2004
European Commission, Eurostat, Feasibility study for well-being indicators: Task 4: Critical review
European Commission, Eurostat, Sustainable Development in the European Union: 2011 monitoring report of the EU sustainable development strategy, Publications Office for the European Union,
Luxembourg, 2011
European Commission, Eurostat, Terminology Relating to the Implementation of the Vision on the Production Method of EU Statistics
European Commission, Eurostat, Getting Messages Across: A handbook based on experiences from
assessing Sustainable Development Indicators, Publication Office for the European Union, Luxembourg,
2014
European Commission, Evaluating EU Activities: A practical guide for the Commission services, Office
for Official Publications of the European Communities, Luxembourg, 2004
European Commission, GDP and beyond — measuring progress in a changing world, Communication
for the Commission to the Council and the European Parliament, COM(2009)433 of 20 August 2009
European Commission, Progress on ‘GDP and beyond’ actions — Annexes, Commission Staff Working
Document, SWD (2013) 303 final, Brussels, 2 August 2013
European Environment Agency, Environmental indicators: Typology and overview, Technical report No
25/1999, Prepared by Smeets E. and Weterings R. (TNO Centre for Strategy, Technology and Policy, The
Netherlands), 1999
European Statistical System, Quality Assurance Framework of the European Statistical System
European Statistical System, European Statistics Code of Practice
Feller-Länzlinger, R., Haefeli, U., Rieder, S., Biebricher, M., Weber, K., Messen, werten, steuern. Indikatoren — Entstehung und Nutzung in der Politik, TA-SWISS, TA SWISS-Studie TA-54/2010, Bern 2010
Horn, R. V., Statistical indicators for the economic and social sciences, Cambridge University Press 1993
Joint Task-Force of the United Nations Economic Commission for Europe, Eurostat and the Organisation
for Economic Cooperation and Development on measuring sustainable development, Framework and suggested indicators to measure sustainable development, 27 May 2013
Nardo, M., Saisana, M., Saltelli, A., Tarantola, S., Tools for Composite Indicators Building, European

Bibliography
Towards a harmonised methodology for statistical indicators 25
Commission, Eurostat, Dictus Publishing, 2011
Organisation for Economic Cooperation and Development, OECD Core set of indicators for environmental performance reviews — A synthesis report by the Group on the State of the Environment, OECD Publishing, 1993
Organisation for Economic Cooperation and Development, Glossary of Key Terms in Evaluation and Results-Based Management, 2002
Organisation for Economic Cooperation and Development, Handbook on Constructing Composite Indicators: methodology and user guide, OECD Publishing, Paris, 2008
Radermacher, W., ‘The Reduction of Complexity by Means of Indicators: Case Studies in the Environmental Domain’, Statistics, Knowledge and Policy: Key Indicators to Inform Decision Making,
Organisation for Economic Cooperation and Development, OECD Publishing, Paris, 2005
Radermacher, W., ‘Measuring Prosperity and Quality of Life’, keynote speech at the Austrian Federal
Ministry of Finance in Vienna, 8 April 2010
Regulation (EU) No 99/2013 of the European Parliament and of the Council of 15 January 2013 on the
European Statistical Programme 2013-2017, Official Journal of the European Union, L 39, 9.2.2013
Regulation (EU, Euratom) No 966/2012 of the European Parliament and of the Council of 25 October
2012 on the financial rules applicable to the general budget of the Union and repealing Council
Regulation (EC, Euratom) No 1605/2002
Stiglitz, J. E., Sen, A., Fitoussi, J-P., Report by the Commission on the Measurement of Economic Performance and Social Progress, 2009
United Nations Development Programme, RBM in UNDP: Selecting Indicators, Signposts of Development, 2002
United Nations, Indicators of Sustainable Development: Guidelines and Methodologies, Third Edition,
United Nations, 2007
United Nations, Lessons learnt from MDG Monitoring for a Statistical Perspective, Report of the Task
Team on Lessons Learned from MDG Monitoring of the IAE-MDG, March 2013


HOW TO OBTAIN EU PUBLICATIONS
Free publications: • one copy:
via EU Bookshop (http://bookshop.europa.eu);
• more than one copy or posters/maps: from the European Union’s representations (http://ec.europa.eu/represent_en.htm); from the delegations in non-EU countries (http://eeas.europa.eu/delegations/index_en.htm); by contacting the Europe Direct service (http://europa.eu/europedirect/index_en.htm) or calling 00 800 6 7 8 9 10 11 (freephone number from anywhere in the EU) (*). (*) The information given is free, as are most calls (though some operators, phone boxes or hotels may charge you).
Priced publications: • via EU Bookshop (http://bookshop.europa.eu).
Priced subscriptions: • via one of the sales agents of the Publications Office of the European Union
(http://publications.europa.eu/others/agents/index_en.htm).

Exer in vulla faci blamconse euis nibh el utat dip ex elestisi
m Rilis augiati siscilit
venis nim
2013 edition
KS-GQ-14-011-EN-N
doi:10.2785/56118