Towards a Comprehensive Private Health Insurance market …. Andrew Murray (final).pdf · Towards a...
38
Towards a Comprehensive Private Health Insurance market in China The Actuarial Society of Hong Kong Dr. Andrew Murray Senior Vice President: Strategic Risk Management, Discovery International 7 March 2013
-
Upload
phunghuong -
Category
Documents
-
view
215 -
download
0
Transcript of Towards a Comprehensive Private Health Insurance market …. Andrew Murray (final).pdf · Towards a...

Towards a Comprehensive Private Health Insurance market in China
The Actuarial Society of Hong Kong
Dr. Andrew MurraySenior Vice President: Strategic Risk Management, Discovery International
7 March 2013

2
1
2
3
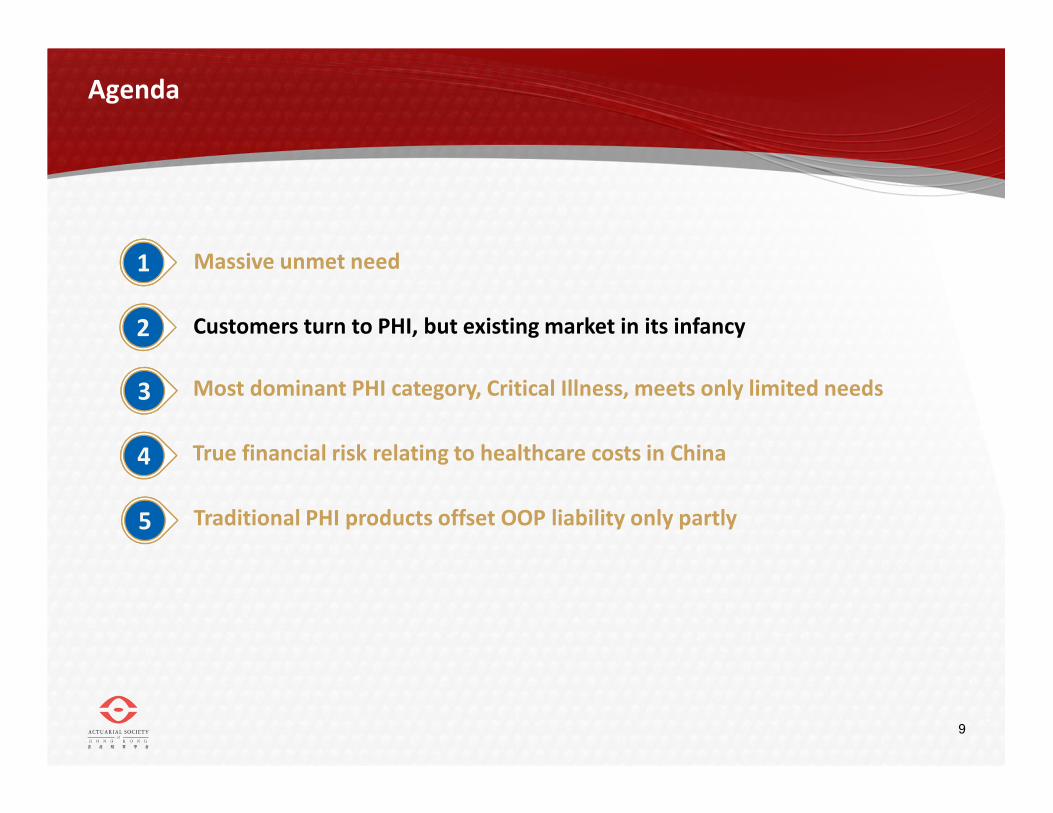
Massive unmet need
Customers turn to PHI, but existing market in its infancy
Most dominant PHI category, Critical Illness, meets only limited needs
4 True financial risk relating to healthcare costs in China
5 Traditional PHI products offset OOP liability only partly
Agenda

3
Agenda
1
2
3
Massive unmet need
Customers turn to PHI, but existing market in its infancy
Most dominant PHI category, Critical Illness, meets only limited needs
4 True financial risk relating to healthcare costs in China
5 Traditional PHI products offset OOP liability only partly

4
China is already the No. 5 healthcare market in the world
-
500
1 000
1 500
2 000
2 500
3 000
2000 2005 2010 2015 2020
Growth of Asia’s healthcare market
China share of Asia
healthcare market
India share of Asia
healthcare market2% 4% 7% 7% 11%
China contribution
to global profit pool
US$22bn
4%
US$113bn
15%
AsiaUS$1 trillion~10% of global
market
US$2.6 trillion~20% of global
market
$ billion
10% 20% 29% 35% 40%
Source: Bain (2012); McKinsey (2010, 2012)
China
India
US$1 trillion~7% of global
market
US$91bn
41%

5
... but invests far less in healthcare than many otherinternational markets
8 362
3 503
649 221
US UK SA China
Population (in million)
THE in US$ billion
THE as % of GDP
2 605 291 22 297
312 63 51 1 344
Healthcare expenditure per person (in US$)
18% 10% 9% 5%
Public Expenditure as % THE 53% 84% 44% 54%
Private Expenditure as % THE 47% 16% 56% 46%
of which is OOP 25% 62% 30% 79%
OOP as % THE 12% 10% 17% 37%
Source: World Bank (2011 data); Discovery analysis

6
Growing burden of lifestyle disease increase both mortality and morbidity risk
… and an increase in Vitality Age, indicating
higher health risk
• On average the Vitality Age (a health-risk
adjusted age) of participants was 8.2
years higher than their real age
• Most health factors measured by the
Vitality Age are modifiable
Industrialization and poor lifestyle habits
lead to rise in chronic disease
• 260 million cases of chronic disease in 2008
• Incidence of hypertension and diabetes
quadrupled and heart disease and cancer
doubled in past decade
• <20% of 7 – 17 year-olds in large cities are
overweight or obese
Top 5 chronic conditions 2003 2008
Hypertension 26.2% 54.9%
Gastroenteritis 10.3% 10.7%
Diabetes 5.6% 10.7%
Rheumatoid Arthritis 8.6% 10.2%
Cerebrovascular disease 6.6% 9.7%
Source: clearstate (2012); Ping An Health (Vitality Age survey 2012)
2.5
3.5
4.5
5.5
6.5
7.5
8.5
9.5
<20 20-2425-3435-4950-59 >60 All
All
Female
Male
Vitality Age > chronological age

7
Current health financing approach offers inadequatefinancial protection
OOP spending decreased from 60%
before reform but remains high …
Source: Economist (2012); World Bank (2011)
… with significant risk of catastrophic
spending for low-income families
• High OOP costs driven by both
uncovered OP costs (particularly for
URBMI and NCRMS members) and IP
costs exceeding the annual limit
• Coverage level depends largely on
financial means of local government
0%
10%
20%
30%
40%
50%
60%
70%
1980 1985 1990 1995 2000 2005 2010
OOP
government
social
0%
2%
4%
6%
8%
10%
12%
• Rural inhabitants particularly at risk of
catastrophic healthcare spending:
average IP admission requires OOP
spending of 50% – 70% of their annual
income (double that for urban areas)
• 12th 5-Year Plan focus on shifting such
cost for CI conditions to PHI
urban L M S rural E C W
2003
2008

8
Current health delivery approach frustrates accessto quality care
Source: World Bank (2011); KPMG (2010); WSJ (2012)
… where access is limited due to over-
subscription of available capacity
• High demand leads to severe over-
crowding in Class 3 general hospitals
• Accessing care requires excessive
queuing or cash to navigate the system:
buy registration numbers from scalpers
or to give hongbao
0%
10%
20%
30%
40%
50%
60%
70%
80%
90%
2003 2004 2005 2006 2007 2008
General
hospitals
THC
CHC
Healthcare funding strategy favors large,
urban hospitals …
• ~ 90% of healthcare funding allocated at
provincial or sub-provincial level
• Direct government subsidies to public
hospitals was US$7.4 billion in 2008:
>60% spend directed to urban hospitals;
only 10% spend on primary care
0%
5%
10%
15%
20%
25%
30%
35%
City Hospital CountyHospital
CHC THC
Government subsidy
Medical service fees
Drug revenue
Other revenue
CHC = Community Health Center; THC = Township Health Center
9
1
2
3
Massive unmet need
Customers turn to PHI, but existing market in its infancy
Most dominant PHI category, Critical Illness, meets only limited needs
4 True financial risk relating to healthcare costs in China
5 Traditional PHI products offset OOP liability only partly
Agenda

10
Small existing PHI market with lack of specialization
Market size of existing
PHI product categories
High-end coverRMB 800 million
Mid-market coverRMB 200 million
Other productsRMB 1.3 billion
*Graphic not to scale; ** Include investment componentsSource: Munich Health (2013)
Comprehensive coverRMB 30 billion
Covers SHI shortfalls for treatment
in public hospitals
Typical premium: RMB 500-2,000
In-patient only coverRMB 5 billion
Covers some additional costs for
treatment in public hospitals
Typical premium: RMB 10-200
SHI supplementary cover
Critical Illness cover**
RMB 49 billion
Commercial insurance for selected
conditions up to an agreed sum-insured
Typical premium: RMB 3-8 per RMB 1,000
of cover
RMB 86 billion* … 92% from CI and SHI supplementary cover

11
Small existing PHI market is dominated by CI andSHI supplementary cover
Market size of existing
PHI product categories
Source: Munich Health (2013); Mercer (2012)
Comprehensive SHI supplementary cover
Critical Illness cover**
RMB 86 billion*
Estimated market size: RMB 30 billion
• Cover is sold in units; Ping An Life sells cover with
each unit representing RMB 3,000 of cover
• Individual clients typically buy 2 – 3 such units
• Group-based cover has a median annual limit of
RMB 20,000 for IP and OP costs
Estimated market size: RMB 49 billion
• Typical sum insured is RMB 100,000
• Rider to life insurance (25% of the CI market) or
sold as a stand-alone product (75% of CI market)
• CI products in China cover a standard 25 conditions;
some products expand this list as product features
*Graphic not to scale; ** Include investment components
57%
35%

12
Mature high-end market continues to grow;infantile mid-market offers substantial growth opportunity
Market size of existing
PHI product categories
Source: Munich Health (2013); Mercer (2012)
High-end comprehensive cover
Mid-market comprehensive cover
RMB 86 billion*
Estimated market size: RMB 800 million
Typical premium: RMB 12,000 – RMB 30,000
• Cover is mostly sold to groups
• HR function typically acts as key decision maker
• Network and benefits selected drive pricing
Estimated market size: RMB 200 million
Typical premium: RMB 2,000 – RMB 12,000
• Cover is mostly sold to individuals, most likely middle-class
and affluent Chinese
• Some products assume partial cover for services by SHI;
other assume no SHI cover
• Few insureres have built distribution channels able to
support ‘high-advice’ products
*Graphic not to scale
~1%
<1%

13
Cash allowance products and travel health cover
Market size of existing
PHI product categories
Source: Munich Health (2013); Mercer (2012)
Hospital cash and surgical cash products
Travel health cover
RMB 86 billion*
Estimated market size: RMB 1 billion
Typical premium: RMB 100 – RMB 500
• Lump sum cash payments in case of
hospitalization or surgery
Estimated market size: RMB 300 million
Typical premium: RMB 1,500 – RMB 2,000
• Travel cover for clients that require
covcer outside of Mainland China
*Graphic not to scale
<1%
~1%

14
Need for Private Health Insurance – voice of the customer
Source: McKinsey consulting report (2009)
Market Research Insights
Core issues Details
Consumers perceive serious shortcomings in healthcare system
BMI coverage insufficient Low IP limit and low OP cover ratio
Insufficient BMI scope Some off-schedule tests, drugs, devices are not covered
Lack of access Poor access, long queuing time, hongbao
Consumers rely on commercial insurance products for additional security
Critical Illness products Perceived risk of a significant shortfall when diagnosis is a critical illness
Accidental Medical Reimbursement products
Uncertainty of expense for accident or emergency
Hospital cash products Provides cash to help cover shortfall and “navigate system”
Medical Reimbursement products
Traditionally offered as group BMI-supplementary product
Existing products address need only partially
1. Insufficient number of conditions covered for critical illness products.2. Complex and ambiguous coverage terms.3. Lack of a “suitable product for me”.
IP = in-patient; OP = out-patient; BMI = Basic Medical Insurance, the Chinese government insurance programs

15
1
2
3
Massive unmet need
Customers turn to PHI, but existing market in its infancy
Most dominant PHI category, Critical Illness, meets only limited needs
4 True financial risk relating to healthcare costs in China
5 Traditional PHI products offset OOP liability only partly
Agenda

16
Cheap product but meets only limited needs:# 1 – Sum insured does not reflect expected OOP cost
Different conditions have very
different cost profiles …
• DRG 16 – Diseases and disorders of
blood, blood forming organs,
immunological disorders
• DRG 21 – Injuries, poisoning, and toxic
effects of drugs
• DRG 22 – Burns
0%
50%
100%
150%
200%
250%
300%
350%
DRG 16
DRG 21
DRG 22
Source: Analysis of SHI hospital claims of Ping An insured clients (2010)
… and sum insured is frequently
higher than OOP costs for CI events
• Expected actual OOP costs for CI events
far less than sum insured
• Only 7 of the 20 most expensive claims
had OOP costs exceeding typical sum
insured (RMB 100,000) and not all of
these events would be CI events
0%
5%
10%
15%
20%
25%
1 2 3 4 5 6 7 8 9 10
OOP costs as % of sum insured*
distribution by decile
*for RMB 100,000 sum insured
Average IP claims
cost : RMB 9,545
17
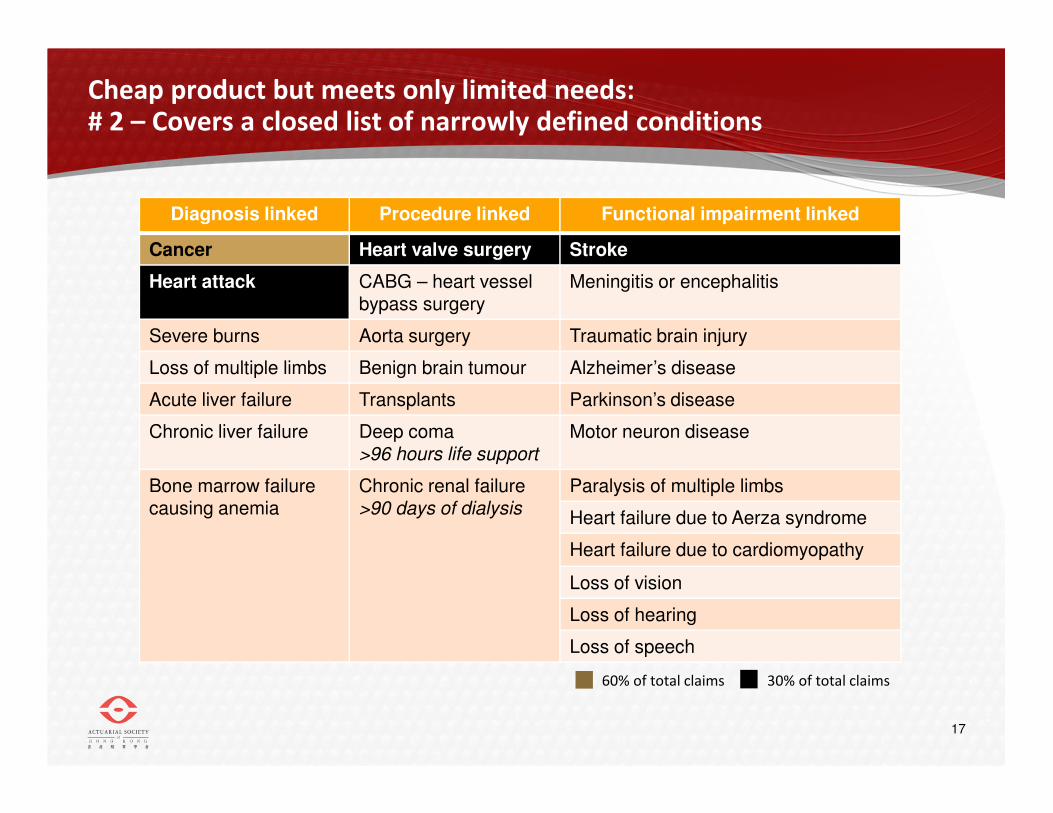
Cheap product but meets only limited needs:# 2 – Covers a closed list of narrowly defined conditions
Diagnosis linked Procedure linked Functional impairment linked
Cancer Heart valve surgery Stroke
Heart attack CABG – heart vessel bypass surgery
Meningitis or encephalitis
Severe burns Aorta surgery Traumatic brain injury
Loss of multiple limbs Benign brain tumour Alzheimer’s disease
Acute liver failure Transplants Parkinson’s disease
Chronic liver failure Deep coma >96 hours life support
Motor neuron disease
Bone marrow failure causing anemia
Chronic renal failure >90 days of dialysis
Paralysis of multiple limbs
Heart failure due to Aerza syndrome
Heart failure due to cardiomyopathy
Loss of vision
Loss of hearing
Loss of speech
60% of total claims 30% of total claims

18
Cheap product but meets only limited needs:# 3 – Low probability of meeting CI product criteria
CI insurance type: low incidence
and known sum insured
• Industry has a deep understanding of
utilization trends
• Known sum insured, so no CPE
uncertainty
Source: Munich Health; PAH analysis of high-end IP claims (2012)
Reimbursement-type: significant
utlization rate and CPE uncertainty
• Uncertain utilization rate – PAH
experience typical annual admission
rates in the 8% - 15% range
• CPE varies greatly by coverage area and
setting – surprisingly costly Public
Hospitals’ VIP setting
0.00
5.00
10.00
15.00
20.00
25.00
30.00
35.00
0-10 11-20 21-30 31-40 41-50 51-60 61-70 71-75
Typical RMB value paid out
per RMB 1,000 sum insured
distribution by age band
Males
Females
CPE = Cost per Event
0
10,000
20,000
30,000
40,000
50,000
60,000
70,000
80,000
90,000
100,000
Global HongKong
LuxuryPrivate
Private PublicVIP
Public
Mainland (excl Lux Priv)
Mainland (incl Lux Priv)
Regional and Global
CPE by setting Plan’s coverage area:

19
Cheap product but meets only limited needs:# 4 – CI products may impose a heavy cash flow burden
Actual case study:
52 year-old male insured by Ping An
Treated in a public hospital
Source: Analysis of SHI hospital claims of Ping An insured clients (2010)
Day 1 Day 122 Day 180
Stroke
Hospitalization
Discharge
Hospital claim settled
112 days hospitalization
Total cost = RMB 218,855
16% of total costs OOP
7% of costs off-schedule
1 2Evaluation of severity of
functional impairment3

20
Cheap product but meets only limited needs:# 5 – CI products does not facilitate access to care
Ou
tpa
tien
t ha
llsIn
pa
tien
t wa
rds
General consultation Special consultation

21
Cheap product but meets only limited needs:# 5 – CI products does not facilitate access to care
• Assistant chief doctors and higher level in tier-3
hospitals
• Average diagnosis time exceeds 30min
• Detailed explanation about pathology, status of
illness, treatment scheme and self health care
• Separate room, one-on-one communication
• Seniority of doctors varies greatly
• Short diagnosis time (generally within 5min)
• Lack of sufficient communication
• Surrounded by other awaiting patients, meaning
case privacy cannot be guaranteed
General consultation Special consultation

22
1
2
3
Massive unmet need
Customers turn to PHI, but existing market in its infancy
Most dominant PHI category, Critical Illness, meets only limited needs
4 True financial risk relating to healthcare costs in China
5 Traditional PHI products offset OOP liability only partly
Agenda

23
Real impact of healthcare costs in China:More than half of all SHI claims value paid OOP
0%
10%
20%
30%
40%
50%
60%
70%
80%
90%
100%
1 2 3 4 5 6 7 8 9 10
Source: Analysis of SHI hospital claims of Ping An insured clients (2010)
Ratio of costs by decile Cost type
Type A
SHI paid
Type B
SHI shortfalls
Type C
off-schedule
Ratios of which for
48%
28%
24%
overall non-CI
events
CI events
84%
88%
90%
16%
12%
10%
All costs 87% 13%

24
Real impact of healthcare costs in China:CI coverage would either under or over-insure clients
Source: Analysis of SHI hospital claims of Ping An insured clients (2010); CI events modeled
Over-insured: CI payouts typically
exceeds actual OOP costs
• For most CI events, the payout reeceived
would far exceed the event cost
0%
5%
10%
15%
20%
25%
1 2 3 4 5 6 7 8 9 10
OOP costs as % of sum insured*
distribution by decile
Under-insured: low probability of
hospitalization being a CI event
0.00
0.02
0.04
0.06
0.08
0.10
0.12
0.14
0.16
1 2 3 4 5 6 7 8 9 10
• Model classified 5.3% of admissions in
sample as potential CI events
• Higher cost events are more likely CI
events than lower cost events
Probability of hospitalization a CI event
distribution by decile
*for RMB 100,000 sum insured
Overall probability of
being a CI event

25
Real impact of healthcare costs in China:Analysis of 20 most expensive claims
Diagnosis LOS Total Cost Type A Type B Type CAcute pancreatitis 72 296 333 45 815 172 211 78 307
Chronic liver disease 95 263 354 52 290 72 858 138 207
Rectal cancer - early stage 8 228 676 93 371 31 530 103 776
Stroke 112 218 855 183 815 20 102 14 939
Carotid artery injury 10 151 006 11 412 2 445 137 149
Aorta aneurism 15 131 062 16 924 9 689 104 448
Brain tumour 52 127 570 - 125 770 1 800
Stomach cancer - early stage 41 114 197 31 231 34 078 48 887
Pneumonia 46 110 122 59 500 47 694 2 928
Stroke 22 107 958 49 314 14 527 44 117
Aorta aneurism 40 107 864 - - 107 864
Colon cancer - early stage 22 105 535 57 295 41 429 6 811
Epilepsy 50 104 352 33 534 8 697 62 121
Liver cancer 57 95 361 38 064 11 114 46 183
Stomach cancer - early stage 48 92 725 55 105 15 514 22 107
Heart valve disease 73 90 347 62 018 23 468 4 860
Breast cancer - early stage 121 87 052 57 124 26 277 3 651
Heart valve disease 29 85 920 64 193 19 813 1 914
Heart vessel disease 3 85 023 - - 85 023
Stroke 14 80 795 27 545 11 369 41 881
TOTAL COST 2 684 107 938 548 688 586 1 056 973
Category share of total cost 35% 26% 39%CI cost as ratio of total category cost 27% 27% 32% 23%
Source: Analysis of SHI hospital claims of Ping An insured clients (2010) LOS = length of stay

26
Case #1: 30 year-old maleK85.9 – Acute Pancreatitis
Source: Analysis of SHI hospital claims of Ping An insured clients (2010) LOS = length of stay
Likely conclusion:72 days hospitalization
85% of total costs OOP
26% of costs off-schedule
Pancreatitis is not a
standard CI condition and
this event would
therefore not qualify for
a CI payout
Diagnosis LOS Total Cost Type A Type B Type CAcute pancreatitis 72 296 333 45 815 172 211 78 307
Chronic liver disease 95 263 354 52 290 72 858 138 207
Rectal cancer - early stage 8 228 676 93 371 31 530 103 776
Stroke 112 218 855 183 815 20 102 14 939
Carotid artery injury 10 151 006 11 412 2 445 137 149
Aorta aneurism 15 131 062 16 924 9 689 104 448
Brain tumour 52 127 570 - 125 770 1 800
Stomach cancer - early stage 41 114 197 31 231 34 078 48 887
Pneumonia 46 110 122 59 500 47 694 2 928
Stroke 22 107 958 49 314 14 527 44 117
Aorta aneurism 40 107 864 - - 107 864
Colon cancer - early stage 22 105 535 57 295 41 429 6 811
Epilepsy 50 104 352 33 534 8 697 62 121
Liver cancer 57 95 361 38 064 11 114 46 183
Stomach cancer - early stage 48 92 725 55 105 15 514 22 107
Heart valve disease 73 90 347 62 018 23 468 4 860
Breast cancer - early stage 121 87 052 57 124 26 277 3 651
Heart valve disease 29 85 920 64 193 19 813 1 914
Heart vessel disease 3 85 023 - - 85 023
Stroke 14 80 795 27 545 11 369 41 881
TOTAL COST 2 684 107 938 548 688 586 1 056 973
Category share of total cost 35% 26% 39%CI cost as ratio of total category cost 27% 27% 32% 23%

27
Case #2: 55 year-old femaleD01.2 – Carcinoma in situ: rectum
Source: Analysis of SHI hospital claims of Ping An insured clients (2010) LOS = length of stay
Likely conclusion:8 days hospitalization
59% of total costs OOP
45% of costs off-schedule
Cancer is a standard CI
condition but carcinoma
in situ (early stage
cancer) is excluded and
this event would
therefore not qualify for
a CI payout
Diagnosis LOS Total Cost Type A Type B Type CAcute pancreatitis 72 296 333 45 815 172 211 78 307
Chronic liver disease 95 263 354 52 290 72 858 138 207
Rectal cancer - early stage 8 228 676 93 371 31 530 103 776
Stroke 112 218 855 183 815 20 102 14 939
Carotid artery injury 10 151 006 11 412 2 445 137 149
Aorta aneurism 15 131 062 16 924 9 689 104 448
Brain tumour 52 127 570 - 125 770 1 800
Stomach cancer - early stage 41 114 197 31 231 34 078 48 887
Pneumonia 46 110 122 59 500 47 694 2 928
Stroke 22 107 958 49 314 14 527 44 117
Aorta aneurism 40 107 864 - - 107 864
Colon cancer - early stage 22 105 535 57 295 41 429 6 811
Epilepsy 50 104 352 33 534 8 697 62 121
Liver cancer 57 95 361 38 064 11 114 46 183
Stomach cancer - early stage 48 92 725 55 105 15 514 22 107
Heart valve disease 73 90 347 62 018 23 468 4 860
Breast cancer - early stage 121 87 052 57 124 26 277 3 651
Heart valve disease 29 85 920 64 193 19 813 1 914
Heart vessel disease 3 85 023 - - 85 023
Stroke 14 80 795 27 545 11 369 41 881
TOTAL COST 2 684 107 938 548 688 586 1 056 973
Category share of total cost 35% 26% 39%CI cost as ratio of total category cost 27% 27% 32% 23%
28
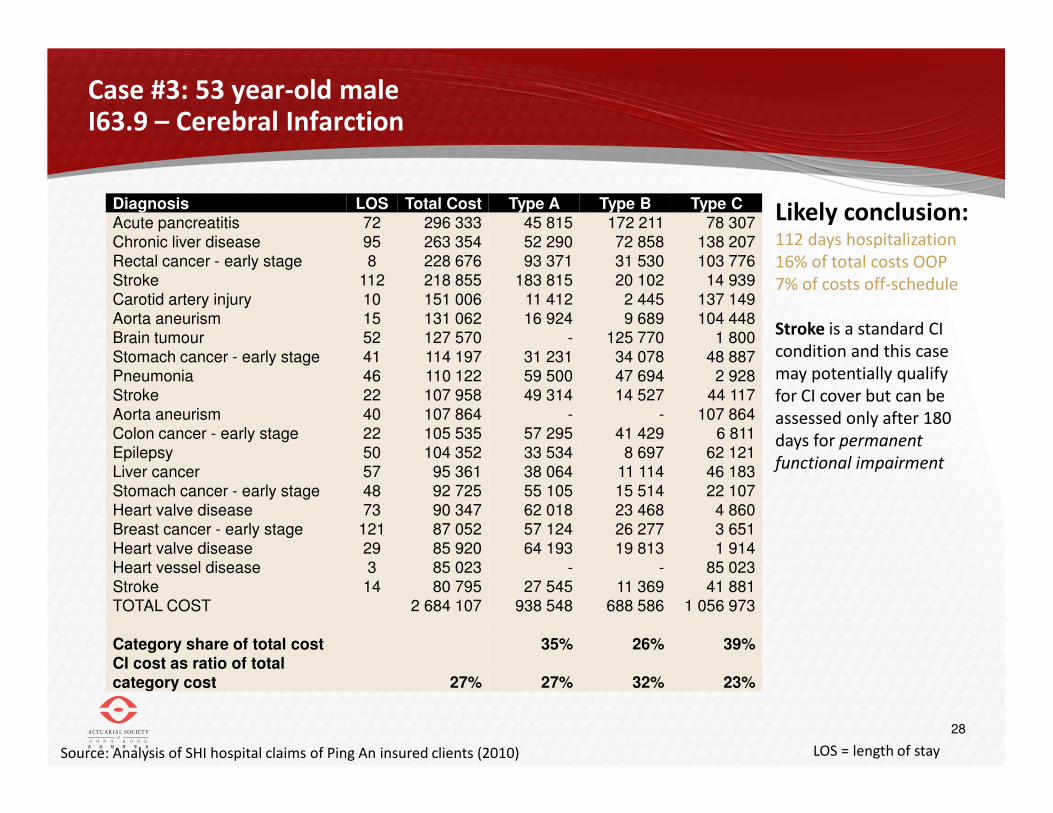
Case #3: 53 year-old maleI63.9 – Cerebral Infarction
Source: Analysis of SHI hospital claims of Ping An insured clients (2010) LOS = length of stay
Likely conclusion:112 days hospitalization
16% of total costs OOP
7% of costs off-schedule
Stroke is a standard CI
condition and this case
may potentially qualify
for CI cover but can be
assessed only after 180
days for permanent
functional impairment
Diagnosis LOS Total Cost Type A Type B Type CAcute pancreatitis 72 296 333 45 815 172 211 78 307
Chronic liver disease 95 263 354 52 290 72 858 138 207
Rectal cancer - early stage 8 228 676 93 371 31 530 103 776
Stroke 112 218 855 183 815 20 102 14 939
Carotid artery injury 10 151 006 11 412 2 445 137 149
Aorta aneurism 15 131 062 16 924 9 689 104 448
Brain tumour 52 127 570 - 125 770 1 800
Stomach cancer - early stage 41 114 197 31 231 34 078 48 887
Pneumonia 46 110 122 59 500 47 694 2 928
Stroke 22 107 958 49 314 14 527 44 117
Aorta aneurism 40 107 864 - - 107 864
Colon cancer - early stage 22 105 535 57 295 41 429 6 811
Epilepsy 50 104 352 33 534 8 697 62 121
Liver cancer 57 95 361 38 064 11 114 46 183
Stomach cancer - early stage 48 92 725 55 105 15 514 22 107
Heart valve disease 73 90 347 62 018 23 468 4 860
Breast cancer - early stage 121 87 052 57 124 26 277 3 651
Heart valve disease 29 85 920 64 193 19 813 1 914
Heart vessel disease 3 85 023 - - 85 023
Stroke 14 80 795 27 545 11 369 41 881
TOTAL COST 2 684 107 938 548 688 586 1 056 973
Category share of total cost 35% 26% 39%CI cost as ratio of total category cost 27% 27% 32% 23%

29
1
2
3
Massive unmet need
Customers turn to PHI, but existing market in its infancy
Most dominant PHI category, Critical Illness, meets only limited needs
4 True financial risk relating to healthcare costs in China
5 Traditional PHI products offset OOP liability only partly
Agenda

30
Real impact of healthcare costs in China:Very substantial OOP liability
-
5,000
10,000
15,000
20,000
25,000
1 2 3 4 5 6 7 8 9 10
Value of OOP liabilitydistribution by decile
Average OOP liability
in RMB
Type C
off-schedule costs
Type B
SHI shortfalls
Source: Analysis of SHI hospital claims of Ping An insured clients (2010)
OOP as % of
total cost78% 51%

31
Existing insurance options decrease OOP liability:SHI coverage leave clients very exposed
Source: Analysis of SHI hospital claims of Ping An insured clients (2010)
Ratio of OOP liabilitydistribution by decile
Average OOP liability
as % of total cost
0%
10%
20%
30%
40%
50%
60%
70%
80%
90%
1 2 3 4 5 6 7 8 9 10
SHI cover only

32
Existing insurance options decrease OOP liability:Adding CI coverage decrease OOP marginally
Ratio of OOP liabilitydistribution by decile
Average OOP liability
as % of total cost
Model
assumptions:
1. CI cover with RMB 100,000 sum insured
2. CI events modeled using PAH classification algoritm
0%
10%
20%
30%
40%
50%
60%
70%
80%
90%
1 2 3 4 5 6 7 8 9 10
SHI cover only
SHI + CI
Source: Analysis of SHI hospital claims of Ping An insured clients (2010); CI events modeled

33
Existing insurance options decrease OOP liability:SHI supplementary cover more effective to decrease OOP
Source: Analysis of SHI hospital claims of Ping An insured clients (2010); CI events modeled
Ratio of OOP liabilitydistribution by decile
Average OOP liability
as % of total cost
Model
assumptions:
1. SHI supplementary cover with RMB 9,000 annual limit
0%
10%
20%
30%
40%
50%
60%
70%
80%
90%
1 2 3 4 5 6 7 8 9 10
SHI cover only
SHI + SHI-
supplementary

34
Existing insurance options decrease OOP liability:Adding CI to SHI supplementary cover has marginal impact
Source: Analysis of SHI hospital claims of Ping An insured clients (2010); CI events modeled
Ratio of OOP liabilitydistribution by decile
Average OOP liability
as % of total cost
Model
assumptions:
1. SHI supplementary cover with RMB 9,000 annual limit
2. CI cover with RMB 100,000 sum insured
3. CI events modeled using PAH classification algoritm
0%
10%
20%
30%
40%
50%
60%
70%
80%
90%
1 2 3 4 5 6 7 8 9 10
SHI cover only
SHI + SHI-
supplementary + CI

35
Existing insurance options decrease OOP liability:Comprehensive reimbursement insurance close all gaps
Source: Analysis of SHI hospital claims of Ping An insured clients (2010); CI events modeled
0%
10%
20%
30%
40%
50%
60%
70%
80%
90%
1 2 3 4 5 6 7 8 9 10
Ratio of OOP liabilitydistribution by decile
Average OOP liability
as % of total cost
Model
assumptions:
1. Comprehensive reimbursement-type insurance with annual
limit of RMB 500,000
2. No SHI entitlement required
SHI cover only
Comprehensive
reimursement type
insurance product

36
Introducing Ping An Health’s latest thinking:the Comprehensive Health Protector
Helps make clients healthier by:
• Understanding their health
• Making it easier to get healthy
• Making it cheaper to get healthy
• Helping them track their progress
towards health goals
• Providing rewards to keep them
motivated
Offers comprehensive cover both on-
schedule and off-schedule costs are
covered up to high annual limits –
ensuring any gaps are covered in full
Improves access to quality care by
extending cover to treatment in VIP
wards of public hospitals and making
available expert guidance on accessing
hospitals and famous specialists
Vitality Health Investment Account offers
tangible value that helps clients build up
equity and overcome lack of familiarity
with pure protection insurance
37
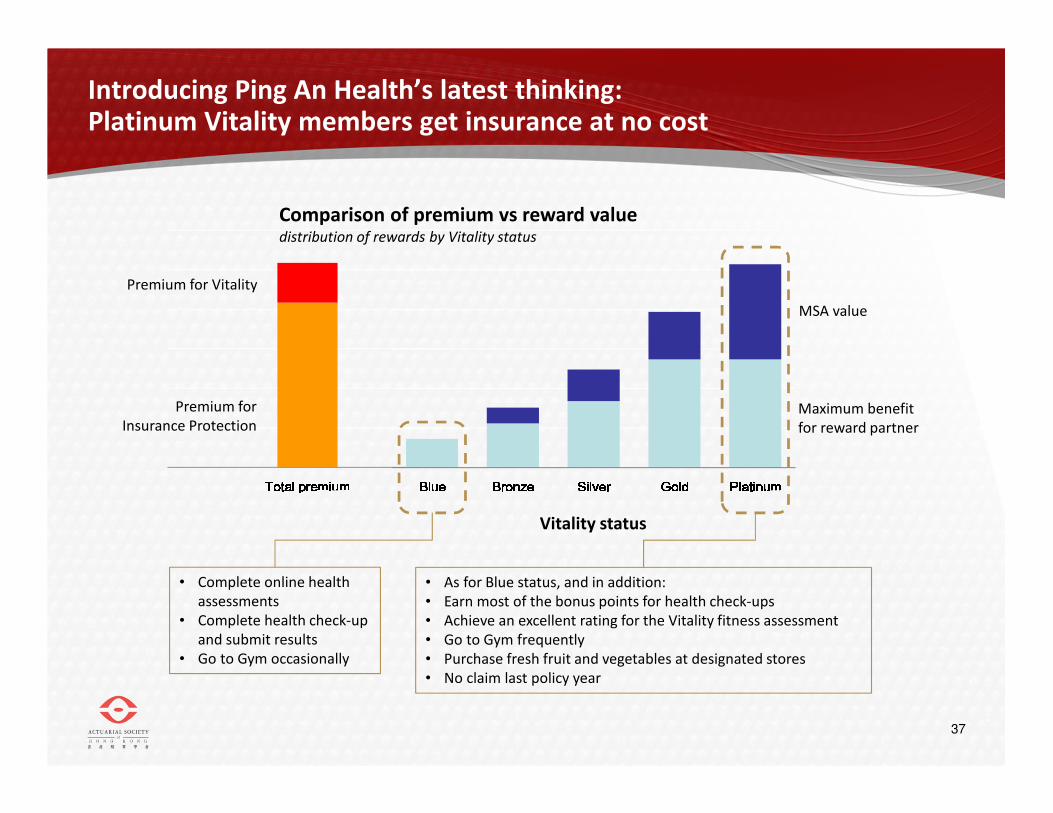
Introducing Ping An Health’s latest thinking:Platinum Vitality members get insurance at no cost
Total premiumTotal premiumTotal premiumTotal premium BlueBlueBlueBlue BronzeBronzeBronzeBronze SilverSilverSilverSilver GoldGoldGoldGold PlatinumPlatinumPlatinumPlatinumMSA value
Maximum benefit
for reward partner
Premium for Vitality
Premium for
Insurance Protection
Comparison of premium vs reward valuedistribution of rewards by Vitality status
Vitality status
• Complete online health
assessments
• Complete health check-up
and submit results
• Go to Gym occasionally
• As for Blue status, and in addition:
• Earn most of the bonus points for health check-ups
• Achieve an excellent rating for the Vitality fitness assessment
• Go to Gym frequently
• Purchase fresh fruit and vegetables at designated stores
• No claim last policy year

Towards a Comprehensive Private Health Insurance market in China
The Actuarial Society of Hong Kong
Dr. Andrew MurraySenior Vice President: Strategic Risk Management, Discovery International
7 March 2013