
Towards a Business Intelligence Framework for Unisa Presented to SPCC 7 May 2009 Towards a Business...
39
Towards a Business Intelligence Framework for Unisa Presented to SPCC 7 May 2009 C urrent B udget Prev. B udget Year+1 B udget Year+2 B udget Year+3 B udget Year+4 B udget H eadquarters British C olum bia Prairie Central Q uebec Atlantic 0.00% 10.00% 20.00% 30.00% 40.00% 50.00% 60.00% 70.00% MEASURES 0 10000 20000 30000 40000 50000 60000 70000 AB BC CO EO FO MB NB NF No. of Members Legend Recrea COMPSK EXECUT OFFICI PRECSK TESTSK Professor George Subotzky Executive Director: Information and Strategic Analysis
-
Upload
paul-watkins -
Category
Documents
-
view
216 -
download
0
Transcript of Towards a Business Intelligence Framework for Unisa Presented to SPCC 7 May 2009 Towards a Business...
Towards a Business Intelligence Framework for UnisaPresented to SPCC 7 May 2009
Current Budget
Prev. Budget
Year+1 Budget
Year+2 BudgetYear+3 Budget
Year+4 BudgetHeadquarters British Columbia
Prairie Central
Quebec
Atlantic
0.00%10.00%20.00%30.00%40.00%
50.00%60.00%
70.00%
MEASURES
0
10000
20000
30000
40000
50000
60000
70000
AB BC CO EO FO MB NB NF
No. of Members
Legend
Recreational
COMPSK
EXECUTIVE
OFFICIAL
PRECSK
TESTSK
Professor George SubotzkyExecutive Director:Information and Strategic Analysis

Overview of presentation
• Background & Context• Integrated Strategic Planning Framework
– DISA role and mandate within this
• What is BI? Key concepts:– IM MI & BI– OPM– Outputs, outcomes and performance measures/indicators– The Information Hierarchy: The BI Pyramid– Analytic Maturity Curve– Technological Maturity Curve
• Elements of the BI Framework• Special focus on External environmental scanning/ scenario building
Acknowledgements
• Suzette van Zyl– Conceptual Genesis of BI Unisa– Research/PhD– Project leader
• George Subotzky– Eager novice, quick learner
• Prof Baijnath: Convinced supportive champion
• Gartner: mixed value report• Business Intelligence 2008 Conference

OPERATIONS• Functional/Operational
UnitsInputs, Processes, Outputs, Outcomes & Performance Measures
INSTITUTIONAL PERFORMANCE &
STRATEGIC MANAGEMENT
• Monitoring and Evaluation
(BI/Institutional Research)• Quality
Assurance/Service• IPMS• Risk ManagementOngoing:• Strategic
Reflection/Review• Environmental Scanning
CHANGE MANAGEMENT
• Strategic Change Initiatives
• Continuous Improvement Initiatives
These are identified through ongoing review process, and then find expression, as the case may be, in:
• New or revised Strategy or Strategic Projects
• Objectives and Actions in the IOP
• Changes to Operations, the Business and Enterprise Architectures and Enabling Conditions
FUNCTIONAL PLANS (PROJECT-BASED)
eg Academic, Research, HR, Estates, ICT
Functional Outcomes, Objectives, Outputs & Performance Measures, Integrated Scheduling
plan
STRATEGY FORMULATION• Mission, Vision, Business Model
(ODL)• Strategic PlanStrategic Outcomes, Objectives & Performance Measures (all shaped by Social Mandate)
review
change
RESOURCE ALLOCATION (SRAM)
• Budget• ACHRAM & PADRAM
Enabling Conditions(in addition to appropriate
Business & Enterprise Architectures)
• Effective Leadership & Management
• Conducive Climate & Culture
Business & Enterprise Architectures
Shaped by strategy - the optimal configurations of:
• People/capacity• Processes/Systems•
Resources/Infrastructure
• Technology
Strategic
Projectsact
IOP & STRATEGIC PROJECTS
Strategically-aligned Outcomes, Objectives, Outputs & Performance Measures
IntegratedStrategic
Management Framework
33
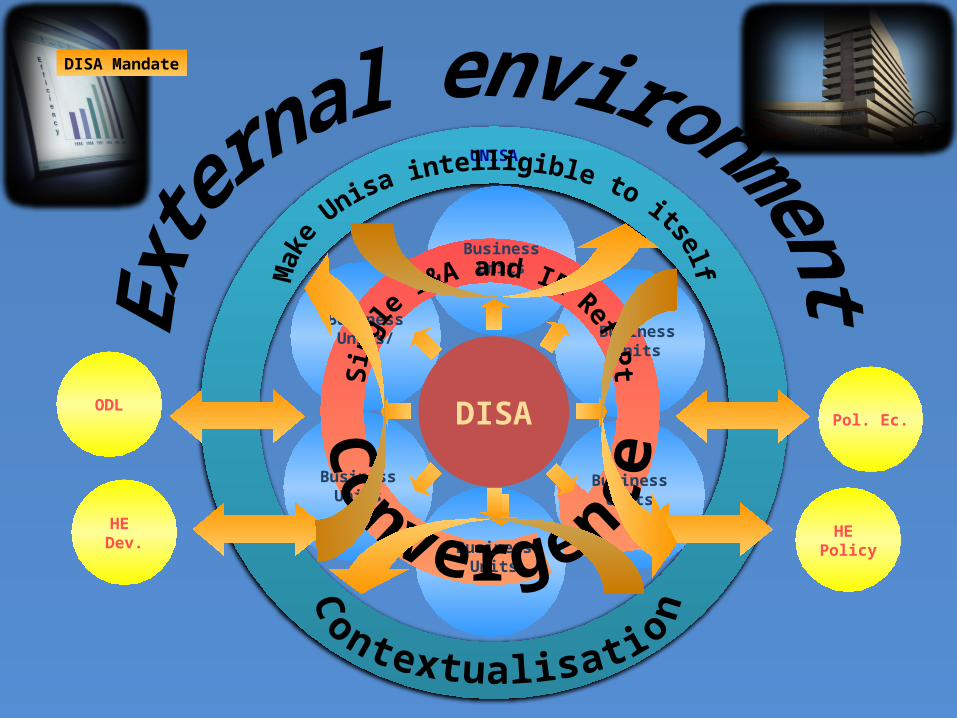
DISA
UNISA
Business Units/
Business Units
Business Units
Business Units
Business Units
Business Units
Pol. Ec.
HE Policy
ODL
HE Dev.
DISA Mandate
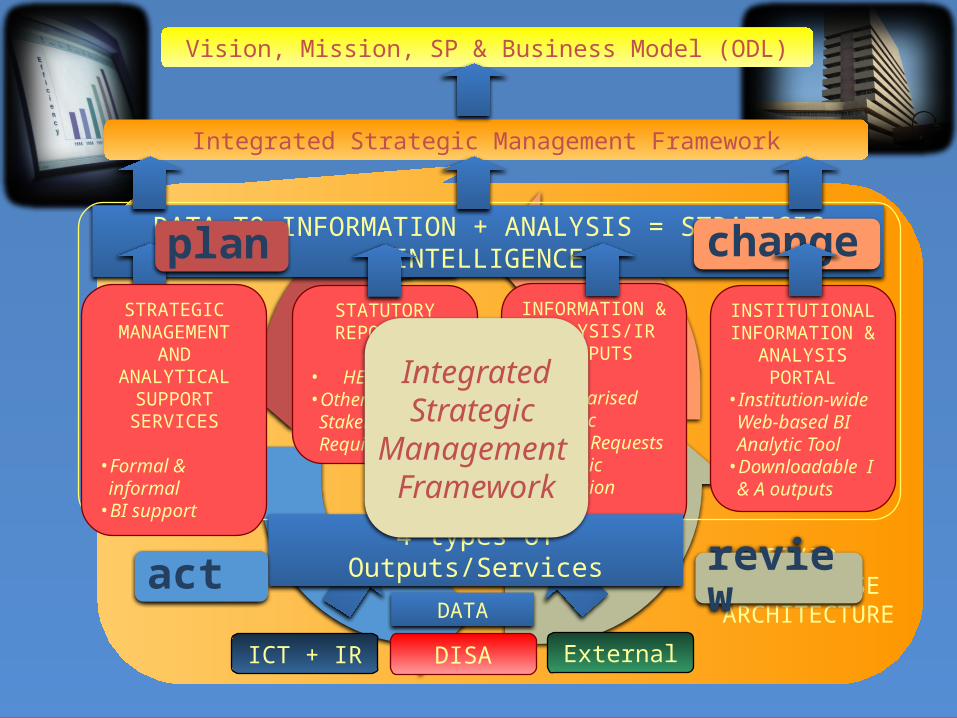
Integrated Strategic Management Framework
DATA TO INFORMATION + ANALYSIS = STRATEGIC INTELLIGENCE
DATA
Vision, Mission, SP & Business Model (ODL)
INFORMATION & ANALYSIS/IR
OUTPUTS
• Calendarised• Periodic • Ad hoc Requests
• Strategic Discussion Forum
STATUTORY REPORTING
• HEMIS• Other External Stakeholder Requirements
ICT + IR ExternalDISA
4 types of Outputs/Services
STRATEGIC MANAGEMENT
AND ANALYTICAL
SUPPORT SERVICES
• Formal & informal
• BI support
BI/IR ENTERPRISE
ARCHITECTURE
plan
review
change
act
IntegratedStrategic
Management Framework
INSTITUTIONAL INFORMATION & ANALYSIS
PORTAL• Institution-wide Web-based BI Analytic Tool
• Downloadable I & A outputs

DISA 2-fold Initiative
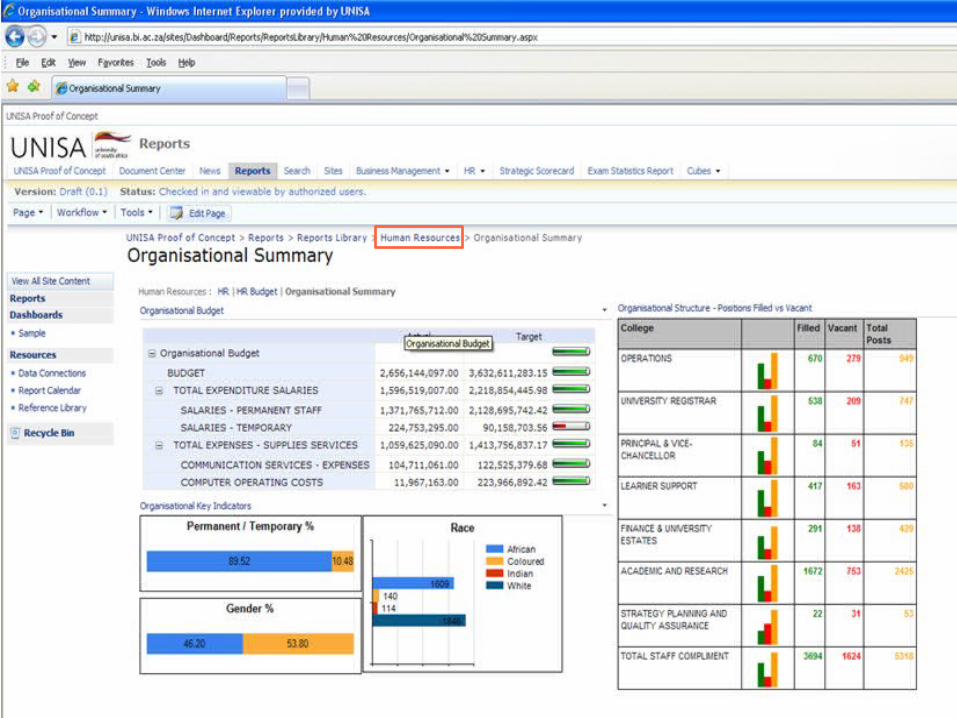
1. Institutional information and analysis portal
– Automated, web-based, easily accessible single, authoritative information source
– Vast enhancements on HEDA– Now includes pilot Student Tracking
System– First step towards BI framework– Software clunky– Remains management information

ICT Enterprise Architecture
OpsDomain
1
OpsDomain
2
OpsDomain
3
OpsDomain
4
OpsDomain
5
OpsDomain
6
Portal: Institution-wide Dissemination of
Information & Analysis (BI & IR)
BI ‘Enterprise’ Architecture
Business Architecture (Process Maps)

DISA 2-fold Initiative
2. BI framework– Cutting edge, long-term
solution to supporting organisational performance management, integrated planning
– In this way, contributes towards the achievement of strategic and operational goals

The BI Process Thus Far
• Genesis of concept• Presentation to Mancom: August 2006• Enriching our conceptual understanding of BI• Framework & Strategy document: Engagement
with consultant: Gartner• BI 2008 conference: confirmed this direction and
approach• Workshopping & finalisation of document: Working
Group & SPCC• Mancom approval: 10 March 2009• Approach from HR, CAES ED, Budget• Microsoft Performance Point proof of concept

What is BI?
BI is actionable information which has been structured analytically and contextually in order to measure and manage organisational performance against strategic and operational targets and thereby to effective support management, decision-making and planning and, in particular, the attainment of organisational goals and effectiveness
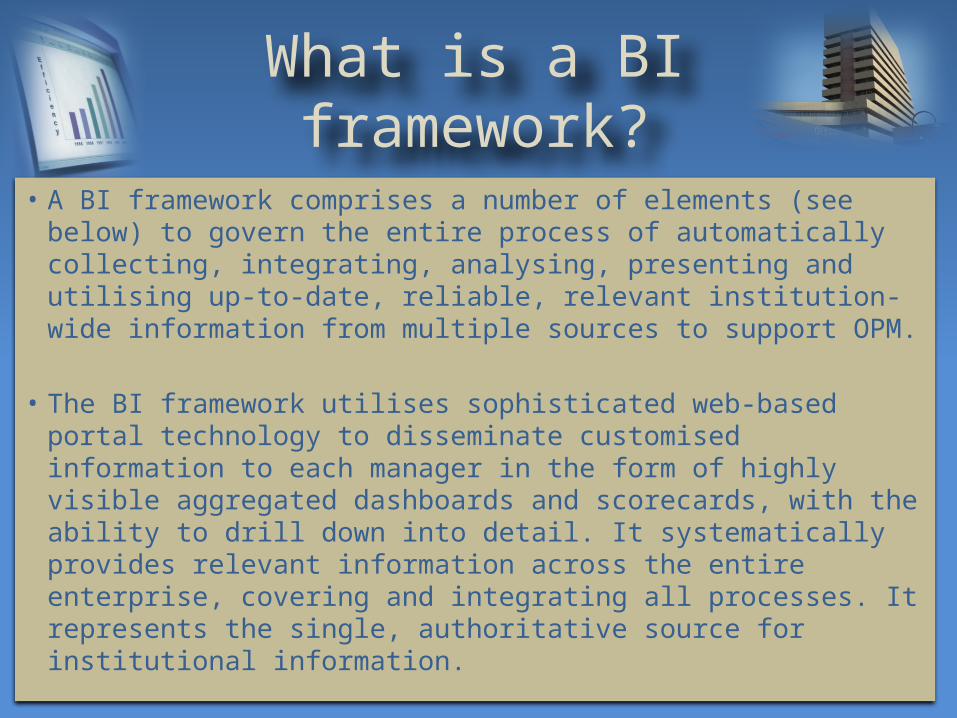
What is a BI framework?
• A BI framework comprises a number of elements (see below) to govern the entire process of automatically collecting, integrating, analysing, presenting and utilising up-to-date, reliable, relevant institution-wide information from multiple sources to support OPM.
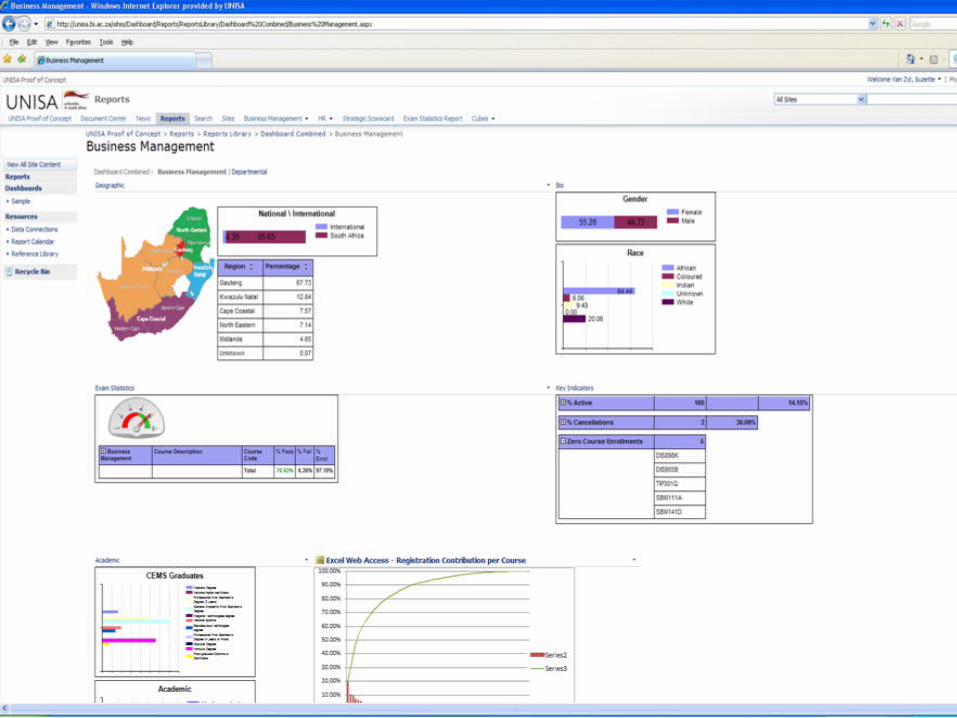
• The BI framework utilises sophisticated web-based portal
technology to disseminate customised information to each manager in the form of highly visible aggregated dashboards and scorecards, with the ability to drill down into detail. It systematically provides relevant information across the entire enterprise, covering and integrating all processes. It represents the single, authoritative source for institutional information.
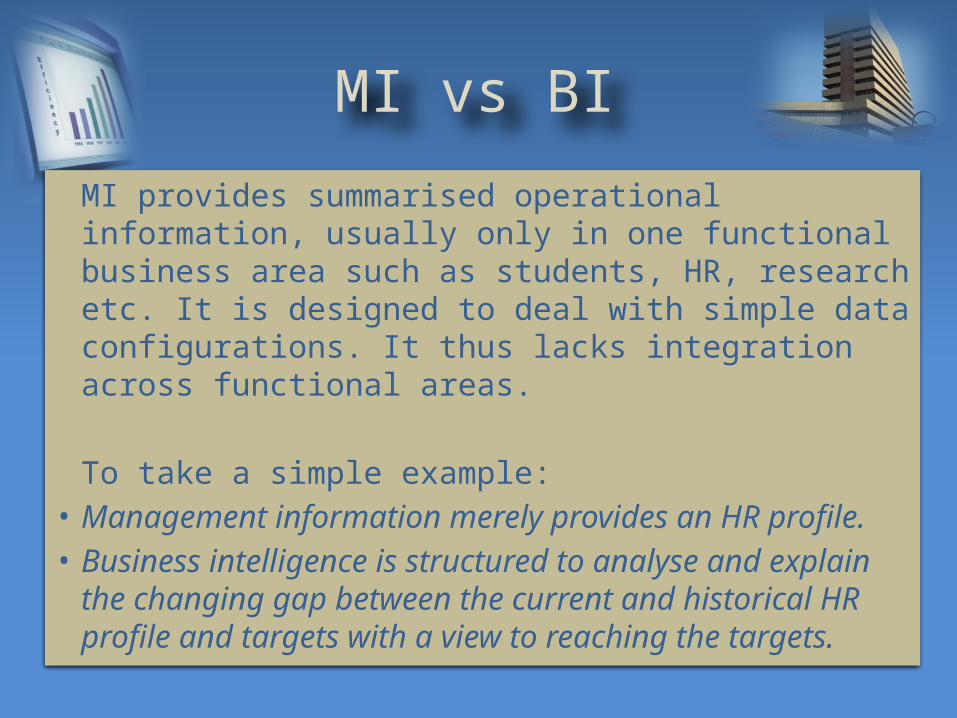
MI vs BI
MI provides summarised operational information, usually only in one functional business area such as students, HR, research etc. It is designed to deal with simple data configurations. It thus lacks integration across functional areas.
To take a simple example:
• Management information merely provides an HR profile.
• Business intelligence is structured to analyse and explain the changing gap between the current and historical HR profile and targets with a view to reaching the targets.

IM vs MI
• Information management refers to the process of organising, preserving, ensuring integrity and disseminating information
• It involves defining and applying meta-data elements, in particular business rules which are consistent with operational processes (e.g. personnel categories, definition of part-time contracts), and ensuring that systems are structured accordingly and aligned to business needs
• Responsibility for this lies with the owner – functional areas

Key Features of BI
• Uses sophisticated web-based IT to automatically collect, integrate, analyse and present up to date, reliable, relevant institution-wide information from multiple sources
• Action oriented• Cross functional, integrated strategic
perspective• Analytically and contextually structured
(according to the information hierarchy)

Oganisational Performance
Management (OPM)• Aims the narrowing gap between
strategy and execution• An integrated, evidence-based
management practice• Involves planning, forecasting, scenario-
building and budgeting• Utilises BI systematically to monitor,
analyse and measure strategic and operational activities against targets in performance indicators
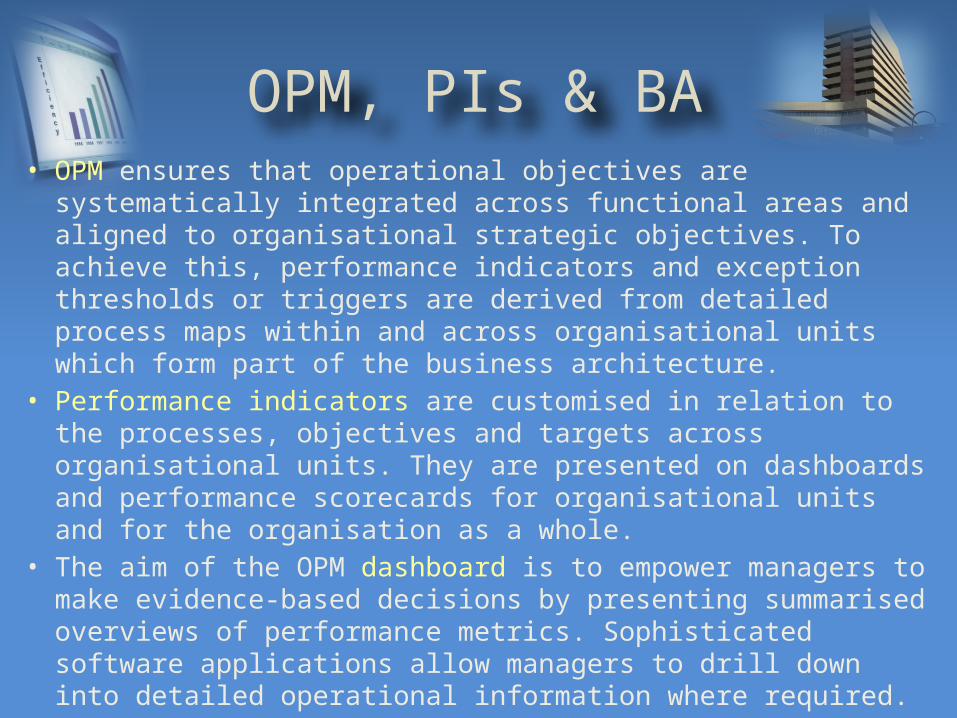
OPM, PIs & BA• OPM ensures that operational objectives are systematically
integrated across functional areas and aligned to organisational strategic objectives. To achieve this, performance indicators and exception thresholds or triggers are derived from detailed process maps within and across organisational units which form part of the business architecture.
• Performance indicators are customised in relation to the processes, objectives and targets across organisational units. They are presented on dashboards and performance scorecards for organisational units and for the organisation as a whole.
• The aim of the OPM dashboard is to empower managers to make evidence-based decisions by presenting summarised overviews of performance metrics. Sophisticated software applications allow managers to drill down into detailed operational information where required.

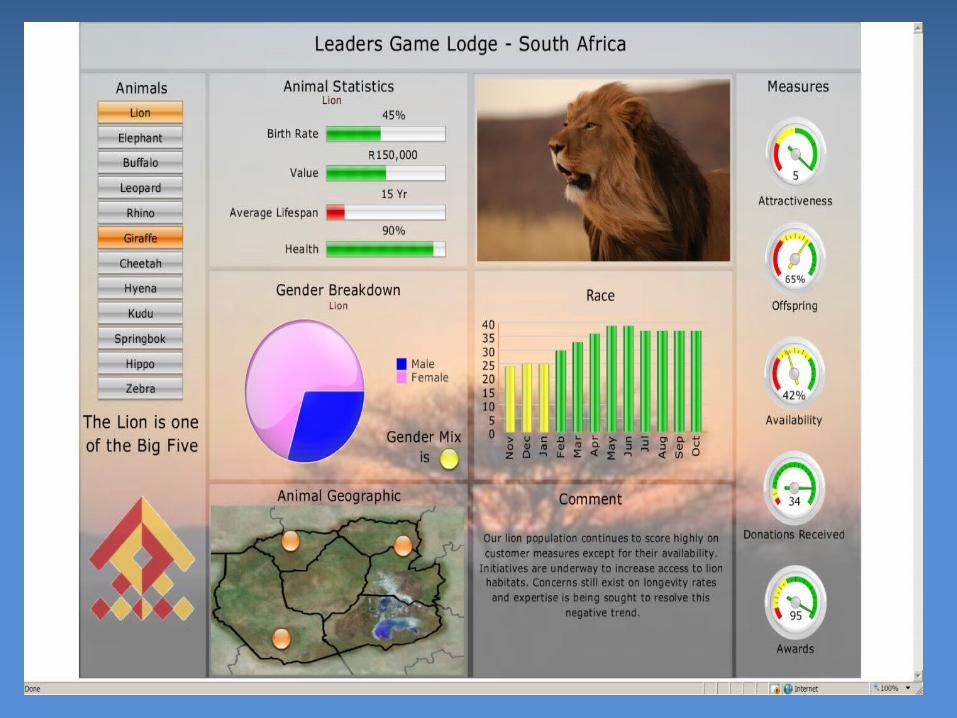
Dashboards & Scorecards
• A dashboard is a single-screen, summarised and highly graphical display that enables managers and knowledge-workers to monitor and analyse an organization’s activities and processes. It presents up-to-date actionable BI at a glance on the status of key operational activities, processes and forecasts. This is sometimes referred to as Business Activity Monitoring (BAM).
• A scorecard is a performance-oriented type of dashboard.
It presents up-to-date actionable BI at a glance on the status of organisational performance against strategic and operational objectives and targets, by means of relevant performance indicators. This is referred to as Organisational Performance Management (OPM).

Strategic Objective 6.8Manage financial, human and infrastructural resources rationally to monitor
expenditure, optimise value, manage risks and ensure financial sustainability
Target 8: Reduction in personnel expenditure to 59% of total expenditure by January 2008
Performance Indicator 11: Personnel expenditure as a proportion of total expenditure, 2004-7
Personnel expenditure as a proportion of total expenditure, 2004-7
2007 Status:2,7% below target
Between 2004 and 2007, personnel expenditure as a proportion of total expenditure was reduced from 65,7% to 61,7%.
However, this remains 2,7% below the 2008 target of 59%.
Further, a slight increase of 0,4% was evident between 2006 and 2007.
Action/Responsibility
Appropriate steps by VP: F&E, reporting to Mancom and Finance Committee of Council

Current Institutional Performance against 2015 Strategic Plan: Scorecard Performance
Trend Performance
Indicator Target
Target Date
Current Performance
Current Performance Against Target
Prognosis of Meeting Target
PI 12: Nett surplus as a proportion of annual turnover, 2004-7
5% 2008 11% Target exceeded by 6% Almost certain
PI 1: Aggregate Course Success Rate, 2004-7 56,0% 2010 54,7% 1,7% below target Probable PI 6: Research outputs/academic against 2015 and DoE targets, 2004-6
Unisa: 1,0 DoE: 1,035
2015 2015
0,44 Below target Possible
PI 8: Research outputs increased by 70 points per annum for 2006–2010
70 2006-10 65,89 4,11 below target Probable
PI 3: Unisa Student Satisfaction Index, 2005-7 90,00 2015 70,18 19,82 Below Unlikely PI 7: Position among South African universities in terms of research outputs, 2005
Among Top 5 2015 Position 6 Below target Possible
PI 11: Personnel expenditure as a proportion of total expenditure, 2004-7
59% 2008 61,7% 2,7% above target Probable
PI 4: Headcount Enrolments, 2004-7 258 023 2010 239 851 Already close to target Impossible PI 5: Student-to-Academic Staff Ratio, 2004-7 140 2015 179 Above target Unlikely
PI 2: Aggregate Throughput Rate, 2005-7 8,37% 2010 6,45% 1,92% below target Impossible PI 9: Student Support Service Satisfaction Index (SSSSI), 2005-7
90,00 2015 64,63 25,37 below target Unlikely
PI 10: Dropout rates, 1998-2003 Decrease 3% 2015 Generally low Below target Unlikely
Not yet available
PI 13: Annual Staff Satisfaction Index, 2007 Unspecified - Generally low Baseline -
PI 14: Employment Equity Profile, 2004-7 In EE Plans Severely skewed Baseline - Commentary
From this table, we can see that (apart from the two new targets for which performance trends are not yet available): 1. Only one target (PI 12) is currently being met (green robot), but the trend in this case is sidewards (horizontal orange arrow) 2. A further three (PIs 1, 6, & 8) are not being met (red robot), but the trends are in the right direction (upward green arrow) 3. Three more (PIs 3, 7 & 11) are not being met (red robot), but the trends are sidewards (horizontal orange arrow) 4. Another five (PIs 4, 5, 2, 9 & 10) are not being met but the trends are in the wrong direction (red robot and arrows – up or down as the case may be) Assessing current institutional performance against targets must be seen against the relevant target dates. That is, we need to assess where we are currently in relation to we need to be by when. On this basis, we can see that although several of the targets have not currently been met, the prognosis of eventually doing so: 5. In four cases is almost certain/probable 6. In a further two cases is possible 7. In six cases is unlikely/impossible


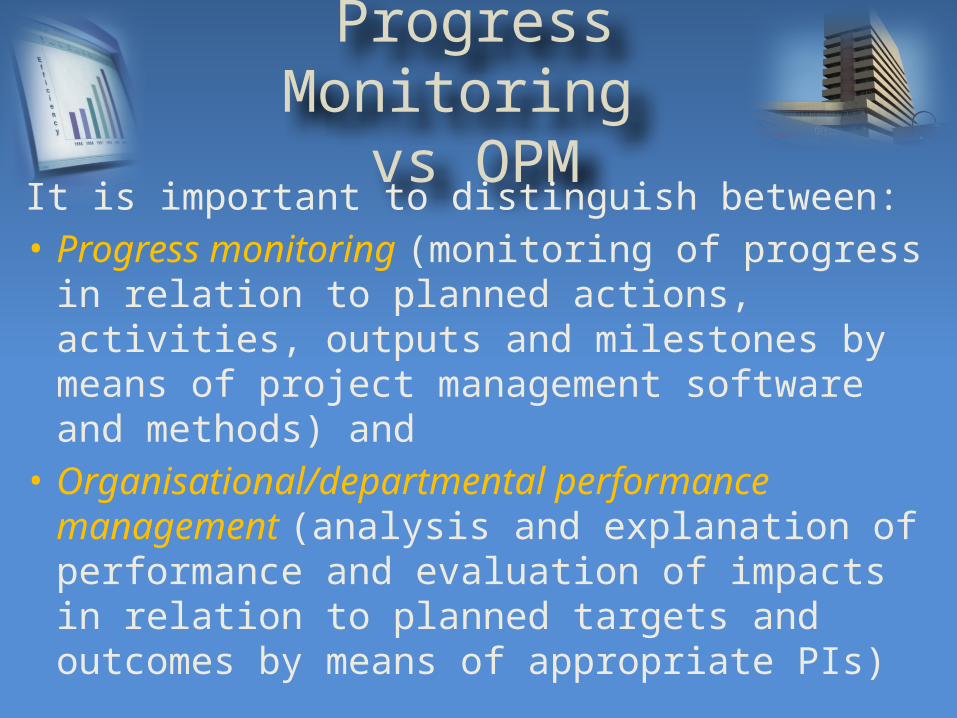
Progress Monitoring vs OPM
It is important to distinguish between: • Progress monitoring (monitoring of
progress in relation to planned actions, activities, outputs and milestones by means of project management software and methods) and
• Organisational/departmental performance management (analysis and explanation of performance and evaluation of impacts in relation to planned targets and outcomes by means of appropriate PIs)

Strategic:VC & Portfolios
Tactical: Department/Directorate
Operational: Division/Project
Volume/detail
Value/Aggregation/Integration
Analytic format
Data
Information
Intelligence Scorecards
Dashboards
Reports
Presentation format
The Information Hierarchy: The BI Pyramid

Historical reporting
Time/technology
Progress monitoring
Analysis/interpretation
Real-time reporting
Evaluation
Explanation
Prediction
Actionable intelligence
BI A
naly
tic M
atur
ityManagement information
What happened? What changed?
What is happening? What is changing?
What does the change signify? What trends are apparent?
Was the goal/target reached? Were any critical levels reached?
Why did it happen/not happen? What factors contribute to outcomes?
What was the impact of an initiative? Was the intended outcome achieved?
What will happen and why? What is the likely outcome and impact?
How can we make things happen/improve?
Business intelligence
The analytic maturity curve
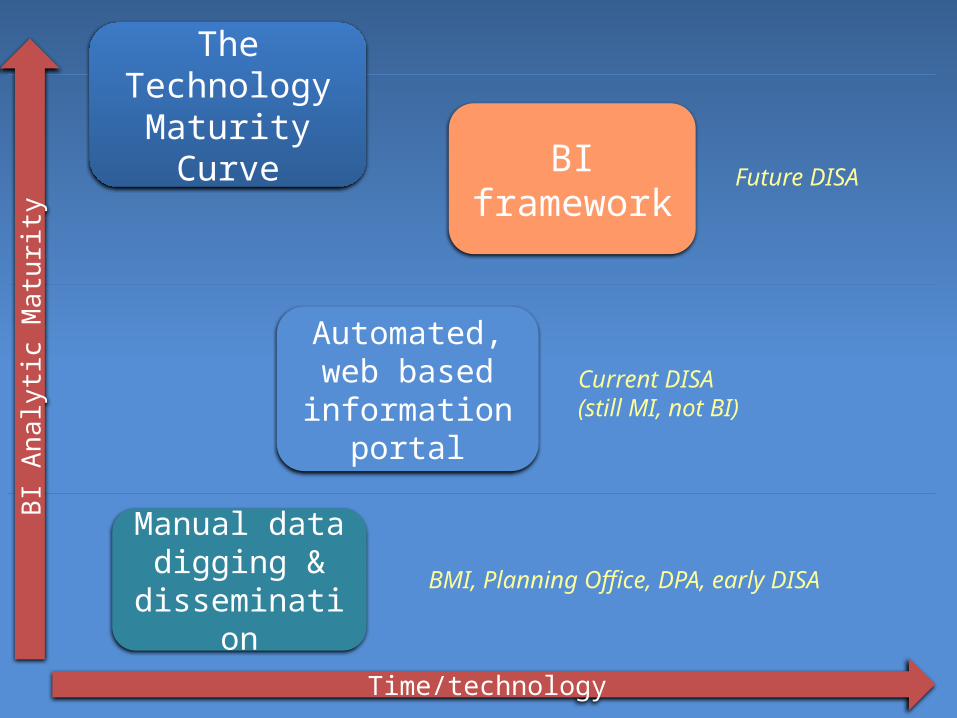
Time/technology
Manual data digging &
dissemination
BI framework
Automated, web based information
portal
BI A
naly
tic
Matu
rity
BMI, Planning Office, DPA, early DISA
Future DISA
The Technology
Maturity Curve
Current DISA (still MI, not BI)

Manual data digging …
BI framework
Automated, web based information
portal
… And dissemination

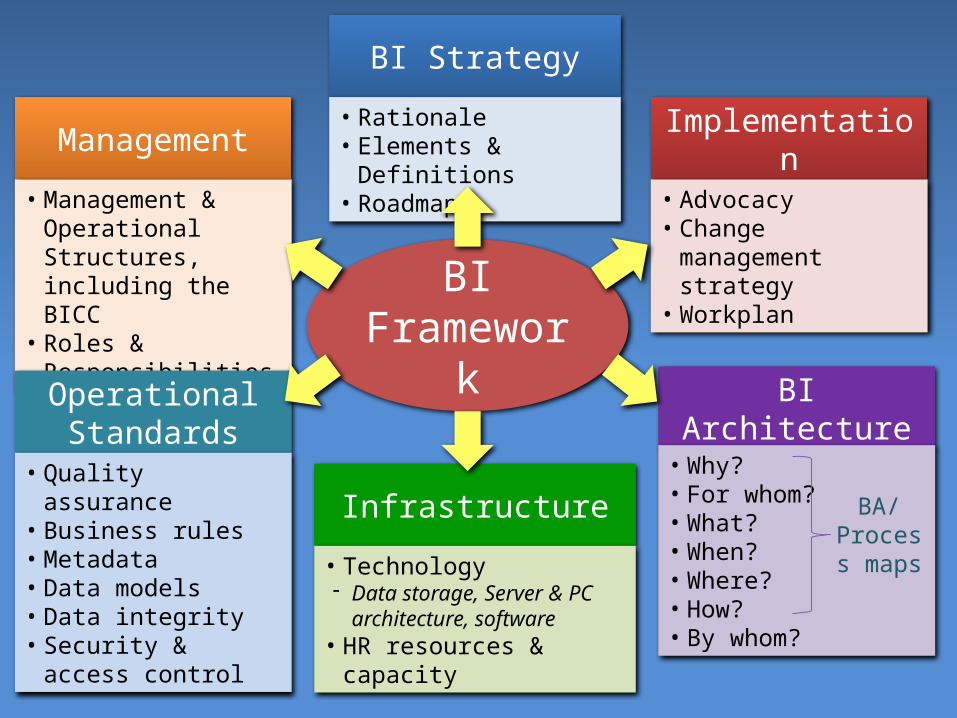
BI Framewo
rk
BI Strategy
• Rationale• Elements &
Definitions• Roadmap
Management
• Management & Operational Structures, including the BICC
• Roles & Responsibilities
Operational Standards
• Quality assurance• Business rules• Metadata• Data models• Data integrity• Security & access
control
Infrastructure
• Technology- Data storage, Server &
PC architecture, software• HR resources &
capacity
BI Architecture
• Why? • For whom?• What?• When?• Where? • How?• By whom?
Implementation
• Advocacy• Change
management strategy
• Workplan
BA/ Process
maps
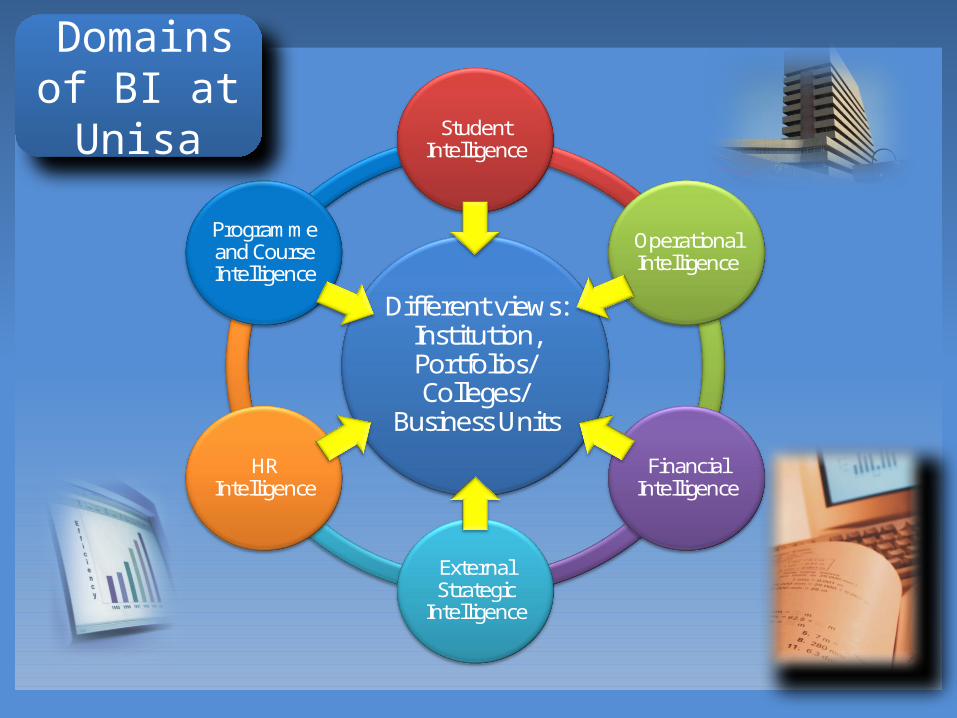
Different views: Institution, Portfolios/ Colleges/
Business Units
Student Intelligence
Operational Intelligence
Financial Intelligence
External Strategic
Intelligence
HR Intelligence
Programmeand Course Intelligence
Domains of BI at Unisa

Users
Portal
Extraction
Data-warehouse
Students
Research
Extraction
Current Budget
Prev. Budget
Year+1 Budget
Year+2 BudgetYear+3 Budget
Year+4 BudgetHeadquarters British Columbia
Prairie Central
Quebec
Atlantic
0.00%10.00%20.00%30.00%40.00%
50.00%60.00%
70.00%
MEASURES
0
10000
20000
30000
40000
50000
60000
70000
AB BC CO EO FO MB NB NF
No. of Members
Legend
Recreational
COMPSK
EXECUTIVE
OFFICIAL
PRECSK
TESTSK
Datamarts
Source databases
Data
Information
Intelligence
HR
Finance
Estates
ICT DISA/BICC
Datamarts
• Analyses/ Research Reports/ Briefings
• Statutory Reports• Ad Hoc Queries
Data warehousing Reporting & Analysis
DISA/BICC Outputs

The BI Strategy Roadmap

Main phases Action Plan / objective Time FramePHASE 1: FINALISATION OF BI STRATEGY FRAMEWORK
Finalise documentSPCC Working Group feedbackMC approval
March 2009
PHASE 2: DETAILED ROADMAP FINALISED AND IMPLEMENTED
Structures and team operationalised Consultants appointed
April 2009May 2009
Project launchInstitution-wide Advocacy Campaign conducted with feedback
May 2009 - onwards
Develop Project Charter with consultants June 2009BI product procured through tender process June 2009
Initial set of PIs, dashboards and scorecards in place; feedback on usefulness
June 2009 onwards
BI product procured through tender process July 2009
Initial group of users identified and training commenced
October 2009 onwards
PHASE 3: FURTHER ROLLOUT
Revised project deliverables 2010-2011

DISA BI Engagement Process
• Engagement with functional areas to determine optimal BI requirements (truth test: why before what)
• Scrutiny of College/departmental strategic & operational plans to determine consistency between objectives, actions, performance measures/indicators and different kind of targets (output, quantitative, outcomes, planned) – strategy map, identifying main contributing actions to desired outcomes
• Determine appropriate/measurable PIs, information sources, formats and custodians
• Arrange gathering, processing, formatting and dissemination of dashboards and scorecards (incremental approach)
• Involve appropriate strategic and operational staff members, including identified ‘Super Users’