Effective decision-making: Toward adaptive and adapted planning
Page 1
Toward the Integration of Personality Theory and Decision Theory
in the Explanation of Economic and Health Behavior
Aldo Rustichini,1,2 Colin G. DeYoung,3Jon Anderson,4and Stephen Burks,5
1 Department of Economics, University of Minnesota, and Faculty of Economics, University of Cambridge 2 Corresponding author 3 Department of Psychology, University of Minnesota 4 Division of Science and Math, University of Minnesota, Morris 5 Division of Social Science, University of Minnesota, Morris, IZA, and CeDEx Acknowledgments: The authors gratefully acknowledge generous financial support for the Truckers and Turnover Project from the John D. and Catherine T. MacArthur Foundation’s Research Network on the Nature and Origin of Preferences, the Alfred P. Sloan Foundation, the Trucking Industry Program at the Georgia Institute of Technology, and the University of Minnesota, Morris, and both financial and in-kind support from the cooperating motor carrier, its staff, and its executives. Rustichini also thanks the NSF (grant SES-0924896). The views expressed are those of the authors, and do not necessarily reflect the views of any of the supporting institutions.
Page 2
Abstract
Personality psychology and economics have taken different approaches to
understanding individual differences, with the former emphasizing variables derived
from factor analysis, and the latter emphasizing variables derived from decision theory.
In a data set of trucker trainees in a large USA company, we compare the predictive
power of measurements derived from decision theory and personality theory. We show
that personality traits have a comparable or stronger predictive power than economic
preferences for several dependent variables, in particular for credit score, job persistence
and heavy truck accidents. They also have strong predictive power for Body Mass Index
(BMI) and smoking habit. For example, cognitive ability explains a substantial part of
the attitude to time preferences, and cognitive ability and Extraversion together explain
attitude to risk.
JEL classification: D83; C72; C93.
Keywords: personality theory, decision theory, strategic behavior, job performance,
heavy truck accident, trucker.
Page 3
Toward the Integration of Personality Theory and Decision Theory
in the Explanation of Economic and Health Behavior
1. Personality Theory and Decision Theory
Two prominent approaches to understanding human behavior are decision theory,
emanating originally from Economics, and personality theory, emanating from
Psychology. The research we present here is a first step in the attempt, as initially
proposed in Rustichini(2009), to integrate the different views of human behavior
generated by these two approaches.6Both approaches were designed to provide a
comprehensive description of important influences on behavior. However, the variables
used to predict behavior in classical decision theory are derived from the a priori
analysis of rational behavior, whereas personality theory typically derives its variables
empirically, from patterns of correlation in measurements of the frequency and intensity
of a wide variety of behaviors.
Decision theory in its classical form focuses on choices individuals make among
options, which typically are payments subjects to uncertainty and at different points in
the future. For example, an individual may have to choose among an earlier and smaller
payment and a later, larger payment. Or he may have to choose between a sure amount
(say the payment of 45 dollars for sure) or a random payment, called lottery, (say the
payment of 100 dollars with 50 per cent probability, and zero with the complementary
probability). Combinations of these two basic components are possible: an individual
6 Borghans et al. (2008) similarly called for research attempting to integrate personality and decision theory. Our approach is distinguished from theirs in part by the theoretical position that cognitive skills
Page 4
may have to choose between two lotteries at two different points in time. The
preferences of an individual over options like the ones we described are summarized by
a utility function, which assigns a single number to each option; the individual chooses
the option with the largest number. Decision Theory identifies the essential elements
determining behavior as two attitudes, one towards decision making under uncertainty
and the other towards the allocation over time of rewards and penalties. When very
specific functional forms are assumed for an individual's utility, that individual is
completely described by a risk aversion level and a discount factor. Extensions of the
simple theory, like Prospect Theory (Kahneman and Tversky (1979)) or the theory of
ambiguity aversion (Ellsberg (1961), Schmeidler (1989)), increase the number of
parameters and the complexity of the representation of preferences, but the basic
structure is unchanged.
In personality psychology there is a reasonably widespread consensus that only
five or six dimensions underlie the major patterns of covariation in human behavior. The
Five Factor Model is the most widely used and well-validated taxonomy of personality
traits, using five dimensions (the “Big Five”) to describe personality: Extraversion,
Neuroticism, Agreeableness, Conscientiousness, and Openness/Intellect (John,
Naumann, & Soto, 2008). Scores of an individual on the Big Five characterize his or her
stable pattern of actions, thoughts, and feelings, and can be used to predict the
individual's behavior. However, personality theory also specifies that personality traits
are organized hierarchically, such that each of the Big Five traits subsumes multiple
lower level traits (typically called facets), with unique variance not entirely explained by
should be considered as an integrated component of an individual's personality, rather than as categorically distinct from personality (DeYoung, 2011).
Page 5
the Big Five. Thus, although five dimensions are thought to provide a reasonably
comprehensive description of an individual’s characteristics, they are not intended to be
exhaustive.
Because personality and decision theory appear to identify distinct sets of enduring
human characteristics, one approach to integrating them is simply to take their union.
This provides an ad hoc model of human nature, in which seven parameters describe an
individual and predict his or her behavior. If we want to distinguish, within the decision-
theoretic traits, between the attitudes toward risk in gains versus in losses (as we will
here) we have eight parameters; if we add facets, more narrow traits within the broad
domains from personality theory, the number is even larger. We apply this ad hoc model
to an extensive set of data from a large-scale behavioral economic field study with 1,065
trainee truck drivers, combined with information about the behavior of subjects on the
job for up to two years (Burks et al., 2008; Burks et al., 2009). Our strategy for
integrating personality and decision theory is to begin by relating the components of
each theory to each other and comparing their predictive power. This information then
guides the beginnings of a synthesis.
The advantage of the data used here is that they contain measures of all the
characteristics in the ad hoc model, so we can examine how these traits relate to each
other, while controlling for the sorts of demographic characteristics economists normally
use in human capital models. In addition, we have data on three contemporaneously
measured life outcomes, smoking status, body mass index, and credit score, as well as
data on two key longitudinal outcomes: (1) the length of job attachment and reason for
departure, in a high-turnover setting with a financial penalty for early exit, and (2) the
Page 6
number of truck accidents, controlling for week-by-week variations in the exposure to
accident risk. These dataallow examination of how the different traits in the ad hoc
model predict, or fail to predict, different outcomes.
1.1. The Big Five in a Theoretical Context
The Big Five model itself is not typically considered a theory,as it was created to
provideonly a description of personalityrather than an explanation of the sources of its
dimensions. In order to develop a theory of the Big Five, what is needed is to identify the
psychological mechanisms that generate the regularities in behavior described by each
dimension (DeYoung, 2010a, 2010b). A number of researchers have proposed
mechanisms associated with the Big Five, with a reasonable degree of agreement
(Denissen&Penke, 2008; DeYoung, 2010a; DeYoung et al., 2010; Nettle, 2006; Van
Egeren, 2009). In this theoretical scheme, Extraversion reflects sensitivity to reward,
both incentive (i.e., cues that indicate the possibility of reward) and consummatory (i.e.,
reaction to receiving reward). Extraversion is often expressed in a social context because
many of the most important human rewards are social (e.g., social status or social
affiliation), but Extraversion also encompasses the general tendency toward positive
affect. Neuroticism reflects reactivity to threat and punishment and manifests in the
experience of negative affect and associated cognition such as self-consciousness and
rumination. Agreeableness reflects the tendency toward altruism and cooperation, as
opposed to exploitation and disregard of others. Conscientiousness reflects the ability
and tendency to exert control over behavior and impulses in order to follow rules and
pursue nonimmediate goals. Openness/Intellect reflects the ability and tendency to seek,
detect, comprehend, and utilize patterns of information, both sensory and abstract.
Page 7
Because the Big Five are designed to be reasonably comprehensive, this theoretical
approach may offer an adequate list of major types of psychological function in which
there is substantial variation between individuals. Further, the mechanisms that are
hypothesized to generate behaviors for each of the Big Five must be specifiable as
components of a single mind and brain, which means that they must interact within the
individual to produce behavior (Block, 2002; DeYoung, 2010b; Van Egeren, 2009).
These premises provide an important motivation for integrating decision theory and
personality theory. The variables described by decision theory should be explicable in
terms of and in relation to theset of mechanisms associated with the Big Five. If they
cannot be, this poses a problem for personality theory.
1.2. The Big Five Hierarchy
Before proceeding to our hypotheses, we further explicate the hierarchical
structure of personality associated with the Big Five, which guided our selection of
personality measures from those available within our sample. The sample completed the
Multidimensional Personality Questionnaire (MPQ; Tellegen & Waller, 2008) rather
than an instrument designed to measure the Big Five. However, the 11 subscales of the
MPQ can be mapped onto the Big Five (Markon, Krueger, & Watson, 2005). The
personality hierarchy organizes a large number of facet-level traits within the Big Five.
There is no consensus as to the number and identity of facets in each domain. However,
a level of personality structure has been empirically identified between the Big Five and
their facets, which indicates that each of the Big Five can be divided into two separate
but correlated aspects (DeYoung, Quilty, & Peterson, 2007; Jang et al., 2002). These
aspect-level traits provide basic, important distinctions between different lower-level
Page 8
traits in the Big Five, and can predict outcomes divergently. For example, the two
aspects of Agreeableness, Compassion and Politeness, predict political attitudes in
opposite directions (Hirsh, DeYoung, Xu, & Peterson, 2010).Extraversion is divided into
an Assertiveness aspect, reflecting drive, leadership, and dominance, and an Enthusiasm
aspect reflecting sociability and positive emotions. The MPQ scales Social Potency and
Social Closeness correspond to the two aspects of Extraversion and have opposite effects
on self-confidence and over-confidence (Burks et al., 2010b). For our study, the two
aspects of Conscientiousness are particularly important. Conscientiousness has long been
conceptualized as having an inhibitive side and a proactive side (Costa, McCrae, & Dye,
1991), and these correspond to the aspects Orderliness and Industriousness identified by
DeYoung et al. (2007).
Also important for our study is the division of Openness/Intellect into distinct
aspects of Intellect and Openness. This division allows for a more thorough integration
of the concept of intelligence within standard personality models than has previously
been available (DeYoung, 2011; DeYoung, Grazioplene, & Peterson, in press).
Descriptors of intelligence fall within Openness/Intellect in factor analyses that reveal
the Big Five (Goldberg, 1990; Saucier, 1992). Additionally, of the Big Five, only
Openness/Intellect is positively associated with ability tests of intelligence (Ackerman &
Heggestad, 1997; DeYoung, 2011), and intelligence test scores sometimes fall within
Openness/Intellect in factor analysis (DeYoung et al., in press). However, when the Big
Five dimension was construed simply as Openness to Experience, intelligence did not
appear to have much conceptual overlap (McCrae & Costa, 1997). Recognizing Intellect
as a distinct aspect of the domain makes the overlap more apparent. Items from the
Page 9
Intellect factor describe both intellectual engagement (e.g., “Avoid philosophical
discussions”–reversed) and perceived intelligence (e.g., “Am quick to understand
things”).When both Intellect and Openness are used as simultaneous predictors, only
Intellect is associated with intelligence tests, and when Openness and Intellect are
separated in factor analysis, intelligence loads only on Intellect (DeYoung et al., in press;
DeYoung, Quilty, Peterson, & Gray, in press; DeYoung et al., 2009). Because of the
established importance of intelligence for predicting economic outcomes and variables,
and because the MPQ does not contain a scale corresponding to Intellect, we utilized
cognitive ability tests to assess this class of personality traits. Some have argued that
personality encompasses only typical behavior, not ability, but this has never been an
assumption of the Big Five model. Abilities influence typical behavior, and traits
involving abilities can also be found in Big Five domains other than Openness/Intellect
(e.g., ability to resist distraction in Conscientiousness, or ability to empathize in
Agreeableness).
1.3. Hypotheses: personality traits and economic preferences
The link between personality characteristics and economic preferences has been
analyzed in recent literature in psychology and economics, and some preliminary
conjectures can be proposed. Time preferences are reliablyrelated to intelligence.Higher
intelligence is associated, everything else being equal, with a higher willingness to
postpone the acquisition of a reward. Meta-analysis of 26 effect sizes found a negative
correlation of r = -.23 between intelligence and patience in delay discounting tasks
(Shamosh & Gray, 2008). The same negative correlation has been found by Burks et
al.(2009), using the data we consider here, in choices of subjects who had to choose
Page 10
between an earlier (not necessarily immediate) payment and a later and larger one. The
effect of intelligence was similar on both choices in which the earlier payment was
immediate and those in which it was not. Looking for the mechanisms supporting this
association, Shamosh et al. (2008) assessed intelligence, performance in a working
memory (WM) task, and hypothetical choices in a delay discounting (DD) task in a large
sample of healthy adults (N = 103). Subjects chose between immediate and delayed
payments in all choices. The behavioral findings confirmed the negative association
between patience (choice of the later payment) in the DD task and both intelligence and
WM performance. Additionally, subjects’ brains were scanned with fMRI as they were
performing the WM task, and task-related neural activity in the left anterior prefrontal
cortex was associated positively with intelligence (r = .26) and negatively with delay
discounting (r = -.40). These and other results suggest that preferences over time delays
in monetary payments are correlated with intelligence because of the recruitment of
brain regions that perform abstract information processing and integration.
One might hypothesize that both Conscientiousness and Extraversion should also be
associated with DD. Conscientiousnessdescribes behaviors related to self-control and
avoidance of distraction in favor of longer term goals. However, at least one study
reports no association of Conscientiousness with DD (Hirsh, Morisano, & Peterson,
2008). In contrast, several studies find positive correlations between DD and
questionnaire measures of impulsivity, which is often considered to mark the low pole of
Conscientiousness (Hinson, Jameson, & Whitney, 2003; Ostaszewski, 1996; Richards,
Zhang, Mitchell, & de Wit, 1999; Swann, Bjork, Moeller, & Dougherty, 2002).To the
extent that Extraversion reflects sensitivity to rewards, higher Extraversion might
Page 11
increase the tendency to pursue immediate rewards when available, and at least two
studies report correlations between Extraversion and DD (Hirsh et al., 2008;
Ostaszewski, 1996).
Attitudes to risk appear to be primarily affected by Neuroticism: a higher
Neuroticism score is associated with a higher aversion to risk and uncertain outcomes.
Some evidence supporting this link is provided by studies linking Neuroticism to the
response to experienced uncertainty. For example, Hirsch and Izlicht (2008) study the
feedback-related negativity (FRN), an evoked potential peaking 250 ms after the receipt
of feedback information for positive, negative and uncertain feedback (in the latter case,
the subject was not told whether he had succeeded in the assigned task or not). A larger
FRN is found to be associated with the receipt of negative than positive feedback, but
more important for our present purposes, the uncertain feedback produced an even larger
response than a negative one in individuals with a larger Neuroticism score.
This channel might not be exclusive. First, other personality traits may affect the
aversion to risk; higher cognitive skills are associated with higher willingness to take
calculated risks (i.e. those that represent fair or better-than-fair gambles for small
stakes): evidence in this direction is in Burks et al.(2009).7 Second, aversion to risk is a
complex trait, and individuals may differ along more than one dimension; for instance,
the degree of risk aversion may vary with the stakes (that is, choices may not be
invariant under scaling of the outcomes), and personality traits may affect this response.
7 We use the term "fair gamble" in the standard way: when one chooses between a lottery and a fixed payment, a fair gamble is a lottery with an expected value equal to the fixed payment; in a better-than-fair gamble the expected value is greater than the fixed payment.
Page 12
Also the degree of risk aversion may vary depending on reference points. When this
point is the zero outcome risk aversion may be smaller in the loss domain (as
systematized in Prospect Theory (Kahneman and Tversky, (1979)). Intelligence may
modulate in part the difference in behavior in the two domains. For example, Rabin and
Georg Weizsacker (2009) show theoretically and experimentally that an individual who
treats decisions separately (for example in gain and loss domain) will make sub-optimal
(dominated) choices. Finally the degree of aversion to risk may be modulated by the
difference in the perceived precision of the probability assigned to outcomes, or by the
degree of familiarity of the individual with the events describing outcomes. This latter
set of factors has been modeled in economic theory under the concept of ambiguity
aversion (Ellsberg (1961), a feature of individual preferences that might also be affected
in different ways by several distinct personality traits.
1.4. Hypotheses: personality traits and economic behavior
There is growing evidence available of the link between personality traits and economic
performances. The reviews of Ozer and Benet-Martinez, (2006), and Roberts et al.(2007)
have recently added to our understanding of the predictive power for important life
outcomes provided by personality measures; Onesand and Viswesvaran (1998) focus on
the link with performance. Roberts et al. review the predictions of three critical
outcomes: mortality, divorce, and occupational attainment, on the basis of information
about individual personality traits and conclude that the predictive power is comparable
to that of cognitive skills and socio-economic status. For example, Conscientiousness,
Extraversion and Neuroticism have weak but significant correlation with mortality. With
respect to divorce, Agreeableness, Conscientiousness and Neuroticism have a correlation
Page 13
of between 10 and 20 per cent. With regard to occupational outcomes, the standardized
beta weights of personality traits were on average more than 20 per cent; for comparison,
the weight for IQ was slightly higher than 25 per cent.
2. Experimental Design
In this study we examine the statistical relationship between personality traits and
economic preferences, and compare the effects of personality traits and economic
outcomes on three contemporaneously-measured life outcomes (smoking status, body
mass index, and credit score), as well as on two important longitudinally-measured
outcomes: the length of job tenure and reason for departure in a high-turnover setting
with a financial penalty for early exit, and the number of truck accidents, controlling for
week-by-week variations in the exposure to accident risk. Our data set also contains
socio-economic and demographic variables that allow us to control for the effects of the
factors economists use when constructing human capital models.
2.1. Method
Initial data (all the contemporaneous measures) were gathered upon intake into the
study between December 2005 and August 2006 from 1,065 truck driver trainees at a
Midwestern training facility of a large motor carrier. Longitudinal measures (data on
accidents and the operational factors affecting the exposure to the risk of accident, and
on separations from employment) were collected from the firm for each subject for the
following two years, or until first exit, whichever came first. Ninety-one percent of the
firm's trainees offered the chance to participate in the study did so. During the initial data
collection there were between 18 and 30 participants in each participant group. The data
collection was in the form of two sessions of two-hours each, with a short break in

Page 14
between. The first session involved five distinct activities, and the second six; eight were
economic experiments, and three were questionnaires. In addition to a show-up fee of
$10 at the beginning of each of the two sessions, in all of the experimental components
participants had appropriate monetary incentives. Subjects earned between $21 and $168
in total over the two sessions, with an average of $53. Some details of the design and the
context can be found in Section 10, an Appendix on this topic, and full account of the
entire project is available in Burks et al. (2008).
2.2. Socio-economic characteristics
The socio-economic characteristics on which we have information are gender, age,
ethnicity and education. The gender of the subject is described by the variable Female.
The second is ethnic background, described by the dummy variables African-American,
Native American, Asian, Latino, and by Multi-Ethnic (which includes any other group).
The omitted category is White. Marital Status is described by four categories: Separated,
Divorced, and Single and Never Married; the omitted category is Married. The variable
Age is in years, Age2 is its square. Information on education is represented by the
following dummy variables: Less than high school, Some college, and BA or more, the
omitted category is High School.
2.3. Economic Preferences
The measures of the attitude towards risk are derived from choices made by subjects in a
laboratory experiment. They were asked to choose between a lottery and a certain
amount, six times. In each choice the lottery was the same, and the certain amount was
varied. This task was repeated four times; in two of these times the outcomes of the
lotteries were all positive, and we refer to these as Gain lotteries and choices. The other
Page 15
two times the task was repeated, one of the outcomes of the lottery was negative (so
subject could incur a small loss, of $1 or $5, respectively); these are the Loss lotteries. In
the Gain lotteries and the Loss lottery with one outcome of -$1, out of the six choices a
risk neutral individual would choose the mixture {lottery, fixed payment} either of {4,2}
or of {5,1}. In the Loss lottery with one outcome of -$5, a risk neutral individual would
choose the mixture {lottery, fixed payment} either of {2,4} or of {1,5}. The attitude to
ambiguity was measured with the same set of lotteries, but with the probabilities of the
lottery outcomes not fully specified. All subjects were paid for one of their randomly
selected choices in this activity.
The measure on acceptance of delay in payments is also derived from choices.
Subjects were asked to choose seven times between an earlier smaller payment and a
later larger payment. The times in the tasks were today vs. tomorrow, today vs. six days
from today, two days from today vs. 6 days from today, and two days from today vs.
four weeks and two days from today. These times of payment were chosen because
subjects would still be at the training school for all but the longest-delayed payment
(four weeks plus two days, which the University promised to pay by mailing a certified
check to an address collected on the spot from winners). Two subjects in each group
were selected at random and paid for one of their randomly selected choices on this
activity.
The Risk Acceptance in Gains is the number of times the subject chose the lottery
over the certain amount in the gain choices; the Acceptance in Losses is the
corresponding value in the Loss choices. We consider the attitude to risk in the two
separate cases because such attitude is significantly different. The Delay Acceptance is
Page 16
the number of times the subject chooses a delayed payment over an immediate payment
in the time payment task.
2.4. Personality Traits
The sample did not complete a standard Big Five measure, instead completing a short
form of the Multidimensional Personality Inventory (MPQ), which consists of 11 trait
scales (Tellegen & Waller, 2008). However, the MPQ scales can be mapped onto the Big
Five; indeed, a factor analysis of the MPQ along with four other personality inventories
(only one being a purpose-built Big Five instrument) revealed that the Big Five structure
underlies all of these inventories (Markon, Krueger, & Watson, 2005). Cognitive skills
(CS) were measured in three different tasks. The first was a subset of Raven’s Standard
Progressive Matrices (SPM), a measure of non-verbal IQ (Raven et al., 2000). Subjects
have to choose, out of a set of small patterned shapes, the one that matches a gap in a
larger patterned shape. The second task was part of a standard test for adults of
quantitative literacy, or ”numeracy,” from the Educational Testing Service. Subjects had
to interpret text and diagrams containing numerical information, and did arithmetic
calculations to answer the questions. For these two measures two subjects in each group
selected at random were paid for correct answers. The third measure was a simple game,
called Hit 15, played against the computer. Subject and computer alternated in moving.
The subjects’ goal in the game was to reach a total of 15 from a varying initial number
less than 15, to which the player or the computer had to add between 1 and 3 points on
each round. In this task, all subjects were paid for each round they won. The personality
traits measures are mostly derived from the short version of the Multidimensional
Personality Questionnaire (MPQ) (Patrick et al., 2002; Tellegen, 1982). Almost all of the
Page 17
154 questions have the same four possible answers: Always True, Mostly True, Mostly
False, and Always False, and the subject had to choose one. In addition we asked a series
of other attitudinal questions in a separate survey. There were no separate payments for
the surveys.
Cognitive Skill Index (CSI) is the measure of cognitive skill we use. It is computed
as the first factor in the factor analysis of the Raven’s score, the Numeracy score, and the
score in the Hit 15 game (see also Burks et al.(2009)).8 The Conscientiousness index is
an average obtained combining scores in the Control MPQ scale and several other survey
questions. The Neuroticism scale is the score on the questions on the Stress Reaction
MPQ-trait. The Agreeableness scale is the reverse of the Aggression MPQ scale. The
Extraversion scale is the sum of the Social Potency and the Social Closeness MPQ
scales. The five personality trait measures that we have derived are normalized in the
unit interval. In the sample, they have an approximately normal distribution, with slight
negative skew, with mean between 0.4 and 0.7, and SD between 0.11 and 0.30.
3. Experimental results: Relating Personality and Economic Preferences
In all the regressions reported below we control for all the variables described in Section
2.2, Socio-economic Characteristics.
3.1. Correlations
First in our list of questions to investigate is the link between economic preferences and
personality traits. The analysis below extends that of (Burks et al., 2009), where only
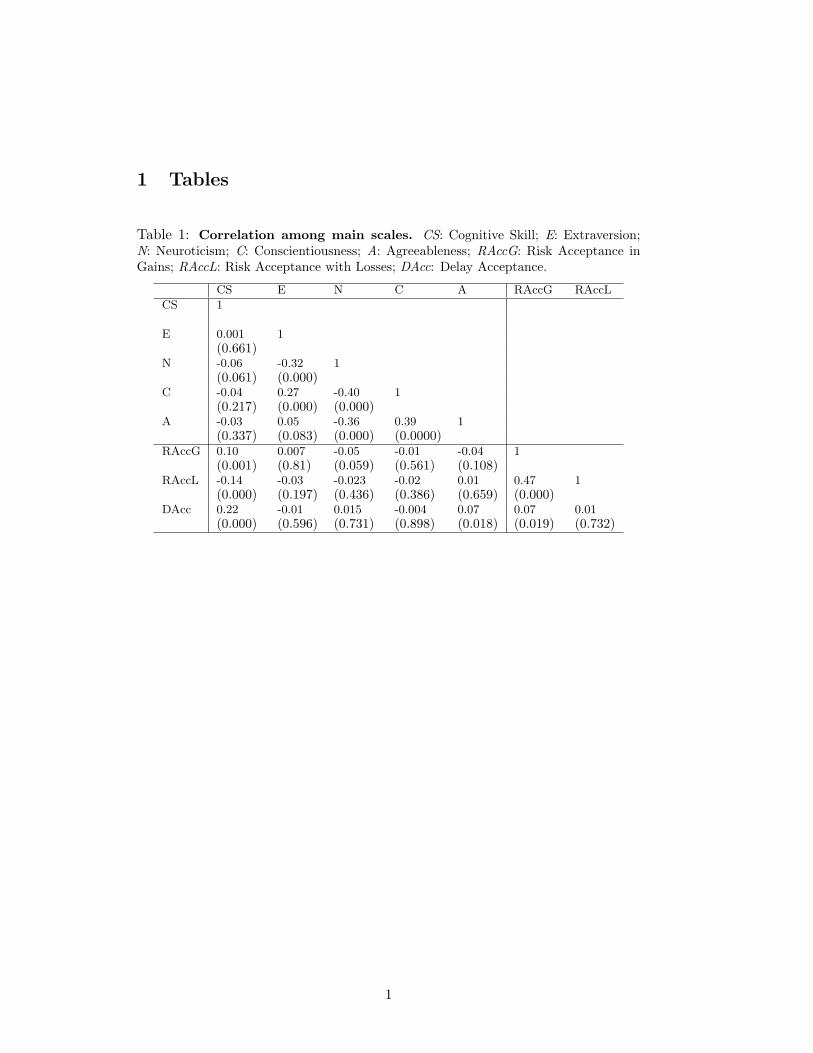
cognitive skill was considered, to the entire set of Big Five factors. Table 1 below reports
8 There was a problem with the Hit15 task that caused us to lose approximately the first 150 data points, which is why the N drops when we use it.
Page 18
the pair-wise correlation coefficients between the variables. The significance (p-value) of
the coefficient is reported in italics below the coefficient.
Insert Table 1 here
The data confirm that there is an unconditional correlation between all the main
measurements of economic preferences and Openness/Intellect (measured here by CSI).
The correlation is positive for willingness to take risks in the Gain domain and
willingness to accept delays in payment, and negative for risk acceptance in Losses.
There is a weak negative correlation between Neuroticism and Risk acceptance in gains,
and between Agreeableness and Acceptance of delay. The first is natural but weak; the
second could be the consequence of trust in the experimenter; alternatively, aggression
could be genuinely associated with high impatience due to impulsivity and unconcern
about long-term consequences of actions.In order to get a clearer picture, we have to
refine our analysis. In the regressions reported below, all the variables except Age and
Age2(which are in years) are normalized to be in the range zero to 1, so the size of the
coefficients are comparable.
3.2. Personality and Economic Preferences: Attitudes to Risk
In the regression of Risk Acceptance on personality traits and the control variables (see
Table 2), the only significant effects come from Native American (0.101, p =0.0431) and
Neuroticism (-0.158, p =0.0049) and the higher level of education (BA or more) (-0.05, p
=0.056). Among the personality variables, Neuroticism has a significant effect in the
expected direction of reducing the willingness to take risks (around -0.16, p =0.009).
Conscientiousness affects the attitude to risk through its inhibitive side (-0.1, p =0.096).
Insert Table 2 here
Page 19
The variable Risk acceptance we have considered so far is an average measure of the
attitude to risk of the individual, across both gains and losses, and with higher and lower
stakes. If we consider separately the effect of gains and losses, the conclusions become
richer and more clear: see Table 3.
Insert Table 3 here
The overall negative effect of Neuroticism on the willingness to take risks appears to
derive mostly from the effect on risk attitude in the gain domain (-0.2, p =0.003), and is
weaker in the loss domain. Cognitive skills have a stronger effect in the loss domain:
higher CS reduce risk acceptance with losses (-0.15, p =0.006).
A different approach is to consider a measure of risk aversion based on a power
specification of the utility function, instead of the average number of times a lottery is
chosen. We restrict here the analysis to choices in the gain domain, as it requires further
assumptions to identify utility over the gain-loss boundary. To study the potential effect
of stake size (limited, of course, by the modest range in stake variations available), we
also consider separately choices with higher and smaller stakes. The coefficient of risk
aversion is on average in the sample 0.57 for the higher stakes, and slightly smaller
(0.25) for the smaller stakes. The results for this non-linear transformation of the
previous measure are substantially similar: Neuroticism has a strong and significant
effect, and cognitive skill also has a positive effect.
3.3. Personality and Economic Preferences: Attitudes towards Ambiguity
A measure of ambiguity aversion which is independent of risk aversion is hard to
specify. An easier measurement is that of the possible additional aversion to (or
preference for) uncertain options when the probability of outcomes is not precisely
Page 20
defined. In our data the measure can be obtained as the difference between the number of
times the subject chose the lottery in the risky choice task and the number of times for
the otherwise identical ambiguous choice task. A larger number of risky as compared to
ambiguous choices can be taken as an index of higher ambiguity aversion; so the
variable, called Difference RA, is an index of ambiguity aversion. The variable is
approximately normally distributed, with mean close to 0 (0.45, with a range from of -24
to 24), SD =5.82, skewness = 0.13. Regression analysis is presented in Table 4.
Insert Table 4 here
African-American and divorced status have a weak effect (larger ambiguity
aversion). The only personality trait that has significant effects is Extraversion, which
higher score associated with smaller ambiguity aversion. The effect is around −4
(number of choices of lottery), over a total range of 48 (standardized β coefficient equal
to 8 per cent).
3.4. Personality and Economic Preferences: Time Preferences
Our simple measure of willingness to wait for delayed payments is the fraction of
delayed payments that the subject chose over the total number of choice.
Insert Table 5 here
Both measures of cognitive ability, either knowledge (measured by education) or
cognitive skills as measured by our index, are associated with a larger willingness to wait
for larger future payments. For education, having a BA or more has a coefficient of
0.107 (p-value = 0.00548) and CSI has one of 0.343 (p-value < 0.0001); this translates to
about 3 and about 9.5 more times the later payment is accepted.
Page 21
Insert Table 6 here
As in the case of the attitude to risk, the results are robust to different measures of the
willingness to wait. In the first two columns of Table 6 we examine separately the
estimates for choice where the earlier payment is immediate and those in which it is not.
In the last two columns of Table 6 we report the effects of our control variables on the
two parameters, β and δ, of a model using a quasi-hyperbolic specification of the utility
function (Laibson, 1997). In this model, both parameters are discount factors, but β
measures the willingness to wait when the earlier of the two payments is immediate, and
the δ the same willingness but when both payments are in the future. Hence β is a better
measure of the impulsivity component of impatience. We observe that effect of cognitive
skills is stronger on the β parameter by an order of magnitude. There may be a non-
linearity or an interaction effect here, as the finding with a simpler version of this model
using the same data in Burks, et al.(2009) was that the effects of CSI on β and δ were
qualitatively similar.
3.5. Personality and Economic Preferences: Summary
In summary, our analysis strengthens the conclusion derived from the correlation
analysis: the main effects of personality traits on economic preferences are the positive
effect of cognitive ability on Delay Acceptance and the negative effect of Neuroticism
on Risk Acceptance.
4. Experimental Results: Strategic behavior
One of the experimental tasks was a sequential Prisoner’s Dilemma (PD) game. Two
players are endowed with $5 each, and move one after the other. The first decides
whether to transfer $0 or $5 to the second. The second player is informed of the move of
Page 22
the first, and decides how much to transfer back, selecting the amount from the set {0,
1,..., 5}. The amount chosen by each subject is doubled by the experimenter before
receipt by the other.9 Choices of the subjects were elicited by the strategy method: each
subject had to decide how much he would transfer as first player, and how much he
would transfer back as second player, for each of the two cases of a $0 and a $5 transfer
by the first player.
Before actual choices were made, the beliefs of the subjects about the moves of the
others were elicited: subjects were asked what percentage of subjects would transfer $5
as first movers (“What percent of the participants do you think will send their $5?”), and
the average amount that would be sent back as second players, in the two different cases
(“If Person 1 does send $0–respectively, $5–what is the average amount that participants
in this room will send back?”). The results of regressing beliefs on the demographic
controls and personality traits are reported in Table 7.
Insert Table 7 here
Consistent with Burks, et al.(2009), a higher score in Cognitive Skills increases the
estimated fraction of subjects that send the $5 transfer as first movers, decreases the
expected amount transferred after a $0 transfer, and increases that after the $5 transfer.
Similarly, a higher score decreases the amount sent after the $0 transfer, and increases
that after the $5 one. Personality traits also matter. Agreeableness increases the estimated
fraction of first movers transferring $5 (17.6, p-value = 0.014), and the average amount
transferred after a $5 transfer is received (0.82, p-value = 0.032). It also increases
significantly the amount sent in all roles: as first mover (2.4, p-value < 0.001), as second
9 This distinguishes the sequential PD from the Trust Game, in which only the transfer from the first
Page 23
mover after a $0 transfer (1.41, p-value = 0.003) and after a $5 transfer (1.56, p-value <
0.001).
Insert Table 8 here
Next we look separately atthe three decisions with a set of nested regression models.
We start with just the demographic controls, then add just the personality traits, then just
the economic preferences, and then both (first with unitary Conscientiousness, and then
with Conscientiousness as two distinct facets). The amount transferred as first players
increases (0.89, p-value = 0.01), as one could expect, in subjects with higher willingness
to take risks; this may be expected since the response of the second mover is unknown,
hence risky. But it also increases the amount sent as second mover.
Insert Table 9 here
The amount sent as second mover increases with Neuroticism, in the case of both the
low transfer (0.95, p-value = 0.048) and the high transfer (1.03, p-value = 0.022) from
the first player.
Insert Table 10 here
5. Economic Outcomes: Credit Score
The credit score is the FICO-98, purchased by the company from the Fair Isaac
Corporation. It is available because each trainee signed a contract that is legally a credit
agreement, which commits them to repay the commercial cost of the training if they do
not complete one year of service after training (see Section 10, Appendix). 942 of the
trainees had a credit score. The credit score in this group has a distribution over nearly
the full nominal range of possible scores (407 to 821 out of a nominal range of 300 to
mover to the second is increased by the experimenter.
Page 24
850), with a mean of 588.4, SD = 93.2, and median 567. The national median value was
around 723 at the time of the data collection (Board of Governors, 2007), and the
subprime level of creditworthiness starts somewhere between 600 and 650 on the FICO-
98.10 The other subjects were reported to have insufficient identifiable data in their credit
record to permit the computation of the FICO − 98.
The distribution is not normal or log-normal: the log of the variable is skewed left
(skewness 0.29) and flatter than the normal (kurtosis = 2.18). An estimate of the factors
affecting the Credit Score is reported in Table 11. We do not report variables that do not
reach significance even at 10 per cent level.
Insert Table 11 here
Variables describing social-economic status have some significance. These are the
variables considered in the extensive analysis in the report of the Board of Governors of
the Federal Reserve to the Congress. Age increases the score by a point per year of age
(p-value is around 10 per cent), but the marginal effect is significantly increasing
(coefficient of Age2is 0.07, p-value < 0.005), so overall at the mean age the effect is two
points per extra year. Being divorced decreases it by around 20 points (p-value < 0.008).
College education (BA or more) increases it by around 30 to 50 points (p-value < 0.02);
lower levels of education have insignificant impact. Note that gender, and all ethnic
groups except African-American, have no significant effect once we introduce our
personality and economic preference variables.
10 Specific lenders define the credit score cut-off for prime versus subprime differently, and there is no single official definition; see, for example, the definition of 620 at car buying web site Edmunds.com (Clarke, 2001 (Updated: April 30, 2009); Accessed January 1, 2011).
Page 25
The personality variables have an effect, marginally so in the case of Cognitive Skill
(p-value for CSI between 9 and 11 per cent) and Neuroticism (-36.1, p-value = 0.1). All
(we discuss Conscientiousness more in detail below) have the expected sign.
Extraversion has a sizeable effect in the expected direction (-77.4,
p-value = 0.008). The effect of Conscientiousness is significant and negative: a higher
score is associated with a lower Credit Score. The effect is large and significant (-45.6
points, p-value = 0.04). Since Conscientiousness is an index of diligence and
responsibility the result appears at first sight paradoxical. To explain it, one needs to
remember the two aspects of Conscientiousness introduced earlier, and introduce them in
the analysis. Once we analyze the effect of the two sides separately, the effects of these
two aspects on Credit Score are natural. The proactive side, as a measure of need for
achievement, has a negative effect (57.6, p-value = 0.012), as one might expect since the
need for achievement might induce a pattern of expenses somewhat larger than the
individual’s means; the scrupulous and cautious side affects the score positively,
although not significantly (39.2, p-value = 0.105).
Among the economic preferences, Risk Acceptance is not significant. If Risk
Acceptance of Gains and Losses are introduced separately the effect is also insignificant
(p-value = 0.62 and 0.54, respectively). Delay Acceptance has a sizeable effect however,
and in the expected direction (36.4, p-value = 0.0008). Overall, the explanatory power of
Personality Traits is about double that of the Economic Preferences.
Both sets of variables pass the Likelihood Ratio (LR) test. If we take the model with
the control variables including the education as the null, then the LR test of the
Page 26
hypothesis that the coefficients of Economic Preferences are zero has a χ2= 14.99 (p-
value = 0.0006); the same test for Personality Traits has χ2= 24.26, p-value = 0.0002.
Insert Table 12 here
The availability of Credit score is substantially affected by education and by minority
status. Having at least some college has a marginal effect between 6 and 10 per cent.
6. Economic Outcomes: Job Persistence
In this section we investigate the factors affecting the separation from the firm. Recall
that there is a significant financial penalty to early exit: the trainee will owe the full
commercial value of the training received if he or she separates--for any reason--from
the firm before completing a year of post-training service. The first distinction is on the
basis of the moment in which separation from the firm occurs.
6.1. Time of separation
Hiring occurs at the end of basic training at the training facility. A Training Exit is an
exit before the end of basic training, for whatever reason. A Job Exit is an on-the-job
separation after hiring, for whatever reason. We estimate a Cox proportional hazard
model, where the hazard rate (the instantaneous rate of failure at time t, conditional on
surviving until t) has a baseline component common to all subjects, which is then
increased (shifted up) or decreased (shifted down) by an exponential of a linear function
of the independent variables and the estimated parameters.11 We report the hazard ratio
11 More carefully, the hazard rate for a subject is the product of a baseline hazard function common to all subjects with an exponential of a linear function of that subject’s variable values times the estimated parameters. Because the baseline hazard is not parameterized, but given by the data, it can have whatever time path the data provide, which increases the robustness of the model. In Burks, et al. {, 2008 #6} it is shown that the baseline hazard for new-to-the-industry drivers at this firm increases when the driver first works in his or her own, and then declines until the end of the training contract, when it sharply increases again.
Page 27
for each variable, so a value of less than one decreases the hazard of exit (implying
longer tenure), a value of one means that the variable has no effect, and a value greater
than one increases the hazard of exit (implying longer tenure).
Insert Table 13 here
For Training Exits, some of the socio-economic variables, such as African-American
(hazard ratio = 2.6, p-value < 0.0001) and Asian (hazard ratio = 6.6, p-value = 0.005),
induce a large increase in the probability of exit. None of the others socio-economic
variables does, including gender, and education. Marital status has a large (although
borderline significant) effect in the case of single-and-never-married. Economic
Preferences variables also do not have significant effect (for example our measure of
impatience for monetary payment in time, Delay Acceptance, has p-value = 0.71.)
Instead, Cognitive Skills substantially reduce the hazard (hazard ratio = 0.2, p-value =
0.003). Also the proactive side of Conscientiousness reduces the hazard (hazard ratio =
0.23, p-value = 0.03), while the inhibitive has no effect (p-value = 0.14). Neuroticism
also has a very large effect (hazard ratio = 4.16, p-value = 0.065).
Insert Table 14 here
The picture is similar for the case of Job Exits: African American (hazard ratio =
1.31, p-value = 0.09) and Latinos (hazard ratio = 1.77, p-value = 0.085) have a larger
probability of exit. For marital status, separated individuals have a substantially larger
probability of exit. A substantial difference from the early exit recorded by Training
Exits is the effect of Neuroticism: for the driver trainees that are left a higher score in
Neuroticism does not induce a higher risk of job exit.
6.2. Reason for Separation
Page 28
The second distinction is on the basis of the reason for separation from the firm. There
are two reasons for this to occur: Discharge or Voluntary Quit.
Insert Table 15 here
In both cases, minorities have a higher risk.
Insert Table 16 here
The personality characteristic that affects substantially both quits and discharges is
Cognitive skills. The reduction is particularly large in the case of Discharges (hazard
ratio = 0.13, p-value < 0.001), but in the case of voluntary quits too the reduction is by
half (hazard ratio = 0.48, p-value = 0.022).
7. Non-Economic Outcomes: Driving Accidents
Large truck accidents are inherently statistically difficult to analyze with conventional
government data, since ones that are significant enough to report to the Department of
Transportation are of quite low incidence, in the range of one or fewer per one hundred
million miles travelled (Burks et al., 2010a).12 However, the cooperating firm keeps
administrative records on all incidents in which any damage to a vehicle or a person
occurs, and analysts at a captive insurance firm classify each one as preventable (due to a
mixture of risk exposure and driver decisions) versus non-preventable (due only to risks
outside the driver's control). In addition the firm's safety mangers classify accidents
according to their potential severity, not just their actual severity, which increases the N
12 "DOT reportable" accidents are defined as: An occurrence involving a commercial motor vehicle on a public road in intrastate or interstate commerce, which results in: 1) a fatality; 2) injury to a person requiring immediate treatment away from the scene of the accident; or 3) disabling damage to a vehicle, requiring it to be towed.
Page 29
of accidents that represent serious outcomes for the driver, since the potential severity of
an accident, in addition to its severity, enters into disciplinary decisions.
The measure of potential severity takes on value of 5, 15, 30, and 50, in order of
increasing severity. Accidents of the lowest level of severity occur most frequently. In
the period of time we are analyzing a total of 940 accidents were reported that involve
the 947 drivers in our data set who have at least one week of driving after basic training.
This is an average of about one per driver, but 467 (49%) of all drivers in the study had
no reported accidents, while 235 (25%) exactly one accident, and the remainder (26%)
had more than one accident, so the distribution is uneven.
Of the total of 940 accidents, 73 per cent were in the lowest level 5; 23 per cent in
level 15, 3 per cent in level 30, and only one accident (0.1 per cent) at the most serious
level 50. Examples of the lowest potential severity accidents (level 5) are hitting a fixed
object (25 per cent of the cases for this level), hitting a parked vehicle (22 per cent),
being stuck and needing a tow (10 per cent), damaged equipment (10 per cent), damaged
property of a third party (8 per cent). Examples of the next-to-highest severity (level 30)
are overturning (16 per cent), jackknife (13 per cent), being forced off the road by a third
party (13 per cent), forcing a third party off the road (3 per cent). The single accident in
the highest level was hitting a pedestrian. Only 83 of the total reported accidents were
Department of Transportation (DOT) reportable, and so would show up on Federal
government records.
In our analysis we focus on the broadest category of preventable accidents. In work
not presented here we have analyzed the predictors of accident risk for a large subset
(N>10,000) of the firm's drivers using the demographic, operational, and job-type factors
Page 30
routinely collected in the firm's human resource and operational information technology
systems.13 In Table 17 we report the results of a set of nested Cox proportional hazard
rate models of the probability of having a preventable accident of any potential severity.
Each of these models includes as predictors all of the characteristics of the job that can in
principle affect the level of accident risk to which the driver is exposed. Example
variables are the number of miles driven in a week, the number of trip segments
completed in a week, and variables that identify the type of work to which the driver is
assigned, and the geographic home base location from which the driver works.14 The
first column adds only our standard human-capital-type demographic controls, the
second adds the Big Five alone to demographic controls, the third adds economic
preferences alone to the demographic controls, and the last two add both Big Five and
economic preferences, the first with a single Conscientiousness factor, and the second
with a two-facet version of Conscientiousness.
Insert here Table 17
The only ethnic category that is significant is Native American, but there are too few
individuals (29) in this category for this to tell us much. Education has no effect, and the
13 One unpublished result from this related analysis is that having a preventable accident of the lowest severity level is a positive predictor, controlling for demographics and operational risk factors, for having a later accident of higher severity. 14 Because work assignments are made by the firm, variables measuring work characteristics such the miles per week, the trip segments per week, and the type of work, to a first approximation are measures of the way the driver's risk of an accident varies due to exogenous factors. For instance, drivers working in "dedicated service" exclusively service a particular large customer, which reduces the number of unfamiliar routes they face, compared torunning the system, or being randomly dispatched from one customer to another. Various types of dedicated service cut the risk of a preventable accident to between 40% and 67% of the baseline level (which is for the reference category of running the system). This is qualitatively similar to the reduction from the inhibitive facet of Conscientiousness (39%). The "risk-exposure-only" version of this model for the drivers analyzed herein is available from the authors upon request.
Page 31
only demographic category that matters, is being single and never married. This marital
status effect deserves further investigation.
Economic theory predicts an effect on the probability of accidents from the attitude
towards risk of the individual, either directly (as a personal character trait), or through
the effect of personal and family conditions. However, the direct effect of risk aversion
in monetary payments (our Risk acceptance measure) has no predictive power for
accidents. Also the measure of impulsivity provided by the estimated discount β has no
effect. It appears that either there is no generalization across small monetary risks or
delayed payments and actions while driving, or possibly there is an indirect connection
acting through the single-never-married marital status.
However, one of the personality traits, the inhibitive side of Conscientiousness,
induces a large and significant reduction of the risk (hazard ratio 0.394, (p-value =
0.008). No other traits have a significant effect. Neuroticism is a natural candidate for a
reduction of risk, but it does not, and cognitive skills have no significant effect.
8. Non-Economic Outcomes: Health-Related
In the last section we report the analysis of variables measured contemporaneously with
the other initial intake data which are not directly indices of economic performance, but
are considered an indication of the general level of health of a person: the Body Mass
Index (BMI) and smoking habits.
8.1. BMI (Body Mass Index)
The BMI index is computed according to the formula (if W is Weight and H is Height):
BMI = ( (703) x W)/H2. In the sample, the BMI has mean 28.1 and SD of 6.9; the
Page 32
median 27.3. The distribution of BMI is approximately log normal, (mean = 3.3, SD
=0.23). Regression results are presented in Table 18.
Insert Table 18 here
Among the socio-economic and demographic variables, Age (standardized
coefficient = 0.19, p-value = 0.008) and Age2(-0.24, p-value < 0.001) have significant
effects; but Education has no effect. Extraversion has a significant and positive effect
(0.08, p-value = 0.044). Conscientiousness has a significant and negative effect (higher
Conscientiousness improves the BMI Index: standardized coefficient -0.15, p-value <
0.0001). When we analyze the contribution of the two facets of Conscientiousness
(inhibitive and proactive) the strongest effect is induced by the proactive side (-0.21, p-
value < 0.001), whereas the inhibitive side has no significant effect (1.12, p-value =
0.54). Among economic preferences Delay Acceptance is a natural candidate and has
been used to predict BMI, and a borderline significant effect (standardized coefficient
0.04, p-value between 0.05 and 0.07). If we take the model with the control variables
including the education as the null, then the LR test of the hypothesis that the
coefficients of Economic Preferences are zero has χ2=6.11 (p-value = 0.047); the same
test for Personality Traits, χ2= 24.56, p-value = 0.0002.
8.2. Smoking Addiction
A second important behavior that personality traits can help predict is whether the driver
trainee smokes. The training is in a short-term residential format, so the firm provides
hotel rooms to trainees and therefore keeps track of the room reservations. A subject is
classified as smoker if he chose a ”smoking” room, and as a non-smoker if he chose a
Page 33
”non-smoking” room; a missing observation is created in all other cases. Table 19
reports the results of the analysis of the factors affecting whether a trainee smokes or not.
Insert Table 19 here
Some of the effects among the socio-economic variables are natural and expected.
Education reduces the probability of smoking (the marginal effect with respect to the
baseline (a High School degree). Having a BA or more reduces by 17 per cent (p-value <
0.027), some college by 10 per cent (p-value < 0.031). Among the economic and
personality variables, two stand out. A higher score in Delay acceptance and a higher
degree of Inhibitive side of Conscientiousness both reduce the probability of being a
smoker. Here, unlike in the case of vehicle accidents, the measures constructed using
small to medium monetary rewards appear to generalize across domains. The marginal
effects of these two factors are similar: a reduction of 0.27 for the Delay acceptance (p-
value < 0.001) and a reduction of 0.36 for Inhibitive side of Conscientiousness (p-value
= 0.026). The two are significant when they are both among the independent variables,
hence the effect is probably independent.
If we take the model with the control variables including the education as the null
hypothesis, then the LR test of the hypothesis that the coefficients of Economic
Preferences are zero has χ2= 15.97 (p-value = 0.0003); the same test for Personality
Traits, χ2=8.35, p-value = 0.138. Cognitive skills are the insignificant in the full
regression, and their explanatory power is completely absorbed by the time preferences.
9. Discussion
We have documented two main sets of results.
Page 34
First, we find support for a general hypothesis that simplifies considerably the
relationship between economic preferences and personality traits. The main channel
between personality traits and economic preferences goes through Intelligence and
Neuroticism. Intelligence affects the preferences over time delivery of rewards,
increasing patience. This effect seems to be almost exclusive: other traits do not seem to
affect time preferences. Neuroticism affects the attitude to risk, decreasing willingness to
take risks. As we noted this result is in line with several previous findings connecting
Neuroticism to a general adversity to uncertainty (Hirsch and Inzlicht (2008)).
Intelligence modulates the preferences over risky choices by reducing the difference in
risk aversion in gain and loss domain, hence making the overall preference for risk more
consistent. Extraversion modulates the aversion to ambiguity, reducing the specific
aversion to options where the probability of outcomes is less clearly defined. Several of
the links we have found confirm earlier results: but by considering systematically the
relation between the measures of personality and preferences we have been able to
The second main contribution of the paper is that adding personality theory to the
explanatory variables, including experimental measurements of economic preferences,
increases significantly the predictive power for most dependent variables. This is also
true in the very important case where the dependent variables are real economic
outcomes. Of course, adding variables to the list of independent variables will always
increase the predictive power of a statistical model, but this appears to be an increase in
the ability to explain economic behavior. Further, we find that when we compare the
explanatory power of the two set of variables, they are at least similar in size, or that of
Page 35
personality variables is larger. Once we have clarified that personality variables affect
economic outcomes, an open and new direction of research is to determine how the
effect operates. Our results indicate that this may occur in surprising way, suggesting
that a deeper understanding of this connection is needed. The example of the negative
effect of Conscientiousness on Credit Score, resulting from a weak or insignificant
positive effect of the Inhibitive facet and a strong and negative effect of the Proactive
one, suggest that this relationship is complex.
Page 36
10. Appendix: Who are the subjects?
The cooperating firm operates in the "full truckload" (TL) segment of the U.S. for-hire
motor freight industry. TL drivers provide point-to-point service within a region or
across the continent, but normally within the U.S. They are paid by the mile to operate
large tractor-trailers (maximum gross vehicle weight of 80,000 lbs., or 36,000 kg, and an
overall length of 60 to 65 ft., or about 20 meters). TL drivers generally drive medium to
long distances, work relatively long and irregular weekly hours, and have limited and
often uncertain amounts of time off at home. The salient characteristics of this segment
for economists are that it has very low entry barriers, and few, if any, economies of
scale, so it is essentially perfectly competitive (Burks et al., 2010a). Thus, firms have
very little pricing power, and very little ability to pass higher labor costs through to
customers, so the pay rates are modest.
The resulting labor market equilibrium for TL drivers, stable since the segment
emerged in its modern form in the mid-eighties after the 1980 deregulation, involves
high turnover, which shows that the costs of high turnover are less than the alternative of
paying compensating differentials (or running trucks out of route to get drivers home
more often) in order to keep more drivers longer (Burks et al., 2008). Our initial intake
data was collected during the boom years of 2005 and 2006, when, according to the
American Trucking Associations, the annualized turnover rate at large TL firms hadn't
been under 100% since they began tracking it.15
Like many larger TL firms, during times of economic expansion the cooperating firm
Page 37
actively recruits new-to-the-industry drivers, and trains them at one or more company-
operated schools. Drivers without both a commercial drivers license (CDL) and
sufficient recent over-the-road experience go through a two-week residential basic
training program, followed by one to four weeks hauling freight with an instructor beside
them in the cab, before beginning work entirely on their own. All trainees signed a
training contract, the terms of which called for an immediate repayment of the full
market value of the training (on the order of $4,000) if the individual did not complete
one year of service after training, for any reason.
We collected our data from trainees at a school in the upper Midwest. Of the
approximately 3,000 trainees passing through the school annually we offered the
opportunity to take part in the study to 1,178; of these 1,065, or 90.8%, chose to take
part.
Interestingly, among our subjects we find that in a forced-choice question asking for
a single response, about 50% report the most important reason they entered training was
for lifestyle reasons (e.g. wanted to travel, wanted to drive a big rig, etc.), and only about
40% gave a directly economic answer (e.g. need a regular job, or like the pay). As a
result, despite the high turnover rate, our subject group is likely to be broadly
representative of the blue collar service-sector workforce in the U.S..
15 The economic recession significantly reduced TL driver turnover: the annualized turnover rate at large TL carriers bottomed out at 39% in the first quarter of 2010. However, it has been rising again since then.
Page 38
References
Block, J. (2002). Personality as an affect-processing system: Toward an integrative
theory. Mahwah, New Jersey: Lawrence Erlbaum Associates.
Board of Governors, Report to the Congress on Credit Scoring and Its Effects on the
Availability and Affordability of Credit. Federal Reserve System, Washington,
DC, 2007, pp. 1-264.
Borghans, L., Duckworth, A. L., Heckman, J. J., Weel, B. t., 2008.The Economics and
Psychology of Personality Traits.Journal of Human Resources.43, 972-1059.
Burks, S., Carpenter, J., Götte, L., Monaco, K., Porter, K., Rustichini, A., Using
Behavioral Economic Field Experiments at a Firm: the Context and Design of the
Truckers and Turnover Project. In: S. Bender, et al., (Eds.), The Analysis of Firms
and Employees: Quantitative and Qualitative Approaches. NBER and University
of Chicago Chicago and London, 2008, pp. 45-106.
Burks, S. V., Belzer, M., Kwan, Q., Pratt, S., Shackelford, S., Trucking 101: An Industry
Primer. Transportation Research Circular Number E-C146.Transportation
Research Board, Washington, DC, 2010a.
Burks, S. V., Carpenter, J., Götte, L., Rustichini, A., 2009. Cognitive Skills Affect
Economic Preferences, Social Awareness, and Job Attachment.Proceedings of the
National Academy of Science (USA).106, 7745-50.
Page 39
Burks, S. V., Carpenter, J., Götte, L., Rustichini, A., Overconfidence is a Social
Signalling Bias. Discussion Paper # 4840. Institute for the Study of Labor, Bonn,
2010b, pp. 1-43.
Clarke, W., Tips for Subprime Borrowers; Getting a Car Loan with Bad
Credit.http://www.edmunds.com/car-loan/tips-for-subprime-borrowers.html.
Edmunds.Com, 2001 (Updated: April 30, 2009); Accessed January 1, 2011.
Costa, P. T., McCrae, R. R., Dye, D. A., 1991. Facet scales for agreeableness and
conscientiousness: A revision of the NEO Personality Inventory. Personality and
Individual Differences. 12, 887-898.
DeYoung, C. G., 2006. Higher-order factors of the Big Five in a multi-informant sample.
Journal of Personality and Social Psychology. 91, 1138-1151.
DeYoung, C. G. (2010a). Personality neuroscience and the biology of traits.Social and
Personality Psychology Compass, 4, 1165–1180.
DeYoung, C. G. (2010b). Toward a theory of the Big Five.Psychological Inquiry, 21, 26–
33.
DeYoung, C. G. (2011). Intelligence and personality.In R. J. Sternberg & S. B. Kaufman
(Eds.), The Cambridge handbook of intelligence (pp. 711–737). New York:
Cambridge University Press.
DeYoung, C. G., Grazioplene, R. G., & Peterson, J. B. (in press). From madness to
genius: The Openness/Intellect trait domain as a paradoxical simplex. Journal of
Research in Personality.
Page 40
DeYoung, C. G., Hirsh, J. B., Shane, M. S., Papademetris, X., Rajeevan, N., & Gray, J.
R. (2010). Testing predictions from personality neuroscience: Brain structure and
the Big Five.Psychological Science, 21, 820–828.
DeYoung, C. G., Quilty, L. C., Peterson, J. B., 2007. Between facets and domains: 10
aspects of the big five. Journal of Personality and Social Psychology. 93, 880-896.
DeYoung, C. G., Quilty, L. C., Peterson, J. B., & Gray, J. R. (in press). Openness to
Experience, Intellect, and cognitive ability. Journal of Personality Assessment.
Digman, J. M., 1997. Higher-order factors of the big five. Journal of Personality and
Social Psychology. 73, 1246-1256.
Ellsberg, D. Risk, Ambiguity, and the Savage Axioms. . The Quarterly Journal of
Economics, 75, 4, 1961, 643-669
Hinson, J. M., Jameson, T. L., & Whitney, P. (2003).Impulsive decision making and
working memory.Journal of Experimental Psychology: Learning, Memory, &
Cognition, 29, 298−306.
Hirsh, J. B., DeYoung, C. G., Peterson, J. B., 2009. Metatraits of the Big Five
Differentially Predict Engagement and Restraint of Behavior. Journal of
Personality. 77, 1085-1102.
Hirsh, J. B., Inzlicht, M., 2008. The Devil You Know: Neuroticism Predicts Neural
Response to Uncertainty. Psychological Science. 19, 962-967.
Jang, K. L., Hu, S., Livesley, W. J., Angleitner, A., Riemann, & Vernon, P. A. (2002).
Genetic and environmental influences on the covariance of facets defining the
Page 41
domains of the five-factor model of personality.Personality and Individual
Differences, 33, 83-101.
John, O. P., Naumann, L. P., & Soto, C. J. (2008). Paradigm shift to the integrative Big
Five trait taxonomy: History: measurement, and conceptual issue. In O. P. John,
R. W. Robins, & L. A. Pervin (Eds). Handbook of personality: Theory and
research (pp. 114-158). New York: Guilford Press.
Kahneman, Daniel, & Amos Tversky (1979). Prospect Theory: An Analysis of Decision
under Risk, Econometrica, 47, 263-291.
Laibson, D., 1997. Golden Eggs and Hyperbolic Discounting. Quarterly Journal of
Economics.112, 443-77.
Markon, K. E., Krueger, R. F., & Watson, D. (2005).Delineating the structure of normal
and abnormal personality: An integrative hierarchical approach.Journal of
Personality and Social Psychology, 88, 139–157.
Nettle, D. (2006).The evolution of personality variation in humans and other
animals.American Psychologist, 61, 622-631.
Ones, D. S., & Viswesvaran, C. 1998. The effects of social desirability and faking on
personality and integrity assessment for personnel selection. Human Performance,
11, 245-269.
Ostaszewski, P. (1996). The relation between temperament and rate of temporal
discounting.European Journal of Personality, 10, 161-172.
Page 42
Ozer, Daniel and Veronica Benet-Martınez, 2006, Personality and the Prediciton of
consequntial outcomes, Annual Review of Psychology, 57, 401-421
Patrick, C., Curtin, J., Tellegen, A., 2002. Development and Validation of a Brief Form
of the Multidimensional Personality Questionnaire.Psychological Assessment. 14,
150-164.
Rabin, Matthew, R, Weizsacker, G. 2009. "Narrow Bracketing and DominatedChoices."
American Economic Review, 99(4): 1508–43.
Raven, J., Raven, J. C., Court, J. H., Section 3: The Standard Progressive Matrices.
Manual for Raven's Progressive Matrices and Vocabulary Scales.Psychological
Corporation, San Antonio, TX, 2000.
Richards, J. B., Zhang, L., Mitchell, S., & de Wit, H. (1999). Delay and probability
discounting in a model of impulsive behavior: effect of alcohol. Journal of the
Experimental Analysis of Behavior, 71, 121–143.
Roberts, B. W., Kuncel, N. R., Shiner, R., Caspi, A., Goldberg, L. R., 2007. The Power
of Personality The Comparative Validity of Personality Traits, Socioeconomic
Status, and Cognitive Ability for Predicting Important Life Outcomes.
Perspectives on Psychological Science. 2, 313-345.
Rustichini, A., 2009. Neuroeconomics: what have we found, and what should we search
for. Current Opinion in Neurobiology. 19, 672-677.
Schmeidler, D., (1989). "Subjective Probability and Expected Utility without
Additivity". Econometrica, 57, 3, 571–587
Page 43
Shamosh, N.A., & Gray, J.R. (2008). Delay discounting and intelligence: A meta-
analysis. Intelligence, 38, 289–305.
Shamosh, N. A., DeYoung, C. G., Green, A. E., Reis, D. L., Johnson, M. R., Conway, A.
R. A., Engle, R. W., Braver, T. S., Gray, J. R., 2008. Individual Differences in
Delay Discounting Relation to Intelligence, Working Memory, and Anterior
Prefrontal Cortex.Psychological Science. 19, 904-911.
Swann, A. C., Bjork, J. M., Moeller, F. G., & Dougherty, D. M. (2002). Two models of
impulsivity: relationship to personality traits and psychopathology. Biological Psychiatry,
51, 988–994.
Tellegen, A., & Waller, N. G. (2008).Exploring personality through test construction:
Development of the Multidimensional Personality Questionnaire. In G. J. Boyle,
G. Matthews, & D. H. Saklofske (Eds.), The SAGE handbook of personality
theory and assessment. London, UK: SAGE Publications Ltd.
Van Egeren, L. F. (2009). A cybernetic model of global personality traits.Personality and
Social Psychology Review, 13, 92-108.
1 Tables
Table 1: Correlation among main scales. CS: Cognitive Skill; E: Extraversion;N: Neuroticism; C: Conscientiousness; A: Agreeableness; RAccG: Risk Acceptance inGains; RAccL: Risk Acceptance with Losses; DAcc: Delay Acceptance.
CS E N C A RAccG RAccL
CS 1
E 0.001 1(0.661)
N -0.06 -0.32 1(0.061) (0.000)
C -0.04 0.27 -0.40 1(0.217) (0.000) (0.000)
A -0.03 0.05 -0.36 0.39 1(0.337) (0.083) (0.000) (0.0000)
RAccG 0.10 0.007 -0.05 -0.01 -0.04 1(0.001) (0.81) (0.059) (0.561) (0.108)
RAccL -0.14 -0.03 -0.023 -0.02 0.01 0.47 1(0.000) (0.197) (0.436) (0.386) (0.659) (0.000)
DAcc 0.22 -0.01 0.015 -0.004 0.07 0.07 0.01(0.000) (0.596) (0.731) (0.898) (0.018) (0.019) (0.732)
1
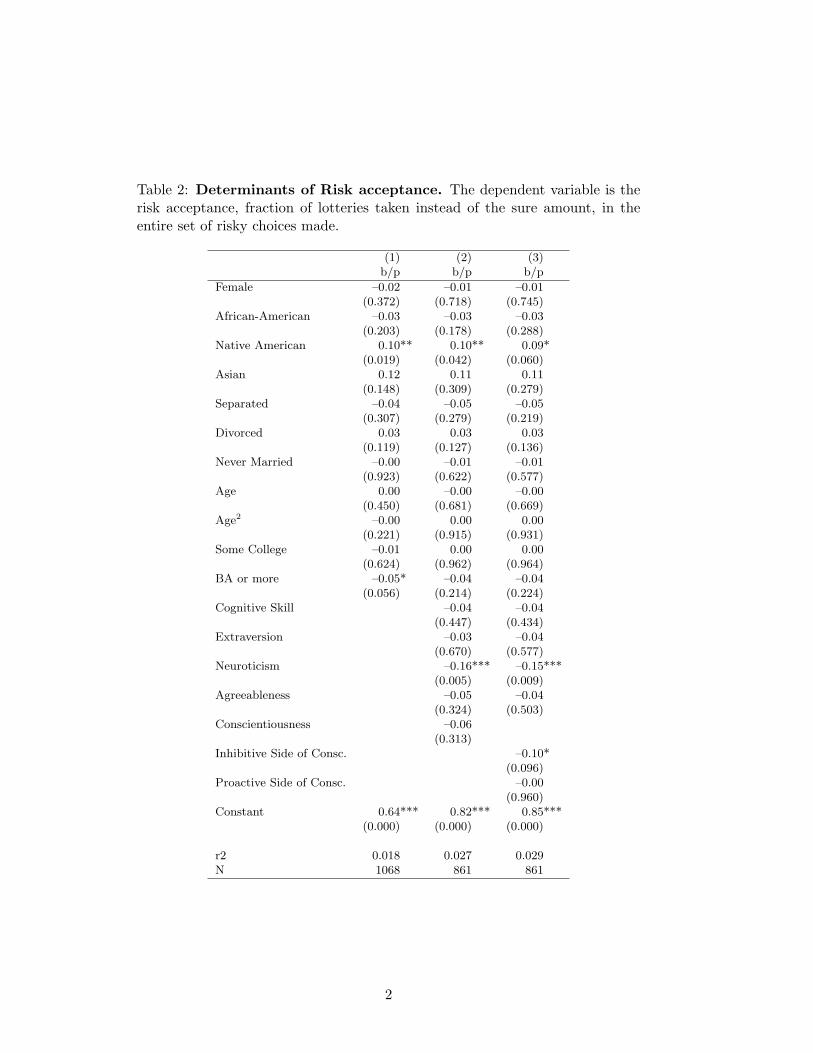
Table 2: Determinants of Risk acceptance. The dependent variable is therisk acceptance, fraction of lotteries taken instead of the sure amount, in theentire set of risky choices made.
(1) (2) (3)b/p b/p b/p
Female –0.02 –0.01 –0.01(0.372) (0.718) (0.745)
African-American –0.03 –0.03 –0.03(0.203) (0.178) (0.288)
Native American 0.10** 0.10** 0.09*(0.019) (0.042) (0.060)
Asian 0.12 0.11 0.11(0.148) (0.309) (0.279)
Separated –0.04 –0.05 –0.05(0.307) (0.279) (0.219)
Divorced 0.03 0.03 0.03(0.119) (0.127) (0.136)
Never Married –0.00 –0.01 –0.01(0.923) (0.622) (0.577)
Age 0.00 –0.00 –0.00(0.450) (0.681) (0.669)
Age2 –0.00 0.00 0.00(0.221) (0.915) (0.931)
Some College –0.01 0.00 0.00(0.624) (0.962) (0.964)
BA or more –0.05* –0.04 –0.04(0.056) (0.214) (0.224)
Cognitive Skill –0.04 –0.04(0.447) (0.434)
Extraversion –0.03 –0.04(0.670) (0.577)
Neuroticism –0.16*** –0.15***(0.005) (0.009)
Agreeableness –0.05 –0.04(0.324) (0.503)
Conscientiousness –0.06(0.313)
Inhibitive Side of Consc. –0.10*(0.096)
Proactive Side of Consc. –0.00(0.960)
Constant 0.64*** 0.82*** 0.85***(0.000) (0.000) (0.000)
r2 0.018 0.027 0.029N 1068 861 861
2
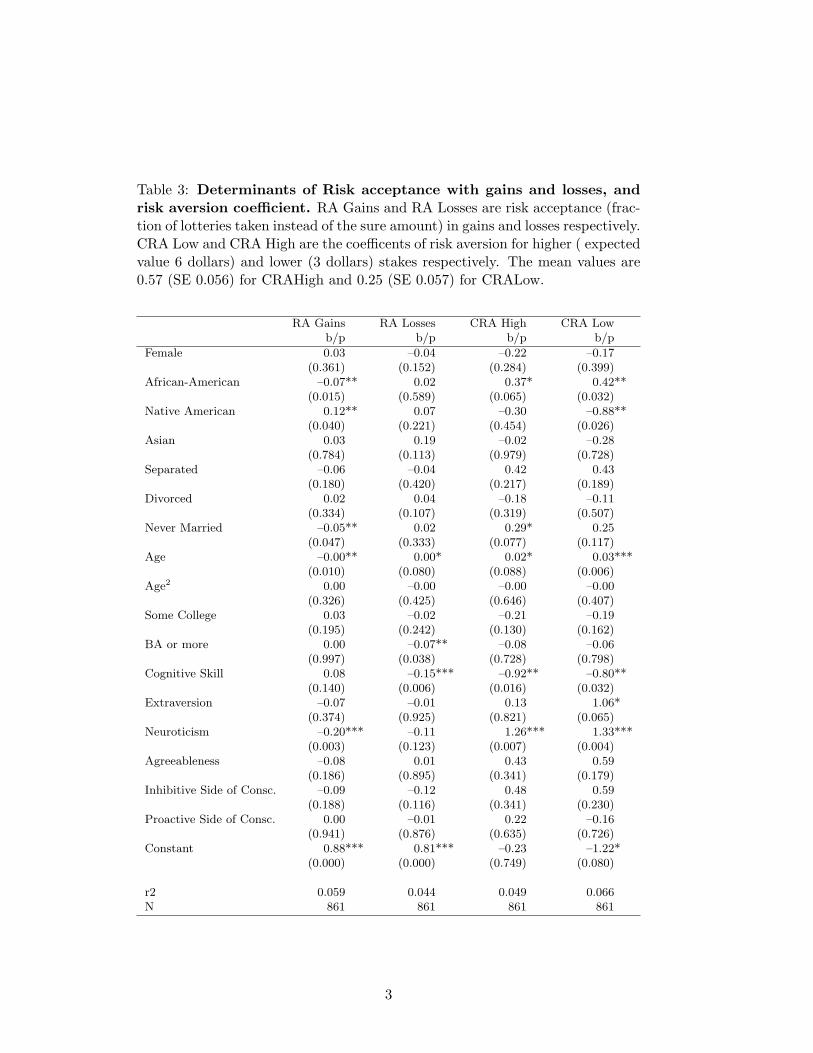
Table 3: Determinants of Risk acceptance with gains and losses, andrisk aversion coefficient. RA Gains and RA Losses are risk acceptance (frac-tion of lotteries taken instead of the sure amount) in gains and losses respectively.CRA Low and CRA High are the coefficents of risk aversion for higher ( expectedvalue 6 dollars) and lower (3 dollars) stakes respectively. The mean values are0.57 (SE 0.056) for CRAHigh and 0.25 (SE 0.057) for CRALow.
RA Gains RA Losses CRA High CRA Lowb/p b/p b/p b/p
Female 0.03 –0.04 –0.22 –0.17(0.361) (0.152) (0.284) (0.399)
African-American –0.07** 0.02 0.37* 0.42**(0.015) (0.589) (0.065) (0.032)
Native American 0.12** 0.07 –0.30 –0.88**(0.040) (0.221) (0.454) (0.026)
Asian 0.03 0.19 –0.02 –0.28(0.784) (0.113) (0.979) (0.728)
Separated –0.06 –0.04 0.42 0.43(0.180) (0.420) (0.217) (0.189)
Divorced 0.02 0.04 –0.18 –0.11(0.334) (0.107) (0.319) (0.507)
Never Married –0.05** 0.02 0.29* 0.25(0.047) (0.333) (0.077) (0.117)
Age –0.00** 0.00* 0.02* 0.03***(0.010) (0.080) (0.088) (0.006)
Age2 0.00 –0.00 –0.00 –0.00(0.326) (0.425) (0.646) (0.407)
Some College 0.03 –0.02 –0.21 –0.19(0.195) (0.242) (0.130) (0.162)
BA or more 0.00 –0.07** –0.08 –0.06(0.997) (0.038) (0.728) (0.798)
Cognitive Skill 0.08 –0.15*** –0.92** –0.80**(0.140) (0.006) (0.016) (0.032)
Extraversion –0.07 –0.01 0.13 1.06*(0.374) (0.925) (0.821) (0.065)
Neuroticism –0.20*** –0.11 1.26*** 1.33***(0.003) (0.123) (0.007) (0.004)
Agreeableness –0.08 0.01 0.43 0.59(0.186) (0.895) (0.341) (0.179)
Inhibitive Side of Consc. –0.09 –0.12 0.48 0.59(0.188) (0.116) (0.341) (0.230)
Proactive Side of Consc. 0.00 –0.01 0.22 –0.16(0.941) (0.876) (0.635) (0.726)
Constant 0.88*** 0.81*** –0.23 –1.22*(0.000) (0.000) (0.749) (0.080)
r2 0.059 0.044 0.049 0.066N 861 861 861 861
3
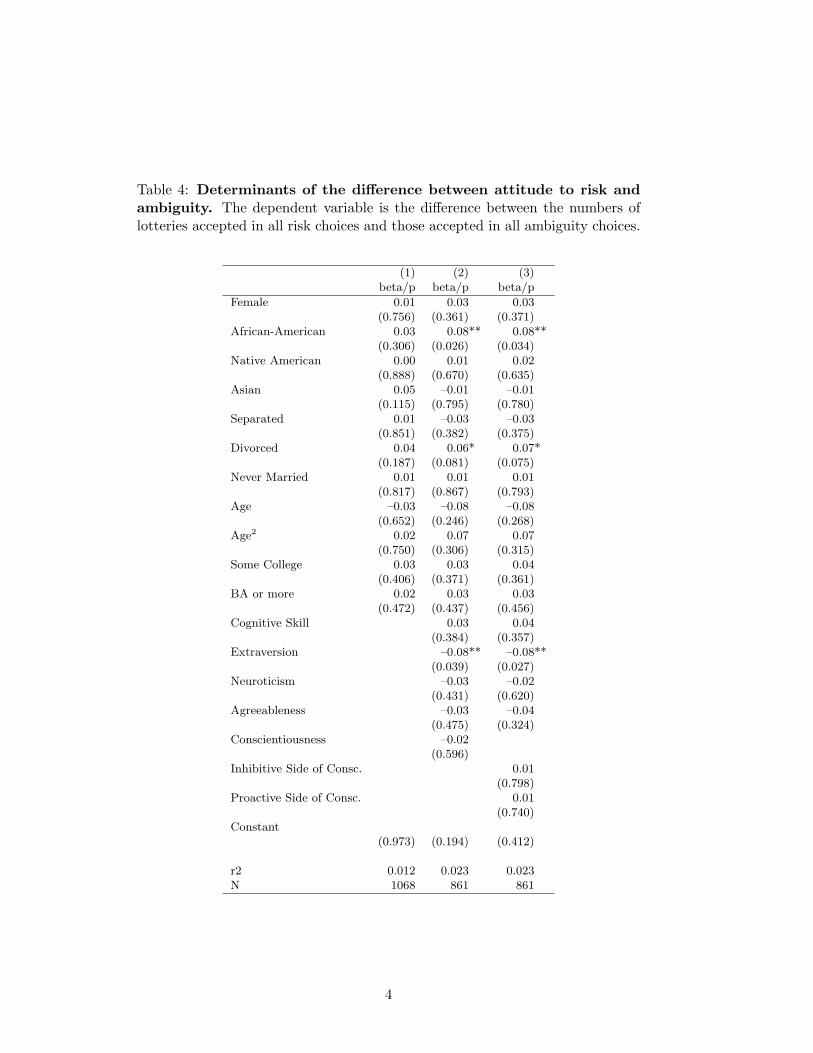
Table 4: Determinants of the difference between attitude to risk andambiguity. The dependent variable is the difference between the numbers oflotteries accepted in all risk choices and those accepted in all ambiguity choices.
(1) (2) (3)beta/p beta/p beta/p
Female 0.01 0.03 0.03(0.756) (0.361) (0.371)
African-American 0.03 0.08** 0.08**(0.306) (0.026) (0.034)
Native American 0.00 0.01 0.02(0.888) (0.670) (0.635)
Asian 0.05 –0.01 –0.01(0.115) (0.795) (0.780)
Separated 0.01 –0.03 –0.03(0.851) (0.382) (0.375)
Divorced 0.04 0.06* 0.07*(0.187) (0.081) (0.075)
Never Married 0.01 0.01 0.01(0.817) (0.867) (0.793)
Age –0.03 –0.08 –0.08(0.652) (0.246) (0.268)
Age2 0.02 0.07 0.07(0.750) (0.306) (0.315)
Some College 0.03 0.03 0.04(0.406) (0.371) (0.361)
BA or more 0.02 0.03 0.03(0.472) (0.437) (0.456)
Cognitive Skill 0.03 0.04(0.384) (0.357)
Extraversion –0.08** –0.08**(0.039) (0.027)
Neuroticism –0.03 –0.02(0.431) (0.620)
Agreeableness –0.03 –0.04(0.475) (0.324)
Conscientiousness –0.02(0.596)
Inhibitive Side of Consc. 0.01(0.798)
Proactive Side of Consc. 0.01(0.740)
Constant(0.973) (0.194) (0.412)
r2 0.012 0.023 0.023N 1068 861 861
4
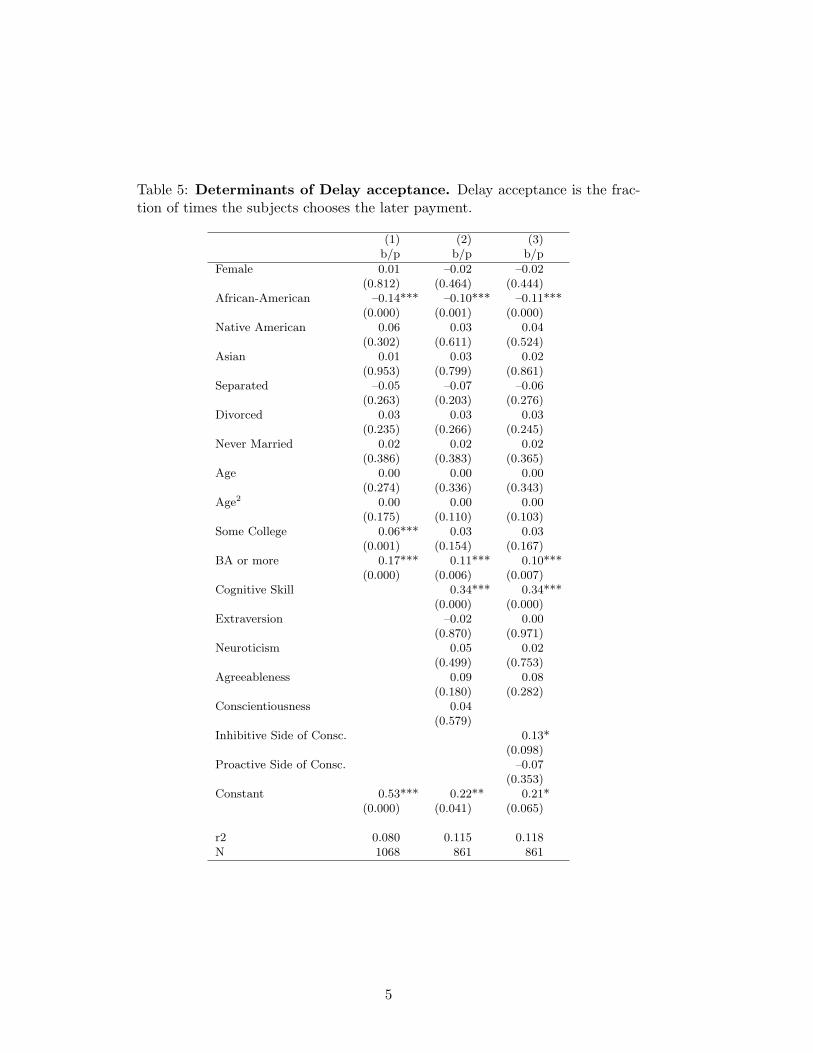
Table 5: Determinants of Delay acceptance. Delay acceptance is the frac-tion of times the subjects chooses the later payment.
(1) (2) (3)b/p b/p b/p
Female 0.01 –0.02 –0.02(0.812) (0.464) (0.444)
African-American –0.14*** –0.10*** –0.11***(0.000) (0.001) (0.000)
Native American 0.06 0.03 0.04(0.302) (0.611) (0.524)
Asian 0.01 0.03 0.02(0.953) (0.799) (0.861)
Separated –0.05 –0.07 –0.06(0.263) (0.203) (0.276)
Divorced 0.03 0.03 0.03(0.235) (0.266) (0.245)
Never Married 0.02 0.02 0.02(0.386) (0.383) (0.365)
Age 0.00 0.00 0.00(0.274) (0.336) (0.343)
Age2 0.00 0.00 0.00(0.175) (0.110) (0.103)
Some College 0.06*** 0.03 0.03(0.001) (0.154) (0.167)
BA or more 0.17*** 0.11*** 0.10***(0.000) (0.006) (0.007)
Cognitive Skill 0.34*** 0.34***(0.000) (0.000)
Extraversion –0.02 0.00(0.870) (0.971)
Neuroticism 0.05 0.02(0.499) (0.753)
Agreeableness 0.09 0.08(0.180) (0.282)
Conscientiousness 0.04(0.579)
Inhibitive Side of Consc. 0.13*(0.098)
Proactive Side of Consc. –0.07(0.353)
Constant 0.53*** 0.22** 0.21*(0.000) (0.041) (0.065)
r2 0.080 0.115 0.118N 1068 861 861
5
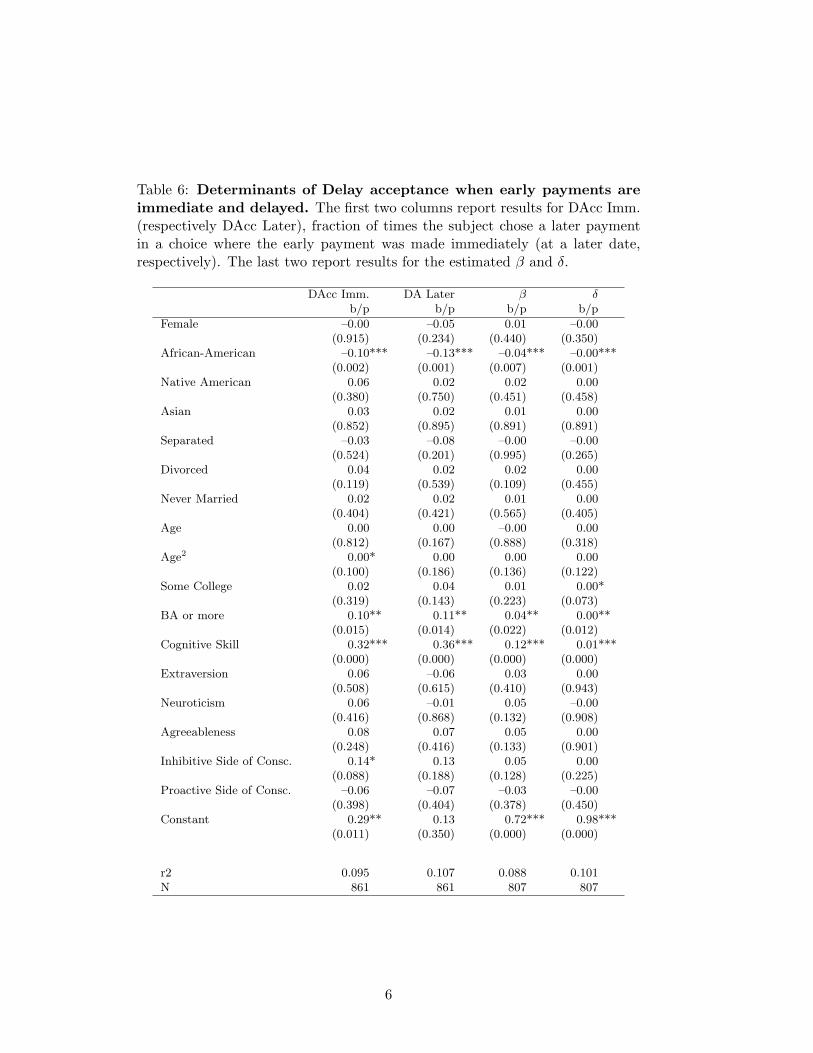
Table 6: Determinants of Delay acceptance when early payments areimmediate and delayed. The first two columns report results for DAcc Imm.(respectively DAcc Later), fraction of times the subject chose a later paymentin a choice where the early payment was made immediately (at a later date,respectively). The last two report results for the estimated β and δ.
DAcc Imm. DA Later β δb/p b/p b/p b/p
Female –0.00 –0.05 0.01 –0.00(0.915) (0.234) (0.440) (0.350)
African-American –0.10*** –0.13*** –0.04*** –0.00***(0.002) (0.001) (0.007) (0.001)
Native American 0.06 0.02 0.02 0.00(0.380) (0.750) (0.451) (0.458)
Asian 0.03 0.02 0.01 0.00(0.852) (0.895) (0.891) (0.891)
Separated –0.03 –0.08 –0.00 –0.00(0.524) (0.201) (0.995) (0.265)
Divorced 0.04 0.02 0.02 0.00(0.119) (0.539) (0.109) (0.455)
Never Married 0.02 0.02 0.01 0.00(0.404) (0.421) (0.565) (0.405)
Age 0.00 0.00 –0.00 0.00(0.812) (0.167) (0.888) (0.318)
Age2 0.00* 0.00 0.00 0.00(0.100) (0.186) (0.136) (0.122)
Some College 0.02 0.04 0.01 0.00*(0.319) (0.143) (0.223) (0.073)
BA or more 0.10** 0.11** 0.04** 0.00**(0.015) (0.014) (0.022) (0.012)
Cognitive Skill 0.32*** 0.36*** 0.12*** 0.01***(0.000) (0.000) (0.000) (0.000)
Extraversion 0.06 –0.06 0.03 0.00(0.508) (0.615) (0.410) (0.943)
Neuroticism 0.06 –0.01 0.05 –0.00(0.416) (0.868) (0.132) (0.908)
Agreeableness 0.08 0.07 0.05 0.00(0.248) (0.416) (0.133) (0.901)
Inhibitive Side of Consc. 0.14* 0.13 0.05 0.00(0.088) (0.188) (0.128) (0.225)
Proactive Side of Consc. –0.06 –0.07 –0.03 –0.00(0.398) (0.404) (0.378) (0.450)
Constant 0.29** 0.13 0.72*** 0.98***(0.011) (0.350) (0.000) (0.000)
r2 0.095 0.107 0.088 0.101N 861 861 807 807
6
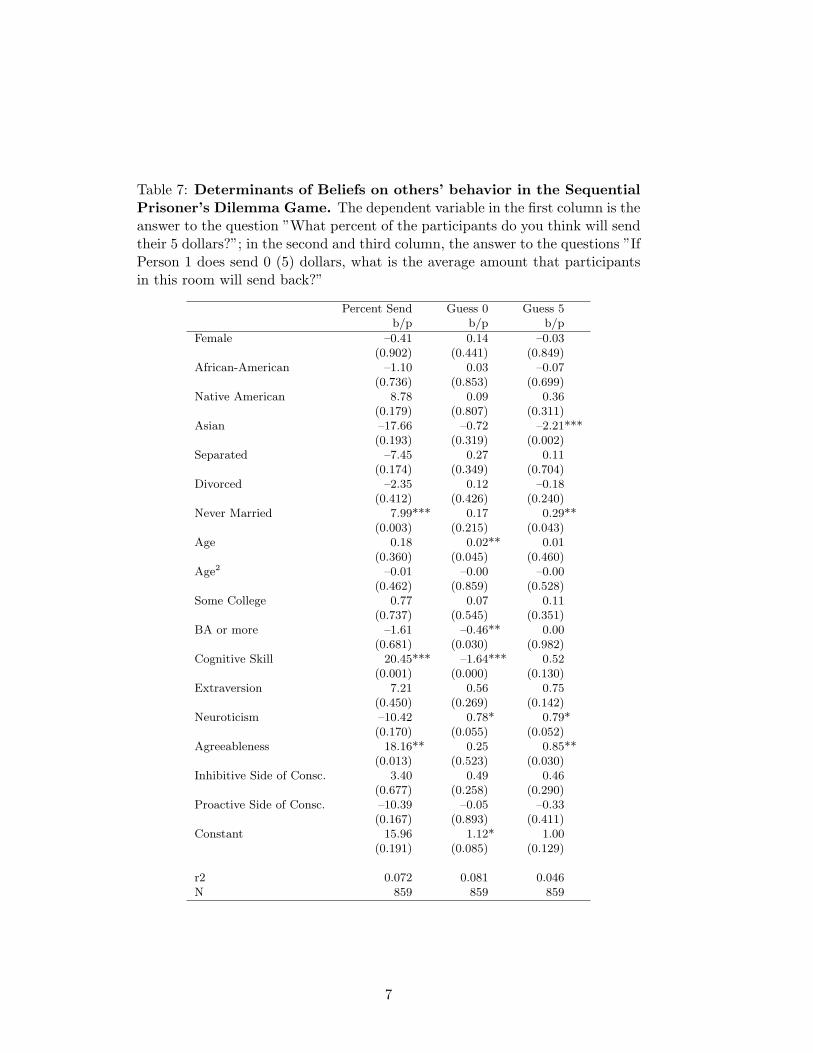
Table 7: Determinants of Beliefs on others’ behavior in the SequentialPrisoner’s Dilemma Game. The dependent variable in the first column is theanswer to the question ”What percent of the participants do you think will sendtheir 5 dollars?”; in the second and third column, the answer to the questions ”IfPerson 1 does send 0 (5) dollars, what is the average amount that participantsin this room will send back?”
Percent Send Guess 0 Guess 5b/p b/p b/p
Female –0.41 0.14 –0.03(0.902) (0.441) (0.849)
African-American –1.10 0.03 –0.07(0.736) (0.853) (0.699)
Native American 8.78 0.09 0.36(0.179) (0.807) (0.311)
Asian –17.66 –0.72 –2.21***(0.193) (0.319) (0.002)
Separated –7.45 0.27 0.11(0.174) (0.349) (0.704)
Divorced –2.35 0.12 –0.18(0.412) (0.426) (0.240)
Never Married 7.99*** 0.17 0.29**(0.003) (0.215) (0.043)
Age 0.18 0.02** 0.01(0.360) (0.045) (0.460)
Age2 –0.01 –0.00 –0.00(0.462) (0.859) (0.528)
Some College 0.77 0.07 0.11(0.737) (0.545) (0.351)
BA or more –1.61 –0.46** 0.00(0.681) (0.030) (0.982)
Cognitive Skill 20.45*** –1.64*** 0.52(0.001) (0.000) (0.130)
Extraversion 7.21 0.56 0.75(0.450) (0.269) (0.142)
Neuroticism –10.42 0.78* 0.79*(0.170) (0.055) (0.052)
Agreeableness 18.16** 0.25 0.85**(0.013) (0.523) (0.030)
Inhibitive Side of Consc. 3.40 0.49 0.46(0.677) (0.258) (0.290)
Proactive Side of Consc. –10.39 –0.05 –0.33(0.167) (0.893) (0.411)
Constant 15.96 1.12* 1.00(0.191) (0.085) (0.129)
r2 0.072 0.081 0.046N 859 859 859
7
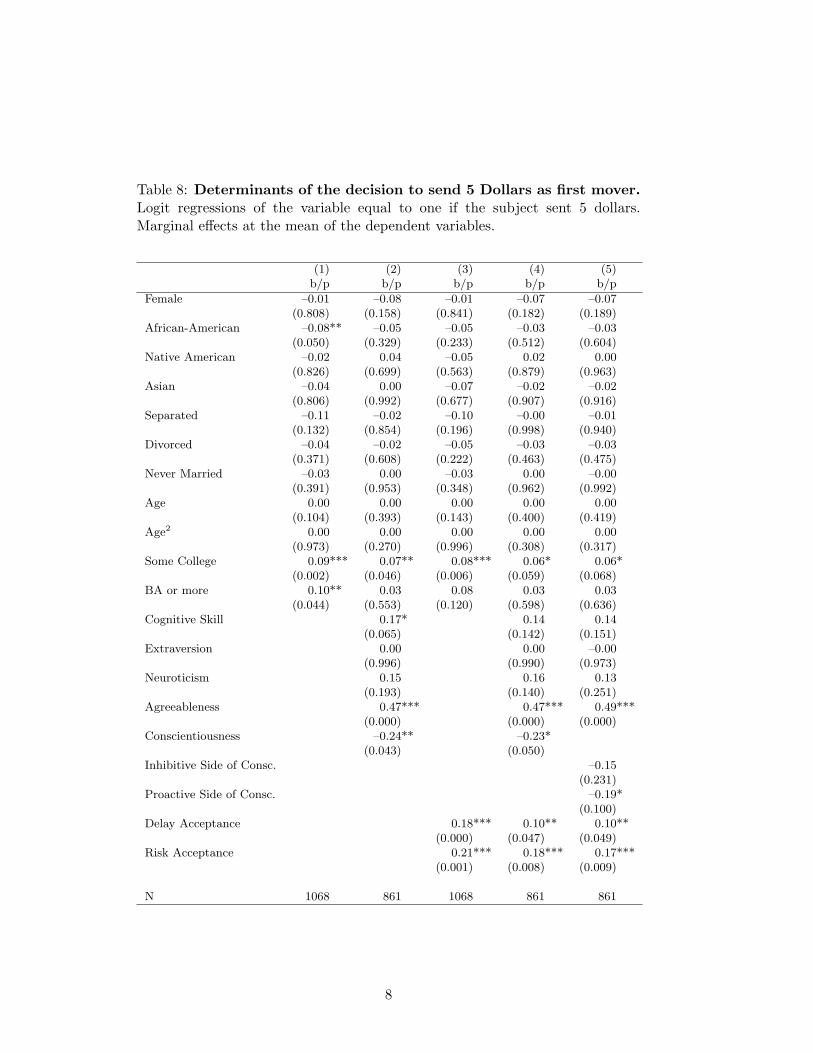
Table 8: Determinants of the decision to send 5 Dollars as first mover.Logit regressions of the variable equal to one if the subject sent 5 dollars.Marginal effects at the mean of the dependent variables.
(1) (2) (3) (4) (5)b/p b/p b/p b/p b/p
Female –0.01 –0.08 –0.01 –0.07 –0.07(0.808) (0.158) (0.841) (0.182) (0.189)
African-American –0.08** –0.05 –0.05 –0.03 –0.03(0.050) (0.329) (0.233) (0.512) (0.604)
Native American –0.02 0.04 –0.05 0.02 0.00(0.826) (0.699) (0.563) (0.879) (0.963)
Asian –0.04 0.00 –0.07 –0.02 –0.02(0.806) (0.992) (0.677) (0.907) (0.916)
Separated –0.11 –0.02 –0.10 –0.00 –0.01(0.132) (0.854) (0.196) (0.998) (0.940)
Divorced –0.04 –0.02 –0.05 –0.03 –0.03(0.371) (0.608) (0.222) (0.463) (0.475)
Never Married –0.03 0.00 –0.03 0.00 –0.00(0.391) (0.953) (0.348) (0.962) (0.992)
Age 0.00 0.00 0.00 0.00 0.00(0.104) (0.393) (0.143) (0.400) (0.419)
Age2 0.00 0.00 0.00 0.00 0.00(0.973) (0.270) (0.996) (0.308) (0.317)
Some College 0.09*** 0.07** 0.08*** 0.06* 0.06*(0.002) (0.046) (0.006) (0.059) (0.068)
BA or more 0.10** 0.03 0.08 0.03 0.03(0.044) (0.553) (0.120) (0.598) (0.636)
Cognitive Skill 0.17* 0.14 0.14(0.065) (0.142) (0.151)
Extraversion 0.00 0.00 –0.00(0.996) (0.990) (0.973)
Neuroticism 0.15 0.16 0.13(0.193) (0.140) (0.251)
Agreeableness 0.47*** 0.47*** 0.49***(0.000) (0.000) (0.000)
Conscientiousness –0.24** –0.23*(0.043) (0.050)
Inhibitive Side of Consc. –0.15(0.231)
Proactive Side of Consc. –0.19*(0.100)
Delay Acceptance 0.18*** 0.10** 0.10**(0.000) (0.047) (0.049)
Risk Acceptance 0.21*** 0.18*** 0.17***(0.001) (0.008) (0.009)
N 1068 861 1068 861 861
8
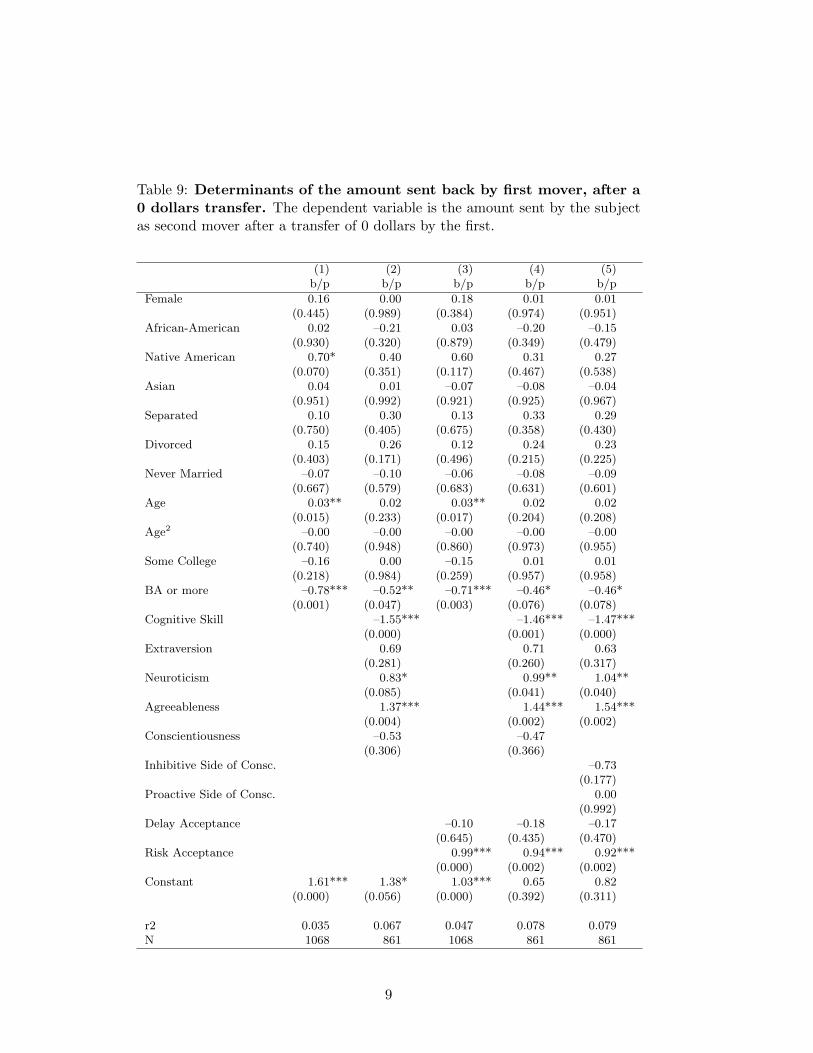
Table 9: Determinants of the amount sent back by first mover, after a0 dollars transfer. The dependent variable is the amount sent by the subjectas second mover after a transfer of 0 dollars by the first.
(1) (2) (3) (4) (5)b/p b/p b/p b/p b/p
Female 0.16 0.00 0.18 0.01 0.01(0.445) (0.989) (0.384) (0.974) (0.951)
African-American 0.02 –0.21 0.03 –0.20 –0.15(0.930) (0.320) (0.879) (0.349) (0.479)
Native American 0.70* 0.40 0.60 0.31 0.27(0.070) (0.351) (0.117) (0.467) (0.538)
Asian 0.04 0.01 –0.07 –0.08 –0.04(0.951) (0.992) (0.921) (0.925) (0.967)
Separated 0.10 0.30 0.13 0.33 0.29(0.750) (0.405) (0.675) (0.358) (0.430)
Divorced 0.15 0.26 0.12 0.24 0.23(0.403) (0.171) (0.496) (0.215) (0.225)
Never Married –0.07 –0.10 –0.06 –0.08 –0.09(0.667) (0.579) (0.683) (0.631) (0.601)
Age 0.03** 0.02 0.03** 0.02 0.02(0.015) (0.233) (0.017) (0.204) (0.208)
Age2 –0.00 –0.00 –0.00 –0.00 –0.00(0.740) (0.948) (0.860) (0.973) (0.955)
Some College –0.16 0.00 –0.15 0.01 0.01(0.218) (0.984) (0.259) (0.957) (0.958)
BA or more –0.78*** –0.52** –0.71*** –0.46* –0.46*(0.001) (0.047) (0.003) (0.076) (0.078)
Cognitive Skill –1.55*** –1.46*** –1.47***(0.000) (0.001) (0.000)
Extraversion 0.69 0.71 0.63(0.281) (0.260) (0.317)
Neuroticism 0.83* 0.99** 1.04**(0.085) (0.041) (0.040)
Agreeableness 1.37*** 1.44*** 1.54***(0.004) (0.002) (0.002)
Conscientiousness –0.53 –0.47(0.306) (0.366)
Inhibitive Side of Consc. –0.73(0.177)
Proactive Side of Consc. 0.00(0.992)
Delay Acceptance –0.10 –0.18 –0.17(0.645) (0.435) (0.470)
Risk Acceptance 0.99*** 0.94*** 0.92***(0.000) (0.002) (0.002)
Constant 1.61*** 1.38* 1.03*** 0.65 0.82(0.000) (0.056) (0.000) (0.392) (0.311)
r2 0.035 0.067 0.047 0.078 0.079N 1068 861 1068 861 861
9
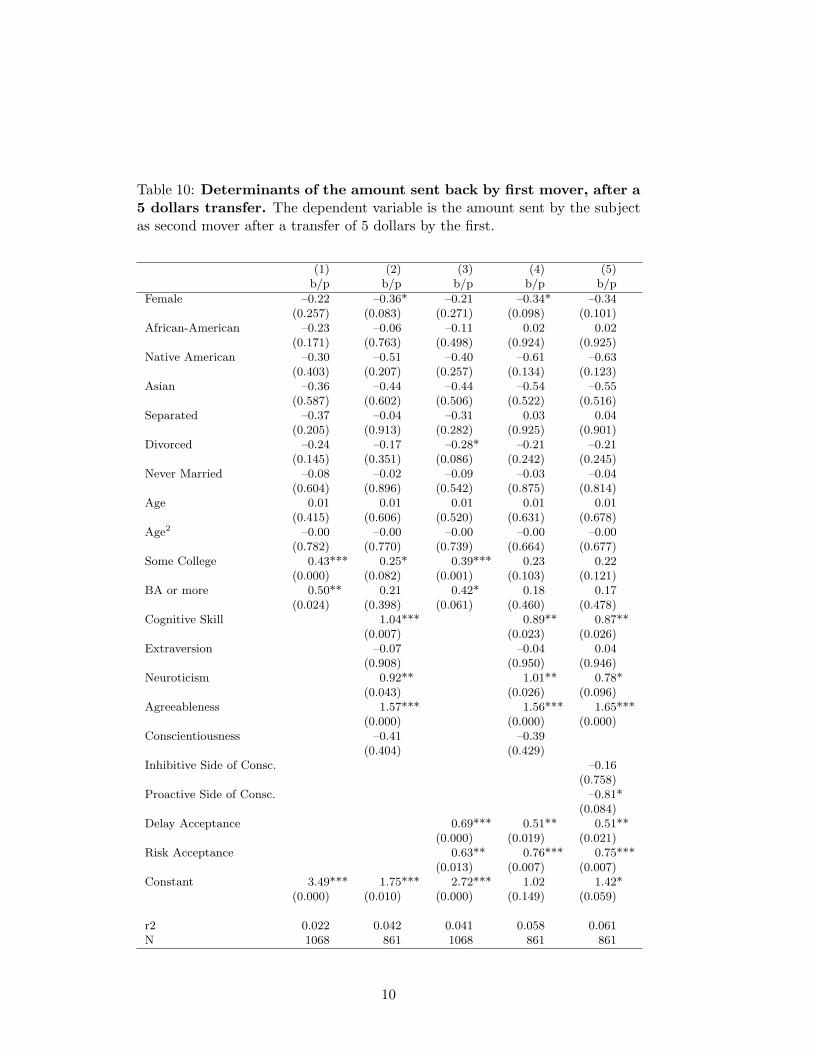
Table 10: Determinants of the amount sent back by first mover, after a5 dollars transfer. The dependent variable is the amount sent by the subjectas second mover after a transfer of 5 dollars by the first.
(1) (2) (3) (4) (5)b/p b/p b/p b/p b/p
Female –0.22 –0.36* –0.21 –0.34* –0.34(0.257) (0.083) (0.271) (0.098) (0.101)
African-American –0.23 –0.06 –0.11 0.02 0.02(0.171) (0.763) (0.498) (0.924) (0.925)
Native American –0.30 –0.51 –0.40 –0.61 –0.63(0.403) (0.207) (0.257) (0.134) (0.123)
Asian –0.36 –0.44 –0.44 –0.54 –0.55(0.587) (0.602) (0.506) (0.522) (0.516)
Separated –0.37 –0.04 –0.31 0.03 0.04(0.205) (0.913) (0.282) (0.925) (0.901)
Divorced –0.24 –0.17 –0.28* –0.21 –0.21(0.145) (0.351) (0.086) (0.242) (0.245)
Never Married –0.08 –0.02 –0.09 –0.03 –0.04(0.604) (0.896) (0.542) (0.875) (0.814)
Age 0.01 0.01 0.01 0.01 0.01(0.415) (0.606) (0.520) (0.631) (0.678)
Age2 –0.00 –0.00 –0.00 –0.00 –0.00(0.782) (0.770) (0.739) (0.664) (0.677)
Some College 0.43*** 0.25* 0.39*** 0.23 0.22(0.000) (0.082) (0.001) (0.103) (0.121)
BA or more 0.50** 0.21 0.42* 0.18 0.17(0.024) (0.398) (0.061) (0.460) (0.478)
Cognitive Skill 1.04*** 0.89** 0.87**(0.007) (0.023) (0.026)
Extraversion –0.07 –0.04 0.04(0.908) (0.950) (0.946)
Neuroticism 0.92** 1.01** 0.78*(0.043) (0.026) (0.096)
Agreeableness 1.57*** 1.56*** 1.65***(0.000) (0.000) (0.000)
Conscientiousness –0.41 –0.39(0.404) (0.429)
Inhibitive Side of Consc. –0.16(0.758)
Proactive Side of Consc. –0.81*(0.084)
Delay Acceptance 0.69*** 0.51** 0.51**(0.000) (0.019) (0.021)
Risk Acceptance 0.63** 0.76*** 0.75***(0.013) (0.007) (0.007)
Constant 3.49*** 1.75*** 2.72*** 1.02 1.42*(0.000) (0.010) (0.000) (0.149) (0.059)
r2 0.022 0.042 0.041 0.058 0.061N 1068 861 1068 861 861
10
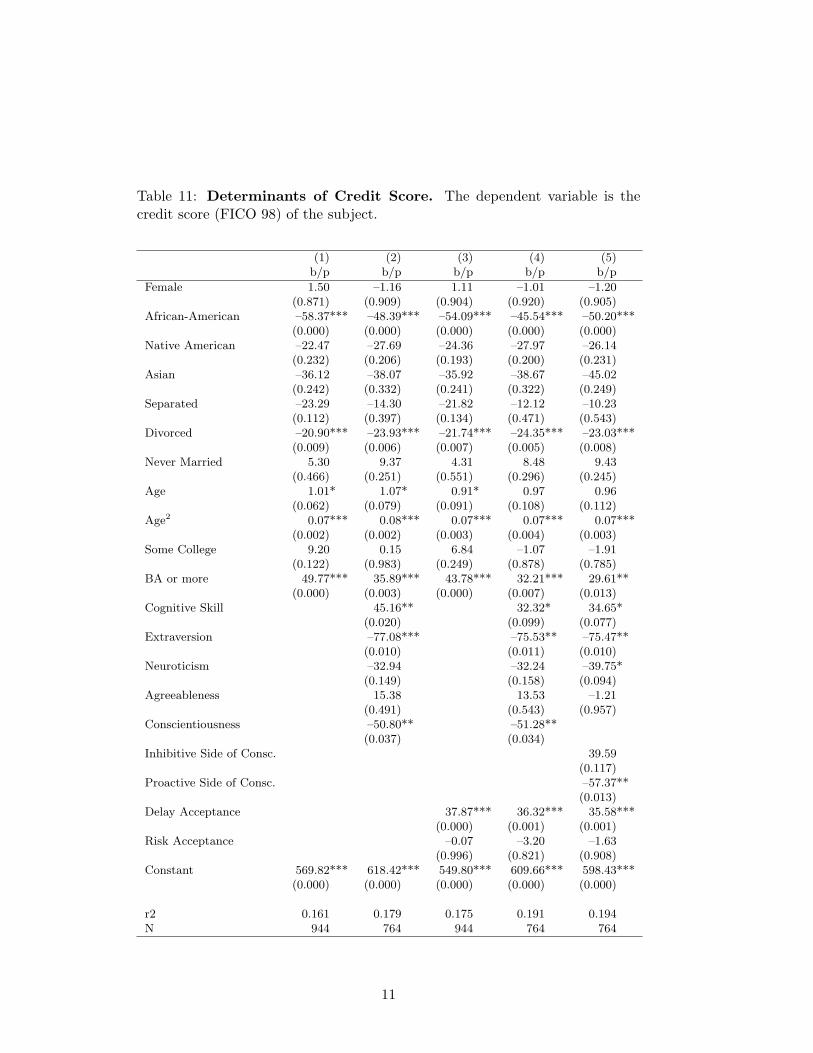
Table 11: Determinants of Credit Score. The dependent variable is thecredit score (FICO 98) of the subject.
(1) (2) (3) (4) (5)b/p b/p b/p b/p b/p
Female 1.50 –1.16 1.11 –1.01 –1.20(0.871) (0.909) (0.904) (0.920) (0.905)
African-American –58.37*** –48.39*** –54.09*** –45.54*** –50.20***(0.000) (0.000) (0.000) (0.000) (0.000)
Native American –22.47 –27.69 –24.36 –27.97 –26.14(0.232) (0.206) (0.193) (0.200) (0.231)
Asian –36.12 –38.07 –35.92 –38.67 –45.02(0.242) (0.332) (0.241) (0.322) (0.249)
Separated –23.29 –14.30 –21.82 –12.12 –10.23(0.112) (0.397) (0.134) (0.471) (0.543)
Divorced –20.90*** –23.93*** –21.74*** –24.35*** –23.03***(0.009) (0.006) (0.007) (0.005) (0.008)
Never Married 5.30 9.37 4.31 8.48 9.43(0.466) (0.251) (0.551) (0.296) (0.245)
Age 1.01* 1.07* 0.91* 0.97 0.96(0.062) (0.079) (0.091) (0.108) (0.112)
Age2 0.07*** 0.08*** 0.07*** 0.07*** 0.07***(0.002) (0.002) (0.003) (0.004) (0.003)
Some College 9.20 0.15 6.84 –1.07 –1.91(0.122) (0.983) (0.249) (0.878) (0.785)
BA or more 49.77*** 35.89*** 43.78*** 32.21*** 29.61**(0.000) (0.003) (0.000) (0.007) (0.013)
Cognitive Skill 45.16** 32.32* 34.65*(0.020) (0.099) (0.077)
Extraversion –77.08*** –75.53** –75.47**(0.010) (0.011) (0.010)
Neuroticism –32.94 –32.24 –39.75*(0.149) (0.158) (0.094)
Agreeableness 15.38 13.53 –1.21(0.491) (0.543) (0.957)
Conscientiousness –50.80** –51.28**(0.037) (0.034)
Inhibitive Side of Consc. 39.59(0.117)
Proactive Side of Consc. –57.37**(0.013)
Delay Acceptance 37.87*** 36.32*** 35.58***(0.000) (0.001) (0.001)
Risk Acceptance –0.07 –3.20 –1.63(0.996) (0.821) (0.908)
Constant 569.82*** 618.42*** 549.80*** 609.66*** 598.43***(0.000) (0.000) (0.000) (0.000) (0.000)
r2 0.161 0.179 0.175 0.191 0.194N 944 764 944 764 764
11
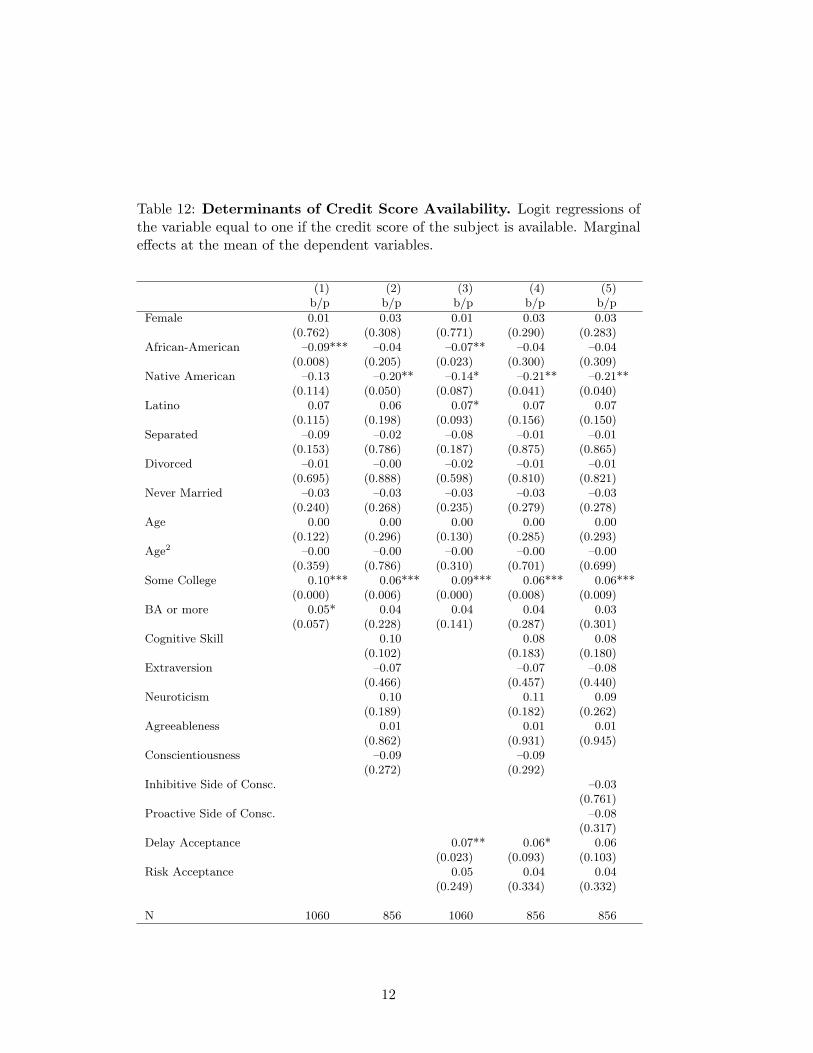
Table 12: Determinants of Credit Score Availability. Logit regressions ofthe variable equal to one if the credit score of the subject is available. Marginaleffects at the mean of the dependent variables.
(1) (2) (3) (4) (5)b/p b/p b/p b/p b/p
Female 0.01 0.03 0.01 0.03 0.03(0.762) (0.308) (0.771) (0.290) (0.283)
African-American –0.09*** –0.04 –0.07** –0.04 –0.04(0.008) (0.205) (0.023) (0.300) (0.309)
Native American –0.13 –0.20** –0.14* –0.21** –0.21**(0.114) (0.050) (0.087) (0.041) (0.040)
Latino 0.07 0.06 0.07* 0.07 0.07(0.115) (0.198) (0.093) (0.156) (0.150)
Separated –0.09 –0.02 –0.08 –0.01 –0.01(0.153) (0.786) (0.187) (0.875) (0.865)
Divorced –0.01 –0.00 –0.02 –0.01 –0.01(0.695) (0.888) (0.598) (0.810) (0.821)
Never Married –0.03 –0.03 –0.03 –0.03 –0.03(0.240) (0.268) (0.235) (0.279) (0.278)
Age 0.00 0.00 0.00 0.00 0.00(0.122) (0.296) (0.130) (0.285) (0.293)
Age2 –0.00 –0.00 –0.00 –0.00 –0.00(0.359) (0.786) (0.310) (0.701) (0.699)
Some College 0.10*** 0.06*** 0.09*** 0.06*** 0.06***(0.000) (0.006) (0.000) (0.008) (0.009)
BA or more 0.05* 0.04 0.04 0.04 0.03(0.057) (0.228) (0.141) (0.287) (0.301)
Cognitive Skill 0.10 0.08 0.08(0.102) (0.183) (0.180)
Extraversion –0.07 –0.07 –0.08(0.466) (0.457) (0.440)
Neuroticism 0.10 0.11 0.09(0.189) (0.182) (0.262)
Agreeableness 0.01 0.01 0.01(0.862) (0.931) (0.945)
Conscientiousness –0.09 –0.09(0.272) (0.292)
Inhibitive Side of Consc. –0.03(0.761)
Proactive Side of Consc. –0.08(0.317)
Delay Acceptance 0.07** 0.06* 0.06(0.023) (0.093) (0.103)
Risk Acceptance 0.05 0.04 0.04(0.249) (0.334) (0.332)
N 1060 856 1060 856 856
12

Table 13: Determinants of Training Exits from the Company. TrainingExits includes all those that did not complete basic training, for any choice-basedreason, by either firm or trainee.
(1) (2) (3) (4) (5)b/p b/p b/p b/p b/p
Female 1.38 1.29 1.39 1.28 1.28(0.234) (0.421) (0.225) (0.434) (0.429)
African-American 3.33*** 2.91*** 3.20*** 2.84*** 2.66***(0.000) (0.000) (0.000) (0.000) (0.000)
Native American 0.95 0.93 0.97 0.96 1.09(0.927) (0.922) (0.960) (0.953) (0.909)
Asian 3.74* 7.19** 3.91* 7.41** 6.66**(0.077) (0.012) (0.067) (0.011) (0.015)
Latino 1.26 1.81 1.25 1.79 1.80(0.750) (0.425) (0.761) (0.433) (0.427)
Separated 1.11 0.81 1.10 0.78 0.80(0.806) (0.731) (0.830) (0.690) (0.720)
Divorced 1.10 0.99 1.11 1.00 1.01(0.718) (0.961) (0.681) (0.994) (0.977)
Never Married 1.57* 1.40 1.57* 1.38 1.41(0.066) (0.227) (0.066) (0.250) (0.219)
Age 1.11* 1.06 1.11 1.06 1.07(0.098) (0.334) (0.105) (0.370) (0.302)
Age2 1.00 1.00 1.00 1.00 1.00(0.383) (0.759) (0.408) (0.813) (0.730)
Some College 0.96 1.11 0.98 1.14 1.14(0.847) (0.676) (0.923) (0.597) (0.591)
BA or more 1.04 1.32 1.08 1.34 1.32(0.910) (0.503) (0.837) (0.477) (0.510)
Cognitive Skill 0.21*** 0.21** 0.21**(0.010) (0.013) (0.014)
Extraversion 1.84 1.80 2.17(0.560) (0.575) (0.464)
Neuroticism 6.45** 6.04** 4.17*(0.012) (0.016) (0.072)
Agreeableness 1.63 1.59 1.25(0.536) (0.555) (0.781)
Conscientiousness 0.75 0.75(0.711) (0.709)
Inhibitive Side of Consc. 3.54(0.155)
Proactive Side of Consc. 0.24*(0.066)
Delay Acceptance 0.80 0.91 0.89(0.478) (0.811) (0.752)
Risk Acceptance 0.83 0.69 0.71(0.657) (0.427) (0.458)
N 1065 859 1065 859 859
13
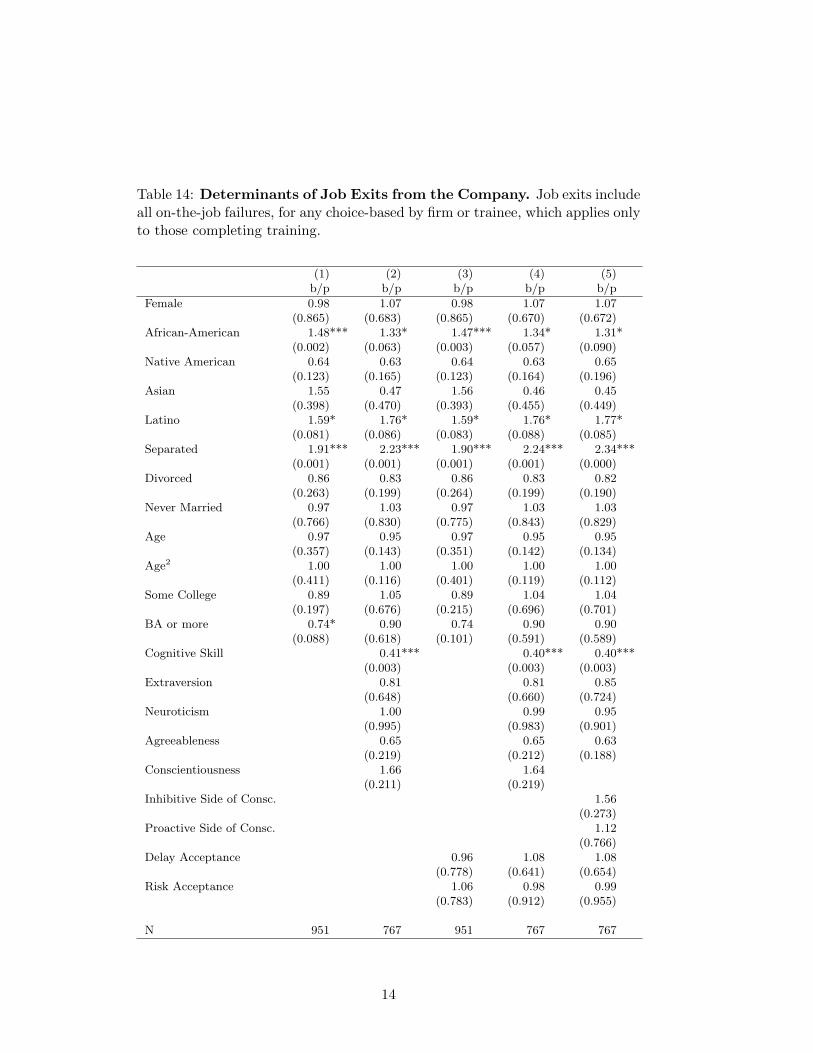
Table 14: Determinants of Job Exits from the Company. Job exits includeall on-the-job failures, for any choice-based by firm or trainee, which applies onlyto those completing training.
(1) (2) (3) (4) (5)b/p b/p b/p b/p b/p
Female 0.98 1.07 0.98 1.07 1.07(0.865) (0.683) (0.865) (0.670) (0.672)
African-American 1.48*** 1.33* 1.47*** 1.34* 1.31*(0.002) (0.063) (0.003) (0.057) (0.090)
Native American 0.64 0.63 0.64 0.63 0.65(0.123) (0.165) (0.123) (0.164) (0.196)
Asian 1.55 0.47 1.56 0.46 0.45(0.398) (0.470) (0.393) (0.455) (0.449)
Latino 1.59* 1.76* 1.59* 1.76* 1.77*(0.081) (0.086) (0.083) (0.088) (0.085)
Separated 1.91*** 2.23*** 1.90*** 2.24*** 2.34***(0.001) (0.001) (0.001) (0.001) (0.000)
Divorced 0.86 0.83 0.86 0.83 0.82(0.263) (0.199) (0.264) (0.199) (0.190)
Never Married 0.97 1.03 0.97 1.03 1.03(0.766) (0.830) (0.775) (0.843) (0.829)
Age 0.97 0.95 0.97 0.95 0.95(0.357) (0.143) (0.351) (0.142) (0.134)
Age2 1.00 1.00 1.00 1.00 1.00(0.411) (0.116) (0.401) (0.119) (0.112)
Some College 0.89 1.05 0.89 1.04 1.04(0.197) (0.676) (0.215) (0.696) (0.701)
BA or more 0.74* 0.90 0.74 0.90 0.90(0.088) (0.618) (0.101) (0.591) (0.589)
Cognitive Skill 0.41*** 0.40*** 0.40***(0.003) (0.003) (0.003)
Extraversion 0.81 0.81 0.85(0.648) (0.660) (0.724)
Neuroticism 1.00 0.99 0.95(0.995) (0.983) (0.901)
Agreeableness 0.65 0.65 0.63(0.219) (0.212) (0.188)
Conscientiousness 1.66 1.64(0.211) (0.219)
Inhibitive Side of Consc. 1.56(0.273)
Proactive Side of Consc. 1.12(0.766)
Delay Acceptance 0.96 1.08 1.08(0.778) (0.641) (0.654)
Risk Acceptance 1.06 0.98 0.99(0.783) (0.912) (0.955)
N 951 767 951 767 767
14
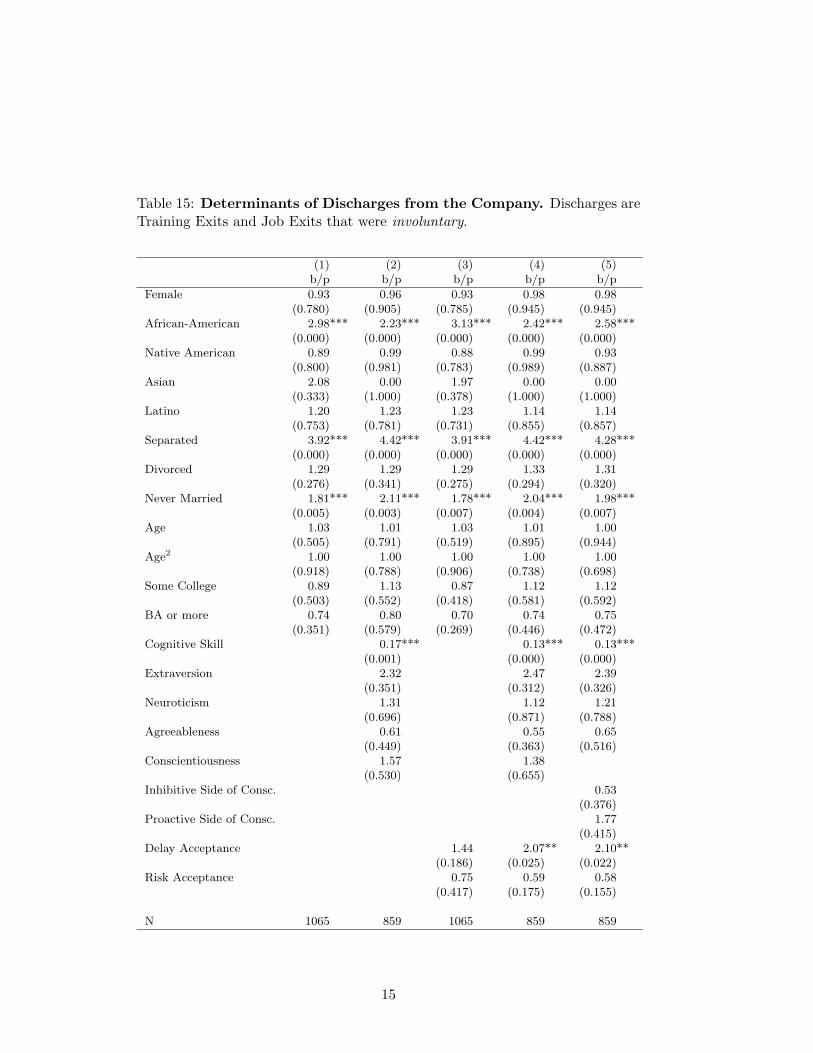
Table 15: Determinants of Discharges from the Company. Discharges areTraining Exits and Job Exits that were involuntary.
(1) (2) (3) (4) (5)b/p b/p b/p b/p b/p
Female 0.93 0.96 0.93 0.98 0.98(0.780) (0.905) (0.785) (0.945) (0.945)
African-American 2.98*** 2.23*** 3.13*** 2.42*** 2.58***(0.000) (0.000) (0.000) (0.000) (0.000)
Native American 0.89 0.99 0.88 0.99 0.93(0.800) (0.981) (0.783) (0.989) (0.887)
Asian 2.08 0.00 1.97 0.00 0.00(0.333) (1.000) (0.378) (1.000) (1.000)
Latino 1.20 1.23 1.23 1.14 1.14(0.753) (0.781) (0.731) (0.855) (0.857)
Separated 3.92*** 4.42*** 3.91*** 4.42*** 4.28***(0.000) (0.000) (0.000) (0.000) (0.000)
Divorced 1.29 1.29 1.29 1.33 1.31(0.276) (0.341) (0.275) (0.294) (0.320)
Never Married 1.81*** 2.11*** 1.78*** 2.04*** 1.98***(0.005) (0.003) (0.007) (0.004) (0.007)
Age 1.03 1.01 1.03 1.01 1.00(0.505) (0.791) (0.519) (0.895) (0.944)
Age2 1.00 1.00 1.00 1.00 1.00(0.918) (0.788) (0.906) (0.738) (0.698)
Some College 0.89 1.13 0.87 1.12 1.12(0.503) (0.552) (0.418) (0.581) (0.592)
BA or more 0.74 0.80 0.70 0.74 0.75(0.351) (0.579) (0.269) (0.446) (0.472)
Cognitive Skill 0.17*** 0.13*** 0.13***(0.001) (0.000) (0.000)
Extraversion 2.32 2.47 2.39(0.351) (0.312) (0.326)
Neuroticism 1.31 1.12 1.21(0.696) (0.871) (0.788)
Agreeableness 0.61 0.55 0.65(0.449) (0.363) (0.516)
Conscientiousness 1.57 1.38(0.530) (0.655)
Inhibitive Side of Consc. 0.53(0.376)
Proactive Side of Consc. 1.77(0.415)
Delay Acceptance 1.44 2.07** 2.10**(0.186) (0.025) (0.022)
Risk Acceptance 0.75 0.59 0.58(0.417) (0.175) (0.155)
N 1065 859 1065 859 859
15
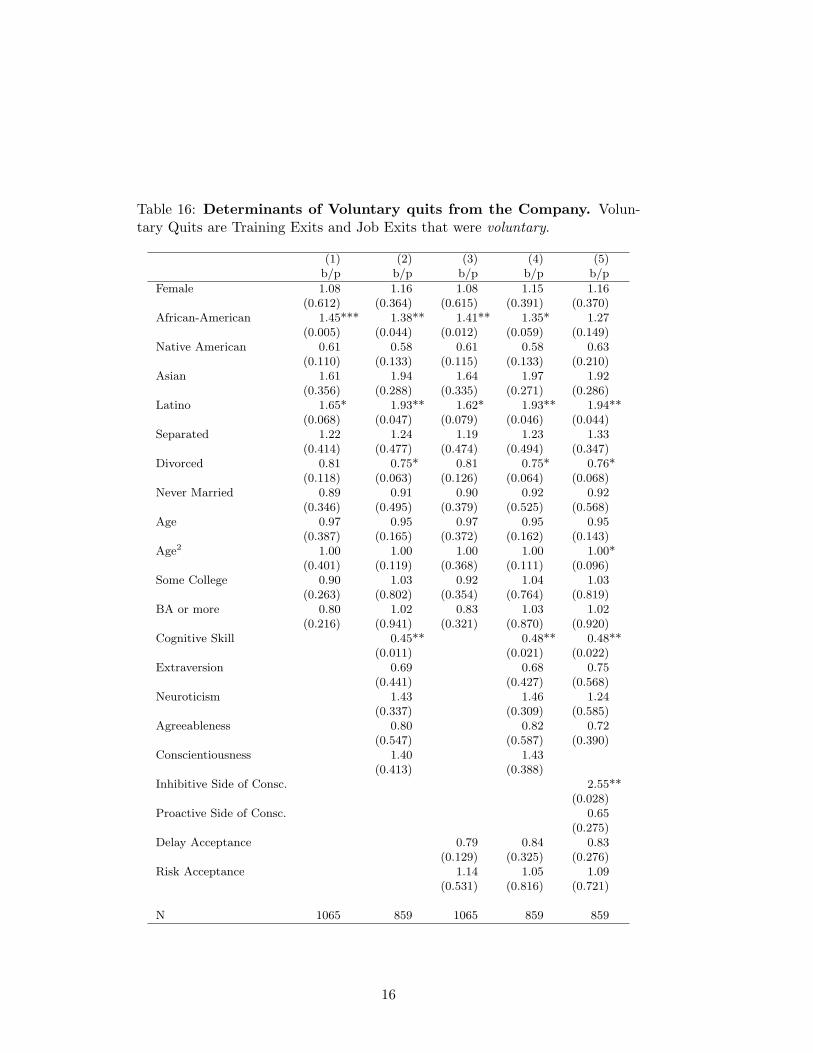
Table 16: Determinants of Voluntary quits from the Company. Volun-tary Quits are Training Exits and Job Exits that were voluntary.
(1) (2) (3) (4) (5)b/p b/p b/p b/p b/p
Female 1.08 1.16 1.08 1.15 1.16(0.612) (0.364) (0.615) (0.391) (0.370)
African-American 1.45*** 1.38** 1.41** 1.35* 1.27(0.005) (0.044) (0.012) (0.059) (0.149)
Native American 0.61 0.58 0.61 0.58 0.63(0.110) (0.133) (0.115) (0.133) (0.210)
Asian 1.61 1.94 1.64 1.97 1.92(0.356) (0.288) (0.335) (0.271) (0.286)
Latino 1.65* 1.93** 1.62* 1.93** 1.94**(0.068) (0.047) (0.079) (0.046) (0.044)
Separated 1.22 1.24 1.19 1.23 1.33(0.414) (0.477) (0.474) (0.494) (0.347)
Divorced 0.81 0.75* 0.81 0.75* 0.76*(0.118) (0.063) (0.126) (0.064) (0.068)
Never Married 0.89 0.91 0.90 0.92 0.92(0.346) (0.495) (0.379) (0.525) (0.568)
Age 0.97 0.95 0.97 0.95 0.95(0.387) (0.165) (0.372) (0.162) (0.143)
Age2 1.00 1.00 1.00 1.00 1.00*(0.401) (0.119) (0.368) (0.111) (0.096)
Some College 0.90 1.03 0.92 1.04 1.03(0.263) (0.802) (0.354) (0.764) (0.819)
BA or more 0.80 1.02 0.83 1.03 1.02(0.216) (0.941) (0.321) (0.870) (0.920)
Cognitive Skill 0.45** 0.48** 0.48**(0.011) (0.021) (0.022)
Extraversion 0.69 0.68 0.75(0.441) (0.427) (0.568)
Neuroticism 1.43 1.46 1.24(0.337) (0.309) (0.585)
Agreeableness 0.80 0.82 0.72(0.547) (0.587) (0.390)
Conscientiousness 1.40 1.43(0.413) (0.388)
Inhibitive Side of Consc. 2.55**(0.028)
Proactive Side of Consc. 0.65(0.275)
Delay Acceptance 0.79 0.84 0.83(0.129) (0.325) (0.276)
Risk Acceptance 1.14 1.05 1.09(0.531) (0.816) (0.721)
N 1065 859 1065 859 859
16
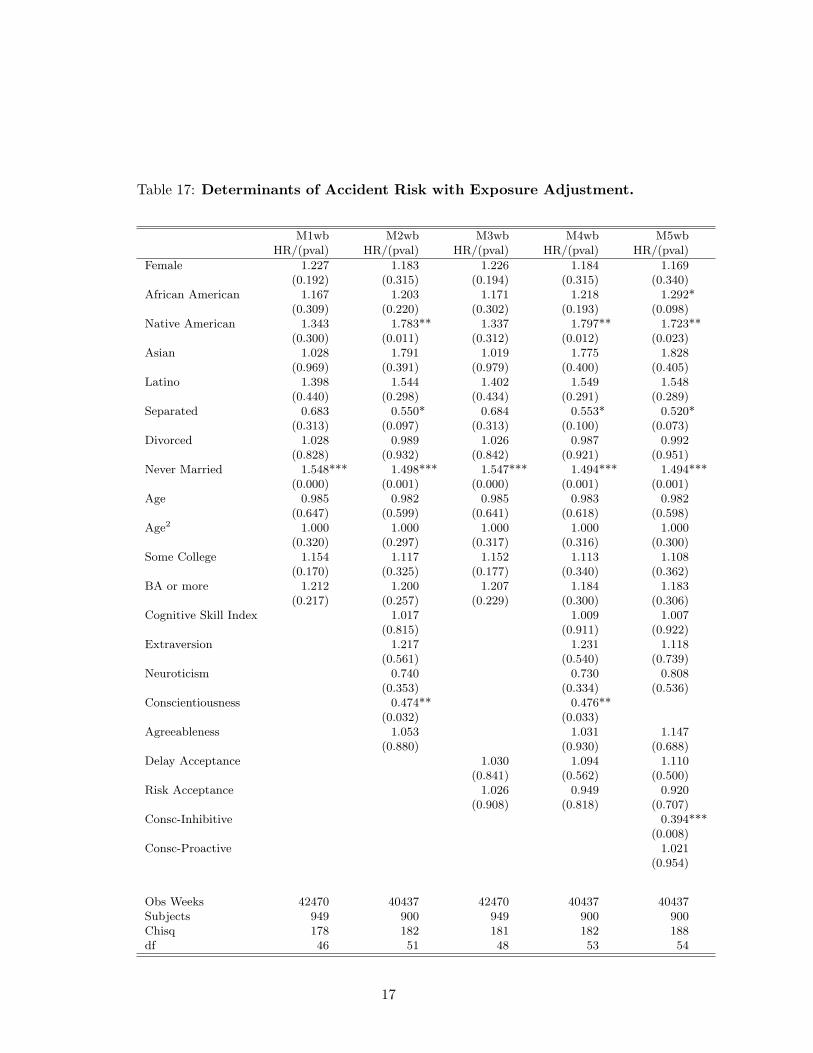
Table 17: Determinants of Accident Risk with Exposure Adjustment.
M1wb M2wb M3wb M4wb M5wbHR/(pval) HR/(pval) HR/(pval) HR/(pval) HR/(pval)
Female 1.227 1.183 1.226 1.184 1.169(0.192) (0.315) (0.194) (0.315) (0.340)
African American 1.167 1.203 1.171 1.218 1.292*(0.309) (0.220) (0.302) (0.193) (0.098)
Native American 1.343 1.783** 1.337 1.797** 1.723**(0.300) (0.011) (0.312) (0.012) (0.023)
Asian 1.028 1.791 1.019 1.775 1.828(0.969) (0.391) (0.979) (0.400) (0.405)
Latino 1.398 1.544 1.402 1.549 1.548(0.440) (0.298) (0.434) (0.291) (0.289)
Separated 0.683 0.550* 0.684 0.553* 0.520*(0.313) (0.097) (0.313) (0.100) (0.073)
Divorced 1.028 0.989 1.026 0.987 0.992(0.828) (0.932) (0.842) (0.921) (0.951)
Never Married 1.548*** 1.498*** 1.547*** 1.494*** 1.494***(0.000) (0.001) (0.000) (0.001) (0.001)
Age 0.985 0.982 0.985 0.983 0.982(0.647) (0.599) (0.641) (0.618) (0.598)
Age2 1.000 1.000 1.000 1.000 1.000(0.320) (0.297) (0.317) (0.316) (0.300)
Some College 1.154 1.117 1.152 1.113 1.108(0.170) (0.325) (0.177) (0.340) (0.362)
BA or more 1.212 1.200 1.207 1.184 1.183(0.217) (0.257) (0.229) (0.300) (0.306)
Cognitive Skill Index 1.017 1.009 1.007(0.815) (0.911) (0.922)
Extraversion 1.217 1.231 1.118(0.561) (0.540) (0.739)
Neuroticism 0.740 0.730 0.808(0.353) (0.334) (0.536)
Conscientiousness 0.474** 0.476**(0.032) (0.033)
Agreeableness 1.053 1.031 1.147(0.880) (0.930) (0.688)
Delay Acceptance 1.030 1.094 1.110(0.841) (0.562) (0.500)
Risk Acceptance 1.026 0.949 0.920(0.908) (0.818) (0.707)
Consc-Inhibitive 0.394***(0.008)
Consc-Proactive 1.021(0.954)
Obs Weeks 42470 40437 42470 40437 40437Subjects 949 900 949 900 900Chisq 178 182 181 182 188df 46 51 48 53 54
17
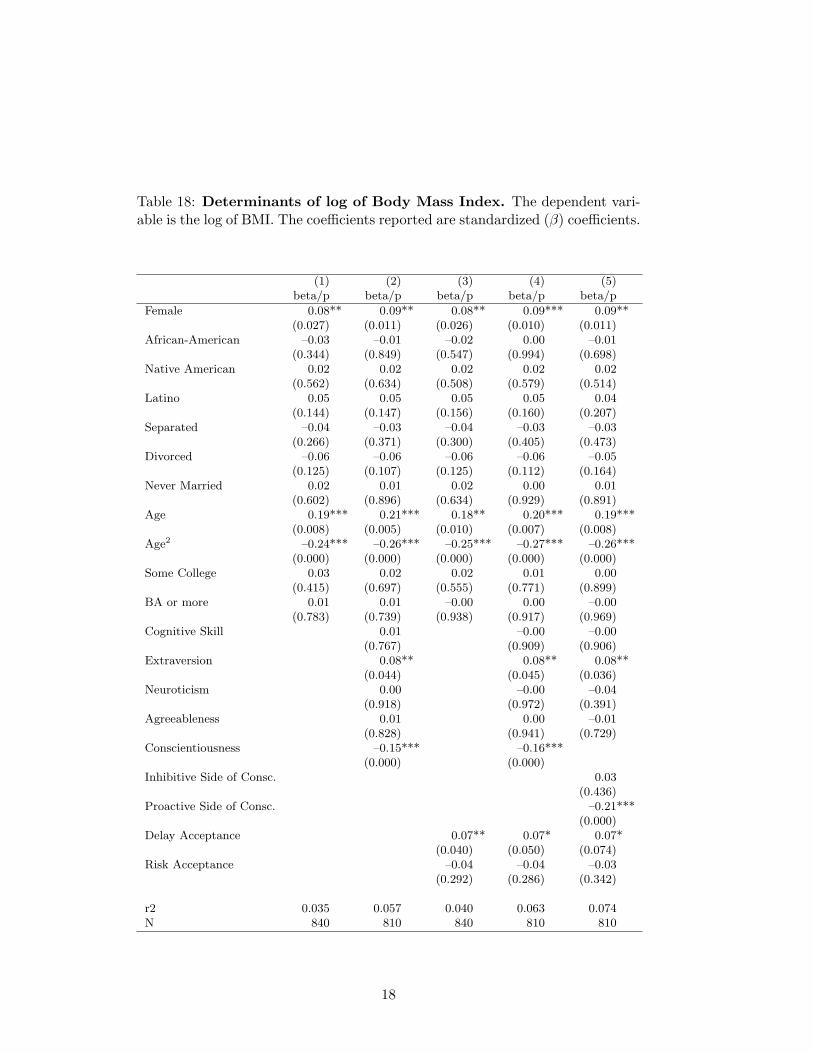
Table 18: Determinants of log of Body Mass Index. The dependent vari-able is the log of BMI. The coefficients reported are standardized (β) coefficients.
(1) (2) (3) (4) (5)beta/p beta/p beta/p beta/p beta/p
Female 0.08** 0.09** 0.08** 0.09*** 0.09**(0.027) (0.011) (0.026) (0.010) (0.011)
African-American –0.03 –0.01 –0.02 0.00 –0.01(0.344) (0.849) (0.547) (0.994) (0.698)
Native American 0.02 0.02 0.02 0.02 0.02(0.562) (0.634) (0.508) (0.579) (0.514)
Latino 0.05 0.05 0.05 0.05 0.04(0.144) (0.147) (0.156) (0.160) (0.207)
Separated –0.04 –0.03 –0.04 –0.03 –0.03(0.266) (0.371) (0.300) (0.405) (0.473)
Divorced –0.06 –0.06 –0.06 –0.06 –0.05(0.125) (0.107) (0.125) (0.112) (0.164)
Never Married 0.02 0.01 0.02 0.00 0.01(0.602) (0.896) (0.634) (0.929) (0.891)
Age 0.19*** 0.21*** 0.18** 0.20*** 0.19***(0.008) (0.005) (0.010) (0.007) (0.008)
Age2 –0.24*** –0.26*** –0.25*** –0.27*** –0.26***(0.000) (0.000) (0.000) (0.000) (0.000)
Some College 0.03 0.02 0.02 0.01 0.00(0.415) (0.697) (0.555) (0.771) (0.899)
BA or more 0.01 0.01 –0.00 0.00 –0.00(0.783) (0.739) (0.938) (0.917) (0.969)
Cognitive Skill 0.01 –0.00 –0.00(0.767) (0.909) (0.906)
Extraversion 0.08** 0.08** 0.08**(0.044) (0.045) (0.036)
Neuroticism 0.00 –0.00 –0.04(0.918) (0.972) (0.391)
Agreeableness 0.01 0.00 –0.01(0.828) (0.941) (0.729)
Conscientiousness –0.15*** –0.16***(0.000) (0.000)
Inhibitive Side of Consc. 0.03(0.436)
Proactive Side of Consc. –0.21***(0.000)
Delay Acceptance 0.07** 0.07* 0.07*(0.040) (0.050) (0.074)
Risk Acceptance –0.04 –0.04 –0.03(0.292) (0.286) (0.342)
r2 0.035 0.057 0.040 0.063 0.074N 840 810 840 810 810
18
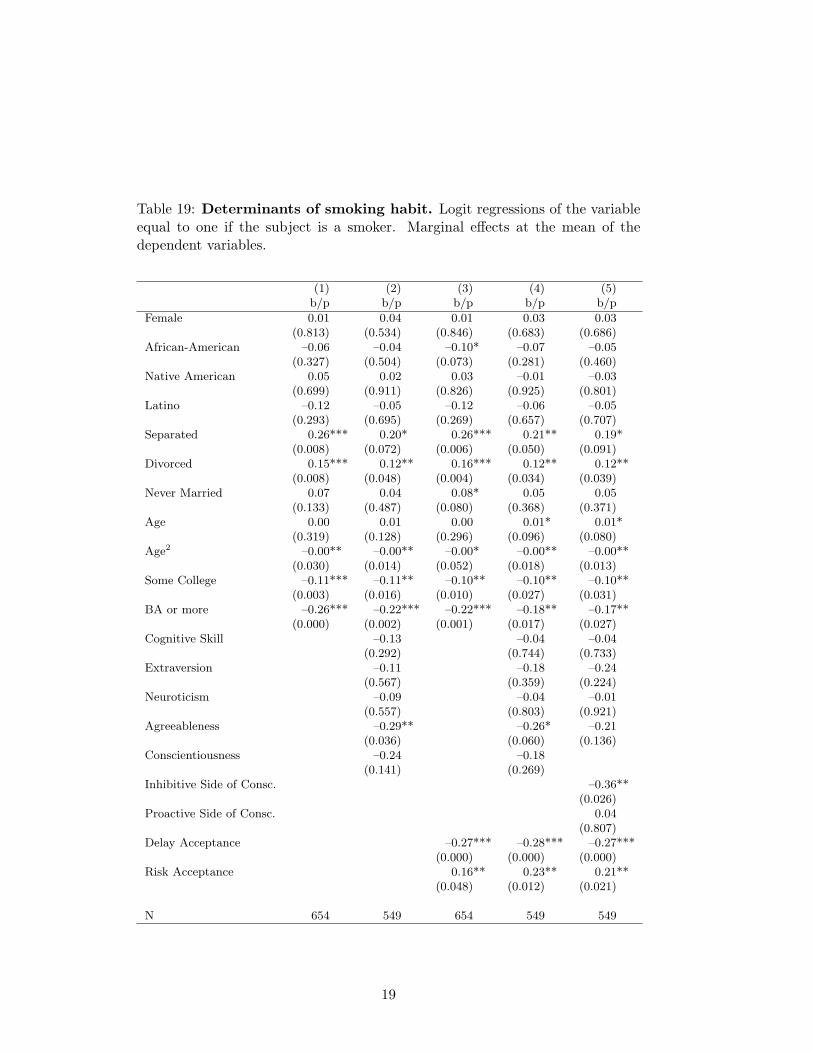
Table 19: Determinants of smoking habit. Logit regressions of the variableequal to one if the subject is a smoker. Marginal effects at the mean of thedependent variables.
(1) (2) (3) (4) (5)b/p b/p b/p b/p b/p
Female 0.01 0.04 0.01 0.03 0.03(0.813) (0.534) (0.846) (0.683) (0.686)
African-American –0.06 –0.04 –0.10* –0.07 –0.05(0.327) (0.504) (0.073) (0.281) (0.460)
Native American 0.05 0.02 0.03 –0.01 –0.03(0.699) (0.911) (0.826) (0.925) (0.801)
Latino –0.12 –0.05 –0.12 –0.06 –0.05(0.293) (0.695) (0.269) (0.657) (0.707)
Separated 0.26*** 0.20* 0.26*** 0.21** 0.19*(0.008) (0.072) (0.006) (0.050) (0.091)
Divorced 0.15*** 0.12** 0.16*** 0.12** 0.12**(0.008) (0.048) (0.004) (0.034) (0.039)
Never Married 0.07 0.04 0.08* 0.05 0.05(0.133) (0.487) (0.080) (0.368) (0.371)
Age 0.00 0.01 0.00 0.01* 0.01*(0.319) (0.128) (0.296) (0.096) (0.080)
Age2 –0.00** –0.00** –0.00* –0.00** –0.00**(0.030) (0.014) (0.052) (0.018) (0.013)
Some College –0.11*** –0.11** –0.10** –0.10** –0.10**(0.003) (0.016) (0.010) (0.027) (0.031)
BA or more –0.26*** –0.22*** –0.22*** –0.18** –0.17**(0.000) (0.002) (0.001) (0.017) (0.027)
Cognitive Skill –0.13 –0.04 –0.04(0.292) (0.744) (0.733)
Extraversion –0.11 –0.18 –0.24(0.567) (0.359) (0.224)
Neuroticism –0.09 –0.04 –0.01(0.557) (0.803) (0.921)
Agreeableness –0.29** –0.26* –0.21(0.036) (0.060) (0.136)
Conscientiousness –0.24 –0.18(0.141) (0.269)
Inhibitive Side of Consc. –0.36**(0.026)
Proactive Side of Consc. 0.04(0.807)
Delay Acceptance –0.27*** –0.28*** –0.27***(0.000) (0.000) (0.000)
Risk Acceptance 0.16** 0.23** 0.21**(0.048) (0.012) (0.021)
N 654 549 654 549 549
19