Toward automatic generation of linguistic advice for ...
15
Soft Comput (2018) 22:345–359 https://doi.org/10.1007/s00500-016-2430-5 FOCUS Toward automatic generation of linguistic advice for saving energy at home Patricia Conde-Clemente 1 · Jose M. Alonso 2 · Gracian Trivino 3 Published online: 14 November 2016 © Springer-Verlag Berlin Heidelberg 2016 Abstract The increased demand of systems able to generate reports in natural language from numerical data involves the search for new solutions. This paper presents an adaptation of standard natural language generation methodologies to generate customized linguistic descriptions of data. Namely, we merge one of the most well-known architectures in the natural language generation research field together with our previous architecture for generating linguistic descriptions of complex phenomena. The latter is supported by the com- putational theory of perceptions which comes from the fuzzy sets and systems research field. We include a practical case of use dealing with the problem of inefficient consumption of energy at households. It generates natural language rec- ommendations adapted to each household to promote a more responsible consumption. The proposal reveals opportunities of collaboration between the different research communities that are involved. Communicated by C. M. Vide, A. H. Dediu. B Patricia Conde-Clemente [email protected] Jose M. Alonso [email protected] Gracian Trivino [email protected] 1 Departamento de Informática, Universidad of Oviedo, Edif. Dept. 1, Campus de Viesques s/n., 33204 Gijón, Asturias, Spain 2 Centro Singular de Investigacion en Tecnoloxias da Informacion (CiTIUS), Universidade de Santiago de Compostela, Campus Vida, 15782 Santiago de Compostela, Galicia, Spain 3 Phedes Lab, Gijón, Asturias, Spain Keywords Natural computing · Data science · Linguistic description of data · Computing with perceptions · Computational intelligence · Fuzzy sets and systems 1 Introduction Computational models able to generate text, in natural lan- guage, from data face three main challenges (Deemter 2016): (1) Conceptualization (What to say?), (2) Formulation (How to say it?), and (3) Articulation (Saying it ). Processing techniques allow the contextualization of data in specific domains and applying algorithms in order to extract knowl- edge. Report generation techniques allow representing the knowledge, previously extracted, in human friendly reports. They are expected to make use of the reader’s everyday language to provide better understanding for all type of end- users (Ramos-Soto et al. 2016). These linguistic reports can be seen as a complement to other ways of knowledge rep- resentation. They actually reduce the effort of interpreting tables, graphs and charts. In the literature, we identify two main research lines in the context of text generation from non-linguistic data, i.e., numerical and symbolic data (see Kacprzyk and Zadro˙ zny 2010; Marín and Sánchez 2016; Ramos-Soto et al. 2016; Reiter and Dale 2000). Namely, natural language genera- tion (NLG) for the so-called data-to-text (D2T) applications and linguistic descriptions of data (LDD) supported by Soft Computing tools. Actually, LDD can be seen as a sub-field of research inside NLG/D2T. It is expected to grow quickly in the near future. NLG deals with generating texts that are indistinguishable from those produced by humans from numerical data, graph- ics or even other text. It exploits the potential of standard Data Science (Dhar 2013) allowing the better understand- 123
Transcript of Toward automatic generation of linguistic advice for ...
Soft Comput (2018) 22:345–359https://doi.org/10.1007/s00500-016-2430-5
FOCUS
Toward automatic generation of linguistic advice for saving energyat home
Patricia Conde-Clemente1 · Jose M. Alonso2 · Gracian Trivino3
Published online: 14 November 2016© Springer-Verlag Berlin Heidelberg 2016
Abstract The increased demand of systems able to generatereports in natural language from numerical data involves thesearch for new solutions. This paper presents an adaptationof standard natural language generation methodologies togenerate customized linguistic descriptions of data. Namely,we merge one of the most well-known architectures in thenatural language generation research field together with ourprevious architecture for generating linguistic descriptionsof complex phenomena. The latter is supported by the com-putational theory of perceptions which comes from the fuzzysets and systems research field. We include a practical caseof use dealing with the problem of inefficient consumptionof energy at households. It generates natural language rec-ommendations adapted to each household to promote a moreresponsible consumption. The proposal reveals opportunitiesof collaboration between the different research communitiesthat are involved.
Communicated by C. M. Vide, A. H. Dediu.
B Patricia [email protected]
Jose M. [email protected]
Gracian [email protected]
1 Departamento de Informática, Universidad of Oviedo, Edif.Dept. 1, Campus de Viesques s/n., 33204 Gijón, Asturias,Spain
2 Centro Singular de Investigacion en Tecnoloxias daInformacion (CiTIUS), Universidade de Santiago deCompostela, Campus Vida, 15782 Santiago de Compostela,Galicia, Spain
3 Phedes Lab, Gijón, Asturias, Spain
Keywords Natural computing · Data science · Linguisticdescription of data · Computing with perceptions ·Computational intelligence · Fuzzy sets and systems
1 Introduction
Computational models able to generate text, in natural lan-guage, from data face threemain challenges (Deemter 2016):(1) Conceptualization (What to say?), (2) Formulation (Howto say it?), and (3) Articulation (Saying it). Processingtechniques allow the contextualization of data in specificdomains and applying algorithms in order to extract knowl-edge. Report generation techniques allow representing theknowledge, previously extracted, in human friendly reports.They are expected to make use of the reader’s everydaylanguage to provide better understanding for all type of end-users (Ramos-Soto et al. 2016). These linguistic reports canbe seen as a complement to other ways of knowledge rep-resentation. They actually reduce the effort of interpretingtables, graphs and charts.
In the literature, we identify two main research lines inthe context of text generation from non-linguistic data, i.e.,numerical and symbolic data (see Kacprzyk and Zadrozny2010; Marín and Sánchez 2016; Ramos-Soto et al. 2016;Reiter and Dale 2000). Namely, natural language genera-tion (NLG) for the so-called data-to-text (D2T) applicationsand linguistic descriptions of data (LDD) supported by SoftComputing tools. Actually, LDD can be seen as a sub-fieldof research inside NLG/D2T. It is expected to grow quicklyin the near future.
NLG deals with generating texts that are indistinguishablefrom those produced by humans from numerical data, graph-ics or even other text. It exploits the potential of standardData Science (Dhar 2013) allowing the better understand-
123
Luciano Sanchez
Luciano Sanchez
Luciano Sanchez
Luciano Sanchez
Luciano Sanchez
Luciano Sanchez

346 P. Conde-Clemente et al.
ing of what underlies in such data. On the other hand, LDDdeals with generating linguistic descriptions from numeri-cal datasets. It is supported by Soft Computing techniquesready to exploit the tolerance for imprecision and uncertainty(vagueness; vanDeemter 2009) inherent to human languages.Moreover, it has proved the ability to produce tractability,robustness and low-cost solutions when facing real-worldproblems (Zadeh 1994).
In recent years, the demand of automatic text genera-tion systems has increased. For example, the central goalof the NatConsumers1 project 2015 consists of developingan advanced and integral user-centered framework (sup-ported by NLG techniques). It is aimed at making easier theimplementation of efficient energy feedback programs in thedomestic area.
The NatConsumers approach relies on a thorough charac-terization of EU energy consumers. In addition, it focuses ondesigning specific customized actions. They are tailored toeach given consumer pattern and based on the use of naturallanguage. It is worthy to remark that understanding, prop-erly and in advance, consumer needs and expectations isessential in order to become successful when defining novelmechanisms for engaging citizens inmore sustainable energyconsumption habits.
Designing and developing text generation systems is onlyfeasible in the context of a complex Software Engineeringproject. A key component of this type of project is the systemarchitecture. A computational architecture that fits NatCon-sumers specifications is not available yet. It needs a thoroughreview of the scientific and technical literature to find the fun-damentals to support the design of the architecture requiredfor this project.
A complete state of the art on NLG/D2T and related soft-ware architectures is available in (Ramos-Soto et al. 2016).Asmain conclusion, authors remarked that there is not a gen-eral consensus about how to implementNLGsystems, neitherNLG/D2T systems nor LDD systems. Of course, we can takeprofit of valuable tools previously developed, regarding withthe goals of this manuscript. For instance, we can highlightthe generic architecture introduced byReiter andDale (2000)for designing NLG systems but also our own architecture fordesigning Linguistic Descriptions of Complex Phenomena(LDCP; Trivino and Sugeno 2013).
LDCP allows us to model complex phenomena, inter-preting input data, and generating automatic text reportscustomized to the user needs. Nevertheless, we did notdevelop yet any architecture as complete as the one neededin NatConsumers project. Our previous publications did notconsider either the need of identifying communication goalsor classifying types of user. Here, we have added to LDCPsome components introduced by Reiter and Dale: Commu-
1 Funded by the Horizon 2020 program of the European Commission.
nicative goal, User model, Knowledge source and Discoursehistory.
We have found some recent publications where Soft Com-puting techniques are applied together with NLG techniques.For example, in Ramos-Soto et al. (2015), we found a systemthat generates textual short-term weather forecasts on realprediction data, where the degree of cloudiness is character-ized by fuzzy sets. Also, (Gatt and Portet 2016) addressed theproblem of temporal uncertainty and its expression in NLGsystems. Finally, (Gatt et al. 2016) tackled with the role ofgraduality and fuzziness for referring expression generationin visual scenes.
This paper is an extension of a previous work presentedin Trivino and Sanchez-Valdes (2015). It deals with the auto-matic generation of linguistic advice for saving energy. Thenew contributions are as follows:
– Design and development of an adaptation of standardNLGmethodologies able to generate customized linguis-tic descriptions.
– Solving a practical use case with the focus on generatinglinguistic advice about the energy consumption behaviorat households. This case of use is carried out by using realdatabases and taxonomies. They are provided by Ariosz,the Hungarian NatConsumers partner.
Please note that the main objective of this paper is to proposethe architecture suitable to NatConsumers necessities. Thispaper does not deal with the problem of how to evaluate thegenerated linguistic descriptions. To evaluate properly theuse case, it is necessary to monitor the consumer behaviorand this work is beyond the scope of this paper.
The rest of the manuscript is organized as follows. Sec-tion 2 contains a brief state of the art about NLG/D2Tand LDD research lines. Section 3 presents the proposedarchitecture. Section 4 presents the case of use of the archi-tecture applied toNatConsumers project. Section 5 shows thecustomized linguistic advice obtained for four households.Finally, Sect. 6 summarizes main conclusions.
2 Solutions for text generation
This section first presents a brief state of the art aboutNLG/D2T and LDD research lines. Then, it introduces thearchitecture proposed by Reiter and Dale (2000) for devel-oping text generation systems. Finally, it also introduces ourown architecture (Trivino and Sugeno 2013) for producinglinguistic descriptions of complex phenomena. The inter-ested reader is kindly referred to (Ramos-Soto et al. 2016)for a more exhaustive review on these research lines.
123
Luciano Sanchez
Luciano Sanchez
Toward automatic generation of linguistic advice for saving energy at home 347
2.1 Natural language generation from data
NLG/D2T is dated back to 1980s (Kittredge et al. 1986).Applications of NLG/D2T include the generation of weatherreports frommeteorological data (Coch 1998; Goldberg et al.1994), the generation of reports about the state of neonatalbabies from intensive care data (Portet et al. 2009), air qualityreports (Busemann and Horacek 1997), etc. Nowadays, textgeneration from data is a hot open challenge (Cambria andWhite 2014; Ramos-Soto et al. 2016). Thus, several com-panies offer as commercial product the possibility of textgeneration from Big Data.
2.1.1 A generic architecture for natural languagegeneration systems
As we mentioned above, Reiter and Dale (2000) describe ageneric methodology and architectural framework that hasserved as inspiration for many NLG systems. Figure 1 showsthe main components. Here, we summarize the main ideasbehind this framework, paying special attention to the goalof our research.
The requirements analysis for the Reiter and Dale NLGarchitecture involves: (1) determination of system inputs;and (2) description of output texts to produce along withthe additional information that may be required to producesuch texts. This collection of input and output data is calledCorpus. After the requirements analysis task is ended, it canbe seen as an agreed-upon Corpus of representative targettexts which contains the range of outputs to be expected inthe system. In general, output texts express information thathas been obtained from input data after performing certaincomputation.
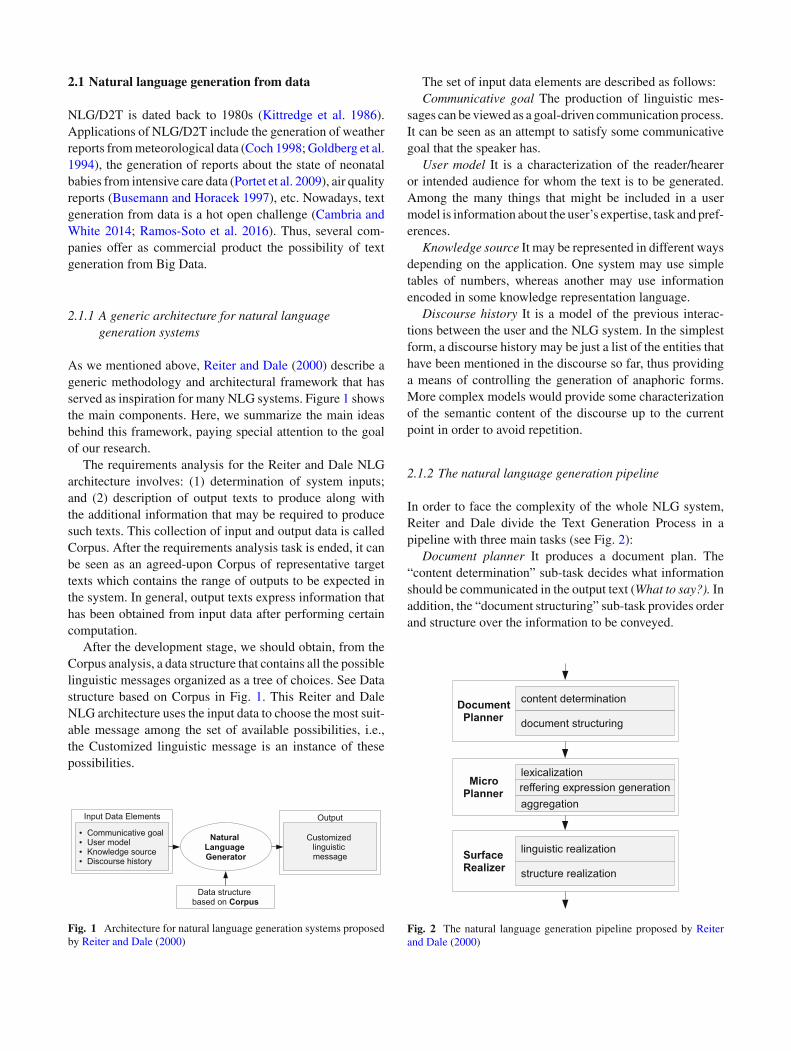
After the development stage, we should obtain, from theCorpus analysis, a data structure that contains all the possiblelinguistic messages organized as a tree of choices. See Datastructure based on Corpus in Fig. 1. This Reiter and DaleNLG architecture uses the input data to choose the most suit-able message among the set of available possibilities, i.e.,the Customized linguistic message is an instance of thesepossibilities.
Fig. 1 Architecture for natural language generation systems proposedby Reiter and Dale (2000)
The set of input data elements are described as follows:Communicative goal The production of linguistic mes-
sages can be viewed as a goal-driven communication process.It can be seen as an attempt to satisfy some communicativegoal that the speaker has.
User model It is a characterization of the reader/heareror intended audience for whom the text is to be generated.Among the many things that might be included in a usermodel is information about the user’s expertise, task and pref-erences.
Knowledge source It may be represented in different waysdepending on the application. One system may use simpletables of numbers, whereas another may use informationencoded in some knowledge representation language.
Discourse history It is a model of the previous interac-tions between the user and the NLG system. In the simplestform, a discourse history may be just a list of the entities thathave been mentioned in the discourse so far, thus providinga means of controlling the generation of anaphoric forms.More complex models would provide some characterizationof the semantic content of the discourse up to the currentpoint in order to avoid repetition.
2.1.2 The natural language generation pipeline
In order to face the complexity of the whole NLG system,Reiter and Dale divide the Text Generation Process in apipeline with three main tasks (see Fig. 2):
Document planner It produces a document plan. The“content determination” sub-task decides what informationshould be communicated in the output text (What to say?). Inaddition, the “document structuring” sub-task provides orderand structure over the information to be conveyed.
Fig. 2 The natural language generation pipeline proposed by Reiterand Dale (2000)
123
Luciano Sanchez
Luciano Sanchez

348 P. Conde-Clemente et al.
Micro planner It produces a text specification. The “lexi-calization” sub-task solves the problem of choosing the rightwords (nouns, verbs, adjectives, adverbs, etc.) and syntac-tic structure for the generated text (How to say it?). Then,the “referring expression generation” sub-task produces themost suitable reference expressions tomake easier the identi-fication of entities for a reader. In addition, the “aggregation”sub-task involves the use of linguistic resources to build sen-tences ready to communicate several pieces of informationat once. Thus, it produces a more natural text by avoidingrepetitions, redundancies and so on.
Surface realizer It produces the final text. The “linguis-tic realization” sub-task is generally viewed as solving theproblem of applying some characterization of the rules ofgrammar to some more abstract representation in order toproduce a text (saying it) which is syntactically and morpho-logically correct. Finally, “structure realization” converts theparagraphs and sentences into the final format that will bedisplayed to the user.
2.2 Linguistic descriptions of data
LDDemergedwith the basic concept of fuzzy linguistic sum-mary that was established in Yager (1982) and Zadeh (1983).Typically, fuzzy linguistic summaries are based in the ideaof quantified propositions which have the ability of summa-rizing a set of elements related to the concrete domain ofa phenomenon. For example, “Most of the months the gen-eral consumption ismedium” correspondswith the quantifiedsentence “Q of X are A”, whereMost is the quantifier Q andmedium is the fuzzypredicateA, i.e., an attribute (feature) thatcharacterizes the perception of the phenomenon “the generalconsumption” (X).
Zadeh (1999, 2002) proposed the computational theoryof perceptions. This theory provides a framework to developcomputational systems with the capacity of computing withthe meaning of natural language expressions, i.e., with thecapacity of computing with imprecise descriptions of theworld in a similar way how humans do. In recent years, thisconcept has been extended in different ways and used fordifferent applications, e.g., data mining (Yager 1995), data-base queries (Castillo-Ortega et al. 2011b; Kacprzyk et al.2000; Kacprzyk and Zadrozny 2010), description of tempo-ral series (Castillo-Ortega et al. 2011a; Kacprzyk et al. 2008;Kacprzyk and Yager 2001; Losada et al. 2004), comparisonof time series (Castillo-Ortega et al. 2010), or the meteorol-ogy domain (Ramos-Soto et al. 2013).
2.2.1 Architecture for generating linguistic descriptions ofcomplex phenomena
Our research for generating LDD is the so-called LDCP(Trivino and Sugeno 2013). In previous publications, we
Fig. 3 Architecture for generating linguistic descriptions of complexphenomena
have described several phenomena using this architecture(see Fig. 3), e.g., the beauty of the double stars (Arguellesand Trivino 2013), the behavior of electricity consumers(Menendez et al. 2014), and, recently, dynamic linguisticdescriptions of time series applied to self-track the physicalactivity (Sanchez-Valdes et al. 2016).
In a preliminary stage, designers collect a Corpus ofnatural language expressions that are typically used in thedomain to describe the relevant features of the analyzed phe-nomenon. Then, they analyze the particular meaning of eachlinguistic expression in each specific situation and the userprofiles to define the Granular Linguistic Model of Phenom-ena (GLMP) and the Report Template.
Granular linguistic model of phenomena It is a general pur-pose model that allows describing phenomena at differentlevels of granularity. GLMP is built on two main concepts,namely Computational Perception and Perception Mapping.
In general, Computational Perceptions (CP) correspondwith specific parts of the analyzed phenomenon at a cer-tain degree of granularity. As we mention above, to create acomputer model of the analyzed phenomenon, the designeranalyzes the everyday use of natural language about themon-itored phenomenonwith the aim of identifying different parts(units of information or granules) based on his/her subjec-tive perceptions. According with Zadeh, a granule is a clumpof elements which are drawn together by indistinguishabil-ity, similarity, proximity or functionality (Zadeh 1996). TheGLMP handles granules by using CPs. A CP is a tuple (A,W , R) where:
A = (a1, a2, . . . , an) is a vector of linguistic expressions(words or sentences in natural language) that representsthe whole linguistic domain of CP. Each component ai isthe most suitable linguistic value of CP in each situationof the phenomenon with specific granularity degree. Forexample, “the perception the general energy consump-tion” is modeled with A = (low,medium, high).
W = (w1, w2, . . . , wn) is a vector of validity degrees wi ∈[0, 1]. The validity valuewi represents the degree of eachlinguistic expression ai to describe the specific input data.The sum of all validity degrees must be
∑wi = 1.
123
Luciano Sanchez
Luciano Sanchez
Toward automatic generation of linguistic advice for saving energy at home 349
R = (r1, r2, . . . , rn) is a vector of relevance degrees ri ∈[0, 1] assigned to each ai in the specific context, e.g.,the relevance of the linguistic expressions A = (low,medium, high) is R = (0.5, 0.5, 1)means the perceptionof high is considered more relevant than the other twochoices. By default, all the relevance degrees take themaximum value (ri = 1).
Perception Mappings (PM) are used to create and aggre-gate CPs. Each PM takes a set of input CPs and aggregatesthem into a single CP. A PM is a tuple (U, y, g, T ) where:
U = (u1, u2, . . . , un) is a vector of n input CPs ui =(Aui ,Wui , Rui ). In the special case of first-level Percep-tion Mappings (1PM) the inputs are values z ∈ R beingprovided either by sensors or obtained from a database.
y = (Ay,Wy, Ry) is the output CP.g is the aggregation function. It is divided into two func-
tions gW and gR to calculate the validityWy and relevanceRy degrees, respectively.Wy = gW (Wu1 ,Wu2 , . . . ,Wun ) is calculated with thevalidity degrees of the n input CPs. In Fuzzy Logic,many different types of aggregation functions have beendeveloped. Indeed these aggregation functions are com-putational models that allow the designer to use differenttypes of linguistic expressions. For example, in our previ-ous publications (see Alvarez-Alvarez and Trivino 2013;Arguelles and Trivino 2013; Sanchez-Valdes et al. 2016)we implemented gW by using a set of fuzzy rules or quan-tifiedmethods (Delgado et al. 2014). In the case of 1PMs,we built gW by using a set of membership functions.
Ry = gR(W1, R1,W2, R2, . . . ,Wm, Rm) is calculatedwith the validity and relevance degrees of m input CPs.This definition allows us generatingmoreflexible reports,i.e., reports that are adapted automatically to each specifictype of situation (Sanchez-Valdes et al. 2016).
T is a text generation algorithm which allows generatingall the possible sentences associated with the linguisticexpressions in Ay . For the sake of brevity, T is defined asa linguistic template that represents a set of possible lin-guistic expressions. An example of linguistic template ofT is “The general energy consumption is {low |medium| high}”. It allows generating three different sentences.
GLMP is a hierarchical network of CPs and PMs. Theinput data are introduced into themodel through 1PMswhichinterpret these data and generate 1CPs. Then, 2PMs take sev-eral 1CPs as input and generate 2CPs, in the second level ofthe hierarchy.Of course, additional upper levels canbe added.In such levels, 2PMs take several 2CPs as input and generatenew 2CPs as output (Fig. 7, in Sect. 4.2, shows an illustrativeexample in relation with the use case under study).
Report template Like humans synthesize information beforeexpressing their opinions, it is desirable that the generatedreports include only the most valid and relevant informationwith the appropriate level of detail to each specific user. AReport Template is built by using a set of functions (program-ming code) and templates. The Report Generation modulecontains:
– The function that evaluates, sorts and selects the mostinteresting perceptions. Generally, it uses the validity andreliability degrees of each CP.
– The function that generates sentences. Note that it is pos-sible tomerge information fromdifferent perceptions intosingle sentences. Generally, this method is based on thecombination of several templates.
– The function that organizes sentences in paragraphsaccording to the final report.
We have seen above that T is an algorithm associated witheachCP that generates linguistic expressions of A. In general,the linguistic expressions generated by T are intermediateresults (linguistic labels) that are dedicated tomake easier thework of the designer. When the Report Generation moduleproduces the final sentences, it could substitute these linguis-tic labels with more suitable linguistic expressions for eachuser type. E.g., expressions in another language, with differ-ent verb tense or by including emotional/sentiment contentrelated to either warning or advice.
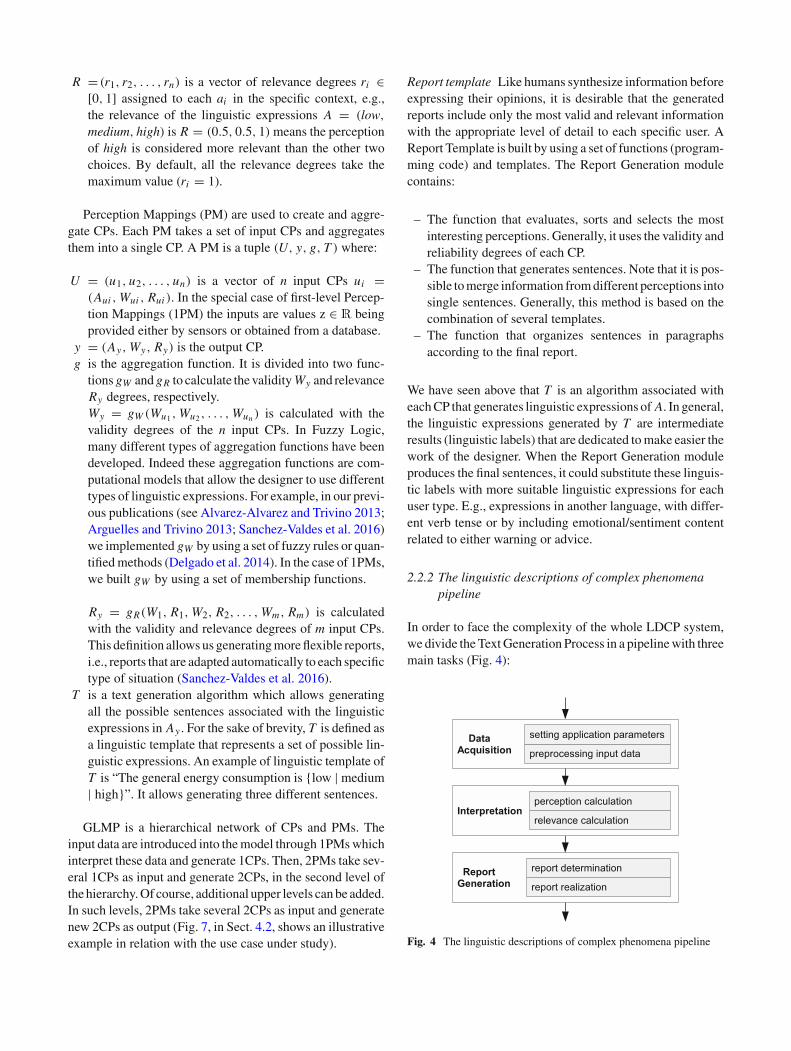
2.2.2 The linguistic descriptions of complex phenomenapipeline
In order to face the complexity of the whole LDCP system,we divide theTextGeneration Process in a pipelinewith threemain tasks (Fig. 4):
Fig. 4 The linguistic descriptions of complex phenomena pipeline
123
Luciano Sanchez
Luciano Sanchez

350 P. Conde-Clemente et al.
Data acquisition It takes as input both data from the spe-cific user model and data from the phenomenon. The “settingapplication parameters” sub-task manages the specific userparameters. For example, it sets the user language and otherdetails in the usermodel in order to select the adequateReportTemplate. The “preprocessing input data” sub-task managesthe data from the phenomenon. It applies a set of algo-rithms and preprocessing techniques needed to prepare theGLMP input data, e.g., sort the data, andmanageout-of-rangeor missing values. The result of applying these techniquesmust be a data structure which directly corresponds with theGLMP input.
Interpretation It takes as input the data structure createdin the previous sub-task. As a result, it produces a set oflinguistic expressions that are valid to describe the availabledata. The sub-task “perception calculation” uses the GLMPto interpret the input data, i.e., executes the network of PMsin order to calculate the validity degrees W of the CP. Then,the “relevance calculation” sub-task calculates the relevancedegrees R.
Report generation It takes as input the calculated linguisticexpressions. As a result, it produces the linguistic report. The“report determination” sub-task uses the Report Template togenerate the linguistic report that better describes the phe-nomenon. Then, the “report realization” sub-task generatesthe output by using the Report Template.
3 Customization of linguistic descriptions
Reiter and Dale provided a generic architecture for NLG. Inthis section, we provide an instantiation of this generic archi-tecture that emphasizes the representation of the meaning ofthe linguistic expressions. It is the result of combining boththe generic architecture of NLG and the LDCP architecture.
Figure 5 shows the combination of their components: Theinput and output elements come from the Reiter and Dalearchitecture,while theData structures (GLMPand theReportTemplate) come from the LDCP architecture.
Figure 6 shows the combination of their correspondingpipeline tasks. Note that the NLG pipeline tasks are focused
Fig. 5 Architecture for generating customized linguistic descriptions
Fig. 6 Correspondence between the NLG and LDCP pipelines
on obtaining grammatically correct linguistic expressions,while the LDCP pipeline tasks emphasize the representationof the meaning of linguistic expressions.
The following subsections detail: (1) how we combinedthe two pipelines in a new one and (2) how the resultantframework can be applied in practice from a methodologicalpoint of view.
3.1 Correspondence between NLG and LDCP pipelines
Provided the NLG generic architecture proposed by ReiterandDale, we propose including in such architecture the com-ponents of LDCP, as follows (see Fig. 6):
Document planner In our instantiation, the LDCP (1)DataAcquisition and (2) Interpretation tasks perform the NLG(1.1) “content determination” sub-task. Also we include herethe LDCP (3.1) “report determination” sub-task that eval-uates, sorts and selects the most suitable perceptions. Onthe other hand, the LDCP (3.1) “report determination” sub-task that organizes sentences into paragraphs according tothe final report corresponds with the NLG (1.2) “documentstructuring” sub-task.
Micro planner The LDCP (3.1) “report determination”sub-taskmerges information from different perceptions, thusperforming the NLG (2.3) “aggregation” sub-task. Becausethe LDCP text generation is based on templates, this instan-tiation does not include the NLG (2.1) “lexicalization” and(2.2) “referring expression generation” sub-tasks.
Surface realizer The LDCP (3.1) “report determination”sub-task generates sentences, thus performing the NLG (3.1)“linguistic realization” sub-task. The LDCP (3.2) “reportrealization” sub-task performs the NLG (3.2) “structure real-ization” subtask.
3.2 Methodology
During the Requirements Analysis phase, the designer deter-mines the input and output elements that comprise theCorpus(see Fig. 5). To accomplish this task, the designer must con-sider all the possibilities in the input and output elements. The
123
Luciano Sanchez
Luciano Sanchez
Toward automatic generation of linguistic advice for saving energy at home 351
different values of input data components affect the outputas follows:Communicative goal There are different versions of theReport Template in function of the Communicative goals. Inaddition, the designer can consider different relevance valueswith respect to each specific communicative goal.User model Report Template uses specific user taxonomiesas input. Amore detailed characterization of users allows thedesigner generating more specific messages.Knowledge source The designer must take into account boththe source and the format of the data when determining theavailable input data to the GLMP.Discourse history It contains the historical data and the userfeedback. GLMP and Report Template use this informationas input. For example, we can refer to the past and also avoidrepetition in reports.
After defining the Corpus, the designer must perform thetasks in the pipeline as follows:Data acquisition The designer must identify the source ofdata and the different parameters that the application canreceive, e.g., goals, user models. Also, she/hemust pay atten-tion to the data structures that these parameters modify.Then, the designer must establish the mechanism requiredto collect the input data. In addition, she/he must definethe preprocessing techniques needed to generate the GLMPinput.Interpretation The designer models the GLMP network.She/he is in charge of analyzing each expression in the Cor-pus of study with the aim of identifying different units ofinformation. Then, the designer models those units of infor-mation using CPs and PMs with the appropriate degree ofgranularity. A key point is to identify and obtain the 1PMinput data.Report generation The designer builds the set of ReportTemplates. This process can be seen as a reverse engi-neering process whose main objective is to define severalReport Templates able to generate the linguistic expressionsincluded in the Corpus during the Requirements Analysisphase. These Report Templates should cover the differentvariations previously considered, e.g., goals and user mod-els. Note that the Report Template makes use of a set of CPsfrom the GLMP.
In an iterative process, the designer will find out a newversion of the Corpus. During iterations, the designer mayfind out several expressions that cannot be generated, e.g.,because the lack of input data. In addition, the designer canfind out new expressions that can be generated and they arerelevant for the user.
During the Validation phase, the final version of this Cor-pus will be used to demonstrate to the user the computationalsystem functionalities.
4 Case of use: generating linguistic advice forNatConsumers project
The architectural framework in Fig. 5 provides a general viewthat must be customized when we deal with implementingpractical applications. In this section, we have adapted thisarchitecture for generating linguistic advice related to energyconsumption behavior at home. The next sections explain indetail the components of this application.
4.1 Input data elements
The current first stage of NatConsumers project includesundertaking surveys to consumers and experts. The mainobjective of this task is to establish an initial Corpus withthe most appropriate advice for every situation type. Here,we present an illustrative example that is based on a veryearly Corpus version. The aim of this initial work is to showthe possibilities of the tool to the experts in social sciences.The study and design of the final Corpus version is beyondthe scope of this work.Communicative goal It is aimed at answering the questionabout what are the opportunities for saving energy?
To do so, we consider a set of possible ways of improvingthe efficiency in energy consumption. For example, we caninclude (among others):
– To use low consumption bulbs.– To reduce the general consumption by comparing withsimilar householders.
– To reduce the consumption in standby, e.g., to switch offthe computer during nights.
– To move the time of the washing machine from a peak toa valley zone of consumption.
– To change the old appliances by more efficient ones.– To improve the building thermal isolation.
User model It focuses on answering the question about whoare the consumers that need to be advised?
It characterizes the different types of European electricityconsumers,what is likely to be one of the hardest and themostchallenging problems to tackle with. The goal of this charac-terization is generating customized advice for each kind ofconsumer.We have considered two taxonomies: (1) Attitudi-nal taxonomy based on consumers’ attitudes and (2) Physicaltaxonomy based on physical conditions.
Attitudinal taxonomy is as follows:
Cluster 1 (Consumption Oriented) Averagely innovative.Not concerned about the environment. Savings arenot important. Very positive about shopping.
123
Luciano Sanchez
Luciano Sanchez
352 P. Conde-Clemente et al.
Cluster 2 (Modern and Passive) Innovative. Concernedabout the environment, but only at opinion level.Non-saver. Not concerned about their energyusage.
Cluster 3 (Modern and Active) Innovative. Strongly con-cerned on environmental issues, at both attitudinaland behavioral level. Cost sensitive. Concernedabout their energy usage.
Cluster 4 (Traditional Savers) Non-innovative. Not con-cerned about the environment. Saving is the mostimportant for them. They are interested in theirenergy consumption, but not in the environmen-tal issues.
Physical taxonomy is as follows:
Cluster 1 Houses with maximum 2 adults with all sys-tems, e.g., boiler, heating and air-conditioning.
Cluster 2 Houses with maximum 2 adults with some sys-tems, e.g., boiler and air-conditioning.
Cluster 3 Houses with maximum 2 adults without anysystems, e.g., without boiler, without heatingand without air-conditioning.
Cluster 4 Houses with more than 2 adults or childrenwith all systems, e.g., boiler, heating and air-conditioning.
Cluster 5 Houses withmore than 2 adults or children withsome systems, e.g., boiler and air-conditioning.
Cluster 6 Houses with more than 2 adults or childrenwithout any systems, e.g., without boiler, with-out heating and without air-conditioning.
Cluster 7 Flats with maximum 2 adults with all systems,e.g., boiler, heating and air-conditioning.
Cluster 8 Flats with maximum 2 adults with some sys-tems, e.g., boiler and air-conditioning.
Cluster 9 Flats with maximum 2 adults without boiler,heating and air-conditioning.
Cluster 10 Flats with more than 2 adults or childrenwith all systems, e.g., boiler, heating and air-conditioning.
Cluster 11 Flats with more than 2 adults or children withsome systems, e.g., boiler and air-conditioning.
Cluster 12 Flats with more than 2 adults or children with-out any systems, e.g., without boiler, withoutheating and without air-conditioning.
Knowledge source It is related to answer the question aboutwhat is their consumption profile?
We consider, as source of knowledge, the data obtainedthanks to the recently installed electrical energy counters inmany European households. These new energy meters pro-vide us with the following data:
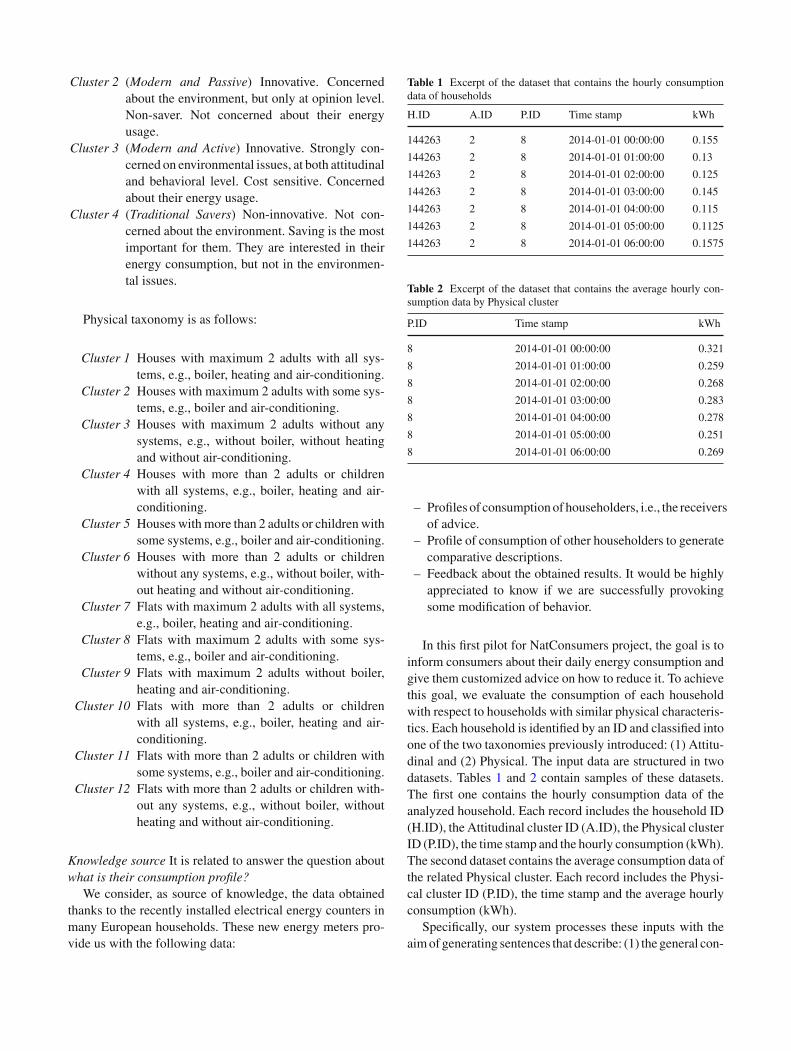
Table 1 Excerpt of the dataset that contains the hourly consumptiondata of households
H.ID A.ID P.ID Time stamp kWh
144263 2 8 2014-01-01 00:00:00 0.155
144263 2 8 2014-01-01 01:00:00 0.13
144263 2 8 2014-01-01 02:00:00 0.125
144263 2 8 2014-01-01 03:00:00 0.145
144263 2 8 2014-01-01 04:00:00 0.115
144263 2 8 2014-01-01 05:00:00 0.1125
144263 2 8 2014-01-01 06:00:00 0.1575
Table 2 Excerpt of the dataset that contains the average hourly con-sumption data by Physical cluster
P.ID Time stamp kWh
8 2014-01-01 00:00:00 0.321
8 2014-01-01 01:00:00 0.259
8 2014-01-01 02:00:00 0.268
8 2014-01-01 03:00:00 0.283
8 2014-01-01 04:00:00 0.278
8 2014-01-01 05:00:00 0.251
8 2014-01-01 06:00:00 0.269
– Profiles of consumptionof householders, i.e., the receiversof advice.
– Profile of consumption of other householders to generatecomparative descriptions.
– Feedback about the obtained results. It would be highlyappreciated to know if we are successfully provokingsome modification of behavior.
In this first pilot for NatConsumers project, the goal is toinform consumers about their daily energy consumption andgive them customized advice on how to reduce it. To achievethis goal, we evaluate the consumption of each householdwith respect to households with similar physical characteris-tics. Each household is identified by an ID and classified intoone of the two taxonomies previously introduced: (1) Attitu-dinal and (2) Physical. The input data are structured in twodatasets. Tables 1 and 2 contain samples of these datasets.The first one contains the hourly consumption data of theanalyzed household. Each record includes the household ID(H.ID), the Attitudinal cluster ID (A.ID), the Physical clusterID (P.ID), the time stamp and the hourly consumption (kWh).The second dataset contains the average consumption data ofthe related Physical cluster. Each record includes the Physi-cal cluster ID (P.ID), the time stamp and the average hourlyconsumption (kWh).
Specifically, our system processes these inputs with theaimof generating sentences that describe: (1) the general con-
123
Luciano Sanchez
Luciano Sanchez
Toward automatic generation of linguistic advice for saving energy at home 353
sumption, (2) the standby consumption, (3) the consumptionby parts of day and (4) the consumption with fine granularityin the different parts of the day.We define and calculate theseterms as follows:
– General consumption It is the average consumption dur-ing certain time period. For example, Table 1 containsthe hourly consumption of household with H.ID 144263from 00 to 06 hours, 2014-01-01. The general consump-tion of this household is 0.134 kWh.
– Standby consumption It is the minimum consumption incertain days. It occurs when all activity ceases in thehouse. For example, the standby consumption of thehousehold with H.ID 144263 occurs at 5 and it is 0.1125kWh.
– Consumption by parts of day It is the average consump-tion in each part of the day. We divide the day in sixparts:
– Dawning between 2 and 6 A.M.– Morning between 7 and 12 A.M.– Midday between 1 and 4 P.M.– Afternoon between 5 and 7 P.M.– Evening between 8 and 9 P.M.– Night between 10 P.M. and 1 A.M.
For example, the consumption of the household withH.ID 144263 in the Dawning is 0.131 kWh.
– Consumption with fine granularity in the different partsof the day: It is an extension of the above definition. Here,we divide each defined part in three more detailed parts.For example:
– Dawning first hours between 2 and 4 A.M.– Dawning central hours between 4 and 5 A.M.– Dawning last hours between 5 and 6 A.M.
For example, the consumption of the household withH.ID 144263 in the Dawning first hours is 0.128 kWh.
4.2 Granular linguistic model of energy consumption
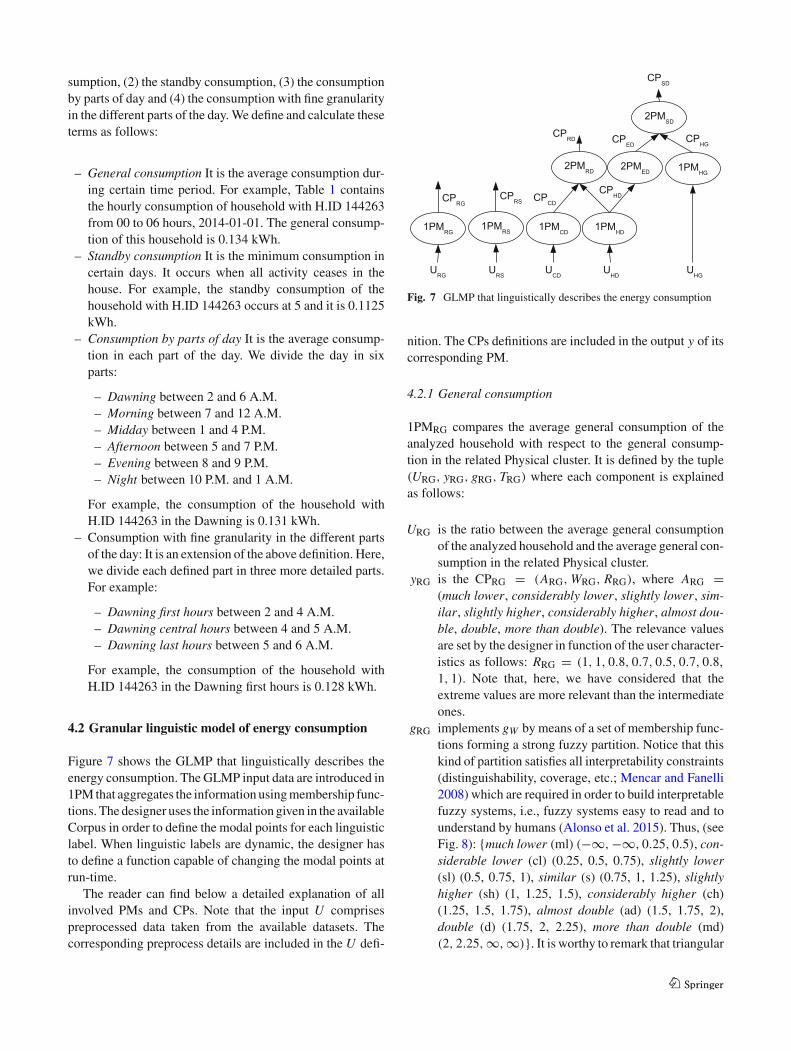
Figure 7 shows the GLMP that linguistically describes theenergy consumption. The GLMP input data are introduced in1PMthat aggregates the information usingmembership func-tions. The designer uses the information given in the availableCorpus in order to define the modal points for each linguisticlabel. When linguistic labels are dynamic, the designer hasto define a function capable of changing the modal points atrun-time.
The reader can find below a detailed explanation of allinvolved PMs and CPs. Note that the input U comprisespreprocessed data taken from the available datasets. Thecorresponding preprocess details are included in the U defi-
Fig. 7 GLMP that linguistically describes the energy consumption
nition. The CPs definitions are included in the output y of itscorresponding PM.
4.2.1 General consumption
1PMRG compares the average general consumption of theanalyzed household with respect to the general consump-tion in the related Physical cluster. It is defined by the tuple(URG, yRG, gRG, TRG) where each component is explainedas follows:
URG is the ratio between the average general consumptionof the analyzed household and the average general con-sumption in the related Physical cluster.
yRG is the CPRG = (ARG,WRG, RRG), where ARG =(much lower, considerably lower, slightly lower, sim-ilar, slightly higher, considerably higher, almost dou-ble, double, more than double). The relevance valuesare set by the designer in function of the user character-istics as follows: RRG = (1, 1, 0.8, 0.7, 0.5, 0.7, 0.8,1, 1). Note that, here, we have considered that theextreme values are more relevant than the intermediateones.
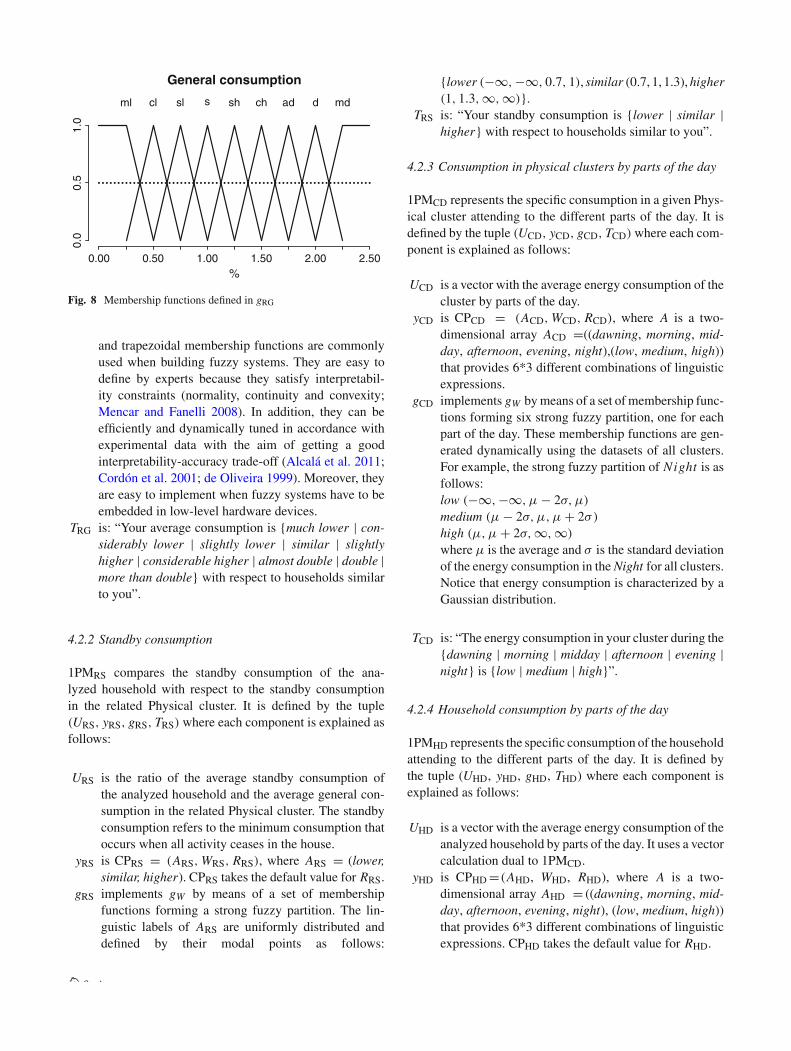
gRG implements gW by means of a set of membership func-tions forming a strong fuzzy partition. Notice that thiskind of partition satisfies all interpretability constraints(distinguishability, coverage, etc.; Mencar and Fanelli2008) which are required in order to build interpretablefuzzy systems, i.e., fuzzy systems easy to read and tounderstand by humans (Alonso et al. 2015). Thus, (seeFig. 8): {much lower (ml) (−∞,−∞, 0.25, 0.5), con-siderable lower (cl) (0.25, 0.5, 0.75), slightly lower(sl) (0.5, 0.75, 1), similar (s) (0.75, 1, 1.25), slightlyhigher (sh) (1, 1.25, 1.5), considerably higher (ch)(1.25, 1.5, 1.75), almost double (ad) (1.5, 1.75, 2),double (d) (1.75, 2, 2.25), more than double (md)(2, 2.25,∞,∞)}. It is worthy to remark that triangular
123
Luciano Sanchez
Luciano Sanchez
354 P. Conde-Clemente et al.
General consumption
%0.00 0.50 1.00 1.50 2.00 2.50
0.0
0.5
1.0
ml cl sl s sh ch ad d md
Fig. 8 Membership functions defined in gRG
and trapezoidal membership functions are commonlyused when building fuzzy systems. They are easy todefine by experts because they satisfy interpretabil-ity constraints (normality, continuity and convexity;Mencar and Fanelli 2008). In addition, they can beefficiently and dynamically tuned in accordance withexperimental data with the aim of getting a goodinterpretability-accuracy trade-off (Alcalá et al. 2011;Cordón et al. 2001; de Oliveira 1999). Moreover, theyare easy to implement when fuzzy systems have to beembedded in low-level hardware devices.
TRG is: “Your average consumption is {much lower | con-siderably lower | slightly lower | similar | slightlyhigher | considerable higher | almost double | double |more than double} with respect to households similarto you”.
4.2.2 Standby consumption
1PMRS compares the standby consumption of the ana-lyzed household with respect to the standby consumptionin the related Physical cluster. It is defined by the tuple(URS, yRS, gRS, TRS) where each component is explained asfollows:
URS is the ratio of the average standby consumption ofthe analyzed household and the average general con-sumption in the related Physical cluster. The standbyconsumption refers to the minimum consumption thatoccurs when all activity ceases in the house.
yRS is CPRS = (ARS,WRS, RRS), where ARS = (lower,similar, higher). CPRS takes the default value for RRS.
gRS implements gW by means of a set of membershipfunctions forming a strong fuzzy partition. The lin-guistic labels of ARS are uniformly distributed anddefined by their modal points as follows:
{lower (−∞,−∞, 0.7, 1), similar (0.7, 1, 1.3),higher(1, 1.3,∞,∞)}.
TRS is: “Your standby consumption is {lower | similar |higher} with respect to households similar to you”.
4.2.3 Consumption in physical clusters by parts of the day
1PMCD represents the specific consumption in a given Phys-ical cluster attending to the different parts of the day. It isdefined by the tuple (UCD, yCD, gCD, TCD)where each com-ponent is explained as follows:
UCD is a vector with the average energy consumption of thecluster by parts of the day.
yCD is CPCD = (ACD,WCD, RCD), where A is a two-dimensional array ACD =((dawning, morning, mid-day, afternoon, evening, night),(low, medium, high))that provides 6*3 different combinations of linguisticexpressions.
gCD implements gW bymeans of a set of membership func-tions forming six strong fuzzy partition, one for eachpart of the day. These membership functions are gen-erated dynamically using the datasets of all clusters.For example, the strong fuzzy partition of Night is asfollows:low (−∞,−∞, µ − 2σ, µ)medium (µ − 2σ, µ,µ+ 2σ )high (µ,µ+ 2σ,∞,∞)
where µ is the average and σ is the standard deviationof the energy consumption in theNight for all clusters.Notice that energy consumption is characterized by aGaussian distribution.
TCD is: “The energy consumption in your cluster during the{dawning | morning | midday | afternoon | evening |night} is {low | medium | high}”.
4.2.4 Household consumption by parts of the day
1PMHD represents the specific consumption of the householdattending to the different parts of the day. It is defined bythe tuple (UHD, yHD, gHD, THD) where each component isexplained as follows:
UHD is a vector with the average energy consumption of theanalyzed household by parts of the day. It uses a vectorcalculation dual to 1PMCD.
yHD is CPHD= (AHD, WHD, RHD), where A is a two-dimensional array AHD = ((dawning, morning, mid-day, afternoon, evening, night), (low, medium, high))that provides 6*3 different combinations of linguisticexpressions. CPHD takes the default value for RHD.
123
Luciano Sanchez
Luciano Sanchez
Toward automatic generation of linguistic advice for saving energy at home 355
gHD implements gW bymeans of a set of membership func-tions forming a strong fuzzy partition for each part ofthe day. These strong fuzzy partitions are generateddynamically using the datasets in the related Physicalcluster. We calculate these partitions in dual way to1PMCD.
THD is: “Your energy consumption during the {dawning |morning |midday | afternoon | evening | night} is {low| medium | high}”.
4.2.5 Household consumption with fine granularity in theparts of the day
1PMHG represents the analyzed household consumptionusing a more fine granularity in the parts of the day. It isdefined by the tuple (UHG, yHG, gHG, THG) where each com-ponent is explained as follows:
UHG is a vector with the average energy consumption of theanalyzed household by parts of the day.
yHG is CPHG = (AHG,WHG, RHG), where A is a two-dimensional array AHG =((dawning first hours, dawn-ing central hours, dawning last hours, . . ., night firsthours, night central hours, night last hours), (low,medium, high)) that provides 18*3 different combina-tions of linguistic expressions. CPHG takes the defaultvalue for RHG.
gHG implements gW bymeans of a set of membership func-tions forming eighteen strong fuzzy partitions, one foreach part of the day. These strong fuzzy partitions aregenerated dynamically using the datasets in the relatedPhysical cluster. We calculate these partitions in dualway to 1PMCD.
THG is: “The energy consumption in the related Physicalcluster during the {dawning first hours | dawning cen-tral hours | dawning last hours | . . . | night first hours |night central hours | night last hours} is {low |medium| high}”.
4.2.6 Comparing the consumption at household versus therelated physical cluster by parts of the day
2PMRD makes comparison between the consumption of theanalyzed household and its cluster attending to the differentparts of the day. It is defined by the tuple (URD, yRD, gRD,TRD) where each component is explained as follows:
URD is a vector with the household and cluster consumptionby parts of the day, CPHD and CPCD, respectively.
yRD is CPRD = (ARD, WRD, RRD), where A is a two-dimensional array ARD = ((dawning, morning, mid-day, afternoon, evening, night), (considerably lower,slightly lower, similar, slightly higher, considerably
higher)) that provides 6*9 different combinations oflinguistic expressions.
gRD implements gW by using fuzzy rules, with the usualMin–Max fuzzy reasoning mechanism. For example,one of the rules is as follows:
IF (CPHD household consumption in themorning is high)AND (CPCD cluster consumption in themorning is high)THEN (CPRD energy consumption in themorning is sim-ilar)
TRD is: “During the {dawning | morning | midday | after-noon | evening | night} your energy consumption is{considerably lower | slightly lower | similar | slightlyhigher | considerably higher} with respect to house-holds similar to you”.
4.2.7 Energy cost by parts of the day
2PMED represents the energy cost attending to the differentparts of the day. It is defined by the tuple (UED, yED, gED,TED) where each component is explained as follows:
UED is CPHD. It represents the specific consumption of thehousehold attending to the different parts of the day.
yED is CPED = (AED, WED, RED), where A is a two-dimensional array AED = ((dawning, morning, mid-day, afternoon, evening, night), (low, medium, high))that provides 6*3 different combinations of linguisticexpressions.
gED implements gW by using fuzzy rules, with the usualMin-Max fuzzy reasoningmechanism.Each fuzzy ruleconsiders the household consumption and the energycost to compute the household energy cost. We con-sider that every part of the day has the following energycost:
– Dawning has a low cost.– Morning has a high cost.– Midday has a high cost.– Afternoon has a medium cost.– Evening has a medium cost.– Night has a high cost.
For example, a couple of fuzzy rules are as follows:
IF (CPHD household consumption in the morning ismedium or high) THEN (CPED energy cost in themorn-ing is high)IF (CPHD household consumption in the morning islow) THEN (CPED energy cost in the morning ismedium)
123
Luciano Sanchez
Luciano Sanchez

356 P. Conde-Clemente et al.
TED is: “Your energy cost during the {dawning | morning |midday | afternoon | evening | night} is {low |medium| high}”.
4.2.8 Household shifts in the energy consumption
PMSD represents the shifts in the energy consumption attend-ing to the energy cost and the household consumption. Thegoals are: (1) first to analyze the load profile; and then (2)to suggest the user how to shift its household consumptionfrom some parts of the day to others with lower energy cost.It is defined by the tuple (USD, ySD, gSD, TSD) where eachcomponent is explained as follows:
USD is a vector with the CPED and CPHG, the energy costof the household by parts of the day and the householdconsumption by parts of the day using a fine granular-ity.
ySD is CPSD = (ASD, WSD, RSD), where A is a two-dimensional array ASD = ((dawning, morning, mid-day, afternoon, evening, night), (dawning, morning,midday, afternoon, evening, night)) that provides 6*6different combinations of linguistic expressions.
gSD implements gW by using fuzzy rules with the usualMin-Max fuzzy reasoning mechanism. For example, acouple of fuzzy rules are as follows:
IF (CPED energy cost in the morning is high) and (CPHGhousehold consumption in themorningfirst hours ishigh)THEN (CPSD shift from the morning to the dawning).IF (CPED energy cost in the morning is high) and (CPHGhousehold consumption in themorning last hours is high)THEN (CPSD shift from the morning to the afternoon)
TSD generates sentences as: “You should shift part of yourenergy consumption from the morning to the dawn-ing”.
4.3 Report template
Figure 9 shows the Report Template to generate linguisticadvice about how to improve the daily energy consumptionbehavior in a specific household. The top of the report con-tains the data able to identify the message: the householdH.ID, the analyzed period and the Physical cluster. Then, itcontains a personalized greeting attending to the Attitudi-nal taxonomy, and the generated linguistic advice about theconsumption of the household attending to three differentaspects: general, specific (by parts of the day) and standbyconsumption.
In this example, the Report Template is as follows:
“Household ID:” {household id}
Fig. 9 Report template that linguistically describes the energyconsumption
“Analyzed period: from” {initial day} “to”{final day}“Physical cluster:” {cluster definition}{greeting}“General Consumption:” {salutationRG} {TRG}{adviceRG}“Specific Consumption:” {TRD} {TED} {TSD}“Standby Consumption:” {TRS} {adviceRS}.
In the Report Template, the quoted texts are includeddirectly in the final report. The components T in brackets,e.g., {TRG} or {greetingRG}, are calls to the correspondingtext generation algorithm. Here, the Report Template selectsthe sentence in T with the greatest validity degree and thesentence in {greeting} that corresponds with the associatedAttitudinal cluster.
An example of the personalized greeting call is:
switch {attitudinal cluster}
case 1 “Consumption oriented”: {greeting1}case 2 “Modern and passive” : {greeting2}case 3 “Modern and active” : {greeting3}case 4 “Traditional saver” : {greeting4}.
5 Discussion about illustrative examples
Aswe explained above, the attitudinal taxonomy offers infor-mation about the social behavior of the people living ineach household. This classification allows selecting specificReport Templates for dealing with each particular type ofconsumer. Moreover, the Physical taxonomy offers addi-tional information about the number of people living in thehousehold and what type of appliances they use. This allowsthe designer comparing households with similar character-istics and therefore giving more realistic information aboutthe household’s consumption.
123
Luciano Sanchez
Luciano Sanchez

Toward automatic generation of linguistic advice for saving energy at home 357
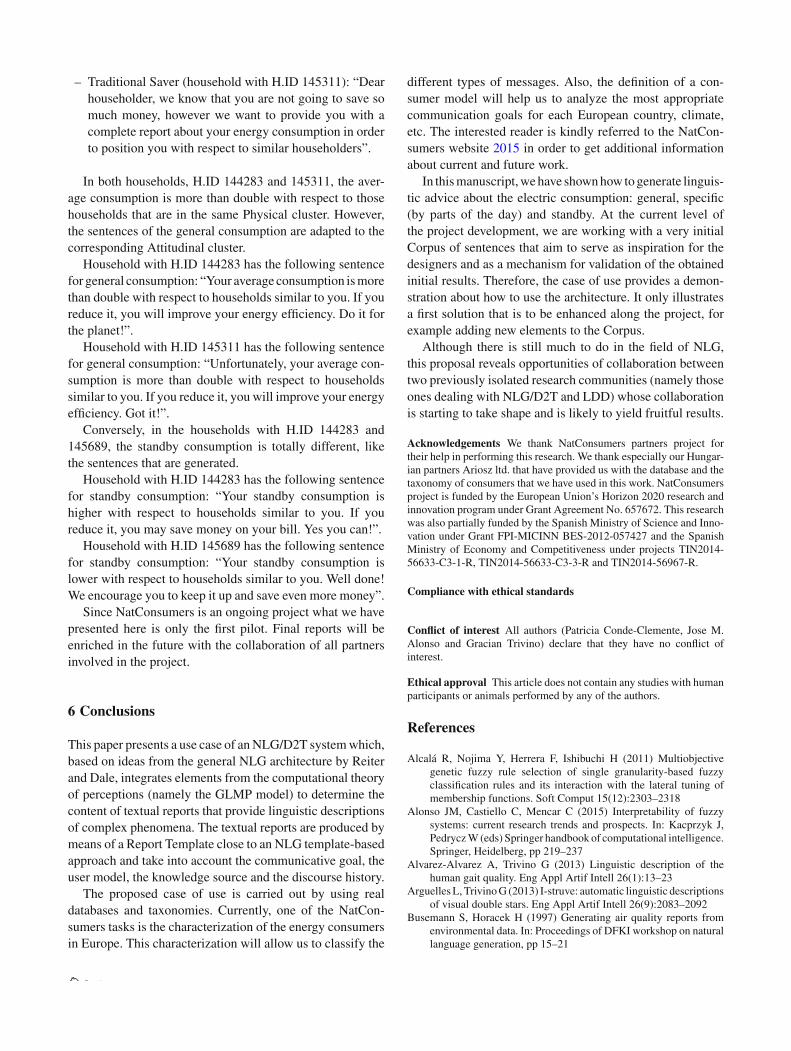
Fig. 10 Illustrative examples of customized linguistic advice. a Household with H.ID 144283, b household with H.ID 144263, c household withH.ID 145689 and d household with H.ID 145311
Taking into account these two classifications, and in orderto illustrate the richness of the reports,wehave generated cus-tomized linguistic advice for four households. They belongto different Attitudinal clusters but the same Physical one (inorder to make feasible a fair comparison among the givenreports).
We analyze their consumption data from January to Feb-ruary 2014, paying attention to the consumption in threegranularity levels: (1) General, (2) Specific (by parts of theday) and (3) Standby. Figure 10 shows the generated advice.Attending to the Attitudinal taxonomy, the household with id144283 is ConsumedOriented, the householdwith id 144263is Modern and Passive, the household with id 145689 isModern and Active, and the household with id 145311 isTraditional Saver. Attending to the Physical taxonomy, allhouseholds live in a flat with maximum 2 adults with somesystems, e.g., boiler and air-conditioning.
Linguistic advice is customized depending on the con-sumer model (Attitudinal taxonomy) and the energy con-sumption. For example, the greetings part of the template
regards the Attitudinal taxonomy of the household as fol-lows:
– Consumption Oriented (household with H.ID 144283):“Dear householder, we know that you are not very con-cerned with energy consumption but we would like toprovide you a set of tips to improve the sustainability ofthe planet”.
– Modern and Passive (household with H.ID 144263):“Dear householder, we know that you are conscious withthe environment and the sustainability of the planet butmay be you do not practice enough energy saving tech-niques. Thus, we provide you a report with some tips thatare likely to help you to improve your energy consump-tion”.
– Modern and Active (household with H.ID 145689):“Dear householder, we know that you are conscious withthe environment and the sustainability of the planet, sowe provide you a report with some advice that will helpyou to improve your energy consumption even more”.
123
Luciano Sanchez
Luciano Sanchez
358 P. Conde-Clemente et al.
– Traditional Saver (household with H.ID 145311): “Dearhouseholder, we know that you are not going to save somuch money, however we want to provide you with acomplete report about your energy consumption in orderto position you with respect to similar householders”.
In both households, H.ID 144283 and 145311, the aver-age consumption is more than double with respect to thosehouseholds that are in the same Physical cluster. However,the sentences of the general consumption are adapted to thecorresponding Attitudinal cluster.
Household with H.ID 144283 has the following sentencefor general consumption: “Your average consumption ismorethan double with respect to households similar to you. If youreduce it, you will improve your energy efficiency. Do it forthe planet!”.
Household with H.ID 145311 has the following sentencefor general consumption: “Unfortunately, your average con-sumption is more than double with respect to householdssimilar to you. If you reduce it, you will improve your energyefficiency. Got it!”.
Conversely, in the households with H.ID 144283 and145689, the standby consumption is totally different, likethe sentences that are generated.
Household with H.ID 144283 has the following sentencefor standby consumption: “Your standby consumption ishigher with respect to households similar to you. If youreduce it, you may save money on your bill. Yes you can!”.
Household with H.ID 145689 has the following sentencefor standby consumption: “Your standby consumption islower with respect to households similar to you. Well done!We encourage you to keep it up and save even more money”.
Since NatConsumers is an ongoing project what we havepresented here is only the first pilot. Final reports will beenriched in the future with the collaboration of all partnersinvolved in the project.
6 Conclusions
This paper presents a use case of anNLG/D2T systemwhich,based on ideas from the general NLG architecture by Reiterand Dale, integrates elements from the computational theoryof perceptions (namely the GLMP model) to determine thecontent of textual reports that provide linguistic descriptionsof complex phenomena. The textual reports are produced bymeans of a Report Template close to an NLG template-basedapproach and take into account the communicative goal, theuser model, the knowledge source and the discourse history.
The proposed case of use is carried out by using realdatabases and taxonomies. Currently, one of the NatCon-sumers tasks is the characterization of the energy consumersin Europe. This characterization will allow us to classify the
different types of messages. Also, the definition of a con-sumer model will help us to analyze the most appropriatecommunication goals for each European country, climate,etc. The interested reader is kindly referred to the NatCon-sumers website 2015 in order to get additional informationabout current and future work.
In thismanuscript,wehave shownhow togenerate linguis-tic advice about the electric consumption: general, specific(by parts of the day) and standby. At the current level ofthe project development, we are working with a very initialCorpus of sentences that aim to serve as inspiration for thedesigners and as a mechanism for validation of the obtainedinitial results. Therefore, the case of use provides a demon-stration about how to use the architecture. It only illustratesa first solution that is to be enhanced along the project, forexample adding new elements to the Corpus.
Although there is still much to do in the field of NLG,this proposal reveals opportunities of collaboration betweentwo previously isolated research communities (namely thoseones dealing with NLG/D2T and LDD) whose collaborationis starting to take shape and is likely to yield fruitful results.
Acknowledgements We thank NatConsumers partners project fortheir help in performing this research. We thank especially our Hungar-ian partners Ariosz ltd. that have provided us with the database and thetaxonomy of consumers that we have used in this work. NatConsumersproject is funded by the European Union’s Horizon 2020 research andinnovation program under Grant Agreement No. 657672. This researchwas also partially funded by the Spanish Ministry of Science and Inno-vation under Grant FPI-MICINN BES-2012-057427 and the SpanishMinistry of Economy and Competitiveness under projects TIN2014-56633-C3-1-R, TIN2014-56633-C3-3-R and TIN2014-56967-R.
Compliance with ethical standards
Conflict of interest All authors (Patricia Conde-Clemente, Jose M.Alonso and Gracian Trivino) declare that they have no conflict ofinterest.
Ethical approval This article does not contain any studies with humanparticipants or animals performed by any of the authors.
References
Alcalá R, Nojima Y, Herrera F, Ishibuchi H (2011) Multiobjectivegenetic fuzzy rule selection of single granularity-based fuzzyclassification rules and its interaction with the lateral tuning ofmembership functions. Soft Comput 15(12):2303–2318
Alonso JM, Castiello C, Mencar C (2015) Interpretability of fuzzysystems: current research trends and prospects. In: Kacprzyk J,PedryczW(eds) Springer handbook of computational intelligence.Springer, Heidelberg, pp 219–237
Alvarez-Alvarez A, Trivino G (2013) Linguistic description of thehuman gait quality. Eng Appl Artif Intell 26(1):13–23
ArguellesL, TrivinoG (2013) I-struve: automatic linguistic descriptionsof visual double stars. Eng Appl Artif Intell 26(9):2083–2092
Busemann S, Horacek H (1997) Generating air quality reports fromenvironmental data. In: Proceedings of DFKI workshop on naturallanguage generation, pp 15–21
123
Luciano Sanchez
Luciano Sanchez
Toward automatic generation of linguistic advice for saving energy at home 359
Cambria E, White B (2014) Jumping NLP curves: a review of naturallanguage processing research. IEEE Comput Intell Mag 9(2):48–57
Castillo-Ortega R, Marín N, Sánchez D (2010) Time series comparisonusing linguistic fuzzy techniques. Proceedings of the 13th inter-national conference on information processing and managementuncertainty. Springer, Berlin, pp 330–339
Castillo-Ortega R, Marín N, Sánchez D (2011) A fuzzy approach to thelinguistic summarization of time series. J Mult Valued Log SoftComput 17(2–3):157–182
Castillo-Ortega R, Marín N, Sánchez D (2011) Linguistic queryanswering on data cubes with time dimension. Int J Intell Syst26(10):1002–1021
Coch J (1998) Interactive generation and knowledge administration inMultiMeteo. In: Proceedings of the 9th international workshop onnatural language generation, pp 300–303
Cordón O, Herrera F, Hoffmann F, Magdalena L (2001) Genetic fuzzysystems: evolutionary tuning and learning of fuzzy knowledgebases, vol. 19. Advances in fuzzy systems—applications and the-ory World Scientific Publishing, Singapore
Delgado M, Ruiz MD, Sánchez D, Vila MA (2014) Fuzzy quantifica-tion: a state of the art. Fuzzy Sets Syst 242:1–30
Dhar V (2013) Data science and prediction. Commun ACM 56(12):64–73
de Oliveira JV (1999) Semantic constraints for membership functionoptimization. IEEE Trans Syst Man Cybern A 29(1):128–138
Gatt A, Marín N, Portet F, Sánchez D (2016) The role of graduality forreferring expression generation in visual scenes. Springer Interna-tional Publishing, Cham, pp 191–203
Gatt A, Portet F (2016) Multilingual generation of uncertain temporalexpressions from data: a study of a possibilistic formalism and itsconsistency with human subjective evaluations. Fuzzy Sets Syst285:73–93
Goldberg E, Driedger N, Kittredge RI (1994) Using natural-languageprocessing to produce weather forecasts. IEEE Expert 9(2):45–53
Kacprzyk J, Wilbik A, Zadrozny S (2008) Linguistic summarization oftime series using a fuzzy quantifier driven aggregation. Fuzzy SetsSyst 159(12):1485–1499
Kacprzyk J, Yager RR (2001) Linguistic summaries of data using fuzzylogic. Int J Gen Syst 30:133–154
Kacprzyk J, Yager R, Zadrozny S (2000) A fuzzy logic based approachto linguistic summaries of databases. Int J Appl Math Comput Sci10:813–834
Kacprzyk J, Zadrozny S (2010) Computing with words is an imple-mentable paradigm: fuzzy queries, linguistic data summaries andnatural language generation. IEEE Trans Fuzzy Syst 18(3):461–472
Kittredge R, Polguére A, Goldberg E (1986) Synthesizingweather fore-casts from formated data. In: Proceedings of the 11th conferenceon computational linguistics, pp 563–565
LosadaDE,Díaz-HermidaF,BugarínA,BarroS (2004)Experiments onusing fuzzy quantified sentences in adhoc retrieval. In: Proceedingsof the ACM symposium applied computing, pp 1059–1064
Marín N, Sánchez D (2016) On generating linguistic descriptions oftime series. Fuzzy Sets Syst 285:6–30
Mencar C, Fanelli A (2008) Interpretability constraints for fuzzy infor-mation granulation. Inf Sci 178(24):4585–4618
Menendez C, Eciolaza L, Trivino G (2014) Generating advices withemotional content for promoting efficient consumption of energy.Int J Uncertain Fuzziness Knowl Based Syst 22(5):677–697
NatConsumers European project: (2015). http://www.natconsumers.eu.Accessed 19 Oct 2016
Portet F, Reiter E, Gatt A, Hunter J, Sripada S, Freer Y, Sykes C (2009)Automatic generation of textual summaries from neonatal inten-sive care data. Artif Intell 173(7–8):789–816
Ramos-Soto A, Bugarín A, Barro S (2016) On the role of linguisticdescriptions of data in the building of natural language generationsystems. Fuzzy Sets Syst 285:31–51
Ramos-Soto A, Bugarín A, Barro S, Díaz-Hermida F (2013) Automaticlinguistic descriptions of meteorological data. A soft computingapproach for converting open data to open information. In: Pro-ceedings of the 8th Iberian conference on information systems andtechnologies (CISTI)
Ramos-Soto A, Bugarín AJ, Barro S, Taboada J (2015) Linguisticdescriptions for automatic generation of textual short-termweatherforecasts on real prediction data. IEEETrans Fuzzy Syst 23(1):44–57
Reiter E, Dale R (2000) Building natural language generation systems,vol 33. Cambridge University Press, Cambridge
Sanchez-Valdes D, Alvarez-Alvarez A, Trivino G (2016) Dynamic lin-guistic descriptions of time series applied to self-track the physicalactivity. Fuzzy Sets Syst 285:162–181
TrivinoG,Sanchez-ValdesD (2015)Generation of linguistic advices forsaving energy: architecture. In: Proceedings of the 4th internationalconference theory and practice of natural computing, pp 83–94
Trivino G, Sugeno M (2013) Towards linguistic descriptions of phe-nomena. Int J Approx Reason 54(1):22–34
van Deemter K (2009) Utility and language generation: the case ofvagueness. J Philos Log 38(6):607–632
van Deemter K (2016) Computational models of referring: a study incognitive science. MIT Press, Cambridge
Yager RR (1982) A new approach to the summarization of data. Inf Sci28:69–86
Yager RR (1995) Fuzzy summaries in database mining. In: Proceedingsof the 11th conference on artificial intelligent for applications, pp265–269
Zadeh LA (1983) A computational approach to fuzzy quantifiers innatural languages. Comput Math Appl 9:149–184
Zadeh LA (1996) Fuzzy sets and information granularity. In: Klir GJ,Yuan B (eds) Fuzzy sets, fuzzy logic, and fuzzy systems. WorldScientific Publishing Co., Inc, River Edge, NJ, pp 433–448
Zadeh LA (1999) From computing with numbers to computing withwords–from manipulation of measurements to manipulation ofperceptions. IEEE Trans Circuits Syst I 45(1):105–119
Zadeh LA (2002) Toward a perception-based theory of probabilis-tic reasoning with imprecise probabilities. J Stat Plann Inference105:233–264
Zadeh LA (1994) Soft computing and fuzzy logic. IEEE Softw11(6):48–56
123
Luciano Sanchez
Luciano Sanchez