TOWARD A VmTUAL-LABO..SYSTEM FOR METABOLIC...
12
304 TOWARD A VmTUAL-LABO..SYSTEM FOR METABOLIC ENGINEERING: DEVELOPMENT OF BIOCHEMICAL ENGINEERING SYSTEM ANALYZING TOOL-KIT (BEST-KIT) M. OKAMOTOC\ Y. MORITA, D. TOMINAGA, K. TANAKA, N. KINOSHITA, J-I. UENO, Y. MIURA Department oj Biochemical Engineering and Science, Kyushu Institute oj Technology, Iizuka-c.ity, Fukuoka 820, Japan Y. MAKI, Y. EGUCHI Research Institute, Mitsui Knowledge Industry Co" Ltd" 7-14, 2-Chome, Higashinakano, Nakano-ku, Tokyo 164, Japan BEST-KIT is an efficient and user-friendly "biochemical engineering system ana- lyzing tool-kit" integrated the following key modules: 1) mathematical modeling and editing of reaction-scheme, 2) automatic derivation of differential equations, 3) numerical calculation, 4)nonline.v optimization, 5) visualization, 6) retrieve the information on reaction mechanism and kinetic parameters from data-base of metabolic pathways, The users of this simulator are assumed to be unfamiliar with computer technology and with computer programming, The integrated interface (UNIX version) is based on Xlib, XToolldt and OSF /Motif Widget. 1 Introduction True understanding of complexity in bioprocess reaction network requires new approaches to both mathematical modeling and system analysis by using user- friendly computer simulator, Since most biochemical and bioprocess phenom- ena are the result of synergistic interactions among the components of reaction networks, any viable approach must be based on a nonlinear formalism whose structure permits efficient evaluation, even if the number of components and reaction process is relatively large 1. One of the pioneers of development of metabolic pathway simulator was David Garfinkel 2. Since the original devel- opment of Garfinkel's BIOSSIM, a number of other metabolic simulators have been written, for example, SCoP 3, MetaModel 4, ESSYNS 5 , SCAMP 6, On the other hand, a rapid increase in CPU capability of recent prevailing com- puter enables us to analy~e the dynamic property of a large scaled network system. Furthermore, a design of efficient graphical user interface (GUI) can make our interaction with computers easier and more productive. This study aims to the implementation of an efficient and user-friendly "biosimulator for GTo whom coJTe8pondenceshould be addressed. fe-mail): [email protected], (fax): +81-948-29-7801
Transcript of TOWARD A VmTUAL-LABO..SYSTEM FOR METABOLIC...
304
TOWARD A VmTUAL-LABO..SYSTEM FOR METABOLICENGINEERING: DEVELOPMENT OF BIOCHEMICAL
ENGINEERING SYSTEM ANALYZING TOOL-KIT (BEST-KIT)
M. OKAMOTOC\ Y. MORITA, D. TOMINAGA, K. TANAKA, N. KINOSHITA,J-I. UENO, Y. MIURA
Department oj Biochemical Engineering and Science,Kyushu Institute oj Technology, Iizuka-c.ity, Fukuoka 820, Japan
Y. MAKI, Y. EGUCHIResearch Institute, Mitsui Knowledge Industry Co" Ltd"
7-14, 2-Chome, Higashinakano, Nakano-ku, Tokyo 164, Japan
BEST-KIT is an efficient and user-friendly "biochemical engineering system ana-lyzing tool-kit" integrated the following key modules: 1) mathematical modelingand editing of reaction-scheme, 2) automatic derivation of differential equations,3) numerical calculation, 4)nonline.v optimization, 5) visualization, 6) retrievethe information on reaction mechanism and kinetic parameters from data-base ofmetabolic pathways, The users of this simulator are assumed to be unfamiliar withcomputer technology and with computer programming, The integrated interface(UNIX version) is based on Xlib, XToolldt and OSF /Motif Widget.
1 Introduction
True understanding of complexity in bioprocess reaction network requires newapproaches to both mathematical modeling and system analysis by using user-friendly computer simulator, Since most biochemical and bioprocess phenom-ena are the result of synergistic interactions among the components of reactionnetworks, any viable approach must be based on a nonlinear formalism whosestructure permits efficient evaluation, even if the number of components andreaction process is relatively large 1. One of the pioneers of development ofmetabolic pathway simulator was David Garfinkel 2. Since the original devel-opment of Garfinkel's BIOSSIM, a number of other metabolic simulators havebeen written, for example, SCoP 3, MetaModel 4, ESSYNS 5 , SCAMP 6, Onthe other hand, a rapid increase in CPU capability of recent prevailing com-puter enables us to analy~e the dynamic property of a large scaled networksystem. Furthermore, a design of efficient graphical user interface (GUI) canmake our interaction with computers easier and more productive. This studyaims to the implementation of an efficient and user-friendly "biosimulator for
GTo whom coJTe8pondenceshould be addressed. fe-mail): [email protected],(fax): +81-948-29-7801

305
analyzing a large scaled nonlinear reaction network such as metabolic path-ways" integrated the following key modules: 1) mathematical modeling andediting of reaction scheme, 2) automatic derivation of differential equations,3) estimation of skeletal reaction scheme from several experimental data, 4)numerical calculation, 5) visualization, 6) nonlinear optimization, 7) retrievethe information on reaction mechanism and kinetic parameters from data-baseof metabolic pathways. These seven features are integrated in BEST-KIT. WeasSume the users of this simulator, BEST-KIT, are unfamiliar with computertechnology and with computer programming. The integrated interface (UNIXversion) is based on Xlib, XToolkit and OSF/Motif Widget 7.
2 Design of BEST-KIT
2.1 Mathematical modeling and editing of reaction scheme
There are two remarkable properties in this module, (i) using the pointingdevice such as 'mouse', the users can easily design and update an arbitraryreaction scheme in the editing window (working area) through an efficientGUI (Graphical User Interface). The constructed scheme can be saved as afile-style and can be easily loaded to the editing-window. Furthermore, sincethe graphical pictures of metabolic pathways are saved in the simulator, theusers can easily clip a certain reaction scheme or reaction network from givengraphical pictures. (ii) a large scaled system consists of a number of small sizedsub-systems. The users can easily design a large scaled system by connectingsub-systems each other. We shall describe how to edit the reaction scheme.The following enzymatic reaction system is discussed as an example:
kl ks ks
E + S ~ ESl ;:::: ES2 ~ E + Pk2 k4
(Scheme 1)The procedure for editing this scheme is as follows: Selected "put reactantsymbol" button in the menu, the users can assign the position of reactionspecies (reactant) by clicking arbitrary position with the 'mouse' on workingarea of editing-window. As for the case of scheme 1, since the total number ofreactants is 5, five reactant symbols (elements) are arranged in editing-window.Each reactant symbol has four areas such that, i) abbreviated name: this areadisplays abbreviated reactant's name (changeable), ii) start bottom: this area,displayed "start", indicates 'reactant' or 'substrate', ill) end button: this area,displayed "end", shows 'product', iv) initial concentration: the users have to set

306
Figure 1: Screen-dump of editing-window for scheme 1.
initial concentration of each reactant in order to solve the numerical solution ofa set of simultaneous differential equations. For example, the reaction processE + S ~ ES1, where enzyme E combines substrate S and leading to the inflowof ES1, can easily be represented as follows: Click the "start" buttons in Eand S symbols followedby clicking "end" button in ES1 symbol. After clickingthe mouse in arbitrary position and checking connection condition, connectedline between the symbols (E, S, ES1) is automatically drawn and k1-symbol(symbol for rate constant of its reaction step) is assigned. Fig. 1 is the screendump of editing-window for scheme 1. The users can modify the scheme byselecting the button of "add substrate", "add product", "cut connection" or"delete symbol". The constructed scheme can be saved as a file-style and canbe easily loaded to the editing-window.
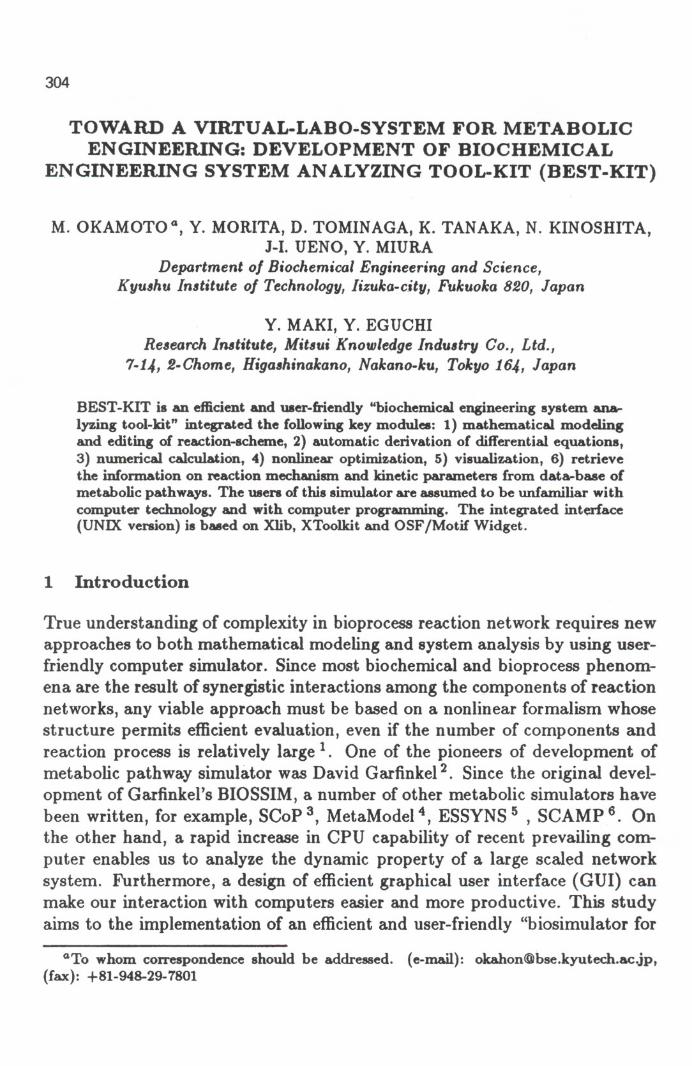
We mainly target the dynamic analysis of a large scaled system consist-ing of a number of interdependent and resource-sharing subnetwork. In themodeling and editing of such a larger scaled system, the assumption that alarge scaled system consists of several small-sized subnetwork will save a lot oflabor; Fig. 2 shows an example of a large scaled system. The users can dividea large scaled system into arbitrary small-sized subnetwork (subnetwork 1 to4 in this case). The following procedures represent how to make a large scaled
. system such as Fig. 2: (1) by clickingthe button of "put subnetwork symbol",put the symbols of subnetwork 1 to 4 in editing window, (2) open the windowof each subnetwork and make the reaction scheme within the subnetwork, (3)open the every window of subnetwork 1 to 4 and connect .the lines among thesesubnetworks. Fig. 3 is the screen dump of .editing-window'for the scheme ofFig. 2. By using such procedures to make large scaled system, we can easily
El ~51---"P1 .. 5z
kl~
E2""P2
Jkgqkl
P~54 .ck P3': 53E4 12 E3
307
Sub Network! Sub Network2
E252 . P2
ks
Sub Network4
P3 II $3E3
.
Sub Network3
Figure 2: Example of analysis of a large scaled system. Left-hand, whole system; right-hand,dividing into subnetwork:
edit a large reaction network such as pathways of glycolysis.
2.2 A utomatic derivation of differential equations
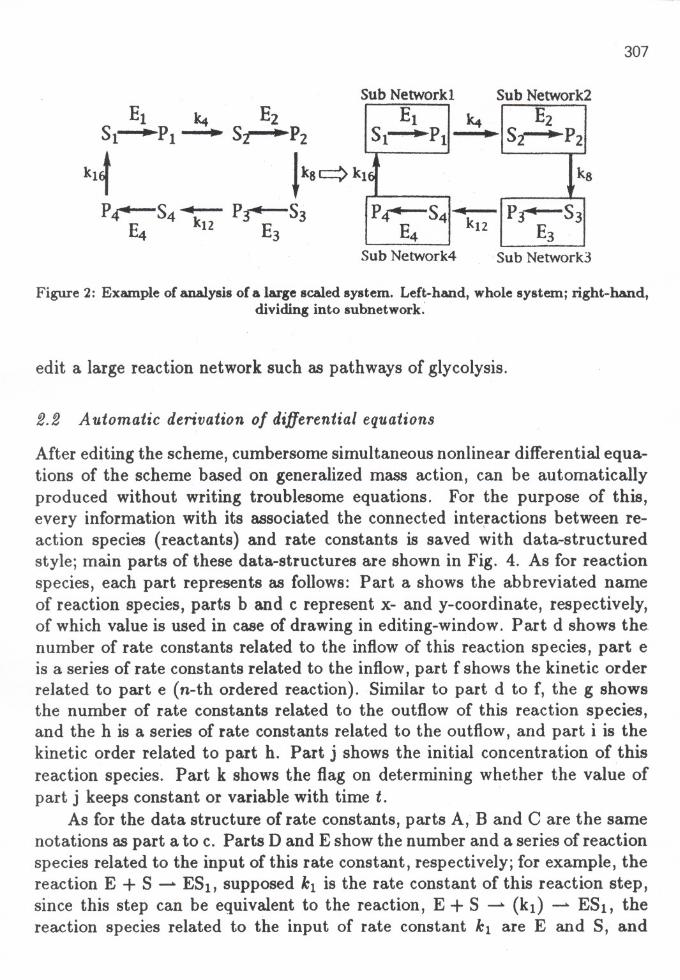
After editing the scheme, cumbersome simultaneous nonlinear differential equa-tions of the scheme based on generalized mass action, can be automaticallyproduced without writing troublesome equations. For the purpose of this,every information with its associated the connected inte,ractions between re-action species (reactants) and rate constants is saved with data-structuredstyle; main parts of these data-structures are shown in Fig. 4. As for reactionspecies, each part represents as follows: Part a shows the abbreviated nameof reaction species, parts b and c represent x- and y-coordinate, respectively,of which value is used in case of drawing in editing-window. Part d shows thenumber of rate constants related to the inflow of this reaction species, part eis a series of rate constants related to the inflow, part f shows the kinetic orderrelated to part e (n-th ordered reaction). Similar to part d to f, the g showsthe number of rate constants related to the outflow of this reaction species,and the h is a series of rate constants related to the outflow, and part i is thekinetic order related to part h. Part j shows the initial concentration of thisreaction species. Part k shows the flag on determining whether the value ofpart j keeps constant or variable with time t.
As for the data structure of rate constants, parts A, Band C are the samenotations as part a to c. Parts D and E show the number and a series of reactionspecies related to the input of this rate constant, respectively; for example, thereaction E + S -.. ESt, supposed k1 is the rate constant of this reaction step,since this step can be equivalent to the reaction, E + S -.. (kt) ESt, thereaction species related to the input of rate constant k1 are E and S, and
EI14.51 . )II PI
P 54 "'k12E4

308
'-'--". ..._-
eEl
-- .
' n_..-..t77::"=
... n._.' . .' .. "----
Figure 3: Screen-dump representing the equivalent system to that of Fig. 2 The centerpart shows the interconnections of subnetwork 1 to 4. The corner windows represent the
interconnections of reactants within each subnetwork.
1) reaction species
a)
b)
c)
d)
e)
f)
g)
h)
J.)
j)
k)
. ........
a series ofreachonspecies relatedto the input
a seriesofreactionspecies relatedto the output
Figure 4: Data-skucture of reaction species and rate constants for automatic derivation ofrate equations based on generalized mass action.
2) rate constant
A)
B)
C)
D)a series of rateconstants relatedto the input E)
F)kinetic orderrelated to e)
series of rateconstants relatedto the output
kinetic orderrelated to h)
G)
B)
name
X-coordinate
Y-coordinate
numberof rateconstantsrelatedto the input I)
........... ............
.......... ............. r-.-
number of rateconstants relatedto the output !....
.......................
............... ........
initial concentration
constant or variable
name
X-coordinate
Y-coordinate
number of reactionspecies relatedto the input J',.......................
number of reactionspecies relatedto the output......... .............. ¥
value
A) It, AI II. AI8) B) B)----CI ~ CI CI ----01 t DI t 0)E) 3 E) 41 1 E) 4FI n t FI 2G) 4 G) 31 I GI t ,HI HI H) ----
Figure 5: Data-structure of acheme 1 ACcordingto the style of Fig. 4. The part a) throughk) and A) through H) corresponds to that of Fig. 4.
the reaction species related to the output of the k1 is ES1. Parts F and Gshow the number and a series of reaction species related to the output of thisrate constant, respectively. Part H represents the value of this rate constant.According to the style of data-structure shown in Fig. 4, the data-structuresfor scheme 1 can be represented in Fig. 5, which are automatically saved indisk space after the procedures of "scheme-editing module" described above.The followings represent the procedures of automatic derivation of differentialequations of scheme 1: Focused on the reaction step E + S -" ESI in scheme1, this step can be divided into 2-steps such that E + S -" (k1) -" ESI. As forthe outflow of the reaction species 1 (denotes E (enzyme» in Fig. 5, since thevalue of part g is 1, the data of part h, that is k1, is assigned, which leads tothe reading the value of part D in the data-structure for k1. The value of thispart is 2, which means two kinds of reaction species are related to the inputof k1; in part E, reaction species 1 and 2 are assigned. Considered the kineticorder (part i of both reaction species 1 and 2), the ([EP . [SP) is the inputto the k1, and the k1([EP . [SP) corresponds to the outflow term of reactionspecies 1 (E, enzyme); the term -k1([E]l . [SP) is automatically added to therate equation for E (= dE/tit). Repeated to this derivation procedure, thismodule can produce nonlinear simultaneous differential equationsssssssssssss
309
ITJ rn [l] m IT)
,' " .) " "§bl---- b) ---- b) ---- bl ---- bl----c) ---- c) ---- c) ---- cl ---- c)----d) 2 eI) ] d) 2 eI) 1 eI)
e)Un9)h)1)
j) IkII "wblo I k) vlriable
(§] [§] [§]

310
with reference to the data-structures shown in Fig. 5.
2.9 Estimation of skeletal reaction scheme from several experimental data
Organizationally complex systems such as metabolic pathways are comprisedof numerous, richly interacting .components. The details of the processes thatgovern expressions and interactions of these components usually are not known,but most of these processes are nonlinear. Consequently, their description re-quires a representation general enough to capture the essence of the observedresponse. One approach that satisfies this requirement is the "power-law for-malism)) I, 8 . The dynamics of a system can be represented by formulating thechange in each system component Xi as the difference between all influencesthat increase Xi and all influences that decrease Xi, Symbolically, the changein Xi can be represented as follows:
dXi;It = Fi+(X1,X2,...,Xn) - F/(XI,X2,... ,Xn)
(i= 1,2,...,n)
(1)
where, Xl through Xn are the system constituents, F/ and Fi- are positive-valued differentiable functions of which values can be nonlinearly approximat-ing by a product of power-law functions such that,
F.+I
n
= ai IIXf'jj=1
n
= PiII XJiji=1
Thus the equations that describe the dynamics of the system aren n
dXi IIX'ij a IIX hij(.
1 2 )-d = ai ; -"'i; t= , ,...,nt . 1 . 1J= J=
F.-I (i=1,2,...,n)
(2)
In a biochemical context, the nonnegative parameters ai and (3iare called rateconstants, and the real-valued exponents 9ij and hi; are referred to as kineticorders. The estimation of these parameter values (ai, (3i,9ij , hi;) is many casesthe bottleneck and matching the model to experimental data is almost neverstraightforward and almost always a real challenge. Furthermore, since thenumber of estimated parameters (ai, {3i,9ijJ hi; (i, j = 1,.. . ,n» in Eq.(2) willincrease with the number of system constituents (n-value), most nonlinearestimation programs become overwhelmed as soon as models with ten or 'more
311
3 3
2.5 2"
2 2
~ I" >i 1"
0.' 0"
00 2 4 6
11me8 10 12
00 2 4 6
11me8 10 12
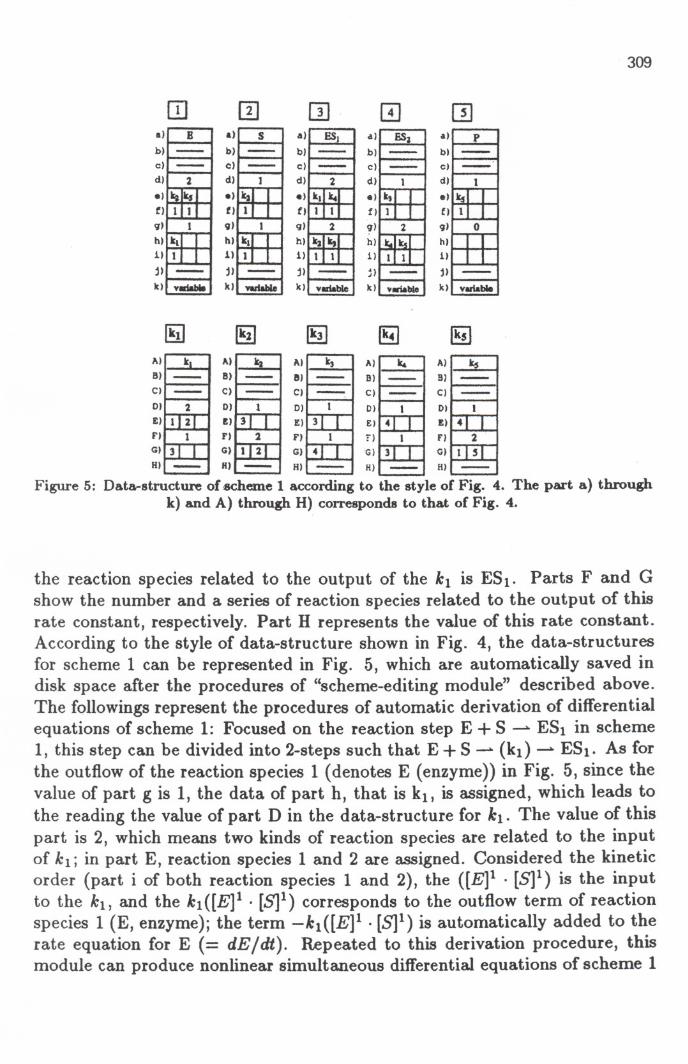
Figure 6: Given time-courses as experimentally observed temporal data. These two time-courses were obtained only by changing the initail concentrations of Xl to X 3.
1,Xl; 2,X2; 3,Xs.
parameters are to be fitted to the data; the number of estimated parametersin Eq.(2) is 2n(1 + n), where n is the number of system constituents. TheGenetic Algorithm9, 10,11was introduced as a nonlinear optimization methodwhich is much less likely to be stranded in local minima. Furthermore in thismodule, in order to find the skeletal structure (small sized system) of power-lawformalism (Eq.(2» matching to the experimental data, some of the parametersof which absolute values are less than a given threshold value are to be removedduring the optimization procedures. By introducing this algorithm, optimizedessential power-law model matching to experimental data can be discovered.
In order to examine the effectiveness of our proposed procedures, theywere applied to the following test case: The observed time-courses of Xl, X2,X3 are shown in Fig. 6. Supposed that these time-courses were given as ex-perimental data, we examined whether our proposed optimization procedurescould explore and estimate the combination of parameters which can providethe best fitted time-courses shown in Fig. 6. Since the number of n in Eq.(2) is 3, the number of estimated parameters should be 24. We adopted herethe effective numerical calculation method for solving a set of simultaneousdifferentail euqations developed by Irvine and Savageau 12.
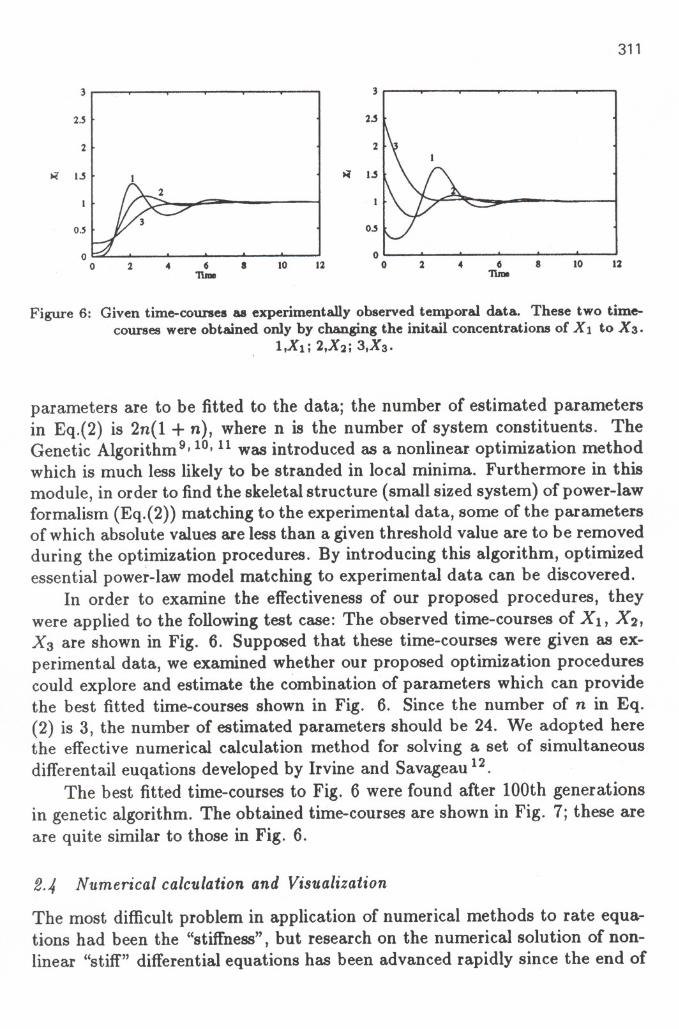
The best fitted time-courses to Fig. 6 were found after tOOth generationsin genetic algorithm. The obtained time-courses are shown in Fig. 7; these areare quite similar to those in Fig. 6.
2.4 Numerical calculation and Visualization
The most difficult problem in application of numerical methods to rate equa-tions had been the "stiffness", but research on the numerical solution of non-linear "stiff" differential equations has been advanced rapidly since the end of

312
3 3
2.5 2.5
2 2
~ 1.5 ~ 1.5
0.5
00 2 4 CI
'I1me. 10 12
00 2 4 CI
'I1me. 10 12
Figure 7: Obtained calculatedtime-coursesby our proposed method. l,Xl; 2,X2i 3,X3.
1960s. We adopt here the Gear method 13, which is accepted as one of themost general and efficient procedures to solve the "stiff" differential equations.
The users can easily get dynamic response (time-course) and phase-planediagram of given reaction species in X-window space.
2.5 Nonlinear optimization
Optimization is a pure mathematical procedure for evaluation of unknownkinetic parameters from a given model scheme and observed concentrationchanges in reaction species. As a tool of the nonlinear optimization, we adoptthe hybrid numerical optimization techniquJo incorporated the Genetic Algo-rithm (GA) into the,Modified Powell method combined with the Rosenbrockmethod. Escaped from the trapping in local minimum, this procedure can seekout the global minimum with considerably fast convergence. The estimatedvalue can be minimize the value of the following objective function (F):
imGZ (EZPi)mGz
(C I E
)2
E E a .. - XP ' .F =IJ IJ
Ex p "
i=1 i =1 IJ
(3)
where, imaz is the number of experimentally observed reactants, (EXPi)maa:is the total number of experimental data (concentration change) for reactant(EZPi) , and EXPij shows the j-th experimental data (concentration change)for reactant (EXPi), Calii is the j-th calculated value (concentration change)for reactant (EXPi). Fig. 8 shows the snap-shot of optimization window.

313
j:ii
r......1.-01
......-. ~ 'Jo.q,
,/ ..::::;:- "'07:/ n'c.l-'
~ ,)/ n.,., 7"07. ~/:/ s."q/
,-~
~~' :.::
./,/ ,
/' ,
I.' ~ 2JII
h: ~.,"" ~' " . :~ I...' , ",.,,- , '. . ' - .' -: : ::c- . ~0 - 0'?'~"."I""'lOlo"O"""""""'"
,,-. [,""', 0 11- 100<1
-~'_too.. ' s
:Ie0'
(I"c..-\J'...-~ ~~'c.l-
E t '.,. ', rC",.I-\
f"'"
or; ",.1
.\ ~I'". '
I~'/'
I \i .'.-oS
Figure 8: Snap-shot of optimization procedures. After the automatic estimation (opti-mization) of rate parameters, of which values are best fitted to the experimental data, thecomparison bet ween the calculated time-course of every reactant and experimental data can
be visualized in the lower windows,
2,6 Retrieve the information on reaction mechanism and kinetic parametersfrom data-base of metabolic pathways
This module is now under construction, however, by saving the graphical pic-tures of metabolic pathways in the simulator, the users can easily clip a certainfragment of reaction network from a given graphical picture and can examinethe dynamics of that system by using the modules described above. Further-more, through the graphical pictures and Internet World-Wide-Web (WWW),the users can retrieve and pick up the every information on the reaction mech-anism of a given reaction network and reported kinetic parameters from sev-eral network-sites of database on metabolic pathways. Dr, Peter Karp andhis collaborators have developed a number of powerful and familiar visualiza-tions of metabolic data, such as automatically generated layouts of metabolicpathways (see the location, http://www.ai.sri.com/- pkarpjpathways.html).Through the graphical pictures and graphical user interface allows the usersnot only to query the knowledge database on metabolic information (enzyme,regulation mechanism, etc.) but also to analyze the dynamic modeling,
314
3 Discussion
BEST-KIT is one of general-purpose simulators of metabolic and nonlinearchemical networks. The program is written in C and the user who is not expertin computer technology can nevertheless analyze the dynamics of reaction net-works without writing troublesome rate equations even if the number of systemconstituents is very large. Furthermore even the case that the interaction mech-anisms between constituents of the system are not well known, the user canformulate the system's representation based on power-law formalism matchingto the experimental data. Most of the modules except datarbase module havealready developed and they are integrated in BEST-KIT through the integratedinterface (UNIX version) based on Xlib, XToolkit and OSF /Motif Widget. Weare planning to put BEST-KIT on our Internet WWW server for open usage.Our final goal is the development of virtual-Iab~system in metabolic engi-neering. Without such an efficient tool or system, those who want to analyzethe dynamics of the complex system have to look up the references on thissystem first in order to collect the kinetic data and information on interactionmechanism between constituents, followed by writing the troublesome complexnonlinear rate equations to set up mathematical model of the system. Sincethe computer programming requires numerous special techniques, those whoare unfamiliar with programming are apt to abstaining from theoretical workson metabolic engineering. The development of efficient virtual-Iabo-systemon metabolic engineering will propose a new type of research to many of theexperimental biochemists.
Acknowledgment
This study was performed through the Scientific Funds of the Frontier Re-search in Telecommunications of Ministry of Posts and Telecommunications,Japan, and Tateishi Science and Technology Foundation, Japan, and the Ku-rata Foundation, Japan.
References
1. E.O. Voit, Canonical nonlinear modeling: S-system approach to under-standing complexity (Van Nostrand Reinhold, New York, 1991).
2. D. Garfinkel, A machine-independent language for the simulation of com-plex chemical and biochemical systems. Comput. Biomed. Res., 2, 31(1968).

315
3. J .M. Kootsey, Future directions in computer simulations. Bull. Math.BioI., 48, 405 (1986).
4. J .-H.S. Hofmeyr and K.J. van der Merwe, METAMOD: software forsteady-state modeling and control analysis of metabolic pathways on theBBC microcomputer. Comput. Applic. Biosci., 2, 243 (1986).
5. D.H. Irvine, S-systems: efficient solution of nonlinear models expressedin S-system canonical form. Math. Comput. ModeL, 11, 123 (1988).
6. H.M. Sauro, SCAMP: a general-purpose simulator and metabolic controlanalysis program. Comput. AppI. in Biosci., 9, 441 (1993).
7. Open Software Foundation, OSF/Motif programmer's reference (Rev.1.1) (Prentice-Hall, New Jersey, 1991).
8. M.A. Savageau, Biochemical system analysis: a study of function anddesign in molecular biology (Addison-Wesley, Reading, 1976).
9. L. Davis, Handbook of genetic algorithms (Van Nostrand Reinhold, NewYork, 1991).
10. M. Okamoto, T. Nonaka, S. Ochiai, and D. Tominaga, Nonlinear nu-merical optimization with use of a hybrid genetic algorithm incorporatedthe modified Powell method. Proc. IntI. Sympo. on Artificial Life andRobotics (1st AROB, ISBN:4-9900462-6-9), 89 (1996).
11. D. Tominaga, J-I. Ueno, Y. Miura, M. Okamoto, Discovery of a SkeletalNetwork Describing Complex Nonlinear Dynamics: Optimized EssentialModel for Temporal Input-Output Matching, Proceeding of 4th. IntI.Conf. on Soft Computing (World Scientific, New Jersey, in press).
12. D.H. Irvine, M.A. Savageau , Efficient solution of nonlinear ordinary dif-ferential equations expressed in S-system canonical form, SIAM J. NU-MER. ANAL. 27, 704 (1990).
13. C.W. Gear, Numerical initial value problems in ordinary differentialequations (Prentice-Hall, New Jersey, 1971).