
Toward a New Era of Trans-Pacific Energy · PDF file2 TOWARD A NEW ERA OF TRANS-PACIFIC...
82
Asia-Pacific Policy Papers Series TOWARD A NEW ERA OF TRANS-PACIFIC ENERGY INTERDEPENDENCE Edited by Kent E. Calder Johns Hopkins University The Paul H. Nitze School of Advanced International Studies tel. 202-663-5812 email: [email protected]
Transcript of Toward a New Era of Trans-Pacific Energy · PDF file2 TOWARD A NEW ERA OF TRANS-PACIFIC...

Asia-Pacific Policy Papers Series
TOWARD A NEW ERA OF TRANS-PACIFIC
ENERGY INTERDEPENDENCE
Edited by Kent E. Calder
Johns Hopkins University The Paul H. Nitze School of Advanced International Studies
tel. 202-663-5812 email: [email protected]

The Edwin O. Reischauer Center for East Asian Studies
Established in 1984, with the explicit support of the Reischauer family, the
Edwin O. Reischauer Center for East Asian Studies at the Paul H. Nitze
School of Advanced International Studies (SAIS) actively supports the
research and study of trans-Pacific and intra-Asian relations to advance
mutual understanding between North-east Asia and the United States.
The first Japanese-born and Japanese-speaking US Ambassador to
Japan, Edwin O. Reischauer (serv. 1961–66) later served as the center’s
Honorary Chair from its founding until 1990. His wife Haru Matsukata
Reischauer followed as Honorary Chair from 1991 to 1998. They both
exemplified the deep commitment that the Reischauer Center aspires to
perpetuate in its scholarly and cultural activities today.

Asia-Pacific Policy Papers Series
TOWARD A NEW ERA OF TRANS-PACIFIC
ENERGY INTERDEPENDENCE
Edited By Kent E. Calder

Asia-Pacific Policy Papers Series, No. 14
©2012 by the Edwin O. Reischauer Center for East Asian Studies
Johns Hopkins University–SAIS
1619 Massachusetts Avenue, NW
Washington, D.C. 20036
Tel. 202.663.5812 Fax: 202.663.5940
All rights reserved
Printed in Japan
Cover design by Automated Graphics Systems, Inc.,White Plains, Md.

TOWARD A NEW ERA OF TRANS-PACIFIC ENERGY
INTERDEPEPENDENCE:
TABLE OF CONTENTS
Foreword Kent E. Calder
Trans-Pacific Energy Trade:
A Canadian Perspective Yuen Pau Woo
Two Challenges for Energy Security
In the North Pacific Region Shoichi Itoh
Prospects for Trans-Pacific Energy Trade PECC
The Emerging Trans-Pacific Energy Economy:
Implications for Policy and Economic Partnership Kent E. Calder

ABOUT THE AUTHORS
KENT E. CALDER is Director of the Reischauer Center for East Asian Studies at SAIS/Johns
Hopkins University. He served previously as Special Advisor to the U.S. Ambassador to Japan,
and as Japan Chair at the Center for Strategic and international Studies. Before arriving at SAIS
in 2003, he taught at Princeton University for twenty years, and previously also at Harvard
University. He completed his PhD at Harvard University under the direction of Edwin O.
Reischauer.
YUEN PAU WOO is Director of the Asia-Pacific Institute of Canada, based in Vancouver,
British Columbia.
SHOICHI ITOH is Senior Researcher at the Institute of Energy Economics, Japan (IEEJ). He
previously served as Visiting Fellow at the Center for Strategic and International Studies (CSIS),
in Washington, D.C.
THE PACIFIC ECONOMIC COOPERATION COUNCIL (PECC) is one of the preeminent
trans-Pacific private-public cooperative research organizations. This paper is a supplement to the
PECC State of the Region report for 2011-2012, coordinated by Dr. Yuen Pau Woo.

1
TOWARD A NEW ERA OF TRANS-PACIFIC ENERGY INTERDEPENDENCE:
FOREWORD
Three quarters of a century ago, trans-Pacific energy trade was vigorous, with the United States
serving as one of Japan’s principal oil suppliers. Indeed, the abrupt American oil embargo of
1941, in response to Japan’s invasion of Indochina, was a major factor intensifying the
downward spiral toward war between the two major Pacific powers. For six decades and more
following war’s end, trans-Pacific energy interdependence was limited largely to coal and
nuclear power, although both Canada and the United States came to develop significant
relationships with Japan in those two vital energy areas. Indeed, Canada became Japan’s largest
uranium supplier, while the American and Japanese civilian nuclear industries came to be tightly
intertwined. Yet trans-Pacific gas trade in 2010 still accounted for only 0.3 percent of the
worldwide total, while trans-Pacific oil trade only constituted 1.2 percent of global totals.
This monograph chronicles and analyzes the dawning of a historic new era of deepened
and broadened interdependence in trans-Pacific energy relations. Two fateful developments
divide the past of trans-Pacific energy relations clearly from its future, and thus preface that new
chapter: the Fukushima nuclear tragedy, and the North American shale-gas revolution. The
former has, since March, 2011, dramatically constrained Japan’s energy supplies, while the latter
shows significant promise of expanding them. Both developments also inspire important new
trans-Pacific policy agendas who outlines and implications we are only just beginning to fully
grasp.

2 TOWARD A NEW ERA OF TRANS-PACIFIC ENERGY INTERDEPENDENCE
The contributions to follow consider both the momentous technical and economic
changes now newly underway in trans-Pacific energy relations, and also their policy implications
for Japan, Canada, and the United States. These three countries comprise an especially important
unit for energy analysis, as they are all both major democratic, capitalist nations, and also central
players in the political economy of global energy. The United States and Japan, after all, are two
of the three largest importers and consumers on earth. At the same time, the United States and
Canada are also two of the world’s largest oil and natural gas producers, whose productive roles
are both being enhanced by rapidly rising shale-gas production. Meanwhile, Japan’s role as the
largest liquefied natural gas (LNG) importer on earth is being further enhanced by the need for
alternate energy sources in the wake of the Fukushima nuclear accident, creating important new
complementarities with the Canadian and American roles as major energy exporters. And the
geopolitical issue of Iran sanctions, against a volatile nation that has traditionally been one of
Japan’s largest hydro-carbon suppliers, looms in the background as well.
The views presented are, as the reader will readily note, written from three distinctly
different national perspectives: those of Japan, Canada, and the United States. Yet they are
unified in their belief in the historic nature of the transformations now impending in trans-Pacific
energy relations, and the importance of market tools in dealing with them. They all agree that the
major changes in energy flows are likely three to four years away, at least: major capital
investments in energy have long lead times. Yet they also suggest that the impending changes,
especially in liquefied natural gas, could have momentous global impact. Most importantly,
expanded low-cost LNG exports from North America to Japan, and also to China and Korea,
could put substantial pressure on the oil price linkage in natural-gas contracts upon which Middle

3
Eastern suppliers have traditionally insisted, and which has kept Japanese LNG consumer prices
comparatively high.
The authors all note that some domestic interests in both Canada and the United States
are ambivalent about trans-Pacific hydro-carbon interdependence. Petro-chemical producers and
other domestic consumers benefitting from a decline in feedstock prices due to the shale-gas
revolution naturally desire to see the returns to declining hydrocarbon prices remain at home. Yet
the authors note that such domestic pressures are weaker in Canada than in the United States, and
that the two countries are inevitably competitors also in broader global markets. If the United
States fails to see the benefits of Northeast Asian markets and investments, Canada is very likely
to capitalize on U.S. inaction. The more constructive strategy for both nations, the papers
conclude, is thus for both countries to maintain open trade and investment policies with respect
to trans-Pacific energy, first and foremost with democratic allies such as Japan.
These papers were presented at the third trilateral conference on prospects for US-Japan-
Canada mini-lateral cooperation, hosted by the SAIS/Johns Hopkins University Reischauer
Center for East Asian Studies in Washington, D.C., and co-sponsored by the Japan Institute of
International Affairs (JIIA), and the Asia-Pacific Institute of Canada. The Washington
conference followed parallel sessions in Vancouver, Canada (October, 2009); and Tokyo, Japan
(August, 2010), from which many of the key ideas originally evolved. All three conferences
featured trans-Pacific energy issues as a central concern. The co-sponsors are deeply grateful for
the generous support, over the past three years, of the Japan Foundation’s Center for Global
Partnership. The editor is personally grateful, in particular, to three members of the Reischauer
Center, Mika Brooks, Shinichiro Ichiyama, and Izumi Sano, who contributed greatly to research
and publication. The editor is also most grateful to key colleagues in this project—JIIA director

4 TOWARD A NEW ERA OF TRANS-PACIFIC ENERGY INTERDEPENDENCE
Ambassador Yoshiji Nogami and Deputy Directors Naoko Saiki and Hideki Asari, as well as
Research Fellow Asuka Matsumoto, together with Asia Pacific Institute Director Dr. Yuen Pau
Woo, as well as to Ambassadors Jonathan Fried and Sadaaki Numata, who played a catalytic and
inspirational role at the very beginning.
Kent E. Calder
Washington, D.C.
June 23, 2012

YU
EN
PA
U W
OO
PR
ES
EN
TA
TI
ON
TO
JA
PA
N-U
S-C
AN
AD
A
TR
IL
AT
ER
AL
CO
OP
ER
AT
IO
N P
RO
JE
CT
WA
SH
IN
GT
ON
, D
C
8 M
AY
20
12
Tra
ns-
Pac
ific
En
ergy
Tra
de:
A
Can
adia
n P
ersp
ecti
ve

Th
e C
anad
ian
Oil
an
d G
as in
du
stry
A
ccou
nts
for
abou
t 7%
of G
DP
an
d 2
3% o
f exp
ort
sale
s, a
nd
em
plo
ys
mor
e th
an 3
50,0
00
Can
adia
ns.
In
20
11, c
rud
e oi
l was
Can
ada’
s m
ost
valu
able
exp
ort
com
mod
ity
wit
h s
ales
of
$50
bil
lion
. Gov
ern
men
t re
ven
ues
gen
erat
ed fr
om t
he
ind
ust
ry –
clo
se t
o $
22 b
illi
on in
20
11 -
- p
rovi
de
ind
isp
ensa
ble
sup
por
t fo
r th
e so
cial
pro
gram
s C
anad
ian
s ch
eris
h.
O
il a
nd
nat
ura
l gas
dev
elop
men
t wil
l pla
y a
role
in g
ener
atin
g go
vern
men
t re
ven
ues
wel
l in
to t
he
futu
re. T
he
econ
omic
con
trib
uti
on
of t
he
nat
ura
l gas
ind
ust
ry is
exp
ecte
d t
o be
$1.
3 tr
illi
on o
ver
a 25
yea
r p
erio
d, w
hil
e oi
l san
ds
and
con
ven
tion
al o
il d
evel
opm
ents
are
exp
ecte
d
to m
ake
a co
mbi
ned
con
trib
uti
on o
f $3.
2 tr
illi
on.
F
or a
n e
ner
gy e
xpor
tin
g co
un
try
wit
h a
bun
dan
t n
atu
ral r
esou
rces
, C
anad
a’s
big
ges
t ch
all
eng
e is
sec
uri
ty o
f in
tern
ati
on
al
dem
an
d f
or
ou
r re
sou
rces
. T
his
set
s u
s ap
art
from
oth
er G
7 co
un
trie
s an
d e
mer
gin
g ec
onom
ies
wh
ich
are
mor
e co
nce
rned
wit
h
secu
rity
of s
up
ply
.
Th
e ke
y to
sec
uri
ty o
f dem
and
is d
ive
rsif
ica
tio
n o
f m
ark
ets

Per
cen
tage
of
Can
ada’
s en
ergy
com
mod
ity
exp
orts
, by
val
ue,
des
tin
ed f
or t
he
US
20
06
2007
20
08
2009
20
10
Coal
7.7%
6.6%
3.9%
3.2%
5.2%
Crud
e Oil
(inclu
ding O
il Sa
nds)
99.8%
99
.4%
99.9%
99
.2%
99.5%
Natur
al Ga
s 10
0.0%
100.0
% 10
0.0%
100.0
% 10
0.0%
Total
95
.6%
95.9%
94
.3%
91.9%
91
.9%
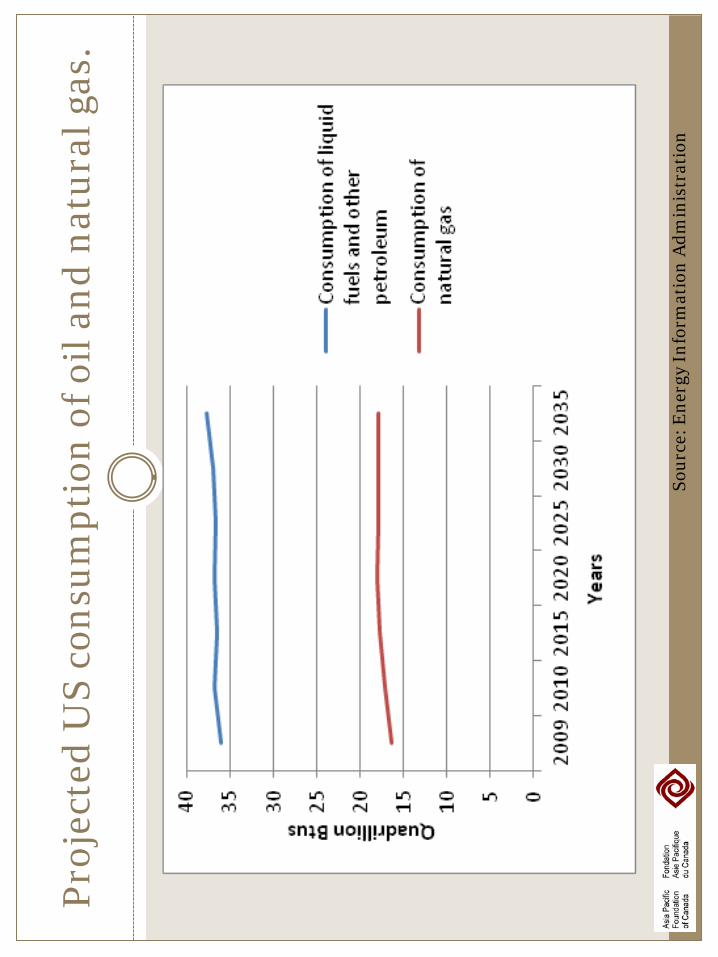
Pro
ject
ed U
S co
nsu
mp
tion
of o
il a
nd
nat
ura
l gas
.
Sou
rce:
En
ergy
In
form
atio
n A
dm
inis
trat
ion

Pro
ject
ed U
S cr
ud
e oi
l an
d n
atu
ral g
as im
por
ts.
Sou
rce:
En
ergy
In
form
atio
n A
dm
inis
trat
ion

Non
-OE
CD
Asi
a’s
pro
ject
ed d
eman
d b
y fu
el t
ype.
Sou
rce:
En
ergy
In
form
atio
n A
dm
inis
trat
ion


H
ow s
erio
us
is t
he
issu
e of
saf
e an
d s
ecu
re a
cces
s to
en
ergy
for
you
r ec
onom
y?
52%
56%
45%
60%
60%
42%
24%
23%
16%
23%
23%
25%
15%
15%
16%
11%
11%
25%
3%
2%
8%
2%
2%
6%
6%
4%
16%
2%
2%
0%
10%
20%
30%
40%
50%
60%
70%
80%
90%
100%
All
Nort
heast A
sia
Nort
h A
merica
South
east A
sia
Oceania
South
Am
erica 5 -
extr
em
ely
se
rio
us
4
3
2
1 -
no
t a
t a
ll se
rio
us
Do
n't
kn
ow
T
ota
l
Sou
rce:
PE
CC
(20
11)
Pro
spec
ts f
or T
ran
spac
ific
En
ergy
Tra
de
/Sta
te o
f th
e R
egio
n R
epor
t

Tra
ns-
Pac
ific
En
ergy
Tra
de
Vir
tual
ly N
on-E
xist
ent
E
ner
gy is
th
e w
orld
’s m
ost
trad
ed c
omm
odit
y by
va
lue,
yet
th
ere
is v
irtu
ally
no
tran
s-P
acif
ic t
rad
e in
en
ergy
pro
du
cts.
Oil
tra
de
acro
ss t
he
Pac
ific
acc
oun
ts f
or o
nly
1.2
% o
f gl
obal
oil
tra
de
in 2
010
. Tra
ns-
Pac
ific
nat
ura
l gas
tr
ade
is o
nly
0.3
% o
f th
e gl
obal
tot
al
T
ran
s-P
acif
ic c
oal t
rad
e is
sli
ghtl
y m
ore
sign
ific
ant,
bu
t ev
en s
o, it
on
ly a
ccou
nts
for
4.6
% o
f ove
rall
tra
de
in c
oal.
Agg
rega
tin
g ac
ross
all
th
ree
foss
il fu
els,
tr
ans-
Pac
ific
en
ergy
tra
de
only
acc
oun
ts f
or 1
.4%
of
glob
al e
ner
gy t
rad
e

Pat
tern
of
Glo
bal O
il T
rad
e


Ch
oke
Poi
nts
in I
nte
rnat
ion
al O
il a
nd
Gas
Tra
de

Nat
ura
l Gas
Pri
ces
in N
orth
Am
eric
a an
d A
sia

Cos
t bu
ild
up
for
bre
akev
en p
rice
s fo
r U
S an
d C
anad
a L
NG
exp
orts
to
Jap
an, 2
011
Sour
ces:
Nex
ant (
2011
), Pl
atts
(13
Apr
201
1), W
GI V
ario
us Is
sues
(201
1),
Petro
leum
Ass
ocia
tion
of Ja
pan
(201
1) ,i
n PE
CC
(201
1)
)

Oil
Pip
elin
es a
nd
Ref
iner
ies
in N
orth
Am
eric
a

Go
Wes
t to
Go
Eas
t

Pro
pos
ed N
orth
ern
Gat
eway
an
d
Tra
ns-
Mou
nta
in P
ipel
ines

Pro
pos
ed L
NG
exp
ort
pro
ject
s in
Nor
th A
mer
ica
Pro
ject
Co
un
try
Lo
cati
on
E
xp
ort
cap
acit
y (
in
mil
lio
n
ton
s
per
year)
Ex
pecte
d
sta
rtin
g
date
Kit
imat
LN
G
Can
ad
a
West
Co
ast
10
.0
20
15
BC
LN
G
Can
ad
a
West
Co
ast
15
.0
20
15
Petr
on
as/P
rog
ress
Can
ad
a
West
Co
ast
- 2
01
6-1
8
Do
ug
las C
han
el
LN
G
Can
ad
a
West
Co
ast
1.8
2
01
4
Sab
ine P
ass L
NG
(C
hen
iere
) U
SA
G
ulf
Co
ast
16
.0
20
15
Sh
ell
/Mit
su
bis
hi/
CN
PC
/KO
GA
S
Can
ad
a
West
Co
ast
- -
Bri
tish
Gas
Can
ad
a
West
Co
ast
- -
Fre
ep
ort
LN
G
US
A
Gu
lf C
oast
15
.0
> 2
01
5
Lak
e C
harl
es (
BG
) U
SA
G
ulf
Co
ast
17
.6
-
Co
ve P
oin
t L
NG
(D
om
inio
n)
US
A
East
Co
ast
- -
No
rth
Slo
pe,
Ala
sk
a
(BP
/Co
no
co
Ph
illi
ps)
US
A
West
Co
ast
- -
Jo
rdan
Co
ve L
NG
, O
reg
on
US
A
West
Co
ast
- -

Rec
ent
Inve
stm
ents
by
Asi
an o
il &
gas
com
pan
ies
in
Nor
th A
mer
ican
oil
an
d g
as in
du
stry
Dat
e C
ateg
ory
In
vest
ing
cou
ntr
y In
vest
ing
com
pan
y R
ecip
ien
t co
un
try
Pro
ject
/ co
mp
any
Val
uat
ion
(i
n b
illio
n
US$
) M
ay-0
5 O
il sa
nd
s C
hin
a C
NO
OC
C
anad
a M
EG
0.2
Au
g-06
O
il sa
nd
s S
Kore
a KN
OC
C
anad
a B
lack
Go
ld
1.7
Ap
r-10
O
il sa
nd
s C
hin
a Si
no
pec
C
anad
a Sy
ncr
ud
e 4.
6 N
ov-
10
Oil
san
ds
Thai
lan
d
PTTE
P
Can
ada
Kai K
os
Deh
seh
2.
3
Jan
-11
Shal
e ga
s &
o
il C
hin
a C
NO
OC
U
SA
Ch
esap
eake
0.
6
Jan
-11
Pip
elin
e C
hin
a Si
no
pec
C
anad
a N
ort
her
n G
atew
ay
Pip
elin
e 2.
3 Fe
b-1
1 Sh
ale
gas
Ind
ia
Rel
ian
ce
USA
A
tlas
, Ch
evro
n
3.2
Mar
-11
Shal
e ga
s &
o
il S
Kore
a KN
OC
U
SA
An
adar
ko
1.6
Jul-
11
Oil
san
ds
Ch
ina
CN
OO
C
Can
ada
OPT
I Can
ada
2.1
Oct
-11
Co
nve
nti
on
al
Oil
Ch
ina
SIN
OPE
C
Can
ada
Day
ligh
t 2.
2 N
ov-
11
Shal
e G
as
Jap
an
Inp
ex
Can
ada
Nex
en
0.7
Feb
-12
Shal
e ga
s Ja
pan
Pe
tro
chin
a C
anad
a En
can
a 2.
9

Kit
imat
, BC

Nav
igat
ing
the
Dou
glas
Ch
ann
el

O
pp
osit
ion
to
Pip
elin
es a
nd
Tan
kers

C
anad
ian
s W
illi
ng
to L
ook
to A
sian
Mar
kets
to
Exp
ort
En
ergy
R
esou
rces
, bu
t ar
e ca
uti
ous
abou
t F
orei
gn O
wn
ersh
ip a
nd
En
viro
nm
enta
l Con
cern
s
Dis
agre
e Ag
ree
61%
47%
43
%
26
%
26
%
39
%
44
%
57%
Ca
na
da
ne
ed
s to
act
no
w t
o
tak
e a
dv
an
tag
e o
f A
sia
n
cou
ntr
ies’
ne
ed
fo
r e
ne
rgy
re
sou
rce
s.
Th
e p
ote
nti
al r
isk
s to
th
e
en
vir
on
me
nt
of
tra
nsp
ort
ing
o
il a
nd
ga
s fr
om
Ca
na
da
to
A
sia
ou
twe
igh
th
e p
ote
nti
al
eco
no
mic
be
ne
fits
.
In a
ll t
hin
gs
rela
ted
to
e
ne
rgy
, ou
r re
lati
on
ship
wit
h
the
Un
ite
d S
tate
s is
th
e m
ost
im
po
rta
nt;
we
sh
ou
ldn
’t
ve
ntu
re t
oo
qu
ick
ly i
nto
Asi
a.
Th
e e
con
om
ic b
en
efi
ts o
f A
sia
’s i
nv
est
me
nt
in
Ca
na
da
’s e
ne
rgy
se
cto
r o
utw
eig
h c
on
cern
s a
bo
ut
fore
ign
ow
ne
rsh
ip o
f o
ur
na
tura
l re
sou
rce
s.
Sour
ce: A
sia
Paci
fic F
ound
atio
n of
Can
ada
2012
Nat
iona
l Opi
nion
Pol
l

Can
adia
ns
Are
Sp
lit
abou
t F
acil
itat
ing
the
Tra
nsp
ort
of O
il a
nd
Gas
Exp
orts
Asi
a O
ppos
e Su
ppor
t
62
%
53
%
45
%
27%
34
%
43
%
En
sure
th
at
the
de
ve
lop
me
nt
of
en
erg
y p
roje
cts
ha
ve
th
e
ap
pro
va
l of
aff
ect
ed
Fir
st
Na
tio
ns
com
mu
nit
ies
Bu
ild
pip
eli
ne
s to
fa
cili
tate
th
e m
ov
em
en
t o
f cr
ud
e o
il t
o
po
rts
on
Ca
na
da
’s w
est
co
ast
fo
r e
xp
ort
to
Asi
a
All
ow
ta
nk
ers
ca
rry
ing
cru
de
o
il t
o e
nte
r th
e w
ate
rs o
ff
Ca
na
da
’s w
est
co
ast
Sour
ce: A
sia
Paci
fic F
ound
atio
n of
Can
ada
2012
Nat
iona
l Opi
nion
Pol
l

Can
ada-
US-
Jap
an E
ner
gy I
nte
rdep
end
ence
?
C
anad
a an
d t
he
US
alre
ady
hav
e an
inti
mat
e an
d
lon
gsta
nd
ing
ener
gy r
elat
ion
ship
. It
is in
th
e in
tere
st o
f bo
th c
oun
trie
s to
als
o fo
rge
a tr
ans-
Pac
ific
en
ergy
re
lati
onsh
ip, s
epar
atel
y or
tog
eth
er.
Ap
art
from
co
mm
erci
al b
enef
its,
th
ere
are
oth
er im
por
tan
t fa
ctor
s to
co
nsi
der
:
Stre
ngt
hen
ing
Jap
an’s
en
ergy
sec
uri
ty, w
hic
h in
tu
rn e
nh
ance
s th
e ov
eral
l str
ateg
ic r
elat
ion
ship
Red
uci
ng
the
trad
e im
bala
nce
Jap
an h
as e
xper
tise
in c
lean
tec
hn
olog
y an
d e
ner
gy e
ffic
ien
cy t
o sh
are
wit
h C
anad
a an
d t
he
US
R
edu
cin
g C
anad
a’s
dep
end
ence
on
th
e U
S m
arke
t
Pro
vid
ing
a ba
sis
for
broa
der
an
d d
eep
er t
ran
s-P
acif
ic t
ies,
in t
he
con
text
of
grow
ing
Asi
an r
egio
nal
ism

Sum
mar
y
T
he
dis
cove
ry o
f m
assi
ve u
nco
nve
nti
onal
oil
an
d g
as d
epos
its
in N
orth
Am
eric
a, t
oget
her
w
ith
slo
win
g en
ergy
dem
and
in t
he
US
hav
e m
ade
pos
sibl
e th
e p
rosp
ect
of e
ner
gy e
xpor
ts
to A
sia
C
anad
a h
as a
ran
ge o
f en
ergy
ass
ets
that
are
exp
orta
ble,
IF
th
e p
hys
ical
an
d in
stit
uti
onal
in
fras
tru
ctu
re is
pu
t in
pla
ce
T
her
e is
gro
win
g A
sian
inte
rest
an
d in
vest
men
t in
Can
adia
n e
ner
gy a
sset
s
Th
e ec
onom
ic c
ase
for
oil a
nd
gas
exp
orts
to
Asi
a is
com
pel
lin
g, b
ut
the
win
dow
of
opp
ortu
nit
y is
not
ind
efin
ite.
En
viro
nm
enta
l an
d F
irst
Nat
ion
s (a
bori
gin
al)
con
cern
s ar
e m
ajor
dom
esti
c ch
alle
nge
s
A n
atio
nal
con
sen
sus
on t
he
role
of
oil a
nd
gas
exp
orts
in t
he
Can
adia
n e
con
omy
and
th
e n
eed
for
div
ersi
fica
tion
of
mar
kets
mu
st b
e fo
rged
in o
rder
to
buil
d t
he
infr
astr
uct
ure
th
at
is n
eed
ed f
or s
hip
pin
g en
ergy
acr
oss
the
Pac
ific
Cre
atio
n o
f a
Tra
ns-
Pac
ific
En
ergy
Mar
ket
wou
ld in
crea
se e
con
omic
wel
fare
, hav
e p
osit
ive
envi
ron
men
tal i
mp
acts
, con
trib
ute
to
red
uci
ng
trad
e im
bala
nce
s, a
nd
imp
rove
en
ergy
sec
uri
ty in
Asi
a.
It
is in
th
e in
tere
st o
f U
S, J
apan
, an
d C
anad
a to
ad
van
ce t
he
idea
of
tran
s-P
acif
ic e
ner
gy
trad
e as
a w
ay o
f st
ren
gth
enin
g A
sia-
Pac
ific
rel
atio
ns.
En
ergy
tra
de
has
str
ateg
ic s
ign
ific
ance
in v
irtu
ally
eve
ry r
egio
n o
f th
e w
orld
. T
he
sam
e is
li
kely
to
be t
he
case
for
tra
ns-
Pac
ific
en
ergy
tra
de
– m
ore
wor
k is
nee
ded
to
un
der
stan
d
and
an
tici
pat
e th
e im
pli
cati
ons
of a
ny
such
dev
elop
men
t.

The
3rd M
eetin
g of
the
Japa
n-C
anad
a-U
S C
onfe
renc
e Se
ries
on T
rilat
eral
Coo
pera
tion
Pa
nel I
: Em
ergi
ng E
nerg
y Is
sues
Two
Ch
alle
nge
s fo
r En
ergy
Sec
uri
ty
in t
he
Nor
th P
acif
ic R
egio
n
May
8, 2
012,
9:0
0-10
:30
am.
Rom
e Au
dito
rium
, SAI
S, W
ashi
ngto
n, D
.C.
Sh
oich
i IT
OH
Se
nior
Res
earc
her,
In
stitu
te o
f Ene
rgy
Econ
omic
s, Ja
pan
(IEE
J)
<s
hoic
hi.it
oh@
tky.
ieej
.or.j
p>
1

MEN
U
I.
The
Futu
re o
f As
ian
Nat
ural
Gas
Mar
kets
Less
ons
from
the
3.1
1 Fu
kush
ima
nucl
ear
acci
dent
.
Chin
a-le
d ex
pans
ion
of n
atur
al g
as c
onsu
mpt
ion
Im
plic
atio
ns o
f th
e ‘s
hale
gas
rev
olut
ion’
II. R
ussi
a’s
Asia
-Pac
ific
Pivo
t
New
fron
tiers
of
offs
hore
hyd
roca
rbon
dev
elop
men
t
Conv
erge
nce
of e
nerg
y an
d se
curit
y is
sues
.

The
Futu
re o
f A
sian
Nat
ural
Gas
M
arke
ts

I-1.
Est
imat
ed I
mpa
ct o
f N
ucle
ar P
ower
Pla
nt S
hutd
own
In
crea
se in
fue
l im
port
s in
FY2
012
com
pare
d to
FY2
010:
With
Nuc
lear
Coal
: -
5.0
Mt
Cr
ude
oil :
-15
0 kb
/d
LN
G :
+7.
0 M
t
+JP
Y 2.
6 tr
illio
n
(=
$32
.5 b
llion
; $1
=\8
0)
W
ithou
t N
ucle
ar
Co
al :
+6.
3 M
t
Crud
e oi
l : +
280
kb/d
LNG
: +
20.0
Mt
+
JPY
4.6
trill
ion
(=
$ 5
7.5
billi
on)
Sour
ce: I
EEJ
-3,0
00
-2,5
00
-2,0
00
-1,5
00
-1,0
00
-5000
500
1,00
0
1,50
0
2,00
0
1Q 2010
2Q 2010
3Q 2010
4Q 2010
1Q 2011
2Q 2011
3Q 2011
4Q 2011
1Q 2012
2Q 2012
3Q 212
4Q 2012
1Q 0213
Bilio
n JP
YPr
ojec
tion
With
out
Nuc
lear
Actu
al
With
Nuc
lear
Trad
e Ba
lanc
e of
Japa
n
Nuc
lear
shu
tdow
ns h
ave
led
to a
big
loss
of
natio
nal w
ealth
due
to
incr
ease
s in
im
port
pric
es o
f LN
G ・・・ J
apan
had
its
first
tra
de d
efic
it (=
$35
bill
ion)
in m
ore
than
the
pas
t th
ree
deca
des.

I-2.
Oil-
Link
ed N
atur
al G
as P
rices
in N
orth
east
Asi
a
Nat
ural
Gas
Pric
es (
2011
) Cr
ude
Oil
Pric
es (
2008
-11)
P
rice is m
uch h
igher
than e
lsew
here
in N
ort
heast A
sia
.
LN
G p
rices a
re lin
ked to c
rude
oil
pri
ces in N
ort
heast A
sia
.
Sourc
e: IE
EJ
Sourc
e: IE
EJ
Eu
rop
ean
Ga
s M
ark
ets
US
Ga
s M
ark
et

I-3.
Est
imat
ed N
atur
al G
as D
eman
d W
orld
by
Regi
on
Asia
by
Regi
on
So
urc
e: A
sia
/ W
orld
En
erg
y O
utlo
ok 2
01
1, IE
EJ.
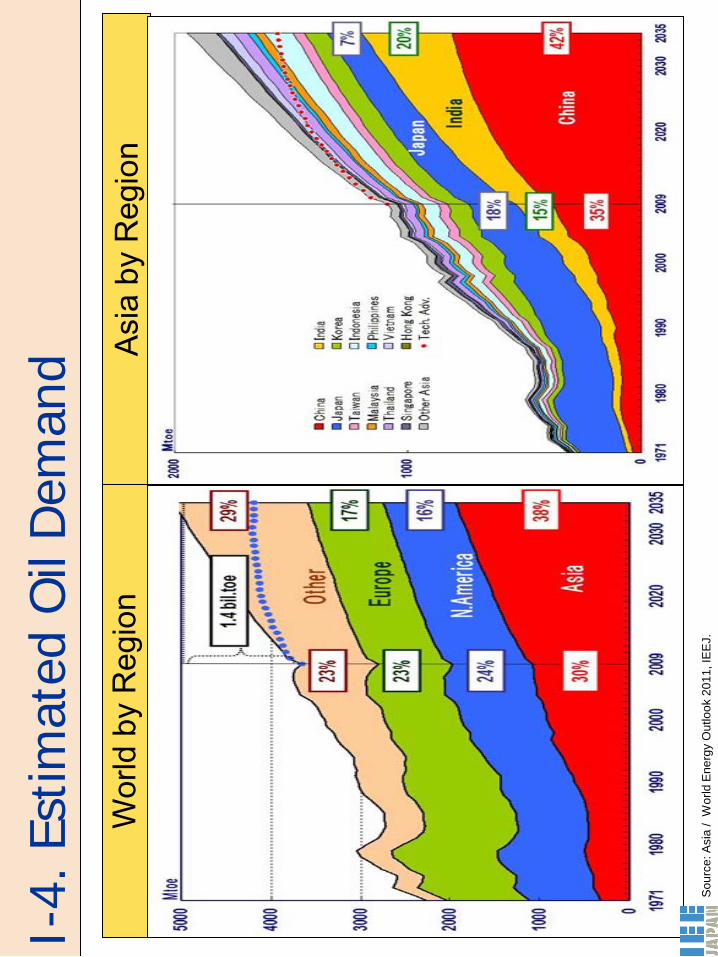
I-4.
Est
imat
ed O
il D
eman
d W
orld
by
Reg
ion
Asia
by
Reg
ion
So
urc
e: A
sia
/ W
orld
En
erg
y O
utlo
ok 2
01
1, IE
EJ.

I-5.
An
Expe
cted
New
Dim
ensi
on o
f N
atur
al G
as
Flo
ws
in t
he A
sia-
Paci
fic R
egio
n
Sourc
e: B
P S
tatistical R
evie
w o
f W
orld E
nerg
y.
Shal
e G
as
Rev
olut
ion

I-6.
LN
G I
mpo
rts
from
Nor
th A
mer
ica
in n
egot
iatio
n
D
ec. 2
011-
Gai
l (In
dia)
sig
ned
an a
gree
men
t of
3.5
mill
ion
tons
/y fr
om
Sabi
ne P
ass
(LA)
.
Jan.
201
2- K
ogas
sig
ned
an a
gree
men
t of
3.5
mill
ion
tons
/y fro
m S
abin
e Pa
ss (
LA).
April
201
2- M
itsu
bish
i and
Mit
sui
bega
n ne
gotia
tion
over
impo
rtin
g a
tota
l 8 m
illio
n to
ns o
f LN
G f
rom
Hac
kber
ry (
LA).
April
201
2- T
okyo
Gas
and
Su
mit
omo
bega
n ne
gotia
tion
over
impo
rtin
g a
t
otal
2.3
mill
ion
tons
of
LNG
f
rom
Cov
e Po
int
(MD
).
M
itsu
bish
i, Sh
ell,
CN
PC
,
K
ogas
are
rep
orte
dly
in
neg
otia
tion
over
join
t
pr
oduc
tion
of L
NG
(12
mill
ion
tons
/y)
in
Br
itish
Col
umbi
a.
Sour
ce:
FER
C

I-7.
Key
Que
stio
ns f
or t
he F
utur
e
(1)
The v
olu
me
of LN
G e
xport
s fro
m N
ort
h A
merica.
(2)
Expansio
n o
f C
hin
a’s
share
in the r
egio
nal gas
mark
et.
(3)
Possib
ility
of changin
g g
as p
ricin
g form
ula
in A
sia
.
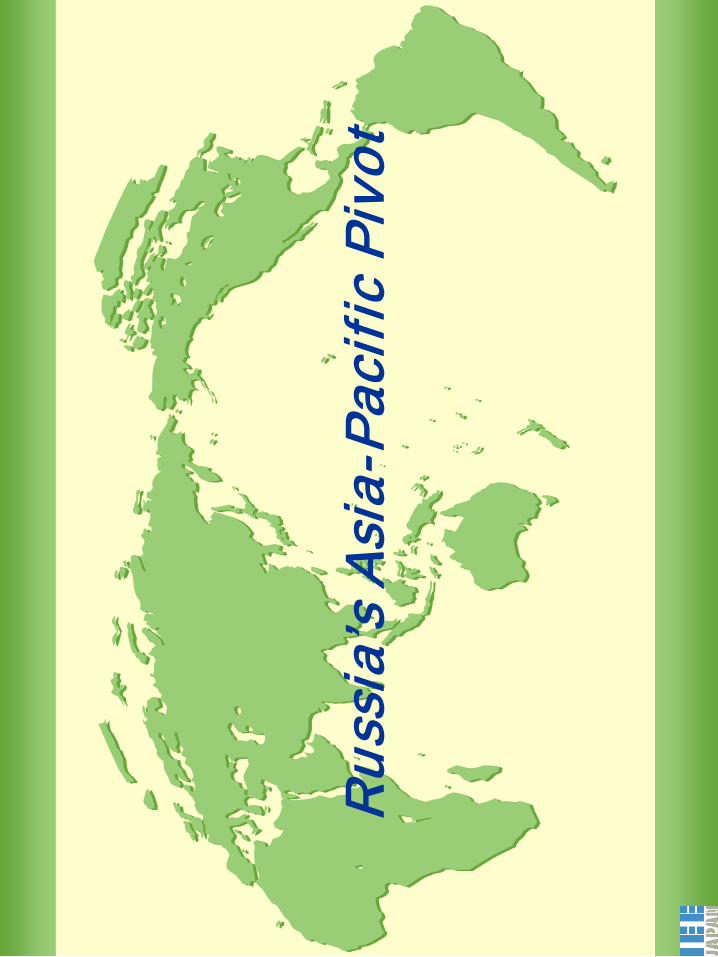
Rus
sia’
s A
sia-
Pac
ific
Piv
ot

II-1
. Rus
sia
Look
s Ea
st a
nd N
orth
Sour
ce:
orig
inal
map
from
UN
DP
HP.
New
Fro
ntie
rs o
f O
il an
d G
as D
evel
opm
ent
– hi
gh c
osts
, lo
ng le
ad t
ime.
O
il an
d G
as P
rodu
ctiv
ity in
w
este
rn S
iber
ia h
as p
eake
d.
Eu
rope
an (
wes
tern
) en
ergy
m
arke
ts h
ave
mat
ured
.
EU’s e
ffort
to
redu
ce d
epen
denc
e on
Rus
sia.

II-2
. Rus
sia’
s D
evel
opm
ent
of t
he N
orth
ern
Sea
rout
e to
war
d
th
e Pa
cific
Oce
an a
cros
s th
e Be
ring
Stra
it
Ener
gy a
nd m
ilita
ry s
ecur
ity a
re in
tert
win
ed.
•N
orth
ern
Flee
t’s a
cces
s to
the
Pac
ific
Oce
an;
com
mer
cial
inte
rest
s; t
errit
oria
l cla
ims,
etc
.
En
hanc
emen
t of
a c
onfid
ence
-bui
ldin
g m
echa
nism
for
the
new
rou
te is
a
mat
ter
of u
rgen
cy.
LN
G e
xpor
t fr
om Y
amal
Pe
nins
ula
is p
lann
ed t
o st
art
in 2
016-
17.

Ⅱ-3
. Key
Que
stio
ns f
or t
he F
utur
e
(1)
Pa
rtic
ipa
tio
n o
f fo
reig
n c
ap
ita
l a
nd
re
aliz
atio
n o
f
o
ffsh
ore
de
ve
lop
me
nt
in t
he
Arc
tic S
ea
.
(2)
How
mu
ch L
NG
will
Russia
be a
ble
to s
hip
to A
sia
n m
ark
et via
the n
ort
hern
ro
ute
?
(3)
Engagem
ent in
constr
ucting a
new
regio
nal
arc
hite
ctu
re w
ith R
ussia
and C
hin
a.

Than
k Yo
u V
ery
Muc
h
for Y
our A
ttent
ion!

Supplement to the State Of The Region
2011-2012
ProsPects for transPacific energy trade

executive summary
Even though oil and gas is the most traded product in the Asia-Pacific region, there is virtually no energy trade across the Pacific. The major energy importing economies of Northeast Asia source their oil and gas largely from the Middle East, Southeast Asia and Australia, while the United States imports energy from the Americas, West Africa, and the Middle East. Indeed, transpacific trade in energy products (oil, gas, and coal) accounts for only 1.4 percent of global trade in those products. The segmentation of energy markets between Asia and the Americas is seen in the sharp price differential for natural gas between the two regions, and – more recently – in a price differential for crude oil as well.
A number of developments in recent years have raised the possibility of transpacific trade in oil and gas, and the emergence of a more integrated and competitive market in energy products in the Asia-Pacific region. These include:
A) The discovery of massive unconventional (shale) gas deposits in the
United States and Canada which are creating a gas glut in North America;
B) Increased demand in Asian countries for less carbon-intensive
energy sources, in particular a shift away from coal to natural gas;
C) Concerns about nuclear power following the Fukushima Daiichi disaster
and the resulting search for clean alternatives to nuclear energy;
D) The changing energy balance in Southeast Asia, particularly Indonesia
and Malaysia, which are expected to become importers of LNG due to
rapid increases in domestic demand; and
E) Rapidly growing investment by Asian national oil and gas companies in
North American energy assets, especially in the Canadian oil sands,
which has the third largest proven reserves of crude oil in the world.
Even taking into account the higher cost of shale gas production, the substantial investments required to build pipelines and liquefaction plants, and the transportation cost of shipping LNG across the Pacific, North American gas could be competitive in Asia against existing suppliers, or at the very least serve as an secondary source of supply for Northeast Asian economies looking to diversify their energy imports or seeking more secure sources. Likewise, the prospect of North American crude oil exports to Asia is increasingly attractive given the gas glut in the United States and a widening price differential between benchmark West Texas Intermediate and Brent crude oil prices.
Favorable economics, however, do not guarantee that transpacific energy trade will become a reality, since there are political, regulatory, and environmental risks to be overcome, as well as a need for substantial capital investment. Nevertheless, the prospect of transpacific energy trade would be good news for Asia-Pacific regional integration, since it would lead to a more competitive energy market and more transparent pricing of energy products, likely resulting in a reduction in price differentials between Asia and North America. In addition, transpacific energy trade would allow both exporters and importers in the region to diversify their markets, and hence support energy security objectives.
State of the Region 2011-2012
Supplement
i

02
Section ONE
01
status of asia-Pacific energy use and energy trade
SECtion
Figure 1 illustrates the mix of energy use in some of the major economies in the Asia-Pacific region. The use of fossil fuels is predominant in the Asia-Pacific region, with hydro-electricity, renewables and nuclear energy typically accounting for less than 20% of overall energy use. Oil is the fuel of choice in most Asia-Pacific economies (the key exception is China which relies heavily on coal), accounting for 30-40% or more of energy needs in most economies. Coal constitutes more than 20% of overall energy use in the majority of Asia-Pacific economies, while natural gas typically accounts for 10-20% of the energy mix (China is again the exception, with only 4% of its energy needs met by natural gas).
100.0%
40.0%
90.0%
30.0%
80.0%
20.0%
70.0%
10.0%
60.0%
US
CanadaChina
Japan
S. Korea
Australia
indonesia
Malaysia
Singapore
Philippines
0.0%
50.0% Renewables
Hydro
nuclear
natural Gas
Coal
oil
Source: BP Statistical Review of World Energy 2011Figure 1: Energy mix of selected economies in 2010
energy use in asia-Pacific economies

State of the Region 2011-2012
Supplement
03
100.0%
40.0%
90.0%
30.0%
80.0%
20.0%
70.0%
10.0%
60.0%
indiaChinaRussiaJapanUSnorth America
0.0%
50.0%
others
natural Gas
'10 '35 '10 '35 '10 '35 '10 '35 '10 '35 '10 '35
Coal
oil
Source: BP Statistical Review of World Energy 2011Figure 2: Energy mix of selected economies in 2010 and 2035
The basic patterns of energy use in the Asia-Pacific region are unlikely to change materially in the foreseeable future. Figure 2 illustrates how the energy mix in Asia-Pacific economies (including Russia) can be expected to change between now and 2035, under IEA’s New Policies Scenario. In this scenario, the use of non-fossil fuel sources of energy (nuclear, hydro-electricity and renewables) increases appreciably in each of the major economies. Nevertheless, fossil fuels continue to dominate the energy mix, accounting for 60-80% of the energy mix in most economies. The share of coal, in particular, as well as oil decreases in almost all countries- particularly dramatic is the reduction in the share of coal in China’s energy mix from around 70% in 2010 to 38% in 2035. By contrast, natural gas shares remain relatively stable, reflecting its status as a cleaner fuel relative to oil and coal.
The significance of energy trade to the Asia-Pacific economies is underscored by the fact that much of the fossil fuel needs of Asia are met by imports1. In particular, 94.3% of the region’s oil needs are met by imports. Natural gas imports are fairly significant, accounting for 37.2% of total natural gas use, while coal imports are comparatively less significant, only accounting for 14.9% of total coal use. Aggregating across all 3 fuels, 41.2% of fossil fuel needs of the Asian economies are met from imports.2
1 In the analysis that follows, Asia is defined so as to include Brunei, Cambodia, China, China Hong Kong SAR, Indonesia, Japan, Laos, Malaysia, Mongolia, North Korea, Philippines, Singapore, South Asia (Afghanistan, Bangladesh, India, Myanmar, Nepal, Pakistan and Sri Lanka), South Korea, Chinese Taipei, Thailand, Vietnam, Australia, New Zealand, Papua New Guinea and Oceania.
2 The calculation is carried out by converting import and consumption figures for each of the 3 fuels into a common unit, millions of tones equivalent (Mtoe), before summing import and consumption figures across each fuel.

04
Section ONE
iv
status of asia-Pacific energy trade
To place Asia-Pacific energy trade (specifically, fossil fuel energy imports of Asian economies) in context, it is useful to begin by looking at patterns of global energy trade. Figure 3 demonstrates the major inter-regional oil flows in the global economy in 2010. By far the largest single flow of crude oil trade is from the Middle East (ME) to Asia (AS), of around 14.1 million MMBD; this reflects both the large base of demand in Asia and its limited domestic crudes. The only other significant inter-regional flows of crude into Asia are from West Africa (WAF) and from the Former Soviet Union (FSU), approximating 1.5 MMBD each. The North American market not only produces significant proportions of its own crude requirements, but also has access to short haul and long haul crudes from Latin and Central America (LA, 2.3 MMBD), Europe (EUR, 1.0 MMBD, not shown on the map), West Africa (1.8 MMBD) as well as the Middle East (1.8 MMBD). Europe is a recipient of FSU crude (5.9 MMBD), North African crude (1.9 MMBD) and ME crude (2.3 MMBD), apart from being an exporter of crude to other regions.
Figure 4 illustrates the major flows of natural gas (both pipeline and LNG) in the world in 2010. In contrast to oil, the global gas market is regionally segmented to a significant degree, and intra-regional flows of gas are important, with gas flows from Canada to US (92.4 Bcm), from Southeast Asia and Australia (SEA) to Northeast Asia (93.9 Bcm) and from Central Asia to Russia (31.9 Bcm). The largest flow of gas is from Russia and the Central Asian FSU countries to Europe (185.7 Bcm), though Europe also receives significant gas imports from Africa (84.3 Bcm) and the Middle East (45.0 Bcm). In addition to gas imports from SEA, Northeast Asia receives imports from the Middle East (46.8 Bcm) and, increasingly, from the Former Soviet Union as well (16.0 Bcm). Note that North and South America are effectively ‘gas islands’ isolated from the rest of the world, with few significant transpacific or transatlantic gas flows.
CA
B
ED
F
G H
i
J
A: ME => AP 14.1 B: WAF => AP 1.5 C: LA => nA 2.3 D: CAn => US 2.5 E: WAF => nA 1.8 F: nAF => EUR 1.9 G: ME => nA 1.8 H: ME => EUR 2.3 i: FSU => EUR 5.9 J: FSU => AS 1.5
ME = Middle East
nA = North America CAn = Canada
AS = Asia
EUR =Europe
WAF = West Africa
LA = Central & S America
nAF = North Africa
FSU = Former Soviet Union
All figures are in MMBD
C
AB
DE
F G
H
A: SEA => nEA 93.9 B: ME => nEA 46.8 C: CAn => US 92.4 D: AF => EUR 84.3 E: ME => EUR 45.0 F: FSU => EUR 185.7 G: FSU => nEA 16.0 H: CA => RUS 31.9
ME = Middle East
CAn = Canada
nEA = Northeast Asia
EUR =Europe
SEA = ASEAN+Australia
FSU = Former Soviet Union
AF = North and West Africa
CA = Central Asian FSU members
All figures are in Bcm (Billions of cubic metres)
Figure 4: Pattern of global gas trade in 2010
Figure 3: Pattern of global oil trade in 2010
Source: BP Statistical Review of World Energy 2011
Source: BP Statistical Review of World Energy 2011

State of the Region 2011-2012
Supplement
05
400 100
10020
350
80
70
90
50 10
300
60
0 0
250
50200
40
india indiaChina China
Oil
Impo
rt V
olum
e (M
t)
Gas
Impo
rt V
olum
e (B
cm)
Japan JapanSingapore South Korea
Chinese taipei
other Asia
other Asia
150
30
Intra-Asia
North America
Europe & FSU
Africa
Middle East
South & Central America Africa
Middle East
South & Central America
Europe & FSU
Intra-Asia
North America
Source: BP Statistical Review of World Energy 2011
Figure 5: Oil trading pattern in the Asian region in 2010 Figure 6: Gas trading pattern in the Asian region in 2010
Figure 5 shows the areas from which major Asian oil importers obtain their product. The Middle East is by far the biggest source of oil imports, but there are also significant intra-regional flows, while China and India import some of their oil from Africa and China also imports oil from South and Central America.
Figure 6 illustrates where Asian economies source their gas imports. Intra-regional gas flows are the most important, with gas flowing from the Southeast Asia belt (Indonesia, Malaysia, Brunei, and Australia) to Northeast Asia (China, Japan, South Korea). The Middle East is the only other significant exporter into Asia, accounting for almost all of India’s gas imports and a significant proportion of the gas imports of South Korea and, to a lesser extent, Japan.
The above figures demonstrate that transpacific energy trade (i.e. trade between North America and the Asian economies) is comparatively insignificant relative to both global energy trade and energy imports into the Asian region. Transpacific oil and natural gas trade are particularly limited in their scale, respectively accounting for only 1.2% of global oil trade and 0.3% of global natural gas trade in 2010 (BP Statistical review of World Energy, June 2011). Transpacific coal trade is relatively more significant in global coal trade, but even so, accounts for only 4.6% of overall trade in coal. Aggregating across all 3 fuels, transpacific energy trade only accounts for 1.4% of global energy trade, more than two-thirds of which is from North America to Asia.

06
Section TwO
ProsPects for transPacific natural gas trade
02SECtion
energy use in asia-Pacific economies
Compared to the markets in oil and coal, the natural gas market has traditionally been the least integrated, with the global market effectively segmented into three regions (Asia, Europe and North America) and trade largely occurring within these regions3. The scale of transpacific natural gas trade is particularly small in relation to global gas trade (0.3%), as opposed to 1.2% for oil and 4.6% for coal. Moreover, existing gas flows from North America to Asia were largely from the Kenai LNG export terminal in Alaska, which is scheduled to shut down later this year.
Recent developments in both gas demand and supply have led to a scenario where significant growth in LNG exports from North America to Asia has become a distinct possibility. On the demand side, natural gas demand in Asian economies is projected to grow substantially in the next 25 years, as table 7 above illustrates. One reason is simply the strong economic growth forecast for Asia’s developing economies, in particular China and India, which consequently are expected to experience a higher than average CAGR (Compound Annual Growth Rate) in gas demand of over 5%. Indeed, recent estimates of China’s future natural gas demand by the Institute for International Oil Politics are even more bullish, with demand projected to reach 450 bcm by 2020, compared to IEA’s estimate of 395 bcm by 2035. Moreover, the implementation of greenhouse gas policies, even at a modest level (as in IEA’s New Policies scenario), favors natural gas over other fossil fuels, which explains why the share of natural gas in Asia’s energy mix is expected to nearly double by 2035.
CAGR ShARE
1980 2008 2035 1980-2008 2008-2035 2008 2035
OECD 958 1,541 1,758 1.7% 0.5% 48.9% 38.8%
North America 659 815 913 0.8% 0.4% 25.9% 20.1%
United States 581 662 664 0.5% 0.0% 21.0% 14.6%
Europe 264 555 628 2.7% 0.5% 17.6% 13.8%
Asia 35 170 216 5.8% 0.9% 5.4% 4.8%
Japan 25 100 117 5.1% 0.6% 3.2% 2.6%
Non-OECD 559 1,608 2,777 3.8% 2.0% 51.1% 61.2%
Asia 36 341 934 8.4% 3.8% 10.8% 20.6%
China 14 85 395 6.7% 5.9% 2.7% 8.7%
India 1 42 177 14.3% 5.5% 1.3% 3.9%
Middle East 36 335 608 8.3% 2.2% 10.6% 13.4%
world 1,517 3,149 4,535 2.6% 1.4% - -
table 7: Primary Natural Gas Demand by Region (bcm)
Source: IEA World Energy Outlook 2010 (New Policies Scenario)
3 This can be visually illustrated by comparing Figures 3 and 4.

07
State of the Region 2011-2012
Supplement
Two other factors could further boost Asia’s future demand for LNG imports. First, Indonesia and Malaysia, two of the largest gas exporters in the region, are both experiencing dwindling supply from aging fields. Coupled with increasing domestic natural gas demand, both countries appear set to be transformed into LNG importers. Indeed, Indonesia’s first import terminal is expected to begin operating in 2012, and private firms have already been given permission to import LNG. Malaysia has planned the construction of 3 LNG receiving terminals, and expects to begin importing LNG from 2014. As such, other Asian/Oceania economies that currently import gas from Indonesia and Malaysia may well have to scout for new import sources in the future.
Second is the impact of the earthquake in March this year on Japan’s LNG demand. The earthquake not only resulted in the shutdown of much of Japan’s nuclear generating capacity, in the aftermath of the Fukushima disaster, but also damaged oil and coal-fired thermal power stations. As Japan seeks to replace its lost thermal and nuclear capacity by running all its gas-fired units, Japan’s LNG demand has increased and may be expected to continue to do so in the short-run. Whether Japan’s LNG demand will grow even further beyond the next 5 years is less clear- while Wood Mackenzie forecasts relatively flat LNG demand for Japan in the next decade, Ziff Energy expects strong growth in demand.
Growing demand in Asia for natural gas is also set to be accompanied by a large increase in North American gas production, driven by the shale gas revolution which has made feasible the extraction of vast reserves of unconventional gas in the US and Canada. An indication of the ‘game-changing’ nature of shale gas is provided by table 8 below, which presents the proved reserves of natural gas at the end of 2010. While proved dry-gas reserves of the US only amount to 273 tcf (4% of the world’s total), the addition of potential gas reserves (as estimated by the Colorado School of Mines) inflates that figure to 2170 tcf (22% of the world’s total); shale gas accounts for 687 Tcf of that figure. Similarly, Canada’s recoverable gas reserves jump from 61 tcf to 1338-1407 tcf (14% of the world’s total) if unconventional gas reserves are included. Thus, whereas the US was once expected to be a major LNG importer, the EIA now expects US LNG imports to decline progressively as gas demand is increasingly met by domestic production.
tcf Share of total R/P Ratio (yrs)
North America 351 5.3% 12.0
North America (incl. potential reserves) 3525-3594 36-36.5%
US 272.5 4.1% 12.6
US (incl. potential reserves) 2170 22.0-22.2%
Canada 61.0 0.9% 10.8
Canada (incl. potential reserves) 1,338-1,407 13.7-14.3%
S. & Cent. America 262 4.0% 45.9
Europe & Eurásia 2,228 33.7% 60.5
Russian Federation 1,581 23.9% 76.0
Middle East 2,677 40.5% >100
Iran 1,046 15.8% >100
Qatar 894 13.5% >100
Africa 520 7.9% 70.5
Asia / Oceania 574 8.7% 37
Australia 103 1.6% 58.0
Indonesia 108 1.6% 37.4
Malaysia 85 1.3% 36.1
world 6,609 58.6
world (incl. NA potential reserves) 9,784-9,853
table 8: Natural Gas Proved Reserves, end 2010 (US & Canada unconventional gas included)
Sources: BP Statistical Review of World Energy 2011, Colorado School of Mines (2011) as cited in WGI (World Gas Intelligence),
4 May 2011; Energy Futures Network and Canadian Society of Unconventional Gas (2011) as cited in WGI, 9 Mar 2011.

08
Section TwO
The effect of the North American gas glut coupled with the Asian demand surge has been to widen natural gas price differentials between North America and Asia. Historically, natural gas in the Asia-Pacific region has been priced at a premium relative to North American natural gas (see Figure 9). Several factors have contributed to the Asian premium- the absence of multiple import sources, the fact that gas is purchased under long-term contracts and finally the use of oil-indexed formulas to determine the prices of natural gas contracts. As Figure 9 illustrates, however, in the last few years the price differentials have widened considerably. The difference between the Japan contract price and the Henry Hub price in 2010 was approximately $6.40, and is estimated to have increased even further in 2011 to around $12.50 due to the oil price hike as well as the increase in Japan’s LNG demand following the Fukushima disaster.
With such large price differentials, gas exports from North America to Asia are increasingly attractive to investors, resulting in a number of export projects in both the US and Canada (table 10). All of the projects proposed in Canada are new terminals to be located on the West Coast in British Columbia, with access to the vast reserves of mostly unconventional gas in the Western Canadian Sedimentary Basin (WCSB) that span over the provinces of Alberta and British Columbia. In contrast, the US export projects largely involve re-purposing existing import terminals on the Gulf and East Coast into bi-directional terminals that can both export and import LNG.
Project Country Location Export Capacity (in million tons per year)
Expected Starting Date
Kitimat LNG Canada West Coast 10.0 2015
BC LNG Canada West Coast 15.0 2015
Petronas/Progress Canada West Coast - 2016-18
Douglas Chanel LNG Canada West Coast 1.8 2014
Sabine Pass LNG
(Cheniere)USA Gulf Coast 16.0 2015
Freeport LNG USA Gulf Coast 15.0 > 2015
Lake Charles
(BG)USA Gulf Coast 17.6 -
Cove Point LNG
(Dominion)USA East Coast - -
Jordan Cove LNG,
OregonUSA West Coast - -
table 10: Proposed LNG export projects in North America
Figure 9: Natural gas prices in North America and Asia
Sources: WGI (24 Nov 2010), WGI (02 Feb 2011), WGI (23 Mar 2011), WGI (20 Apr 2011), WGI (11 May 2011),
Nexant (May 2011), Oregon Live (16 Jul 2011), WGI (17 Aug 2011)
notes: The Henry Hub and Japan spot prices for 2011 are the averages for the first six months of 2011.
The Japan contract price for 2011 is calculated using the assumed formula: Contract price = 0.1485*
Average JCC crude price for 1st 6 months of 2011 + 1.0. The formula is derived from Gary Eng
(www.med.govt.nz/upload/65505/Formula_for_LNG_Pricing.pdf, 2008), and is consistent
with recent estimates of the oil slope amounting to 0.14-0.1485 (WGI, 17 Aug 2011).
Sources: Nexant (2011), WGI (various issues, 2010-2011), Petroleum Association of Japan (2011)
18.00
2.00
12.00
4.00
14.00
6.00
16.00
8.00
0.00
10.00
200720062005 2008 2009 2010 2011
Pric
e (U
S$/M
MBt
u)
Henry Hub
Japan ContractAlberta
China Imported LNGJapan Spot

09
State of the Region 2011-2012
Supplement
notes:
The Japan contract price and
the Henry Hub price (i.e. home
price for the US) refer to 2011 and
are calculated as described in
the notes to Figure 9. The home
price for Canada refers to the
Alberta average spot price for
2010 (Nexant, 2011). The costs
of liquefaction, shipping and
fuel surcharge are estimated by
Barclays (Platts, 13 Apr 2011).
The fuel surcharge is a fee paid to
the hauler to cover the fuel costs
incurred while shipping and is
calculated as a fixed percentage
of fuel prices so as to cushion the
hauler from changes in fuel prices.
18.00
4.25
6.00
9.009.60
16.70
4.05
5.806.80
7.40
2.00
12.00
4.00
14.00
6.00
16.00
8.00
0.00
10.00
LiquefactionHome Price Shipping Fuel Surchange
US$
/MM
Btu
outlook for north american lng exPorts to asia
In evaluating the outlook for North American LNG export projects, a key question is whether exports from the USA or Canada to Asia are economically viable. The step-chart in Figure 11 illustrates the estimated prices at which LNG exported by US and Canada break even, and compares it to the actual price that LNG exporters can hope to obtain if they sell LNG to Japan under long-term contracts. At current prices, the break-even export price is approximately $9.60/MMBtu for US Gulf Coast terminals and $7.40/MMBtu for Canadian export terminals, both of which are considerably less than the estimated Japanese contract price of $16.70. Thus, at current prices it makes economic sense for gas producers in North America to export LNG to Asia as opposed to selling the gas domestically, with estimated profit margins of $9.35/MMBtu for Canadian exporters and $7.15/MMBtu for US exporters.
Independent of the price of natural gas in North America and Asia, it is estimated that US terminals will require a minimum price differential of US$5.35/MMBtu (between Henry Hub prices and Asian LNG prices) for US LNG exports to be economically feasible4, while the corresponding price differential required for Canadian terminals (i.e. the difference between Alberta prices and Asian LNG prices) is US$3.35/MMBtu. Canadian terminals (and any terminals on the US West Coast) thus have a substantial cost advantage over terminals on the US Gulf Coast due to the difference in shipping distances to Asia -- transportation costs for West Coast export terminals are only $1/MMBtu versus $3/MMBtu for the Gulf Coast terminals. The impetus for Canada to export gas is also greater than for the US due to the presence of domestic push factors. Most of the gas demand in North America is in the U.S., and with US gas production increasing Canada’s gas exports to the US have been steadily declining.
In view of the large reserves of unconventional gas in both Canada and the US (table 8), there are unlikely to be any physical constraints on gas production. Liquefaction capacity, however, is the key capacity constraint. Projected liquefaction capacities of Canada and the US are presented in table 12 together with those of Qatar, Australia and Russia (which are likely to be the other key competitors in the Asia-Pacific LNG market).
Figure 11: Cost buildup for breakeven prices for US and Canada LNG exports to Japan, 2011
US LnG Break-even
Price
Canada LnG Break-even Price
Canada Costs
US Costs
Japan Contract Price
Required Price Differentials:
Canada: $3.35 US: $5.35
Sources:
Nexant (May 2011),
Platts (13 Apr 2011),
WGI (various issues, 2011),
Petroleum Association of
Japan (2011)
4 Note that this is consistent with the $5.40/MMBtu that Cheniere Energy (operator of Sabine Pass LNG) estimates will be added to Henry Hub prices when gas is exported to Asia (WGI, 20 Apr 2011).

10
Section TwO
Despite the wide variability in the estimates, it is clear that the liquefaction capacity of Qatar and Australia will exceed that of North America in the medium-term (i.e. up to 2016) and quite likely in the long-run as well. Nevertheless, even conservative estimates of North America’s liquefaction capacity represent a sizeable chunk of the total liquefaction capacity that is to be used to direct LNG exports to Asia5. Thus, the possibility of profitable exports to Asia, coupled with growing liquefaction capacity, underscores the significant potential for large volumes of transpacific gas trade.
The actual volume of transpacific LNG trade in the medium-term may be constrained by the cost advantage of existing LNG suppliers such as Qatar (and to a lesser extent, Australia), who have the luxury of reducing their prices to aggressively compete against North American exporters as well as the “first mover” advantage of existing suppliers to enter into long-term contracts for the rapidly growing demand for LNG, especially for Japan, in the wake of the Fukushima disaster. However, a desire for energy security on the part of Asian buyers might lead to significant North American LNG exports despite higher prices compared to existing supplies. Buying North American gas would allow Asian buyers possibilities for diversification by including multiple indices in their gas portfolio, and might further reduce risks for buyers given that North American gas prices (e.g. Henry Hub prices) are less volatile than the JCC crude price.
There are also regulatory risks in Canada and the United States related to environmental concerns around the hydraulic fracking process that is used in the recovery of shale gas, and opposition from large buyers of natural gas in the US, including Dow Chemical and American Public Gas Association, which have opposed LNG export plans on the grounds that they would lead to higher domestic prices and expose the domestic gas market to the potentially unstable global crude oil market.
CountryCapacity in
2011
Projected Capacity
(2015-16)
Projected Capacity (2020+)
Qatar 77 77 77
Australia 20 60-70 60-160
north America 2 12-34 26-113
Canada 0 5-27 10-50
US 2 7 16-63
Russia
(northeast Asia)10 10-15 10-25
Sources: Capacity estimates for Qatar were compiled from Petroleum Economist (Feb 2011) and Nexant
(2011); for Australia from Nexant (2011), Petroleum Economist (Jul 2011), APPEA and Deutsche Bank (both
cited in Business Times, 12 Apr 2011); for Russia from Nexant (2011) and WGI (30 Mar 2011) and for North
America from Nexant (2011), WGI (17 Aug 2011) and Table 10 in this paper.
For the lower bounds of the 2015 and 2020 estimates, we assume that Kitimat LNG in Canada and
Sabine Pass LNG are partially operational by 2015 and fully operational by 2020. For the upper bounds,
we assume that all proposed projects are completed on schedule.
5 Note that Australia exports LNG almost exclusively to Asia / Oceania (BP, 2011); Asia / Oceania remains the most attractive market for Qatar while Russia’s Northeast Asian LNG export terminals are very likely to cater only to Asia and Oceania.
table 12: Liquefaction capacities of potential exporters to Asia (million tons per year)
11
State of the Region 2011-2012
Supplement
imPact on gas and oil Price differentials
Regardless of actual export volumes, the prospect of significant north American LnG exports is likely to have an impact on gas price differentials and oil-gas price differentials in the region.
Asian LNG importers currently do not have access to a competitive market. Japan and South Korea source their LNG imports from a limited number of countries which hold significant market power. This market power is further enhanced by the pricing formulas of most long-term LNG contracts, which tie natural gas prices to the price of crude oil. While oil indexing was logical in the 1960s when natural gas used to be a substitute for home heating oil, natural gas today tends not to be a substitute for oil and the earlier logic behind indexation no longer holds. Instead, oil-indexed prices allow suppliers to assert their market power by charging high prices, partly because of high crude prices but also because such formulas can serve to aggregate the market power of a number of producers by providing an implicit collusive mechanism -- if all suppliers utilize oil-indexation (and crude oil prices are high enough), LNG prices will be maintained at high levels, to the benefit of all LNG exporters and LNG exporting countries.
Given the oligopolistic nature of the Asian LNG market and the high Asian gas price, the entry of North American producers into the Asian LNG market will challenge the market power of existing producers and threaten to capture some of their market share. At the same time, though, the break-even prices for North American producers are higher than those for producers from countries such as Qatar. In such a scenario, a rational response by existing
producers will be to reduce the price they charge Asian buyers, so as to price North American producers out of the market while continuing to maintain their share of the market (albeit with lower prices and therefore lower profits). There are already indications that Qatari gas producers behave in the manner described above. In response to the growing threat of Australian competition, Qatar has recently reduced its price demands towards Japan even in spite of the post-Fukushima surge in Japan’s LNG demand.
One way Asian prices might decrease, in response to the entry of North American producers, is through adjustments to oil-indexation formulas (e.g. a decrease in the slope in a typical formula). What is unique about the North American gas supply push, however, is that it may eventually challenge the very basis of Asian LNG pricing- the use of oil-indexed formulas. North American gas prices are not oil-indexed and thus provide their own alternative benchmarks for pricing (e.g. Henry Hub pricing). Given the large differential between oil and gas prices in North America, prices of North American LNG based on gas-hub indices are likely to be much lower than prices determined using traditional oil-indexed formulas, which could lead buyers to increasingly explore alternative pricing mechanisms for contract LNG. Although oil-indexation formulas are likely to stay, if pricing based on North American gas-hub prices is adopted at some point in the future due to the influx of North American exports, Asian prices (and therefore price differentials between Asia and North America) are likely to fall, independently of whether sellers pursue a strategy of lowering prices in order to maintain market share.
Furthermore, price differentials can be expected to decline because of a potential shift in the balance between contract and spot LNG prices used by Asian buyers. While contracted LNG has been the traditional mainstay, a number of economies have recently demonstrated an increased openness to purchasing spot LNG. For instance, in the aftermath of the March earthquake, Japanese buyers have tended not to rush into new long-term contracts, relying instead on spot LNG and LNG from short-term contracts to cover up for lost nuclear and thermal capacity. North America’s entry into the Asian LNG market, by providing Asian buyers with an additional source of LNG supplies, might persuade them to buy a greater proportion of their LNG from spot markets. The fact that Henry Hub spot prices are far lower than contract LNG prices would mean that the average price paid by Asian buyers for their LNG would decline (even if contract prices remained the same).

12
Section ThREE
ProsPects for transPacific oil and coal trade
03SECtion
In general, prospects for transpacific oil and coal trade are relatively muted in comparison to natural gas trade. According to IEA’s projections, the share of coal in the energy mix of all the major Asian economies will decline substantially, as we saw in Figure 2. On the other hand, in absolute terms, Asia’s coal consumption is projected to increase substantially (from 2601 Mtce in 2008 to 4081 Mtce in 2035), driven by increases in coal consumption in China, India and Indonesia. While consumers of coal have not been as reliant on imports as oil and natural gas consumers (recall that only 14.9% of the Asia’s coal needs are met by imports), the importance of imports to coal has been rising in this region, with China becoming a net coal importer in 2009 for the first time. By contrast, OECD countries such as the USA and Japan will reduce their coal demand over the next 25 years (World Energy Outlook 2010, International Energy Agency), thus increasing the supply of coal available for exports in such countries. The combination of the growth in demand in Asia (largely China and India) and the increased net supply in North America (largely USA) raises the possibility of transpacific coal trade, with the USA potentially selling coal on a major basis to China.
However, the Energy Information Administration (2010) points out a number of reasons why a significant rise in US coal exports to China is unlikely. The main reason is that the US produces coal at a relatively high cost, and is thus a “swing” supplier in the international coal trade market, only exporting to other countries when the price increases. Geographical factors also come into play- the global coal market is effectively segmented into the Atlantic and the Pacific regions, and the US is only a marginal player in the former whilst rarely participating in the latter. Exporting coal from the West Coast, an attractive idea in theory since it would
result in reduced transportation costs, is rendered unlikely by the absence of a large dedicated coal terminal on the West Coast. As for China’s new status as an importer, it is likely to import its coal requirements from Australia, Russia, Mongolia and Mozambique, rather than from the US.
Prospects for transpacific oil trade are somewhat more upbeat, in particular for Canada which has plentiful oil sands deposits in the state of Alberta. In fact, according to IEA, even the US has the potential to become an oil exporter, with an additional production of 500,000 barrels a day from oil shale fields in Texas and North Dakota (New York Times, 16 Jun 2011). However, given that the US continues to import significant quantities of oil from the Middle East, Africa and Latin America (see Figure 3), increased US oil production is more likely to be substituted for imports rather than exported.
Canada seems the more likely candidate to export oil to Asia. Canada can increase its oil production by 1.3 million barrels a day according to IEA, so supply is certainly not an issue. The key choice for Canadian oil producers is between exporting oil south to the US and west to Asia. Currently Canada is almost entirely reliant on a single market- the US - for selling its oil, with exports to US accounting for close to 98% of its overall oil exports (BP Statistical Review of World Energy, June 2011). Exporting oil to Asia would provide Canada with the benefits of diversification and reduce its reliance on a single market for oil.
There are also purely economic reasons favoring export of oil from Canada to Asia. Firstly, the costs of transporting oil to China, Japan, S Korea and Chinese Taipei (via pipeline and tanker) are lower than the costs of transporting oil to US (via pipeline). Secondly, while crude market prices generally tend to match each other
quite closely, in the past year or so a differential has opened up between WTI prices and crude oil prices in the rest of the world. Starting from 2010, the JCC crude price has inched ahead of the WTI price. The new oil price differential (a result of the relative oil supply glut in North America and in particular Canada), though small in relative terms, also favors Canadian oil exports to Asia. The economic advantages of Canadian oil exports to Asia, however, must be balanced against the fact that oil produced from oil sands is less fungible than sweeter grades from traditional sources.
The biggest obstacles to Canadian oil exports to Asia, however, have to do with environmental and regulatory issues. There is domestic and international opposition to the oil sands in general due to the environmental impacts, even though these concerns are highly unlikely to bring further development of the oil sands to a complete standstill. The more immediate roadblock is opposition to the proposed Northern Gateway Pipeline that would transport oil from the Athabasca oil-sands in Alberta to Kitimat, British Columbia on the Pacific coast, for onward shipment to Asia.
If North American crude oil exporting capacity can be achieved, it is likely that there will be a narrowing of the differential in WTI and Brent/JCC crude prices, similar to the reduction in natural gas price differentials between North America and Asia. The price spread in crude oil is a relatively recent phenomenon, but it is a function of the same fundamental causes that affect gas price differentials, namely surplus energy supply in North America coupled with the very limited ability (especially for Canada) to export oil to destinations outside the continent. In recent months, the spread between Brent and WTI prices has widened to as much as US$25 a barrel.

13
State of the Region 2011-2012
SupplementSection FOuR
asian investments in north american oil and gas industry
04SECtion
table 13: Investments by Asian oil & gas companies in North American oil and gas industry
Source: Wall Street Journal (31 Jan 2011), Business Times (11 Feb 2011), Financial Times (22 Mar 2011), Financial Times (13 Apr 2011), and Wall Street Journal (20 Jul 2011)
Date Categoryinvesting country
investing company
Recipient country
Project/ company
Valuation (in billion US$)
May-05 Oil sands China CNOOC Canada MEG 0.2
Aug-06 Oil sands S Korea KNOC Canada Black Gold 1.7
Apr-10 Oil sands China Sinopec Canada Syncrude 4.6
Nov-10 Oil sands Thailand PTT Canada Kai Kos Dehseh 2.3
Jan-11 Shale gas & oil China CNOOC USA Chesapeake 0.6
Jan-11 Pipeline China Sinopec CanadaNorthern
Gateway Pipeline2.3
Feb-11 Shale gas China Petrochina Canada Encana 6.9
Feb-11 Shale gas India Reliance USA Atlas, Chevron 3.2
Mar-11 Shale gas & oil S Korea KNOC USA Anadarko 1.6
Jul-11 Oil sands China CNOOC Canada OPTI Canada 2.1
In addition to growing interest in transpacific energy exports from North America to Asia, the past few years have also featured a trend of increasing capital and equity investments by Asian state-owned oil & gas companies in the North American oil and gas industry. Table 13 below summarizes some of the key recent investments that have been made. Almost all of the investments have been in unconventional oil and gas resources.
Most of these investments are likely motivated by straightforward profit-maximizing interests that take into account the growth prospects of shale gas and oil, as well as oil sands. In the case of oil sands, rising crude oil prices imply greater profits from those investments. Investments in shale gas are harder to defend from a profit-maximizing perspective, given the low price of natural gas in North America, if there is no intention of exporting the gas to higher paying markets.
It is likely, therefore, that some of the Asian investments in unconventional gas are motivated by broader objectives. One source of motivation could be the desire to acquire experience and technical know-how to develop similar unconventional gas fields in home economies. China, for example, is known to have substantial shale gas reserves, even though these are in remote areas that do not have access to the vast amounts of water that are needed for hydraulic fracking.
Furthermore, some of the investments appear to be tailored towards securing Asian oil and gas imports. Sinopec’s investment in the Northern Gateway Pipeline (which, if completed, would allow the transport of heavy oil to the west cost for onward shipment to Asia) appears to be motivated by a desire to secure a new import source for oil. In the same way, the recent initiative by Petronas to set up an LNG export terminal in Canada (see Table 10 above) is likely motivated by a similar desire to for access to a secure long-term energy source.
Hence there are important synergies between the North American drive to export LNG to Asia, and the Asian drive to invest in the North American oil and gas industry. Both these trends point to an important conclusion - North America and Asia are becoming increasingly interdependent in energy terms, with each having a stake in the other’s energy sector. North American LNG exports to Asia could mean that the Asian and North American gas markets will no longer be disconnected, with prices in one market affecting prices in the other. By the same token, Asian investments in North American unconventional oil and gas industry will mean that both Asia and North America will have a stake in how the unconventional gas boom in North America plays out.

THE EMERGING TRANS-PACIFIC ENERGY ECONOMY:
IMPLICATIONS FOR POLICY AND ECONOMIC PARTNERSHIP
By
Kent E. Calder
Director
Reischauer Center for East Asian Studies
SAIS/Johns Hopkins University
PRESENTED AT THE CENTER FOR GLOBAL PARTNERSHIP CONFERENCE ON
TRILATERAL COOPERATION, WASHINGTON, D.C., MAY 7-8, 2012

61
THE EMERGING TRANS-PACIFIC ENERGY ECONOMY:
IMPLICATIONS FOR POLICY AND ECONOMIC PARTNERSHIP
By
Kent E. Calder
SAIS/Johns Hopkins University
Energy was at once a strategically crucial and a conflicted agenda for the twentieth century,
serving as a major catalyst for global military conflict, and for two major Oil Shocks to the
industrialized world as well. So it promises to be, albeit in hopefully more pacific fashion, across
the twenty-first century as well. Energy supply and price remain among the most important
parameters of global economic life, for producers and consumers alike.
Few major democratic, capitalist nations are more central in the political economy of
global energy than the United States, Japan, and Canada. The United States and Japan are two of
the three largest oil importers and consumers on earth.1 Simultaneously, the United States and
Canada are also two of the world‟s largest oil and natural-gas producers. Their productive roles
are being enhanced by rapidly rising shale-gas production in both countries, and the future
prospect of substantial exports. Meanwhile Japan‟s role as the largest liquefied natural gas
(LNG) importer on earth is being further magnified by the need for alternative energy sources in
the wake of the Fukushima nuclear accident, creating important new complementarities with the
Canadian and American roles as major energy exporters.
1 The U.S. is the largest oil consumer in the world in 2010 (21.1 percent of the global total), followed by China (10.6 percent)
and Japan (5.0 percent). The three countries are also the world‟s largest oil importers, with 21.8 percent, 11.1 percent, and 8.5
percent of world oil imports respectively. See BP. Statistical Review of World Energy, June, 2011 edition, p. 9 and p. 18.

62 TOWARD A NEW ERA OF TRANS-PACIFIC ENERGY INTERDEPENDENCE
The Trans-Pacific Energy Economy in Historical Context
For the first four decades of the twentieth century, the United States was an important supplier of
energy to Japan, particularly in the form of oil. The end of that interdependence on the eve of
World War II arguably accelerated the onset of military conflict.2 After World War II, American
majors such as Standard Oil of New Jersey, Mobil, and Texaco held a central role as distributors
of petroleum products in Japan for over three decades, but the actual flow of energy imports into
Japan was mainly from Southeast Asia and the Middle East, rather than the United States. Even
when oil and gas were discovered in large quantities on the North Slope of Alaska in the 1970s,
domestic interest-group pressures within the U.S. made the economically rational export of oil to
Japan politically impossible.3
Both the U.S. and Canada have of course exported substantial amounts of coal to Japan
for years, and Canada has exported significant amounts of uranium as well. Indeed, Canada has
recently been Japan‟s largest source of uranium supply. Yet hydrocarbon exports from North
America to Japan have been limited, and, in the case of the United States, non-existent.
For more than seventy years—since the U.S. oil embargo of 1941, on the eve of World
War II—the United States has not engaged in significant hydro-carbon exports to Japan. More
generally, oil and natural-gas trade across the Pacific has been virtually non-existent—trans-
Pacific gas trade in 2010, for example, accounted for only 0.3 percent of the worldwide total,
while trans-Pacific oil trade only constituted 1.2 percent of global totals.4 Yet that un-integrated
pattern, in the wake of historic developments on the two shores of the Pacific—the shale-gas
2 See, for example, Daniel Yergin. The Prize:The Epic Quest for Oil, Money, & Power. New York: Touchstone Books, 1991, pp.
305-327. 3 See DOE/NETL. Alaska North Slope Oil and Gas—A Promising Future or an Area in Decline? at:
http://www.netl.doe.gov/technologies/oil-gas/publications/EPreports/ANSSummaryReportFinalAugust2007.pdf. 4 BP. Statistical Review of World Energy, June 2011 edition, p. 18.

63
revolution and the post-Fukushima energy transformation in Japan—appears to be changing in
dramatic fashion. Suddenly, the prospects for an era of true trans-Pacific energy interdependence,
fraught with important geostrategic implications, appears to be emerging.
To fully understand the new profile of trans-Pacific energy interdependence and its
historic policy and geopolitical implications, it is important to review the embedded patterns of
energy supply and demand prevailing in the United States, Japan, and Canada. Following that
survey, this paper then considers economic prospects for the new era of deepening trans-Pacific
energy interdependence. In conclusion, it enumerates the strategic benefits of the emerging trans-
Pacific energy relationship, and reviews policy issues which the new trans-Pacific energy
economy evokes.
North America and Japan in the Global Energy Economy Today
To fully appreciate emerging policy issues in U.S.-Japan-Canada energy relations, it is important
first to grasp concretely the role of these three nations in the broader global energy economy. As
noted previously, and in Figure I, the US and Canada are major energy producers, while the US
and Japan are major energy consumers and importers. The US and Canada both have substantial
untapped coal and shale gas reserves, while Canada also has substantial un-utilized export
capacity with respect to non-conventional oil and uranium.

64 TOWARD A NEW ERA OF TRANS-PACIFIC ENERGY INTERDEPENDENCE
FIGURE I: U.S., JAPANESE, AND CANADIAN ENERGY TRADE IN
COMPARATIVE PERSPECTIVE (2010)
Country Oil
[tb/d]
Natural Gas
[bcm] Coal Uranium
United States
Ex: 2,154
Im: 11,689
Net: - 9,535
Ex: 31.98
Im: 105.48
Net: -73.50
Exporter Little Trade
Canada
Ex: 2,599
Im: 846
Net: +1,743
Ex: 92.40
Im: 22.91
Net: +69.49
Exporter Exporter
Japan
Ex: 302
Im: 4,567
Net: -4,265
Ex: [0]
Im: 93.48
Net: -93.48
Importer Importer
World total
Ex: 53,510
Im: 53,510
Net: 0
Ex: 975.22
Im: 975.22
Net: 0
Source: BP, Statistical Review of World Energy, June 2011 edition.
Notes:
(1) tb/d = thousand barrels per day, bcm = billion cubic meters per year, Ex = Export, Im = Import
(2) Japan‟s natural gas exports assumed to be 0.
(3) „+ (plus)‟ indicates exports and „-(minus)‟ indicates imports.
Japan’s Energy “Angst”
As the data above suggest, Japan and its North American partners stand in radically contrasting,
and yet complementary, relations to the global energy economy. Japan is a massive importer of
all variety of energy inputs—Canada and the United States are largely exporters, although the
US also does import substantial amounts of oil. To compound Japan‟s energy vulnerabilities, its
economy is highly energy intensive, and it is radically dependent for hydro-carbon supplies on

65
the Middle East. Indeed, close to 80 percent of its oil imports come from the Persian Gulf,
compared to only around 15 percent for the United States.5
This radical Japanese dependence on the Middle East is driven by both geography and
energy economics. The Persian Gulf is directly accessible to Japan, via the Strait of Malacca and
the Indian Ocean, while both supply and price of Gulf oil are relatively predictable. Despite the
past predictability, Japanese are nervous about two aspects of the Middle East situation: rising
competition from other East Asian demandeurs, including China and South Korea; as well as the
apparently waning geopolitical role of the United States in the region. Especially in the wake of
the Fukushima accident, which is forcing them to seek alternatives to nuclear power, and to
procure more and more LNG, over-reliance on the Persian Gulf is making them increasingly
nervous.
Three forms of energy have historically assuaged Japanese misgivings about heavy
energy dependence on the Persian Gulf: coal, nuclear power, and natural gas. The first of these,
however, has become more problematic in recent years, due to increasing concerns about global
climate change. The second is at least temporarily impractical, in the wake of Fukushima. That
leaves the third: natural gas.
Natural gas, felicitously, is suddenly available from a new, non-Middle Eastern source—
North America—thanks to the emergence of shale gas. And it is available precisely as the need
for it is intensified by the Fukushima accident. Almost unbelievably, it is also available at
potentially very reasonable prices, with the spot price of LNG in North America, excluding
5 Japan obtained 79.7 percent of its total oil imports from the Middle East in 2010, while the United States obtained only 14.9
percent from that region. See BP. Statistical Review of World Energy, June, 2011 edition, p. 18.

66 TOWARD A NEW ERA OF TRANS-PACIFIC ENERGY INTERDEPENDENCE
transportation costs, hovering around one fourth of contract price levels prevailing in Japan that
included those costs.6
Prospects for Future Trans-Pacific Energy Interdependence
Given trans-Pacific LNG price trends of the past two years, driven by the shale-gas revolution in
North America and the Fukushima accident in Japan, natural gas trade across the Pacific is now
economically feasible. The infrastructural obstacles, of course, are not inconsequential: (1)
greater gasification capacity in Japan, (2) green-field liquefaction facilities along Canada‟s West
Coast to process natural gas exports; and (3) significant technical modifications on LNG import
terminals along the U.S. East and Gulf coasts, to make them suitable instead for LNG exports
across the Pacific. Yet the long-term economic logic makes trans-Pacific trade in natural gas at
last economically feasible.
In April 2012, the U.S. Federal Energy Regulatory Commission (FERC) authorized the
construction and operation of up to four modular LNG trains for the liquefaction of domestically
produced natural gas at the Sabine Pass LNG terminal in Cameron Parish, Louisiana7, following
Department of Energy authorization to export LNG to FTA countries in September 2010, and to
non-FTA countries in May 2011.8 The Sabine Pass facility is expected to begin exporting natural
gas in 2015, with an export capacity of 8 million tons per year9, and with all capacity already
6 See Tilak K. Doshi and Nahim Bin Zahur. Prospects for Trans-Pacific Energy Trade. Singapore: Pacific Economic Cooperation
Council, 2012. 7 “Cheniere gets FERC approval for Sabine Pass LNG export facility”, at:
http://www.marinelog/com/index.php?option=com_content&view=article&id-2277:cheni... 8 See http://www.cheniereenergypartners.com/liquefaction_project/DOE_filings.shtml. 9 The first two trains will commence operation in 2015-2016, and another two trains will commence in 2017-2018. 16 mtpa will
be available once four trains are completed. Full operating capacity will thus be 16 million tons, available in 2017-2018. See
http://phx.corporate-ir-net/phoenex.zhtml?c=207560&p=irol-newsArticle&ID=1683623&highlight=.

67
committed.10
As indicated in Table II, Sabine Pass is only one of ten major LNG export projects
currently planned in the United States, which are directed largely toward supplying the East
Asian market.
TABLE II: PROPOSED LNG EXPORT PROJECTS IN THE U.S.
Applications Received by DoE/FE to Export Domestically Produced LNG from the Lower-48
States (as of March 23, 2012)
Company Location
/ Quantity
FTA
Applications
Non-FTA
Applications
Sabine Pass Liquefaction,
LLC
Gulf Coast
2.2 Bcf/d
Approved
Sep. 2010
Approved
May 2011
Freeport LNG Expansion,
L.P. and FLNG
Liquefaction, LLC
Gulf Coast
1.4 Bcf/d
Approved
Feb. 2011
Under DoE
Review
Lake Charles Exports,
LLC
Gulf Coast
2.0 Bcf/d
Approved
Jul. 2011
Under DoE
Review
Carib Energy (USA) LLC South-Eastern
0.03 Bcf/d: FTA
0.01 Bcf/d: non-FTA
Approved
Jul. 2011
Under DoE
Review
Dominion Cove Point
LNG, LP
East Coast
1.0 Bcf/d
Approved
Oct. 2011
Under DoE
Review
Jordan Cove Energy
Project, L.P.
West Coast
1.2 Bcf/d
Approved
Dec 2011
Under DoE
Review
Cameron LNG, LLC Gulf Coast
1.7Bcf/d
Approved
Jan. 2012
Under DoE
Review
Freeport LNG Expansion,
L.P. and FLNG
Liquefaction, LLC
Gulf Coast
1.4 Bcf/d
Approved
Feb. 2012
Under DoE
Review
Gulf Coast LNG Export,
LLC
Gulf Coast
2.8 Bcf/d
Under DoE Review
Cambridge Energy, LLC Southeast, Gulf Coast
0.27 Bcf/d
Pending
Approval
N.A.
Total of all Applications Received 14.00 Bcf/d 13.71 Bcf/d Source: Office of Oil and Gas Global Security and Supply, Office of Fossil Energy, U.S. Department of Energy
Note: Bcf/d = billion cubic feet per day.
10 Some of this capacity is committed to non-Pacific buyers, suggesting that it may well be delivered partially to non-Pacific
destinations, although that of course still remains uncertain. See http://phx.corporate-ir.net/phoenix.zhtml?c=207560&p=irol-
newsArticle&ID=1653972&highlight=

68 TOWARD A NEW ERA OF TRANS-PACIFIC ENERGY INTERDEPENDENCE
Japan has also, it should be noted, historically purchased some LNG from Alaska, and will likely
continue to do so in future, although those amounts so far have been relatively modest compared
to Japan‟s other supplies.
Apart from large and rapidly expanding LNG trade, substantial trans-Pacific investment
in the Canadian oil sands is also in progress that may lead to future trans-Pacific oil exports,
together with major infrastructure projects, such as the $2.3 billion Northern Gateway Pipeline in
Canada. This pipeline will carry oil from the oil sands district of northern Alberta to Canada‟s
Pacific coast, for export across the Pacific. Asian investment in Canadian oil sands projects and
related infrastructure now totals well over $12 billion.
A decade ago most trans-Pacific investment in North American energy was from Japan,
but there has been a significant shift in recent years. Energy demand has surged in China,
together with rising affluence, and an increasing share of investment is from China. Korea has
also become a significant investor, facing fewer regulatory obstacles to its investments and
exports from the United States than Japan, due to provisions of the US Natural Gas Act of 1938
as amended by the Energy Policy Act of 1992, stipulates preferential treatment, through a
Department of Energy approval process, for nations concluding free-trade agreements with the
United States.11
Coal is historically an important part of trans-Pacific energy trade and
investment, and cannot be neglected in future. It is particularly salient in Japan-Canada economic
relations. Coal (mainly metallurgical, to fuel Japan‟s massive steel industry), is Canada‟s largest
export to Japan, totaling $2.3 billion in 2009, or over 19 percent of Canadian exports.12
In 2011
coal also surged into prominence in US-Japan relations, following the reduction in Japanese
11 On these regulatory details, see http://fossil.energy.gov/programs/gasregulation/How to Obtain Authorization
to_Import_an.html. 12 Japanese trade data, at: http://www.mofa.go.jp.

69
nuclear capacity in the wake of the Fukushima disaster, with American exports increasing 119
percent, to almost 7 million tons.13
Civilian nuclear power has traditionally been the energy sector where trans-Pacific
interdependence has been the deepest. The Eisenhower Atoms for Peace program inspired the
original siting of nuclear plants in Japan, and most of the early equipment—including the
Fukushima nuclear plant itself—was supplied by American manufacturers. General Electric, for
example, provided substantial capital equipment for nuclear plants to Tokyo Electric Power, both
independently, and cooperatively with Toshiba. for many years was the largest American
exporter to Japan and Tokyo Electric Power was the largest corporate importer from the United
States, with the bulk of their mutual trade in the nuclear power area. Japan also has traditionally
imported substantial amounts of nuclear fuel from the US—Y84.7 billion in 2010.14
Seven
percent of Japan‟s uranium supplies, in total, come from the U.S., which is Japan‟s fifth largest
supplier.15
The nuclear industries of the U.S. and Japan are also intimately intertwined, with
Toshiba owning Westinghouse as a subsidiary, and Hitachi and General Electric enjoying a
longstanding joint-venture relationship.
Many parts of the United States are natural energy partners for Japan, but among the most
promising is Alaska. Geographically, it is the closest part of the U.S. to Japan, and it is notably
well endowed with energy resources. In 2011 Alaska exported nearly $388 million in energy
resources to Japan, including LNG, refined petroleum products, and coal. Over half of this total,
13 Bill Chappell, “U.S. Coal Exports Soar to 1991 Heights”, at: http://www.npr.org/blogs/thetwo-way/2012/04/10/150360355/u-
s-coal-exports-soar-to-199. 14 See Ministry of Finance statistical database, at:
http://www.customs.go.jp/toukei/srch/index.htm?M=13&P=1,2.....4.1,2010,0,0,0,3,50105....1.....50. 15 The other largest suppliers are Canada, Australia, Namibia, and Niger. See http://www.enecho.meti.go.jp/topics/energy-in-
japan/energy2006html/gragh/gfa.html.

70 TOWARD A NEW ERA OF TRANS-PACIFIC ENERGY INTERDEPENDENCE
or $198 million, consisted of LNG exports, and those will likely increase substantially in
future.16
Canada has also been an important participant in trans-Pacific energy trade17
, including
the nuclear dimension. Canada continues, for example, to serve as Japan‟s largest supplier of
uranium ore, supplying well over a quarter of Japan‟s total imports.18
Total Japan-Canada trade
in radioactive elements, including uranium, totaled 2.6 billion yen in 201019
.
Over the past year since the Fukushima accident, nuclear regulators of the United States
and Japan have been in intense communication with one another as never before on safety issues,
but their dialogue will inevitably broaden. Looking to the future, it is hard to see how Japan will
be economically able to radically phase out its existing nuclear plants, despite continuing public
opposition in the wake of the Fukushima accident. If and when Japanese nuclear plants resume
operation on a larger scale, North America will no doubt once again play a significant role in
providing both raw materials and services to Japan. And U.S. and Japanese firms will in any case
continue to cooperate in garnering nuclear contracts in third countries, capitalizing on their
advanced technology.
The Fukushima accident, and the aging of existing Japanese nuclear plants, may in fact
also open a new and quite dynamic area for U.S.-Japan energy cooperation. The United States, as
a pioneer in the nuclear industry, has by definition many older nuclear plants, and substantial
experience in the decommissioning of nuclear facilities. This experience will be valuable in
16 See “Alaska Exports Reach Record Highs”, at: http://gov.alaska.gov. 17 Canada has, for example, exported CANDU reactors to South Korea, although not to Japan. 18 See METI data, from: http://www.enecho.meti.go.jp. 19 These figures are for Statistical Code 2488 (Radioactive chemical elements and radioactive isotopes, etc.) See Trade Statistics
of Japan database, at: thhp://www.customs.go.jp/English/tariff/2012_4data/i201204e_28.htm.

71
helping Japan deal with its current problems, and could be an area for deepened trans-Pacific
partnership.
The Emerging Trans-Pacific Energy Policy Agenda in an Era of Interdependence
In a nation like Japan that imports nearly 99 percent of its oil and gas, adequate energy supply is
naturally seen, almost instinctively, as a core element of national security. That instinctive
dimension is arguably lacking in the United States and Canada, which perceive national
security—especially in the U.S.—in more narrowly political-military terms. Conceptions of
energy security on the two shores of the Pacific are complementary to one another, especially
when the United States provides military security for Japan‟s energy sea lanes to the Persian
Gulf, and for the political stability of key nations in the Gulf as well. Yet U.S. and Japanese
conceptions of energy security, in particular, differ substantially in subtle, subjective dimensions.
Japan and its North American partners have, however, developed a considerable level of
trust with one another, including broad Japanese confidence in the transparency and stability of
North American institutions, as well as the U.S.-Japan alliance. This confidence makes Japanese
energy interdependence with North America attractive, especially given Tokyo‟s high current
levels of dependence on the Persian Gulf for vitally needed hydro-carbons. The attractiveness is
compounded by both the new availability of shale-gas supply, and the new Japanese domestic
requirements for gas in the wake of Fukushima.
Energy issues, of course, are embedded in larger parameters of political economy. To
assure optimal cooperation on energy, including shale gas, more explicit Japanese support of the
TPP framework would be helpful. The United States and Canada, for their part, should affirm

72 TOWARD A NEW ERA OF TRANS-PACIFIC ENERGY INTERDEPENDENCE
their commitment to free trade in energy, including shale gas, as potential for LNG exports
begins to rise.
It is important to keep in mind the tangible benefits to Japan, especially important in that
strategic nation‟s fragile post-tsunami circumstances, that would flow from expanded access,
under free-trade provisions, to North American natural gas supplies. Access to U.S. and
Canadian natural gas, much of it no doubt derived from rapidly expanding shale-gas supplies on
the continent, would afford Japanese distributors powerful leverage with Middle Eastern and
other suppliers, forcing them to drop or revise traditional oil-linked pricing formulas that
severely disadvantage Japan and impede its economic recovery. The availability of lower-cost
North American gas under a free-trade regime would thus help reduce the burden of high energy
prices that is impeding Japan‟s recovery.
Flexible provision of expanded North American natural-gas supplies to Japan would also
likely have tangible diplomatic benefits to the United States and Canada that would help
strengthen trans-Pacific alliance relations. Expanded gas supplies would, for example, help
reward Japan for its economically costly cooperation with Iran sanctions, help insure longer-term
cooperation with those sanctions, and reduce resentment at special U.S. efforts to encourage
China and South Korea to cut Iran procurements by compensatory benefits in the Arab Gulf,
predominantly a traditional energy supplier for Japan. Expanded North American gas supplies
for Japan could also slow the deepening of political-economic relations with Russia, a potentially
important alternate energy partner for Tokyo.
With the first authorizations for North American gas exports to Asia, including Japan,
just now in progress, and with memories of the Fukushima tragedy still fresh, it is an excellent

73
time to deepen the trans-Pacific energy dialogue at the policy as well as the economic level. Such
dialogue no doubt needs both bilateral and trilateral dimensions. To deepen and broaden their
strategically important but politically delicate bilateral relationship, the United States and Japan
need a forum for deliberating diverse issues of mutual energy security and efficiency in an
ongoing fashion. Such a dialogue, potentially patterned after the SII talks of the early 1990s with
their multiple policy baskets, could cover such diverse topics as nuclear safety, nuclear
decommissioning, renewable energy, and smart grids and improved energy infrastructure, as well
as energy efficiency. Involving multiple government agencies of both the United States and
Japan, the Dialogue could also provide a role for working-level communication between
embassies and local specialists in both nations.
Canada, Japan, and the United States together also need more intense trilateral energy
discussion. The three countries, after all, have substantial shared interests and concerns, as trans-
Pacific energy interdependence continues to rise. These shared interests center on maintaining
free trade and transparent investment practices in the energy sector, while also assuring that
trans-Pacific energy trade and investment does not undermine shared national-security concerns.
IN CONCLUSION
The trans-Pacific world is approaching a true critical juncture in the energy sphere. The Japanese
and the North American shores of the Pacific share important core values of democracy and
respect for free enterprise that make them natural partners. Until recently, however, they have
engaged in remarkably little energy trade and investment, apart from coal and uranium, despite
their intense interaction in other spheres.

74 TOWARD A NEW ERA OF TRANS-PACIFIC ENERGY INTERDEPENDENCE
A new, much broader era of trans-Pacific energy interdependence is dawning. Both
Canada and the United States are rapidly emerging as potentially substantial suppliers of LNG to
Japan, just when Japan itself, in the wake of Fukushima, most needs those supplies. For both
symbolic and substantive reasons, Canada, Japan, and the United States must grasp this historic
opportunity to re-affirm the importance of free trade in energy, as it begins to accelerate across
the Pacific; and to engage in a broadened energy dialogue that will examine in a far-sighted way
avenues of cooperation that may steadily broaden in future.

Asia-Pacific Policy Papers Series
Contributing actively to public-policy debate in the nation’s capital, the Reischauer Center
publishes occasional papers disseminating its analytical work. Subjects of concern include:
the Korean nuclear crisis, Northeast Asian relationships with the Middle East; Asian energy
prospects; and assessments of Japanese economic reform.
No. 1 The North Korean Nuclear Crisis and American Policy
No. 2 Japan’s Stealth Reform: The Key Role of Political Process
No. 3 China’s Energy Diplomacy and Its Geopolitical Implications
No. 4 Stabilizing the US-Japan-China Strategic Triangle
No. 5 Enhancing Japan’s Energy Security
No. 6 Moving (Slightly) Closer To Iran
No. 7 Japan’s Asianism, 1868-1945
No. 8 The Politics of the Futenma Base Issue in Okinawa
No. 9 The Reischauer Heritage in the Twenty-First Century
No.10 Demystifying FTAs
No.11 Central Asia’s Oil & Gas Sector Since the 2008 Financial Crisis
No.12 Cracks in the Alliance? Futenma Log: Base Relocation Negotiations
No.13 A Changing Arctic and the Trans-Pacific Relationship: American Perspective
No.14 Toward a New Era of Trans-Pacific Energy Interdependence


![CartemotoneigeSagLac2014-15 [Unlocked by ] sentier lac st-jean.pdf · 6.6 trans-quÉbec 83 trans-quÉbec 93 trans-quÉbec 93 trans-quÉbec 93 trans-quÉbec 93 trans-quÉbec 93 trans-quÉbec](https://static.fdocuments.us/doc/165x107/5b2cb5eb7f8b9ac06e8b5a01/cartemotoneigesaglac2014-15-unlocked-by-sentier-lac-st-jeanpdf-66-trans-quebec.jpg)
