TOWARD A METABOLIC THEORY OF · PDF fileTOWARD A METABOLIC THEORY OF ECOLOGY ... Metabolism...
51
1771 Ecology, 85(7), 2004, pp. 1771–1789 q 2004 by the Ecological Society of America TOWARD A METABOLIC THEORY OF ECOLOGY JAMES H. BROWN, 1,2,4 with JAMES F. GILLOOLY, 1 ANDREW P. ALLEN, 1 VAN M. SAVAGE, 2,3 AND GEOFFREY B. WEST 2,3 1 Department of Biology, University of New Mexico, Albuquerque, New Mexico 87131 USA 2 Santa Fe Institute, 1399 Hyde Park Road, Santa Fe, New Mexico 87501 USA 3 Theoretical Division, MS B285, Los Alamos National Laboratory, Los Alamos, New Mexico 87545 USA JAMES H. BROWN, MacArthur Award Recipient, 2002 Abstract. Metabolism provides a basis for using first principles of physics, chemistry, and biology to link the biology of individual organisms to the ecology of populations, communities, and ecosystems. Metabolic rate, the rate at which organisms take up, transform, and expend energy and materials, is the most fundamental biological rate. We have developed a quantitative theory for how metabolic rate varies with body size and temperature. Metabolic theory predicts how metabolic rate, by setting the rates of resource uptake from the environment and resource allocation to survival, growth, and reproduction, controls ecological processes at all levels of organization from individuals to the biosphere. Examples include: (1) life history attributes, including devel- opment rate, mortality rate, age at maturity, life span, and population growth rate; (2) population interactions, including carrying capacity, rates of competition and predation, and patterns of species diversity; and (3) ecosystem processes, including rates of biomass production and respiration and patterns of trophic dynamics. Data compiled from the ecological literature strongly support the theoretical predictions. Even- tually, metabolic theory may provide a conceptual foundation for much of ecology, just as genetic theory provides a foundation for much of evolutionary biology. Key words: allometry; biogeochemical cycles; body size; development; ecological interactions; ecological theory; metabolism; population growth; production; stoichiometry; temperature; trophic dynamics. 4 E-mail: [email protected]
Transcript of TOWARD A METABOLIC THEORY OF · PDF fileTOWARD A METABOLIC THEORY OF ECOLOGY ... Metabolism...

1771
Ecology, 85(7), 2004, pp. 1771–1789q 2004 by the Ecological Society of America
TOWARD A METABOLIC THEORY OF ECOLOGY
JAMES H. BROWN,1,2,4
with JAMES F. GILLOOLY,1 ANDREW P. ALLEN,1 VAN M. SAVAGE,2,3 AND GEOFFREY B. WEST2,3
1Department of Biology, University of New Mexico, Albuquerque, New Mexico 87131 USA2Santa Fe Institute, 1399 Hyde Park Road, Santa Fe, New Mexico 87501 USA
3Theoretical Division, MS B285, Los Alamos National Laboratory, Los Alamos, New Mexico 87545 USA
JAMES H. BROWN, MacArthur Award Recipient, 2002
Abstract. Metabolism provides a basis for using first principles of physics, chemistry, andbiology to link the biology of individual organisms to the ecology of populations, communities,and ecosystems. Metabolic rate, the rate at which organisms take up, transform, and expend energyand materials, is the most fundamental biological rate. We have developed a quantitative theoryfor how metabolic rate varies with body size and temperature. Metabolic theory predicts howmetabolic rate, by setting the rates of resource uptake from the environment and resource allocationto survival, growth, and reproduction, controls ecological processes at all levels of organizationfrom individuals to the biosphere. Examples include: (1) life history attributes, including devel-opment rate, mortality rate, age at maturity, life span, and population growth rate; (2) populationinteractions, including carrying capacity, rates of competition and predation, and patterns of speciesdiversity; and (3) ecosystem processes, including rates of biomass production and respiration andpatterns of trophic dynamics.
Data compiled from the ecological literature strongly support the theoretical predictions. Even-tually, metabolic theory may provide a conceptual foundation for much of ecology, just as genetictheory provides a foundation for much of evolutionary biology.
Key words: allometry; biogeochemical cycles; body size; development; ecological interactions;ecological theory; metabolism; population growth; production; stoichiometry; temperature; trophicdynamics.
4 E-mail: [email protected]

1772 JAMES H. BROWN ET AL. Ecology, Vol. 85, No. 7
Per
spec
tive
s
INTRODUCTION
The complex, spatially and temporally varying struc-tures and dynamics of ecological systems are largelyconsequences of biological metabolism. Wherever theyoccur, organisms transform energy to power their ownactivities, convert materials into uniquely organicforms, and thereby create a distinctive biological,chemical, and physical environment.
Metabolism is the biological processing of energyand materials. Organisms take up energetic and ma-terial resources from the environment, convert theminto other forms within their bodies, allocate them tothe fitness-enhancing processes of survival, growth,and reproduction, and excrete altered forms back intothe environment. Metabolism therefore determines thedemands that organisms place on their environment forall resources, and simultaneously sets powerful con-straints on allocation of resources to all components offitness. The overall rate of these processes, the meta-bolic rate, sets the pace of life. It determines the ratesof almost all biological activities.
Recent progress in understanding how body size,temperature, and stoichiometry affect biological struc-ture and function at the molecular, cellular, and whole-organism levels of organization raises the prospect ofdeveloping a metabolic theory of ecology. Metabolismis a uniquely biological process, but it obeys the phys-ical and chemical principles that govern the transfor-mations of energy and materials; most relevant are thelaws of mass and energy balance, and thermodynamics.Much of the variation among ecosystems, includingtheir biological structures, chemical compositions, en-ergy and material fluxes, population processes, and spe-cies diversities, depends on the metabolic character-istics of the organisms that are present. Much of thevariation among organisms, including their life historycharacteristics and ecological roles, is constrained bytheir body sizes, operating temperatures, and chemicalcompositions. These constraints of allometry, bio-chemical kinetics, and chemical stoichiometry lead tometabolic scaling relations that, on the one hand, canbe explained in terms of well-established principles ofbiology, chemistry, and physics and, on the other hand,can explain many emergent features of biological struc-ture and dynamics at all levels of organization.
THEORETICAL FOUNDATIONS
Virtually all characteristics of organisms vary pre-dictably with their body size, temperature, and chem-ical composition (e.g., Bartholomew 1981, Peters 1983,Calder 1984, Schmidt-Nielsen 1984, Niklas 1994, Gil-looly et al. 2001, 2002, Sterner and Elser 2002). Formore than a century, biologists have been investigatingthe mechanistic processes that underlie these relation-ships. Recent theoretical advances have shown moreexplicitly how these biological characteristics can bequantified, related to each other, and explained in terms
of basic principles of biology, chemistry, and physics(e.g., Peters 1983, Sterner 1990, Elser et al. 1996,2000a, West et al. 1997, 1999a, b, 2001, Enquist et al.1999, Gillooly et al. 2001, 2002). Together, the olderconceptual and empirical foundations and the more re-cent theoretical advances provide the basis for a met-abolic theory of ecology. This theory explicitly showshow many ecological structures and dynamics can beexplained in terms of how body size, chemical kinetics,and resource supply affect metabolism. Through var-iation in the rates and biochemical pathways of me-tabolism among different kinds of organisms and en-vironmental settings, metabolic theory links the per-formance of individual organisms to the ecology ofpopulations, communities, and ecosystems.
Metabolism and metabolic rate
Metabolism is a complex network of biochemicalreactions that are catalyzed by enzymes, allowing theconcentrations of substrates and products and the ratesof reactions to be regulated. A chart of the chemicalreactions of metabolism shows a bewildering numberof substrates, enzymes, and pathways. Nevertheless,the core of metabolism consists of a small number ofreactions that form the basis of the TCA (tricarboxylicacid) cycle (Morowitz et al. 2000). The vast majorityof organisms use the same basic biochemistry, but therates of resource uptake, transformation, and allocationvary.
When we speak of energy and energetics, we referto potential energy: the energy contained in photons orchemical bonds. Some fraction of this energy is con-verted by the reactions of photosynthesis and respira-tion into biologically useful forms that are used to per-form the work of biosynthesis, membrane transport,muscle contraction, nerve conduction, and so on. Weuse the term kinetics to refer to kinetic energy, theenergy of molecular motion. Kinetics affect biologicalprocesses largely through the influence of temperatureon metabolic rate.
The metabolic rate is the fundamental biological rate,because it is the rate of energy uptake, transformation,and allocation. For a heterotroph, the metabolic rate isequal to the rate of respiration because heterotrophsobtain energy by oxidizing carbon compounds as de-scribed by the reaction: CH2O 1 O2 → energy 1 CO2
1 H2O. For an autotroph, the metabolic rate is equalto the rate of photosynthesis because this same reactionis run in reverse using energy (i.e., photons) providedby the sun to fix carbon (Farquhar et al. 1980). It hasproven challenging to measure metabolic rate accu-rately and consistently. Ideally, it would be measuredas heat loss by direct calorimetry, which would quan-tify the energy dissipated in all biological activities.However, because of the fixed stoichiometry of respi-ratory gas exchange, it is nearly as accurate and muchmore practical to measure the rate of carbon dioxideuptake in plants or the rate of oxygen consumption in

July 2004 1773MACARTHUR AWARD LECTURE
Per
spectives
aerobic prokaryotes and eukaryotes (Withers 1992).Physiologists typically measure the basal or standardmetabolic rate, the minimal rate of an inactive organismin the laboratory. Basal rates are invariably less thanthe actual or field metabolic rates of free-living organ-isms, which must expend additional energy for for-aging, predator avoidance, physiological regulation,and other maintenance processes, and still more energyfor growth and reproduction. In most organisms, how-ever, the average daily energy expenditure or the long-term sustained rate of biological activity is some fairlyconstant multiple, typically about two to three, of thebasal metabolic rate (Taylor et al. 1982, Schmidt-Niel-son 1984, Nagy 2001; Savage et al., in press b).
In addition, most organisms exhibit phenotypic plas-ticity in the expression of metabolism. They can varythe rate and pathways of metabolism to some extent toadjust for variations in resource supply, such as fluc-tuating quantity and quality of food resources, or inresource demand, such as the costs of reproduction orof maintaining homeostasis in the face of altered en-vironmental temperature, osmotic concentration, or el-emental chemical composition. For example, duringperiods of resource shortages, many organisms are ableto lower metabolic rates and resource requirements byreducing activity and entering some form of diapauseor torpor. Even these phenotypic variations, however,occur within constraints on metabolic rate due to threeprimary factors: body size, temperature, and stoichi-ometry.
Body size
Since early in the 20th century, it has been knownthat almost all characteristics of organisms vary pre-dictably with body size. Huxley (1932) is credited withpointing out that most size-related variation can be de-scribed by so-called allometric equations, which arepower functions of the form
bY 5 Y M .0 (1)
They relate some dependent variable, Y, such as met-abolic rate, development time, population growth rate,or rate of molecular evolution, to body mass, M,through two coefficients, a normalization constant, Y0,and an allometric exponent, b. Most of these biologicalscaling exponents have the unusual property of beingmultiples of ¼, rather than the multiples of ⅓ that wouldbe expected from Euclidean geometric scaling. Thus,for example, Kleiber (1932) showed that whole-organ-ism metabolic rate, I, scales as
3/4I 5 I M0 (2)
where I0 is a normalization constant independent ofbody size. This same relation, with different values forthe normalization constant, describes: (1) basal meta-bolic rate, the minimal rate of energy expenditure nec-essary for survival under ideal conditions; (2) field met-abolic rate, the actual rate of energy expenditure by a
free-living organism in nature, which ideally wouldinclude allocation to growth and reproduction sufficientto maintain a stable population; and perhaps also (3)maximal metabolic rate, the rate of energy flux duringmaximal sustained activity (Savage et al., in press b).
Recently, West et al. (1997, 1999a, b) showed thatthe distinctively biological quarter-power allometricscaling could be explained by models in which whole-organism metabolic rate is limited by rates of uptakeof resources across surfaces and rates of distributionof materials through branching networks. The fractal-like designs of these surfaces and networks cause theirproperties to scale as ¼ powers of body mass or vol-ume, rather than the ⅓ powers that would be expectedbased on Euclidean geometric scaling (Savage et al.,in press b).
Temperature
It has been known for more than a century that bio-chemical reaction rates, metabolic rates, and nearly allother rates of biological activity increase exponentiallywith temperature. These kinetics are described by theBoltzmann factor or the Van’t Hoff-Arrhenius relation
2E/kTe (3)
where E is the activation energy, k is Boltzmann’s con-stant, and T is absolute temperature in K (Boltzmann1872, Arrhenius 1889). The Boltzmann factor specifieshow temperature affects the rate of reaction by chang-ing the proportion of molecules with sufficient kineticenergy, E, which here we measure in electron volts (1eV 5 23.06 kcal/mol 5 96.49 kJ/mol).
This relationship holds only over the temperaturerange of normal activity, which for most organisms liesbetween 08 and 408C (Thompson 1942, Schmidt-Niel-sen 1997). Normal operating temperature varies amongspecies and taxonomic or functional groups. Any givenspecies usually operates over some subset of this tem-perature range, although there are exceptions. For ex-ample, most aquatic organisms do not experience tem-peratures above 258–308C, endothermic birds andmammals maintain relatively high and constant tem-peratures (368–408C), some ectotherms can tolerateonly a very narrow range of temperatures, and somemicrobes from extreme environments such as hotsprings and hydrothermal vents can live at temperaturesthat approach or exceed 1008C. With some qualifica-tions, then, the exponential form (3) describes the tem-perature dependence of whole-organism metabolism ofvirtually all organisms, from unicellular microbes tomulticellular plants and animals (Gillooly et al. 2001).Nearly all other biological rates and times, includingindividual and population growth rates, and develop-ment times and life spans, show a similar temperaturedependence (Gillooly et al. 2001, 2002; Savage et al.,in press a). Interestingly, the empirically estimated ac-tivation energies for all of these processes are similar,and within the range of activation energies typically

1774 JAMES H. BROWN ET AL. Ecology, Vol. 85, No. 7
Per
spec
tive
s
observed for the biochemical reactions of metabolism(0.60–0.70 eV, Gillooly et al. 2001). This suggests thatmetabolism is the underlying process that governs mostbiological rates.
Stoichiometry
In its narrow sense, stoichiometry is concerned withthe proportions of elements in chemical reactions. Inbroader applications, such as to ecology, stoichiometryrefers to the quantities, proportions, or ratios of ele-ments in different entities, such as organisms or theirenvironments (e.g., Reiners 1986, Elser et al. 1996,2000a, Sterner and Elser 2002). Protoplasm, and thedifferent structural and functional materials that com-prise living biomass, have characteristic ratios of thecommon elements such as H, O, C, N, P, Na, Cl, S,Ca, and K. N is found primarily in proteins; P in nucleicacids, ADP and ATP, phospholipids, and skeletal struc-ture; Na or K in intracellular solutes, and so on. Allorganisms have internal chemical compositions thatdiffer from those in their environment (Lotka 1925),so they must expend metabolic energy to maintain con-centration gradients across their surfaces, to acquirenecessary elements, and to excrete waste products.
Fundamental stoichiometric relationships dictate thequantities of elements that are transformed in the re-actions of metabolism. Biochemistry and physiologyspecify the quantitative relationship between the met-abolic rate and the fluxes of elemental materialsthrough an organism. The metabolic rate dictates therates at which material resources are taken up from theenvironment, used for biological structure and func-tion, and excreted as ‘‘waste’’ back into the environ-ment. Far from being distinct ecological currencies, assome authors have implied (e.g., Reiners 1986, Sternerand Elser 2002), the currencies of energy and materialsare inextricably linked by the chemical equations ofmetabolism. These equations specify not only the mo-lecular ratios of elements, but also the energy yield ordemand of each reaction. Ecological stoichiometry isconcerned with the causes and consequences of vari-ation in elemental composition among organisms andbetween organisms and their environments (Sterner andElser 2002). Despite the overall similarity in the chem-ical makeup of protoplasm, organisms vary somewhatin stoichiometric ratios within individuals, among in-dividuals of a species, and especially between differenttaxonomic and functional groups. For example, in uni-cellular organisms and small metazoans, which havehigh rates of biosynthesis, a significant portion of totalbody phosphorus is found in ribosomal RNA (Sutcliffe1970, Elser et al. 2000b, Sterner and Elser 2002). Larg-er vertebrate organisms, with lower rates of biosyn-thesis, require much less RNA, but require much morephosphorus for skeletal structure. Vertebrates, withbones and muscles, contain proportionately more P andN and less C than plants, which use cellulose and lignin
as primary structural materials and have high ratios ofC relative to N and P (Elser et al. 2000a).
The elemental composition of an organism is gov-erned by the rates of turnover within an organism andthe rates of flux between an organism and its environ-ment. The concentrations of elements in ecosystemsare therefore directly linked to the fluxes and turnoverrates of elements in the constituent organisms. Theremay be reciprocal limitation, so that concentrations ofsome elements, such as N in soils and P in lakes, areregulated by a balance between the rate of supply fromabiotic and biotic sources and the rate of uptake byorganisms. On the one hand, environmental concentra-tions can limit metabolic rates, and thereby growthrates, reproductive rates, and standing stocks of or-ganisms. For example, plants can be limited by nitro-gen, water, iron, and phosphorus. Under controlled lab-oratory conditions, plant growth rates have been shownto vary linearly with N concentration (Ingestad 1979).Similarly, fertilization and irrigation experiments haverepeatedly shown that growth rates of plants in the fieldare limited by nitrogen or water (Field and Mooney1986; see review in Tilman 1988). On the other hand,sizes of pools and rates of turnover in organisms canregulate environmental concentrations of elements andcompounds, sometimes within narrow limits (Vitousek1982). This is the case for CO2 concentration in theatmosphere, which is regulated in part by the balancebetween photosynthesis and respiration in the bio-sphere (Falkowski et al. 2000, Chapin et al. 2002), andfor the concentrations of C, N, and P found in theorganic matter of oceans and lakes, which is regulatedin part by nutrient metabolism of the biota (Redfield1958).
ALTERNATIVE EXPRESSIONS FOR BIOLOGICAL RATES
The joint effects of body size, M, and temperature,T (in K), on individual metabolic rate, I, can be de-scribed by combining Eqs. 2 and 3 (Gillooly et al.2001). This gives
3/4 2E/kTI 5 i M e0 (4)
where i0 is a normalization constant independent of bodysize and temperature. We can take logarithms of both sidesof this equation and rearrange terms to yield
23/4ln(IM ) 5 2E(1/kT) 1 ln(i ).0 (5)
Note that in Eq. 5, we have ‘‘mass-corrected’’ meta-bolic rate, I, by incorporating the logarithm of massraised to the ¾ power. This method facilitates quanti-tative evaluation of the mass and temperature depen-dence predicted by Eq. 4, by incorporating the pre-dicted scalings into the analysis and into the y-axis ofbivariate plots. Eq. 5 predicts that the natural logarithmof mass-corrected whole-organism metabolic rateshould be a linear function of inverse absolute tem-perature (1/kT). The slope of this relationship gives theactivation energy of metabolism, E, and the intercept

July 2004 1775MACARTHUR AWARD LECTURE
Per
spectives
FIG. 1. Temperature and mass dependence of metabolic rate for several groups of organisms, from unicellular eukaryotesto plants and vertebrates (from Gillooly et al. 2001). (A) Relationship between mass-corrected metabolic rate, ln(IM23/4),measured in watts/g3/4, and temperature, 1/kT, measured in K. The overall slope, calculated using ANCOVA, estimates theactivation energy, and the intercepts estimate the normalization constants, C 5 ln(i0), for each group. The observed slope isclose to the predicted range of 0.60–0.70 eV (95% CI, 0.66–0.73 eV; SI conversion, 1 eV 5 96.49 kJ/mol). (B) Relationshipbetween temperature-corrected metabolic rate, ln(IeE/kT), measured in watts, and body mass, ln(M), measured in grams.Variables are M, body size; I, individual metabolic rate; k, Boltzmann’s constant; T, absolute temperature (in K). E is theactivation energy. The overall slope, calculated using ANCOVA, estimates the allometric exponent, and the intercepts estimatethe normalization constants, C 5 ln(i0), for each group. The observed slope is close to the predicted value of ¾ (95% CI,0.69–0.73). For clarity, data from endotherms (n 5 142), fish (n 5 113), amphibians (n 5 64), reptiles (n 5 105), invertebrates(n 5 20), unicellular organisms (n 5 30), and plants (n 5 67) were binned and averaged for each taxonomic group to generatethe points depicted in the plot.
gives the natural logarithm of the normalization con-stant, ln(i0). Plotted in this way (Fig. 1), it is clear thatdata for all groups are well-fitted by a common slope,E ø 0.69 eV (1 eV 5 96.49 kJ/mol), including en-dotherms in hibernation and torpor. Excluding theseendotherms, we obtain an average value of E ø 0.63eV. Both of these values are within the range (0.60–0.70 eV) commonly reported for aerobic respiration(Gillooly et al. 2001).
Using the value of E 5 0.63 eV, we can ‘‘temper-ature-correct’’ metabolic rates to isolate the effects ofmass:
E/kTln(Ie ) 5 (¾)ln(M) 1 ln(i ).0 (6)
We use this same value of E 5 0.63 eV for subsequenttemperature corrections. Eq. 6 predicts a linear rela-tionship between the logarithm of temperature-cor-rected metabolic rate and the logarithm of mass. Plot-ting the same metabolic rate data in this alternativeway (Fig. 1), we see that that the fitted slope (0.71) isclose to the value of ¾ predicted by the theory, andthat different groups show consistent differences in in-tercepts or normalization constants, ln(i0).
The explanatory power of Eq. 4 is substantial, withbody size predicting ;100 000-fold variation in ratesover the 20 orders-of-magnitude size range from thesmallest unicellular microbes to the largest vertebratesand trees, and with temperature predicting ;30-fold
variation over the biologically relevant temperaturerange from 08 to 408C.
There are, of course, quantitative deviations of in-dividual data values around the regression lines andfrom the predictions of the models. For example, thereexists an ;20-fold variation in the normalization con-stants for basal metabolism, i0, across all taxonomicgroups. The residual variation offers clues to the otherfactors, in addition to body size and temperature, thataffect metabolic and ecological processes. We willshow that some of the remaining variation in ontoge-netic growth rates and litter decomposition rates is re-lated to elemental stoichiometry.
These methods of ‘‘mass correction’’ and ‘‘temper-ature correction’’ will be applied repeatedly in subse-quent sections of the paper to investigate other bio-logical rates and times. Slightly different versions ofEqs. 5 and 6 are required for mass-specific metabolicrate and most other biological rates, which are pre-dicted to scale as M21/4, and for biological times, whichare expected to scale as M1/4. For simplicity, in mostsubsequent equations, we will use } instead of 5 andwill leave out symbols for the normalization constants.We emphasize, however, that these coefficients are im-portant, because they differ in systematic ways amongdifferent biological traits, taxa of organisms, and kindsof environments.

1776 JAMES H. BROWN ET AL. Ecology, Vol. 85, No. 7
Per
spec
tive
s
INDIVIDUAL PERFORMANCE AND LIFE HISTORY
The combined effect of body size and temperatureon whole-organism metabolic rate, I, is given in Eq.4. Because the mass-specific rate of metabolism, B, issimply I/M, it follows that B scales as
21/4 2E/kTB } M e . (7)
Other biological rates, from heart rate to developmentrate, and even the rate of molecular evolution (J. F.Gillooly and A. P. Allen, unpublished data), also varywith mass as M21/4 and with the Boltzmann factor. Bi-ological times, tB, such as turnover times for metabolicsubstrates and generations of individuals, are the re-ciprocal of rates and therefore scale as
1/4 E/kTt } M eB (8)
(Gillooly et al. 2002). These equations express rela-tionships that have been studied for many decades. Ithas long been known that large organisms require moreresources, but flux them through at slower rates thando smaller organisms. Both overall resource require-ments and flux rates are higher at higher temperatures.Elephants require more food, but reproduce more slow-ly and live longer than mice. Microbial activity andrates of litter decomposition are higher in warm, trop-ical environments than cold, subarctic ones. The ad-vantage of this framework, however, is that the equa-tions combine the effects of size and temperature in asingle quantitative expression. This makes possibleprecise comparisons across organisms that differ sub-stantially in body size and operating temperature, in-cluding species in different taxonomic or functionalgroups or diverse environments. When such compari-sons are made, the commonalities of life and their eco-logical manifestations are revealed.
Individual biomass production
Organisms devote some fraction of their metabolismto catabolism and activities associated with mainte-nance, and the remainder to anabolism and activitiesassociated with production of new biomass for growthand reproduction. Empirically, rates of whole-organismand mass-specific biomass production, P and P/M, re-spectively, scale similarly to whole-organism and mass-specific rates, so P } M 3/4e2E/kT and P/M } M21/4e2E/kT.This supports the theoretical conjecture that some con-stant fraction of metabolism tends to be allocated toproduction. It follows that, to the extent organisms havesimilar metabolic rates after adjusting for body sizeand temperature, they should also have similar rates ofproduction. This prediction is confirmed by plottingmaximal rates of temperature-corrected whole-organ-ism production against body mass for a wide varietyof aerobic eukaryotes, including plants and animals,ectotherms and endotherms (Fig. 2). Note that all val-ues cluster closely around the same allometric rela-tionship, which extends over nearly 20 orders of mag-
nitude in body mass and has a slope almost exactlyequal to the predicted ¾. Trees and vertebrates of thesame body mass, operating at the same body temper-ature, produce new biomass through some combinationof growth and reproduction, at very similar rates. Thesame applies to fish and terrestrial insects. Of coursethere is residual variation, some probably related tostoichiometric resource requirements, and the remain-der to other taxon- or environment-specific factors. Butthe degree of commonality is impressive.
Ontogenetic growth
The rate of metabolism sets the pace of life, includ-ing the life history schedule. For example, time tohatching of eggs in diverse animals, including zoo-plankton, insects, fish, amphibians, and birds, varieswith size and temperature according to Eq. 8 (West etal. 2001, Gillooly et al. 2002). Fig. 3 is a plot of de-velopment rates as a function of temperature and massfor eggs of zooplankton in the laboratory and fish inthe field. Note that the mass-corrected rates as a func-tion of temperature have slopes corresponding to ac-tivation energies of 0.73 and 0.68 eV (1 eV 5 96.49kJ/mol), close to the range of estimated activation en-ergies for aerobic metabolism (Gillooly et al. 2001).The temperature-corrected rates as a function of masshave slopes corresponding to allometric exponents of20.27 and 20.24, bracketing the theoretically pre-dicted value of 2¼. Much of the variation within thesetwo groups probably can be explained by stoichio-metric resource limitation. This was shown for devel-opment of zooplankton from hatching to maturity, inwhich residuals around the regression were positivelycorrelated with body phosphorus concentration (Gil-looly et al. 2002), as expected from the relationshipsbetween growth rate and RNA concentrations (Sutcliffe1970, Elser et al. 2000b).
Survival and mortality
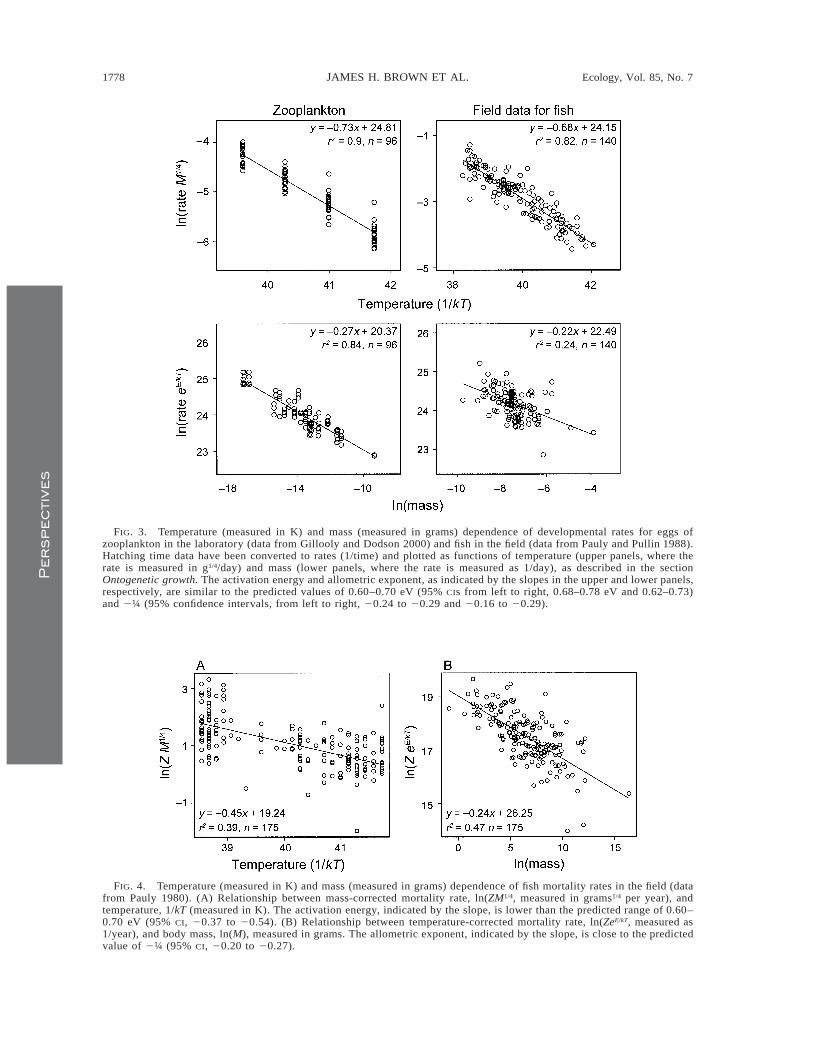
Ecologists have traditionally viewed survival timesand their inverse, mortality rates, as being highly var-iable and consequences of extrinsic environmental con-ditions, such as predation, disease, and resource com-petition, rather than intrinsic properties of individualorganisms (e.g., Charnov 1993, Kozlowski and Weiner1997, Stearns et al. 2000). However, because most pop-ulations are neither continuously increasing nor de-creasing, mortality rates must very nearly equal fecun-dity rates, and fecundity is fueled by biomass produc-tion. Metabolic theory therefore predicts that Eq. 7should account for much of the variation in field mor-tality rates, Z. Mortality rates of free-living marine fishstocks support this prediction (Fig. 4; see also Petersonand Wroblewski 1984). The slope of the size-correctedrelationship between mortality rate and temperaturegives an activation energy of 0.47 eV, which is some-what lower than the predicted range of 0.60–0.70 eV.The slope of temperature-corrected mortality rate as a

July 2004 1777MACARTHUR AWARD LECTURE
Per
spectives
FIG. 2. Mass dependence (mass measured in grams) of temperature-corrected maximal rates of whole-organism biomassproduction (PeE/kT, measured in grams per individual per year) for a wide variety of organisms, from unicellular eukaryotesto plants and mammals (from Ernest et al. 2003). Data, which span .20 orders of magnitude in body size, have beentemperature corrected using Eq. 6. The allometric exponent, indicated by the slope, is close to the predicted value of ¾ (95%CI, 0.75–0.76).
function of body mass, 20.24, is almost identical tothe predicted exponent of 2¼ (Savage et al., in pressa).
We offer two complementary, non-mutually exclu-sive hypotheses for the body size and temperature de-pendence of field mortality rates. First, the cumulativeeffects of metabolism with age may affect the abilityof individual organisms to resist ecological causes ofdeath, whether they be biotic or abiotic in origin. Stud-ies of aging have led to a theory of senescence thatattributes aging and eventual death to cumulative dam-age at the molecular and cellular levels by the freeradicals produced as byproducts of aerobic metabolism(Gerschman et al. 1954, Hartman 1956, Cadenas andPacker 1999). Second, the size and temperature de-pendence of field mortality rates suggest that Eq. 5characterizes rates of ecological interactions that leadto death, including competition, predation, parasitism,and disease. As we will show, the rates of these inter-actions do indeed show the predicted temperature de-pendence.
Stoichiometry
At the individual level, energy and materials arelinked by the chemical equations of metabolism, by thecomposition of organelles and other constituents ofprotoplasm, and by fundamental constraints on struc-
ture and function at cellular to whole-organism levelsof organization. Many of these constraints are relateddirectly to metabolism. The average rate of turnoverof an element (i.e., the inverse of residence time) isequal to the whole-organism flux divided by the whole-organism pool or storage. The fluxes (per individualrates of uptake and loss) of most elements vary withbody size in direct proportion to whole-organism met-abolic rate, as F } M 3/4 (e.g., Peters 1983). Pools ofthe commonest constituents of protoplasm, includingcarbon, hydrogen, oxygen, and water, usually scale lin-early with body mass, i.e., as S } M1. So, for thesecommon elements, turnover rate, on average, scales asF/S } M 3/4/M1 5 M21/4. However, this is not true of allelement pools, especially those that have some specialfunction in metabolism. Metabolism of eukaryotestakes place primarily in organelles: chloroplasts, mi-tochondria, and ribosomes, which are, respectively, thesites of photosynthesis, respiration, and protein syn-thesis. These organelles are effectively invariant units;their structure and function are nearly identical acrosstaxa and environments. The reaction rate per organelleis independent of body size (but not temperature), sothe rate of whole-organism metabolism depends on thetotal numbers of organelles. Consequently, numbers ofthese organelles per individual scale as M 3/4, and con-centrations or densities of the organelles scale as M21/4
1778 JAMES H. BROWN ET AL. Ecology, Vol. 85, No. 7
Per
spec
tive
s
FIG. 3. Temperature (measured in K) and mass (measured in grams) dependence of developmental rates for eggs ofzooplankton in the laboratory (data from Gillooly and Dodson 2000) and fish in the field (data from Pauly and Pullin 1988).Hatching time data have been converted to rates (1/time) and plotted as functions of temperature (upper panels, where therate is measured in g1/4/day) and mass (lower panels, where the rate is measured as 1/day), as described in the sectionOntogenetic growth. The activation energy and allometric exponent, as indicated by the slopes in the upper and lower panels,respectively, are similar to the predicted values of 0.60–0.70 eV (95% CIs from left to right, 0.68–0.78 eV and 0.62–0.73)and 2¼ (95% confidence intervals, from left to right, 20.24 to 20.29 and 20.16 to 20.29).
FIG. 4. Temperature (measured in K) and mass (measured in grams) dependence of fish mortality rates in the field (datafrom Pauly 1980). (A) Relationship between mass-corrected mortality rate, ln(ZM1/4, measured in grams1/4 per year), andtemperature, 1/kT (measured in K). The activation energy, indicated by the slope, is lower than the predicted range of 0.60–0.70 eV (95% CI, 20.37 to 20.54). (B) Relationship between temperature-corrected mortality rate, ln(ZeE/kT, measured as1/year), and body mass, ln(M), measured in grams. The allometric exponent, indicated by the slope, is close to the predictedvalue of 2¼ (95% CI, 20.20 to 20.27).

July 2004 1779MACARTHUR AWARD LECTURE
Per
spectives
FIG. 5. Temperature (in K) and mass (measured in grams) dependence of maximal rates of population growth, rmax, fora wide variety of organisms (A and B, respectively; data sources are listed in Savage et al., in press a). Data are plotted asin Figs. 3 and 4; rmax is measured in g1/4 per day in (A) and as 1/day in (B). There are fewer data points in (B) because thereare multiple temperature points for a species of a given mass. The activation energy and allometric exponent, indicated bythe slopes in (A) and (B), respectively, are close to the predicted values of 0.60–0.70 eV (95% CI, 0.56–0.80) and 2¼ (95%CI, 20.21 to 20.25), respectively.
(Niklas and Enquist 2001, West et al. 2002; J. F. Gil-looly and A. P. Allen, unpublished data). This has beenshown to be true for mitochondria (West et al. 2002),chloroplasts (Niklas and Enquist 2001), and RNA (Fossand Forbes 1997). Thus, element pools associated withorganelles such as these should scale with body sizeas S } M 3/4, and turnover rates of these pools shouldbe independent of body size (F/S } M 3/4/M 3/4 5 M0).
The extent to which whole-body stoichiometry isdetermined by these pools, and thus varies with bodysize, will depend on their sizes relative to other pools.For example, whole-body phosphorus concentrationsshould decline with increasing body size in growingunicellular organisms because they contain relativelyhigh concentrations of phosphorus in RNA relative tophosphorus in other pools. However, whole-body phos-phorus concentrations in most multicellular organismsshould vary little with body size because most phos-phorus is found in other pools that do not scale withbody size (J. F. Gillooly and A. P. Allen, unpublisheddata). Similar reasoning should apply to the concen-trations of nitrogen in plants, because a significant frac-tion is found in chloroplasts.
POPULATION AND COMMUNITY DYNAMICS
We can extend this framework to population andcommunity levels of ecological organization. Manyfeatures of population dynamics and community or-ganization are due to effects of body size, temperature,and stoichiometry on the performance of individualorganisms.
Population growth rates and rmax
Population dynamics can be complex and unpre-dictable, but the potential for exponential growth thatunderlies these fluctuations has been called the one
unequivocal law of population ecology (Turchin 2001).The maximal rate of exponential increase, rmax, is pre-dicted to scale according to Eq. 7. This follows fromthe fact that reproduction is fueled by metabolism, andthat mass-specific production rates and mortality ratesfollow Eq. 7. In fact, metabolic rates of microbes areoften determined by measuring maximal populationproduction Ptot or maximal population growth rates,rmax.
The 2¼ mass dependence of rmax has been well doc-umented empirically (Slobodkin 1962, Blueweiss et al.1978), but what about the temperature dependence?Fig. 5 shows that Eq. 5 describes tightly constrainedvariation in rmax across a wide variety of organisms,from unicellular eukaryotes to mammals. The com-monality is impressive, especially because these or-ganisms have very different modes of reproduction andoccur in a wide variety of environments (Savage et al.,in press a).
This finding suggests that some interpretations ofdifferences in life history and resulting population pro-cesses should be reexamined. For example, differencesbetween populations in life history, including the clas-sical r and K strategies, have often been viewed asadaptations to particular environmental conditions.Metabolic theory shows that smaller organisms, andthose operating at higher temperatures, tend to havehigher rmax values than larger, colder organisms, simplyas a consequence of allometric and kinetic constraints.We hasten to add, however, that this does not neces-sarily mean that size- and temperature-related differ-ences between populations in life histories are notadaptive. Organisms can respond to selection resultingfrom different environments by changing body size.For example, strong selection, perhaps for high repro-ductive rates in the absence of predators, apparently
1780 JAMES H. BROWN ET AL. Ecology, Vol. 85, No. 7
Per
spec
tive
s
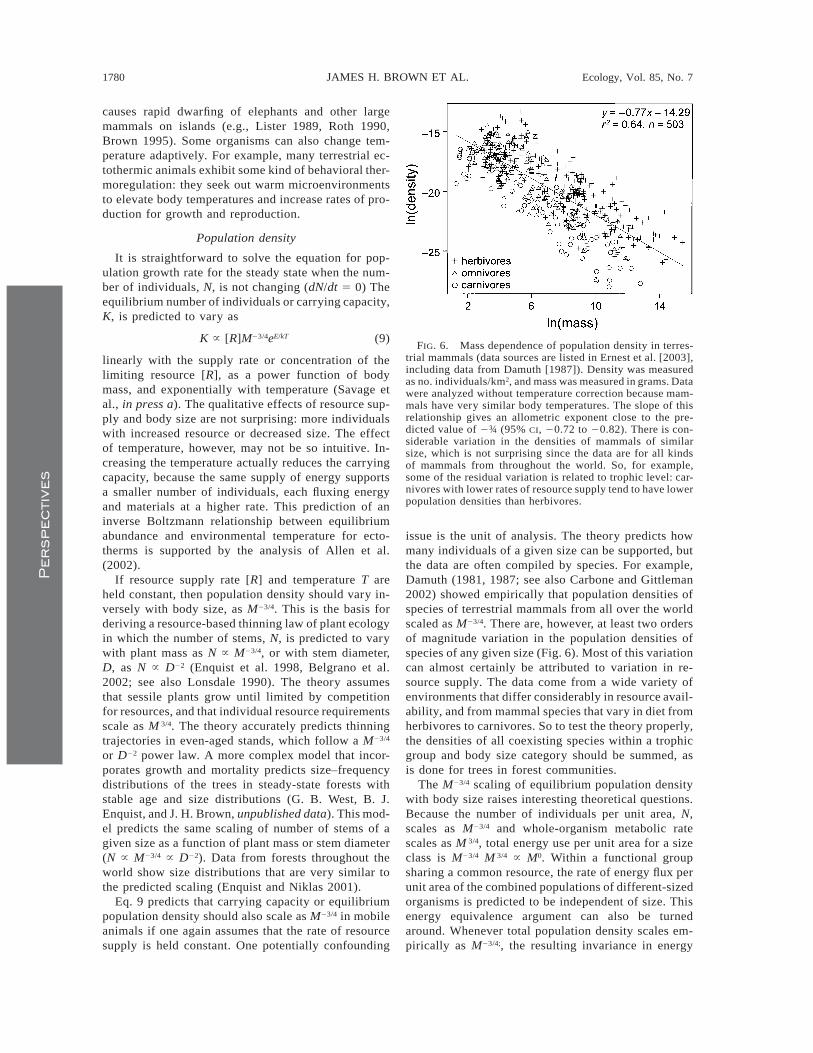
FIG. 6. Mass dependence of population density in terres-trial mammals (data sources are listed in Ernest et al. [2003],including data from Damuth [1987]). Density was measuredas no. individuals/km2, and mass was measured in grams. Datawere analyzed without temperature correction because mam-mals have very similar body temperatures. The slope of thisrelationship gives an allometric exponent close to the pre-dicted value of 2¾ (95% CI, 20.72 to 20.82). There is con-siderable variation in the densities of mammals of similarsize, which is not surprising since the data are for all kindsof mammals from throughout the world. So, for example,some of the residual variation is related to trophic level: car-nivores with lower rates of resource supply tend to have lowerpopulation densities than herbivores.
causes rapid dwarfing of elephants and other largemammals on islands (e.g., Lister 1989, Roth 1990,Brown 1995). Some organisms can also change tem-perature adaptively. For example, many terrestrial ec-tothermic animals exhibit some kind of behavioral ther-moregulation: they seek out warm microenvironmentsto elevate body temperatures and increase rates of pro-duction for growth and reproduction.
Population density
It is straightforward to solve the equation for pop-ulation growth rate for the steady state when the num-ber of individuals, N, is not changing (dN/dt 5 0) Theequilibrium number of individuals or carrying capacity,K, is predicted to vary as
23/4 E/kTK } [R]M e (9)
linearly with the supply rate or concentration of thelimiting resource [R], as a power function of bodymass, and exponentially with temperature (Savage etal., in press a). The qualitative effects of resource sup-ply and body size are not surprising: more individualswith increased resource or decreased size. The effectof temperature, however, may not be so intuitive. In-creasing the temperature actually reduces the carryingcapacity, because the same supply of energy supportsa smaller number of individuals, each fluxing energyand materials at a higher rate. This prediction of aninverse Boltzmann relationship between equilibriumabundance and environmental temperature for ecto-therms is supported by the analysis of Allen et al.(2002).
If resource supply rate [R] and temperature T areheld constant, then population density should vary in-versely with body size, as M23/4. This is the basis forderiving a resource-based thinning law of plant ecologyin which the number of stems, N, is predicted to varywith plant mass as N } M23/4, or with stem diameter,D, as N } D22 (Enquist et al. 1998, Belgrano et al.2002; see also Lonsdale 1990). The theory assumesthat sessile plants grow until limited by competitionfor resources, and that individual resource requirementsscale as M 3/4. The theory accurately predicts thinningtrajectories in even-aged stands, which follow a M23/4
or D22 power law. A more complex model that incor-porates growth and mortality predicts size–frequencydistributions of the trees in steady-state forests withstable age and size distributions (G. B. West, B. J.Enquist, and J. H. Brown, unpublished data). This mod-el predicts the same scaling of number of stems of agiven size as a function of plant mass or stem diameter(N } M23/4 } D22). Data from forests throughout theworld show size distributions that are very similar tothe predicted scaling (Enquist and Niklas 2001).
Eq. 9 predicts that carrying capacity or equilibriumpopulation density should also scale as M23/4 in mobileanimals if one again assumes that the rate of resourcesupply is held constant. One potentially confounding
issue is the unit of analysis. The theory predicts howmany individuals of a given size can be supported, butthe data are often compiled by species. For example,Damuth (1981, 1987; see also Carbone and Gittleman2002) showed empirically that population densities ofspecies of terrestrial mammals from all over the worldscaled as M23/4. There are, however, at least two ordersof magnitude variation in the population densities ofspecies of any given size (Fig. 6). Most of this variationcan almost certainly be attributed to variation in re-source supply. The data come from a wide variety ofenvironments that differ considerably in resource avail-ability, and from mammal species that vary in diet fromherbivores to carnivores. So to test the theory properly,the densities of all coexisting species within a trophicgroup and body size category should be summed, asis done for trees in forest communities.
The M23/4 scaling of equilibrium population densitywith body size raises interesting theoretical questions.Because the number of individuals per unit area, N,scales as M23/4 and whole-organism metabolic ratescales as M 3/4, total energy use per unit area for a sizeclass is M23/4 M 3/4 } M0. Within a functional groupsharing a common resource, the rate of energy flux perunit area of the combined populations of different-sizedorganisms is predicted to be independent of size. Thisenergy equivalence argument can also be turnedaround. Whenever total population density scales em-pirically as M23/4;, the resulting invariance in energy

July 2004 1781MACARTHUR AWARD LECTURE
Per
spectives
TABLE 1. Studies in which relevant components of competitive or predator–prey interactions have been studied at differenttemperatures so as to allow estimation of the activation energy, E.
StudyInterspecificinteraction Taxon Measure E (eV)
Burnett (1951)Spitze (1985)Eggleston (1990)Luecke and O’Brien (1983)Verity (1985)Park (1954)
parasitismpredationpredationpredationgrazingcompetition
wasp/sawflyfly larvae/zooplanktoncrab/oysterzooplanktonzooplankton/phytoplanktonbeetle
rate of parasitismattack rateattack ratefeeding rategrazing ratetime to competitive
exclusion
0.810.560.800.810.570.64
Note: Although the number of measurements is usually small, resulting in wide confidence intervals, note that the valuesof E vary around the theoretically predicted range of 0.60–0.70 eV. SI conversion: 1 eV 5 23.06 kcal/mol 5 96.49 kJ/mol.
flux implies that resources are available to and are usedby each body size class at equal rates. Why should thisbe so? The resource-based thinning theory for plantsreasonably assumes that sessile individuals of differentsize compete for the same limiting resources (light,water, nutrients). So far, however, we have no com-parable theory to explain why the rate of supply ofusable energy should be approximately constant fordifferently sized mammals or other mobile animals thatutilize a broad spectrum of resources.
Interspecific interactions
Since the theoretical studies of Lotka (1925) andVolterra (1926) and the classical experiments of Gause(1934), Park (1948), and Huffaker (1958), ecologistshave tried to understand how pairs of competing spe-cies or of predators and prey coexist with stability inthe same environment. The experimental studies foundthat coexistence was difficult to obtain in simple lab-oratory environments: one of the populations almostinvariably went extinct. For example, in Park’s (1954)classic experiments with flour beetles, by varying thetemperature, he was able to reverse the outcome ofcompetition, changing which species survived andwhich went extinct. Less appreciated is the fact thattime to competitive exclusion across three temperatureswas inversely related to temperature with an activationenergy of 0.64 eV (1 eV 5 96.49 kJ/mol), nearly iden-tical to the average for individual metabolism. A num-ber of other interaction rates and times, including ratesof parasitism and predator attack rates, show similartemperature relations (Table 1; see also Tilman et al.1981, Dunson and Travis 1991). Metabolic theory pre-dicts the pace of these interactions, because rates ofconsumption and population growth are determined byrates of individual metabolism and have the same bodysize and temperature dependence.
Species diversity
The scaling of rates of ecological interactions hasimportant implications for coexistence and species di-versity. The qualitative empirical patterns of biodiver-sity would suggest that the processes that generate andmaintain species richness scale similarly to other bi-
ological rates, as in Eq. 7. Other things being equal,there are more species of small organisms than largeones and more species in warm environments than coldones.
The fact that species diversity varies inversely withbody size suggests that metabolism plays a central role(e.g., Hutchinson and MacArthur 1959, May 1978,1986, 1988, Brown 1995). As recently as a decade ago,the available evidence suggested that the highest di-versity occurred in small, but not the smallest, organ-isms (i.e., in small insects; see May 1978, 1986). Re-cent data, however, reveal enormous microbial diver-sity and suggest that species richness may continue toincrease with decreasing body size right on down tothe smallest prokaryotes and perhaps even to viruses(e.g., Pace 1997).
It has long been known that diversity of most tax-onomic and functional groups is highest in the tropics,but this has usually been attributed to higher produc-tivity (resource availability) or reduced seasonality,rather than to the kinetic effect of higher temperatures(e.g., Brown and Lomolino 1998; but see Rohde 1992).We have recently shown, however, that species richnessin many groups of plants and animals has the sameBoltzmann relationship to environmental temperaturethat metabolic rate does (Eq. 3; see Allen et al. 2002).This result holds true not only along latitudinal gra-dients, but also along elevational gradients where var-iables such as photon flux, seasonal changes in daylength, and biogeographic history are held relativelyconstant (Fig. 7). The implication is that much of thevariation in species diversity is directly attributable tothe kinetics of biochemical reactions and ecologicalinteractions.
The temperature dependence of population growthand interspecific interactions brings into question ex-planations for diversity that invoke long time lags (e.g.,Hutchinson 1961, Bell 2001, Hubbell 2001). The high-est diversity on earth is found in warm, productiveenvironments, such as tropical rain forests and coralreefs, where the kinetics of interactions might be ex-pected to lead to rapid exclusion. We hypothesize thatdiversity is largely a consequence of evolutionary pro-cesses that obey Eqs. 7 and 8: small or warm organisms

1782 JAMES H. BROWN ET AL. Ecology, Vol. 85, No. 7
Per
spec
tive
s
FIG. 7. Temperature dependence (temperature measured in K) of amphibian species richness in two geographic gradients(Allen et al. 2002). (A) A latitudinal gradient in North America (data from Currie 1991). (B) An elevational gradient over2600 m on Volcan Barva in Costa Rica (data from Duellman 1988). The slopes indicate nearly identical effects of temperatureon diversity in the two gradients, with activation energies close to the predicted value of 0.60–0.70 eV (95% confidenceintervals, from left to right, 0.63–0.77 and 0.55–0.87).
having faster ecological dynamics than large or coldones should also have faster evolutionary dynamics,resulting in higher rates of speciation and a higherstanding stock of species. We have shown that Eq. 7predicts rates of molecular evolution for a variety ofgenes and genomes for ectotherms and endotherms (J.F. Gillooly and A. P. Allen, unpublished data). VanValen (1973) attributed the origin and maintenance ofbiodiversity largely to the ‘‘Red Queen’’ phenomenon,rates of species interaction and coevolution. We agree,and conjecture that the Red Queen runs according toEq. 7: faster in warmer environments and smaller or-ganisms.
Although this conjecture is consistent with manyfacts about biodiversity, it raises additional questions.First, how can the kinetic effects of high temperaturebe distinguished from the resource supply effects ofhigh productivity, which also increases with increasingtemperature? Second, how do faster rates of interspe-cific interaction and evolution result in higher standingstocks of species? This conjecture also raises the ques-tion of why ectotherms, whose body temperatures andmetabolic rates vary with environmental temperature,and endotherms, which have relatively high and con-stant body temperatures, show qualitatively similargeographic patterns of diversity. One hypothesis wouldagain invoke the Red Queen and suggest that speciesdiversity of endotherms is due largely to interactionswith ectotherms: food resources, competitors, preda-tors, parasites, and diseases. Alternatively, biodiversitygradients may be driven largely by ecosystem produc-tivity for endotherms, and by temperature effects onbiochemical kinetics for ectotherms. Consistent withthis latter hypothesis, average population densities ofectotherms, but not endothermic mammals, decline ex-ponentially with temperature toward the warm tropics(Allen et al. 2002). Clearly, much additional work on
the relationship between metabolism and biodiversityis needed, but a metabolic perspective has sharpenedmany of the questions and has suggested where to lookfor some of the answers.
ECOSYSTEM PROCESSES
Some of these questions can be addressed by probingmore deeply the effects of biological metabolism onthe fates of energy and materials in ecosystems. Bio-logically regulated whole-ecosystem stores and fluxesof elements and compounds, such as phosphorus, ni-trogen, and carbon, are simply the sums of the storesand fluxes of the constituent organisms. Metabolic the-ory therefore makes explicit predictions about the con-tribution of biota to biogeochemical cycles. Specifi-cally, Eq. 7 provides the basis for predicting how size,temperature, and stoichiometry determine magnitudesof stores and rates of flux within and between com-partments such as primary producers, herbivores, pred-ators, and detritivores.
Standing stock of biomass
It is straightforward to derive an expression forstanding stock biomass. Eq. 9 gives the effects of bodymass and temperature on equilibrium population den-sity (number of individuals per unit area). Multiplyingthis expression by the body size per individual, M,gives the corresponding equation for standing stock orstored biomass, W, per unit area:
1/4 E/kTW } [R]M e . (10)
The rate of supply of limiting resource, [R], has directlinear effects on both carrying capacity and biomass.Total biomass increases nonlinearly with increasingbody size and decreasing temperature. Large and/orcold organisms retain more resources in their bodiesbecause they flux them more slowly through their met-
July 2004 1783MACARTHUR AWARD LECTURE
Per
spectives
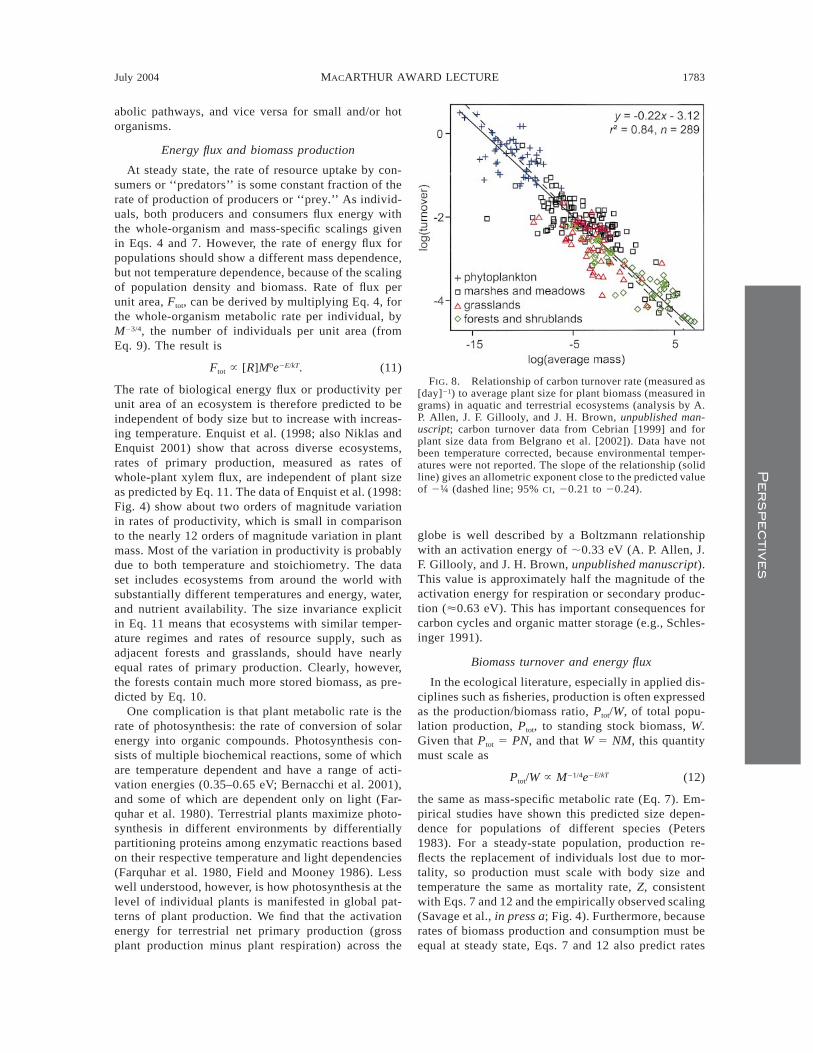
FIG. 8. Relationship of carbon turnover rate (measured as[day]21) to average plant size for plant biomass (measured ingrams) in aquatic and terrestrial ecosystems (analysis by A.P. Allen, J. F. Gillooly, and J. H. Brown, unpublished man-uscript; carbon turnover data from Cebrian [1999] and forplant size data from Belgrano et al. [2002]). Data have notbeen temperature corrected, because environmental temper-atures were not reported. The slope of the relationship (solidline) gives an allometric exponent close to the predicted valueof 2¼ (dashed line; 95% CI, 20.21 to 20.24).
abolic pathways, and vice versa for small and/or hotorganisms.
Energy flux and biomass production
At steady state, the rate of resource uptake by con-sumers or ‘‘predators’’ is some constant fraction of therate of production of producers or ‘‘prey.’’ As individ-uals, both producers and consumers flux energy withthe whole-organism and mass-specific scalings givenin Eqs. 4 and 7. However, the rate of energy flux forpopulations should show a different mass dependence,but not temperature dependence, because of the scalingof population density and biomass. Rate of flux perunit area, Ftot, can be derived by multiplying Eq. 4, forthe whole-organism metabolic rate per individual, byM23/4, the number of individuals per unit area (fromEq. 9). The result is
0 2E/kTF } [R]M e .tot (11)
The rate of biological energy flux or productivity perunit area of an ecosystem is therefore predicted to beindependent of body size but to increase with increas-ing temperature. Enquist et al. (1998; also Niklas andEnquist 2001) show that across diverse ecosystems,rates of primary production, measured as rates ofwhole-plant xylem flux, are independent of plant sizeas predicted by Eq. 11. The data of Enquist et al. (1998:Fig. 4) show about two orders of magnitude variationin rates of productivity, which is small in comparisonto the nearly 12 orders of magnitude variation in plantmass. Most of the variation in productivity is probablydue to both temperature and stoichiometry. The dataset includes ecosystems from around the world withsubstantially different temperatures and energy, water,and nutrient availability. The size invariance explicitin Eq. 11 means that ecosystems with similar temper-ature regimes and rates of resource supply, such asadjacent forests and grasslands, should have nearlyequal rates of primary production. Clearly, however,the forests contain much more stored biomass, as pre-dicted by Eq. 10.
One complication is that plant metabolic rate is therate of photosynthesis: the rate of conversion of solarenergy into organic compounds. Photosynthesis con-sists of multiple biochemical reactions, some of whichare temperature dependent and have a range of acti-vation energies (0.35–0.65 eV; Bernacchi et al. 2001),and some of which are dependent only on light (Far-quhar et al. 1980). Terrestrial plants maximize photo-synthesis in different environments by differentiallypartitioning proteins among enzymatic reactions basedon their respective temperature and light dependencies(Farquhar et al. 1980, Field and Mooney 1986). Lesswell understood, however, is how photosynthesis at thelevel of individual plants is manifested in global pat-terns of plant production. We find that the activationenergy for terrestrial net primary production (grossplant production minus plant respiration) across the
globe is well described by a Boltzmann relationshipwith an activation energy of ;0.33 eV (A. P. Allen, J.F. Gillooly, and J. H. Brown, unpublished manuscript).This value is approximately half the magnitude of theactivation energy for respiration or secondary produc-tion (ø0.63 eV). This has important consequences forcarbon cycles and organic matter storage (e.g., Schles-inger 1991).
Biomass turnover and energy flux
In the ecological literature, especially in applied dis-ciplines such as fisheries, production is often expressedas the production/biomass ratio, Ptot/W, of total popu-lation production, Ptot, to standing stock biomass, W.Given that Ptot 5 PN, and that W 5 NM, this quantitymust scale as
21/4 2E/kTP /W } M etot (12)
the same as mass-specific metabolic rate (Eq. 7). Em-pirical studies have shown this predicted size depen-dence for populations of different species (Peters1983). For a steady-state population, production re-flects the replacement of individuals lost due to mor-tality, so production must scale with body size andtemperature the same as mortality rate, Z, consistentwith Eqs. 7 and 12 and the empirically observed scaling(Savage et al., in press a; Fig. 4). Furthermore, becauserates of biomass production and consumption must beequal at steady state, Eqs. 7 and 12 also predict rates

1784 JAMES H. BROWN ET AL. Ecology, Vol. 85, No. 7
Per
spec
tive
s
FIG. 9. Temperature dependence (temperature in K) of short-term root decay rate (measured as [day]21) as characterizedby the rate constant, k (analysis by A. P. Allen, J. F. Gillooly, and J. H. Brown, unpublished manuscript; data from Silverand Miya [2001]). (A) The observed activation energy, as indicated by the slope, is within the range of values (0.60–0.70eV) predicted on the basis of metabolic rate (95% CI, 0.43–0.76). (B) Plotting the residuals about the regression line in (A)as a function of C:N shows that much of the variation is due to stoichiometry (P , 0.05).
of biomass turnover. Fig. 8 (from A. P. Allen, J. F.Gillooly, and J. H. Brown, unpublished manuscript;data from Cebrian 1999) shows that carbon turnoverrates in a broad assortment of terrestrial and aquaticecosystems scale with average plant size as M20.22. Notonly is this very close to the predicted M21/4, but alsosize varies over ;20 orders of magnitude and accountsfor 84% of the variation in these data. Thus retentiontimes for carbon and nutrients must show the reciprocalrelation, as in Eq. 8. Temperature and nutrient supplyundoubtedly explain much of the remaining variation.
Empirical studies also support the predicted tem-perature dependence. Total ecosystem respiration froma broad assortment of terrestrial ecosystems around theworld, measured by eddy covariance towers as night-time CO2 flux, varies with temperature as predictedbased on individual metabolism. The average activa-tion energy from 19 sites was 0.62 eV, within the pre-dicted range of 0.60–0.70 eV (Enquist et al. 2003).Similarly, Fig. 9 shows that temperature alone accountsfor 53% of the variation in short-term rates of decom-position from sites around the world (A. P. Allen, J. F.Gillooly, and J. H. Brown, unpublished manuscript;data from Silver and Miya 2001). The activation energyis 0.60 eV, not significantly different from the range0.60–0.70 eV predicted on the basis of aerobic metab-olism. Furthermore, 58% of the residual variation canbe explained by stoichiometry (in this case, the C:Nratio of the litter; see Fig. 9).
This metabolic framework also could be applied toaddress more precisely and quantitatively the questionsraised by Odum (1969) in his classic paper on ‘‘TheStrategy of Ecosystem Development.’’ For example, itshould be possible predict the dynamics of succession:how productivity, biomass, and material turnover rateschange with increasing plant size during transition fromherbaceous-dominated to tree-dominated ecosystemsfollowing either natural disturbances, such as forest
fires, or human perturbations, such as abandonment ofagricultural fields. Metabolic theory also provides aframework for more explicitly incorporating stoichi-ometry and understanding the effects of limited waterand nutrients on variation in productivity and otherprocesses across biomes and geographic gradients. Re-gression models that incorporate these variables areable to account for much of the observed variation (e.g.,Lieth 1973), but it should be possible to replace thesewith mechanistic analytical models based on first prin-ciples.
Trophic dynamics
Another major focus of ecosystem science has beenthe structure and dynamics of food webs, which depictthe flows of energy and materials through ecosystemsdue to trophic interactions. Metabolism has usuallybeen incorporated into food web theory only to theextent of showing that the fluxes of energy and ma-terials obey the laws of thermodynamics and conser-vation of energy, mass, and stoichiometry (but see Kerrand Dickie 2001). It should be possible to do muchmore, in particular to use metabolic theory to under-stand the abundance, biomass, energy use, and ele-mental chemical composition of species populations orentire functional groups in terms of the effects of bodysize, temperature, and stoichiometry on metabolic rate.We illustrate the possibilities with two examples.
Ecologists have long depicted trophic organizationas pyramids of energy, biomass, or abundance. Eachlayer of a pyramid corresponds to a successively highertrophic level, starting with primary producers and go-ing up through herbivores, primary carnivores, and soon. Metabolic theory makes quantitative predictions forhow body size, temperature, and stoichiometry affectthe pools and fluxes of biomass and energy. At steadystate, the Second Law of Thermodynamics demandsthat there be less available energy at higher trophic
July 2004 1785MACARTHUR AWARD LECTURE
Per
spectives
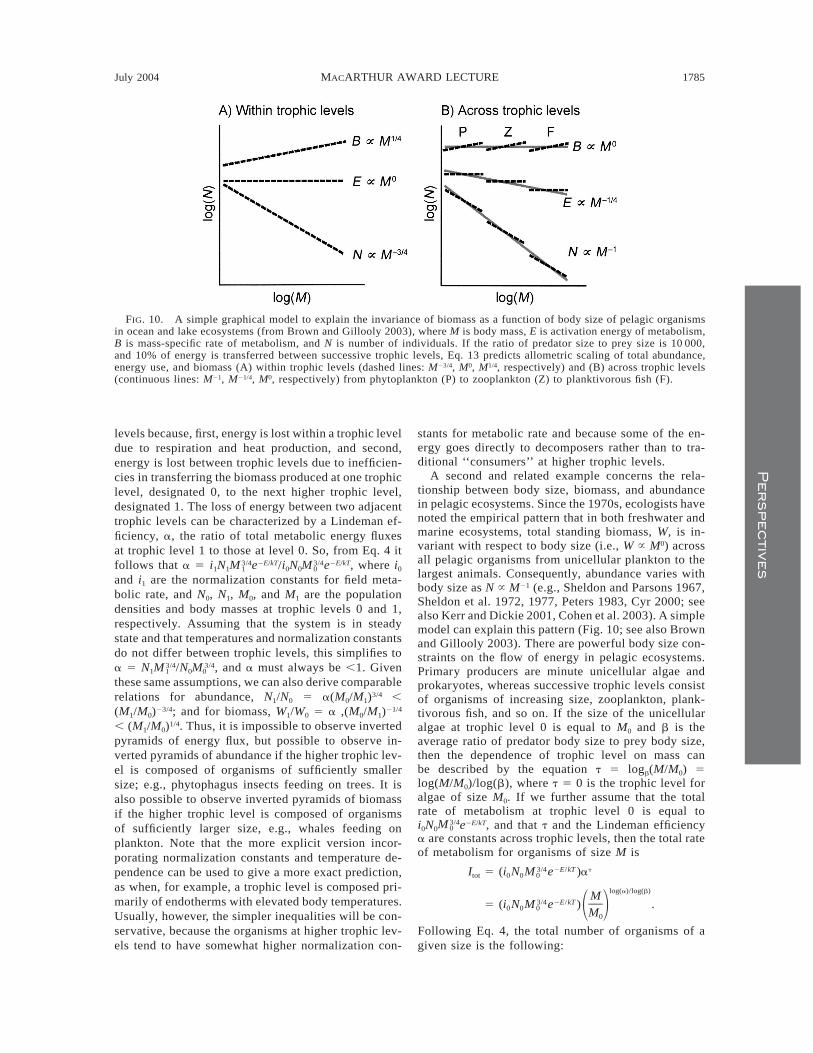
FIG. 10. A simple graphical model to explain the invariance of biomass as a function of body size of pelagic organismsin ocean and lake ecosystems (from Brown and Gillooly 2003), where M is body mass, E is activation energy of metabolism,B is mass-specific rate of metabolism, and N is number of individuals. If the ratio of predator size to prey size is 10 000,and 10% of energy is transferred between successive trophic levels, Eq. 13 predicts allometric scaling of total abundance,energy use, and biomass (A) within trophic levels (dashed lines: M23/4, M0, M1/4, respectively) and (B) across trophic levels(continuous lines: M21, M21/4, M0, respectively) from phytoplankton (P) to zooplankton (Z) to planktivorous fish (F).
levels because, first, energy is lost within a trophic leveldue to respiration and heat production, and second,energy is lost between trophic levels due to inefficien-cies in transferring the biomass produced at one trophiclevel, designated 0, to the next higher trophic level,designated 1. The loss of energy between two adjacenttrophic levels can be characterized by a Lindeman ef-ficiency, a, the ratio of total metabolic energy fluxesat trophic level 1 to those at level 0. So, from Eq. 4 itfollows that a 5 i1N1 e2E/kT/i0N0 e2E/kT, where i0
3/4 3/4M M1 0
and i1 are the normalization constants for field meta-bolic rate, and N0, N1, M0, and M1 are the populationdensities and body masses at trophic levels 0 and 1,respectively. Assuming that the system is in steadystate and that temperatures and normalization constantsdo not differ between trophic levels, this simplifies toa 5 N1 /N0 , and a must always be ,1. Given3/4 3/4M M1 0
these same assumptions, we can also derive comparablerelations for abundance, N1/N0 5 a(M0/M1)3/4 ,(M1/M0)23/4; and for biomass, W1/W0 5 a ,(M0/M1)21/4
, (M1/M0)1/4. Thus, it is impossible to observe invertedpyramids of energy flux, but possible to observe in-verted pyramids of abundance if the higher trophic lev-el is composed of organisms of sufficiently smallersize; e.g., phytophagus insects feeding on trees. It isalso possible to observe inverted pyramids of biomassif the higher trophic level is composed of organismsof sufficiently larger size, e.g., whales feeding onplankton. Note that the more explicit version incor-porating normalization constants and temperature de-pendence can be used to give a more exact prediction,as when, for example, a trophic level is composed pri-marily of endotherms with elevated body temperatures.Usually, however, the simpler inequalities will be con-servative, because the organisms at higher trophic lev-els tend to have somewhat higher normalization con-
stants for metabolic rate and because some of the en-ergy goes directly to decomposers rather than to tra-ditional ‘‘consumers’’ at higher trophic levels.
A second and related example concerns the rela-tionship between body size, biomass, and abundancein pelagic ecosystems. Since the 1970s, ecologists havenoted the empirical pattern that in both freshwater andmarine ecosystems, total standing biomass, W, is in-variant with respect to body size (i.e., W } M0) acrossall pelagic organisms from unicellular plankton to thelargest animals. Consequently, abundance varies withbody size as N } M21 (e.g., Sheldon and Parsons 1967,Sheldon et al. 1972, 1977, Peters 1983, Cyr 2000; seealso Kerr and Dickie 2001, Cohen et al. 2003). A simplemodel can explain this pattern (Fig. 10; see also Brownand Gillooly 2003). There are powerful body size con-straints on the flow of energy in pelagic ecosystems.Primary producers are minute unicellular algae andprokaryotes, whereas successive trophic levels consistof organisms of increasing size, zooplankton, plank-tivorous fish, and so on. If the size of the unicellularalgae at trophic level 0 is equal to M0 and b is theaverage ratio of predator body size to prey body size,then the dependence of trophic level on mass canbe described by the equation t 5 logb(M/M0) 5log(M/M0)/log(b), where t 5 0 is the trophic level foralgae of size M0. If we further assume that the totalrate of metabolism at trophic level 0 is equal toi0N0 e2E/kT, and that t and the Lindeman efficiency3/4M 0
a are constants across trophic levels, then the total rateof metabolism for organisms of size M is
3/4 2E/kT tI 5 (i N M e )atot 0 0 0
log(a)/log(b)M3/4 2E/kT5 (i N M e ) .0 0 0 1 2M0
Following Eq. 4, the total number of organisms of agiven size is the following:

1786 JAMES H. BROWN ET AL. Ecology, Vol. 85, No. 7
Per
spec
tive
s
[log(a)/log(b)]23/4I MtotN 5 5 N . (13)01 2I M0
Within a trophic level, where resource supply is rela-tively constant, Eq. 13 predicts that abundance shoulddecrease with size as M23/4, as has been observed em-pirically (e.g., Belgrano et al. 2002, Li 2002). Betweentrophic levels, the transfer of energy, characterized bythe Lindeman efficiency a, has been estimated empir-ically to be ;10% (Lindeman 1942). The range of bodysizes within a trophic level, and the difference in av-erage size between trophic levels, is about four ordersof magnitude. Consequently, (log a)/(log b) ø 2¼in Eq. 11, and abundance declines with body size asM21/423/4 5 M21 across all trophic levels and the entirespectrum of body sizes (Brown and Gillooly 2003). Itfollows that energy flux, F, declines with body massas M(loga)/(logb) 5 M21/4, and that biomass scales as M0
and therefore is invariant (Fig. 10).We do not yet have a mechanistic theory to explain
why a is often ;1021 or why b is often ;104. Thefraction of metabolic energy allocated to biomass pro-duction by the lower trophic level sets an upper limiton a, because production at the lower trophic levelfuels metabolism at the next highest trophic level (Kerrand Dickie 2001). This is only an upper limit, however,because it does not include energy losses incurred bythe higher trophic level due to foraging and assimila-tion. The fact that b ; 104 in size-structured pelagicecosystems is intriguing (see also Kerr and Dickie2001, Cohen et al. 2003). The quarter-power allometryimplies that predator–prey body size ratios potentiallycan be explained in terms of metabolic constraints.
CONCLUSIONS AND CAVEATS
We close with a few words about the strengths andlimitations of the theory that we have presented. First,we should be explicit about what we mean by a met-abolic theory of ecology. We consider it to be a mech-anistic, quantitative, synthetic framework that (1) char-acterizes the effects of body size and temperature onthe metabolism of individual organisms, and (2) char-acterizes the effects of metabolism of individual or-ganisms on the pools and flows of energy and matterin populations, communities, and ecosystems. Manyparts of this framework were established decades ago.Our work has built upon this foundation, primarily bydeveloping mechanistic models that explain quarter-power allometric scaling in biology, combining the ef-fects of body size and temperature on metabolic ratein a single expression, and showing how the metabo-lism of individual organisms affects the structure anddynamics of ecological systems. Other parts of theframework are still incomplete. Many other investi-gators are contributing to the emerging theory. Nev-ertheless, in its current state metabolic theory appearsto predict the magnitudes and to elucidate the mech-anisms of many empirical phenomena in ecology.
Second, metabolic theory suggests that energy andmaterials (or energy and stoichiometry) are not fun-damentally different ecological currencies that operateindependently of each other to affect the structure anddynamics of ecological systems. They are inextricablylinked. The fluxes, stores, and transformations of en-ergy and materials are stoichiometrically constrainedby the biochemistry and physiology of metabolism.Energy is required to perform biological work, includ-ing acquiring and transforming material resources. Ma-terials, both carbon compounds and elemental nutri-ents, are required to synthesize the chemical com-pounds that are the basis of all biological structuresand functions. At all levels, from individual organismsto ecosystems, the processing of energy and materialsis linked due to metabolic constraints.
Third, metabolic processes relate the structure andfunction of individual organisms to the roles of organ-isms in ecosystems. On the one hand, many of theselinkages are not yet well understood. Both more andbetter data and new and better theories are needed. Onthe other hand, much progress can be made using ex-isting data and theories. We have shown how the sameprinciples of allometry, kinetics, and stoichiometry canbe used to understand quantitatively the fluxes of bothenergy and materials in different kinds of organismsand in different kinds of ecosystems. This is becausethe biogeochemical processes in ecosystems are largelyconsequences of the collective metabolic processes ofthe constituent organisms.
Fourth, we envision a metabolic theory that wouldeventually provide a conceptual basis for ecology sim-ilar to that which genetic theory provides for evolution.Metabolism, like inheritance, is one of the great uni-fying processes in biology, making connections be-tween all levels of organization, from molecules to eco-systems. Metabolic theory would by no means be theonly ecological theory nor would it account for allimportant patterns and processes. It does, however, pro-vide a conceptual framework for ecological energeticsand stoichiometry. It does account for much of thevariation in ecological rates and times. It is based onfirst principles of energy, mass, and stoichiometric bal-ances, thermodynamics, biochemical energy transfor-mations, chemical reaction kinetics, and fractal-like bi-ological designs. It uses the biological processing ofenergy and materials to make linkages between indi-vidual organisms and the ecology of populations, com-munities, and ecosystems.
Fifth, metabolic theory is emphatically not a ‘‘theoryof everything.’’ As presently formulated, its domain isrestricted to effects of allometry, kinetics, and stoi-chiometry on the biological processing of energy andmaterials. Within this domain, it appears to explainmuch of the variation in pools, rates, and times. As ourfigures show, however, it cannot explain all of the var-iation. The existence of residual variation calls atten-tion to the importance of other variables and processes

July 2004 1787MACARTHUR AWARD LECTURE
Per
spectives
not included in either the specific models or the generaltheory. A strength of the theory, however, is that itmakes explicit quantitative predictions based on firstprinciples. The residual variation can then be measuredas departures from these predictions, and the magnitudeand direction of these deviations may provide clues totheir causes. Additionally, much of ecology lies outsidethe domain of metabolic theory. There are many phe-nomena for which metabolic processes either do notapply or play at most a small contributing role. Ex-amples include species–area and species–time rela-tionships, distributions of abundances among coexist-ing species of similar size, temperature and resourcerequirements, and the Taylor power law relationshipbetween mean and variance of population size overtime or space.
Finally, in this paper we have been concerned onlywith basic science, with developing a conceptualframework for ecology based on first principles of bi-ology, physics, and chemistry. This is not the place toapply the theory to practical problems of environmentalpolicy and management. It should be apparent, how-ever, that there are many such applications, from wild-life, fisheries, and forest management to global changeecology. The theory helps one to understand some ofthe changes that have occurred as humans have alteredsize distributions of organisms, environmental tem-peratures, and chemical stoichiometry of ecosystems.The theory offers a predictive framework for assessingand responding to human-induced changes in the abun-dance, distribution, and diversity of organisms, and thefluxes of energy and materials in ecological systems.
ACKNOWLEDGMENTS
This paper is dedicated to the memory of Robert MacArthurfor his contribution to ecological theory and his encourage-ment of young ecologists, including J. H. Brown. We thankthe many people who have contributed data and ideas thathave influenced our thinking. The list is long. In addition tomany others, it includes B. Enquist, E. Charnov, W. Woodruff,H. Olff, and colleagues, students, and visitors at the Univer-sity of New Mexico, the Santa Fe Institute, and Los AlamosNational Laboratory. S. Dodson, S. Levin, R. Paine, D. Til-man, and several anonymous reviewers read the manuscriptand made helpful comments. G. B. West and J. H. Brownwere supported by a Packard Interdisciplinary ScienceAward, a NSF Biocomplexity grant (DEB-0083422), and theThaw Charitable Trust. G. B. West was also supported byNSF grant PHY-0202180.
LITERATURE CITED
Allen, A. P., J. H. Brown, and J. F. Gillooly. 2002. Globalbiodiversity, biochemical kinetics and the energy equiva-lence rule. Science 297:1545–1548.
Arrhenius, S. 1889. Uber die Reaktionsgeschwindigkeit beider Inversion von Rohrzucker durcj Sauren. Zeitschrift furPhysik Chemique 4:226–248.
Bartholomew, G. A. 1981. A matter of size: an examinationof endothermy in insects and terrestrial vertebrates. Pages45–78 in B. Heinrich, editor. Insect thermoregulation. JohnWiley, New York, New York, USA.
Belgrano, A., A. P. Allen, B. J. Enquist, and J. F. Gillooly.2002. Allometric scaling of maximum population density:
a common rule for marine phytoplankton and terrestrialplants. Ecology Letters 5:611–613.
Bell, G. 2001. Ecology: neutral macroecology. Science 293:2413–2418.
Bernacchi, C. J., E. L. Singsaas, C. Pimentel, A. R. Portis,and S. P. Long. 2001. Improved temperature response func-tions for models of Rubisco-limited photosynthesis. PlantCell and Environment 24:253–259.
Blueweiss, L., H. Fox, V. Kudzma, D. Nakashima, R. Peters,and S. Sams. 1978. Relationships between body size andsome life history parameters. Oecologia 37:257–272.
Boltzmann, L. 1872. Weitere Studien uber das Warmegleich-gewicht unter Gasmolekulen. Sitzungsberichte der mathe-matisch-naturwissenschlaftlichen Classe der kaiserlichenAkademic der Wissenschaften Wien 66:275–370.
Brown, J. H. 1995. Macroecology. University of ChicagoPress, Chicago, Illinois, USA.
Brown, J. H., and J. F. Gillooly. 2003. Ecological food webs:high-quality data facilitate theoretical unification. Proceed-ings of the National Academy of Sciences (USA) 100:1467–1468.
Brown, J. H., and M. V. Lomolino. 1998. Biogeography.Sinauer, Sunderland, Massachusetts, USA.
Burnett, T. 1951. Effects of temperature and host density onthe rate of increase of an insect parasite. American Natu-ralist 85:337–352.
Cadenas, E., and L. Packer, editors. 1999. Understanding theprocess of aging. Marcel Dekker, New York, New York,USA.
Calder, W. A., III. 1984. Size, function and life-history. Har-vard University Press, Cambridge, Massachusetts, USA.
Carbone, C., and J. L. Gittleman. 2002. A common rule forthe scaling of carnivore density. Science 295:2273–2276.
Cebrian, J. 1999. Patterns in the fate of production in plantcommunities. American Naturalist 154:449–468.
Chapin, F. S., III., P. A. Matson, and H. A. Mooney. 2002.Principles of ecosystem ecology. Springer-Verlag, NewYork, New York, USA.
Charnov, E. L. 1993. Life history invariants: some explo-rations of symmetry in evolutionary ecology. Oxford Uni-versity Press, Oxford, UK.
Cohen, J. E., T. Jonsson, and S. R. Carpenter. 2003. Ecolog-ical community description using the food web, speciesabundance, and body size. Proceedings of the NationalAcademy of Sciences (USA) 100:1781–1786.
Currie, D. J. 1991. Energy and large-scale patterns of animal-and plant-species richness. American Naturalist 137:27–49.
Cyr, H. 2000. Individual energy use and the allometry ofpopulation density. Pages 267–295 in J. H. Brown and G.B. West, editors. Scaling in biology. Oxford UniversityPress, New York, New York, USA.
Damuth, J. 1981. Population density and body size in mam-mals. Nature 290:699–700.
Damuth, J. 1987. Interspecific allometry of population-den-sity in mammals and other animals: the independence ofbody-mass and population energy-use. Biological Journalof the Linnean Society 31:193–246.
Duellman, W. E. 1988. Patterns of species-diversity in anuranamphibians in the American Tropics. Annals of the Mis-souri Botanical Garden 75:79–104.
Dunson, W. A., and J. Travis. 1991. The role of abiotic factorsin community organization. American Naturalist 138:1067–1091.
Eggleston, D. B. 1990. Behavioral mechanisms underlyingvariable functional responses of blue crabs, Callinectes sap-idus, feeding on juvenile oysters, Crassostrea virginica.Journal of Animal Ecology 59:615–630.
Elser, J. J., D. R. Dobberfuhl, N. A. MacKay, and J. H. Scham-pel. 1996. Organism size, life history, and N:P stoichi-ometry. BioScience 46:674–684.

1788 JAMES H. BROWN ET AL. Ecology, Vol. 85, No. 7
Per
spec
tive
s
Elser, J. J., W. F. Fagan, R. F. Denno, D. R. Dobberfuhl, A.Folarin, A. Huberty, S. Interlandi, S. S. Kilham, E. Mc-Cauley, K. L. Schulz, E. H. Siemann, and R. W. Sterner.2000a. Nutritional constraints in terrestrial and freshwaterfood webs. Nature 408:578–580.
Elser, J. J., R. W. Sterner, E. Gorokhova, W. F. Fagan, T. A.Markow, J. B. Cotner, J. F. Harrison, S. E. Hobbie, G. M.Odell, and L. J. Weider. 2000b. Biological stoichiometryfrom genes to ecosystems. Ecology Letters 3:540–550.
Enquist, B. J., J. H. Brown, and G. B. West. 1998. Allometricscaling of plant energetics and population density. Nature395:163–165.
Enquist, B. J., E. P. Economo, T. E. Huxman, A. P. Allen, D.D. Ignace, and J. F. Gillooly. 2003. Scaling metabolismfrom organisms to ecosystems. Nature 423:639–642.
Enquist, B. J., and K. J. Niklas. 2001. Invariant scaling re-lations across tree-dominated communities. Nature 410:655–660.
Enquist, B. J., G. B. West, E. L. Charnov, and J. H. Brown.1999. Allometric scaling of production and life-historyvariation in vascular plants. Nature 401:907–911.
Ernest et al. 2003. Thermodynamic and metabolic effects onthe scaling of production and population energy use. Ecol-ogy Letters 6:990–995.
Falkowski, P., et al. 2000. The global carbon cycle: a test ofour knowledge of earth as a system. Science 290:291–296.
Farquhar, G. D., S. von Caemerrer, and J. A. Berry. 1980. Abiochemical model of photosynthetic CO2 assimilation inleaves of C3 plants. Planta 149:78–90.
Field, C. B., and H. A. Mooney. 1986. The photosynthesis–nitrogen relationship in wild plants. Pages 25–55 in T. J.Givnish, editor. The economy of plant form and function.Cambridge University Press, Cambridge, UK.
Foss, H. E., and V. E. Forbes. 1997. Effects of the polycyclicaromatic hydrocarbon fluoranthene on growth rate and nu-cleic acid composition of Capitella sp. I. Marine Biology129:489–497.
Gause, G. F. 1934. The struggle for existence. Williams andWilkins, Baltimore, Maryland, USA.
Gerschman, R., D. L. Gilbert, S. W. Nye, P. Dwyer, and W.O. Fen. 1954. Oxygen poisoning and x-irradiation: a mech-anism in common. Science 19:623–629.
Gillooly, J. F., J. H. Brown, G. B. West, V. M. Savage, andE. L. Charnov. 2002. Effects of size and temperature onmetabolic rate. Science 293:2248–2251.
Gillooly, J. F., E. L. Charnov, G. B. West, V. M. Savage, andJ. H. Brown. 2001. Effects of size and temperature ondevelopmental time. Nature 417:70–73.
Gillooly, J. F., and S. I. Dodson. 2000. The relationship ofneonate mass and incubation temperature to embryonic de-velopment time in a range of animal taxa. Journal of Zo-ology 251:369–375.
Hartman, D. 1956. Aging: a theory based on free radical andradiation chemistry. Journal of Gerontology 11:298–300.
Hubbell, S. P. 2001. A unified neutral theory of biodiversityand biogeography. Princeton University Press, Princeton,New Jersey, USA.
Huffaker, C. B. 1958. Experimental studies on predation:dispersion factors and predator–prey oscillations. Hilgardia27:343–383.
Hutchinson, G. E. 1961. The paradox of the plankton. Amer-ican Naturalist 95:137–145.
Hutchinson, G. E., and R. H. MacArthur. 1959. A theoreticalecological model of size distributions among species ofanimals. American Naturalist 93:117–125.
Huxley, J. S. 1932. Problems of relative growth. Methuen,London, UK.
Ingestad, T. 1979. Mineral nutrient-requirements of Pinussilvestris and Picea abies seedlings. Physiologia Plantarum45:373–380.
Kerr, S. R., and L. M. Dickie. 2001. The biomass spectrum.Columbia University Press, New York, New York, USA.
Kleiber, M. 1932. Body size and metabolism. Hilgardia 6:315–332.
Kozlowski, J., and J. Weiner. 1997. Interspecific allometriesare by-products of body size optimization. American Nat-uralist 147:101–114.
Li, W. K. W. 2002. Macroecological patterns of phytoplank-ton in the northwestern North Atlantic Ocean. Nature 419:154–157.
Lieth, H. 1973. Primary production: terrestrial ecosystems.Human Ecology 1:303–332.
Lindeman, R. 1942. The trophic-dynamic aspect of ecology.Ecology 23:399–418.
Lister, A. M. 1989. Red deer dwarfing on Jersey in the lastinterglacial. Nature 342:539–542.
Lonsdale, W. M. 1990. The self-thinning rule: dead or alive?Ecology 71:1373–1388.
Lotka, A. J. 1925. Elements of physical biology. Williamsand Wilkins, Baltimore, Maryland, USA.
Luecke, C., and W. J. O’Brien. 1983. The effect of heterocopepredation on zooplankton communities in arctic ponds.Limnology and Oceanography 28:367–377.
May, R. M. 1978. The dynamics and diversity of insect fau-nas. Pages 188–204 in L. A. Mound and N. Waloff, editors.Diversity of insect faunas. Blackwell, Oxford, UK.
May, R. M. 1986. The search for patterns in the balance ofnature: advances and retreats. Ecology 67:1115–1126.
May, R. M. 1988. How many species are there on earth?Science 241:1441–1440.
Morowitz, H. J., J. D. Kostelnik, J. Yang, and G. D. Cody.2000. The origin of intermediary metabolism. Proceedingsof the National Academy of Sciences (USA) 97:7704–7708.
Nagy, K. A. 2001. Food requirements of wild animals: pre-dictive equations for free-living mammals, reptiles, andbirds. Nutrition Abstracts and Reviews, Series B 71:21r–31r.
Niklas, K. J. 1994. Plant allometry: the scaling of form andprocess. University of Chicago Press, Chicago, Illinois,USA.
Niklas, K. J., and B. J. Enquist. 2001. Invariant scaling re-lationships for interspecific plant biomass production ratesand body size. Proceedings of the National Academy ofSciences (USA) 98:2922–2927.
Odum, E. P. 1969. The strategy of ecosystem development.Science 164:262–270.
Pace, N. R. 1997. A molecular view of microbial diversityand the biosphere. Science 276:734–740.
Park, T. 1948. Experimental studies of interspecies compe-tition: I. Competition between populations of the flour bee-tles, Tribolium confusum Duvall and Tribolium castaneumHerbst. Ecological Monographs 18:267–307.
Park, T. 1954. Experimental studies of interspecific compe-tition II. Temperature, humidity, and competition in twospecies of Tribolium. Physiological Zoology 27:177–238.
Pauly, D. 1980. On the interrelationships between naturalmortality, growth parameters, and mean environmentaltemperature in 175 fish stocks. Journal du Conseil 39:175–192.
Pauly, D., and R. S. V. Pullin. 1988. Hatching time in spher-ical, pelagic, marine fish eggs in response to temperatureand egg size. Environmental Biology of Fishes 22:261–271.
Peters, R. H. 1983. The ecological implications of body size.Cambridge University Press, Cambridge, UK.
Peterson, J., and J. S. Wroblewski. 1984. Mortality rates offishes in the pelagic ecosystem. Canadian Journal of Fish-eries and Aquatic Sciences 41:1117–1120.

July 2004 1789MACARTHUR AWARD LECTURE
Per
spectives
Redfield, A. C. 1958. The biological control of chemicalfactors in the environment. American Scientist 46:205–221.
Reiners, W. A. 1986. Complementary models for ecosystems.American Naturalist 127:59–73.
Rohde, K. 1992. Latitudinal gradients in species-diversity:the search for the primary cause. Oikos 65:514–527.
Roth, V. L. 1990. Insular elephants: a case study in bodymass estimation and ecological inference. Pages 151–179in J. Damuth and B. J. MacFadden, editors. Body size inpaleobiology: estimation and biological implications. Cam-bridge University Press, New York, New York, USA.
Savage, V. M., J. F. Gillooly, J. H. Brown, G. B. West, andE. L. Charnov. In press a. Effects of body size and tem-perature on population growth. American Naturalist.
Savage, V. M., J. F. Gillooly, W. H. Woodruff, G. B. West,A. P. Allen, B. J. Enquist, and J. H. Brown. In press b.The predominance of quarter-power scaling in biology.Functional Ecology.
Schlesinger, W. H. 1991. Biogeochemistry: an analysis ofglobal change. Academic Press, San Diego, California,USA.
Schmidt-Nielsen, K. 1984. Scaling: why is animal size soimportant? Cambridge University Press, Cambridge, UK.
Schmidt-Nielsen, K. 1997. Animal physiology. CambridgeUniversity Press, Cambridge, UK.
Sheldon, R. W., and T. R. Parsons. 1967. A continuous sizespectrum for particulate matter in the sea. Journal of theFisheries Research Board of Canada 24:900–925.
Sheldon, R. W., A. Prakash, and W. H. Sutcliffe. 1972. Thesize distribution of particles in the ocean. Limnology andOceanography 17:327–340.
Sheldon, R. W., W. H. Sutcliffe, and M. A. Paranjape. 1977.Structure of pelagic food-chain and relationship betweenplankton and fish production. Journal of the Fisheries Re-search Board of Canada 34:2344–2353.
Silver, W. L., and R. K. Miya. 2001. Global patterns in rootdecomposition: comparisons of climate and litter qualityeffects. Oecologia 129:407–419.
Slobodkin, L. B. 1962. Growth and regulation of animal pop-ulations. Holt, Reinhart, and Winston, New York, NewYork, USA.
Spitze, K. 1985. Functional response of an ambush predator:Chaoborus americanus predation on Daphnia pulex. Ecol-ogy 66:938–949.
Stearns, S. C., M. Ackerman, M. Doebeli, and M. Kaiser.2000. Experimental evolution of aging, growth, and re-production in fruitflies. Proceedings of the National Acad-emy of Sciences (USA) 97:3309–3313.
Sterner, R. W. 1990. The ratio of nitrogen to phosphorusresupplied by herbivores: zooplankton and the algal com-petitive arena. American Naturalist 163:209–229.
Sterner, R. W., and J. J. Elser. 2002. Ecological stoichiom-etry: the biology of elements from molecules to the bio-sphere. Princeton University Press, Princeton, New Jersey,USA.
Sutcliffe, W. H. J. 1970. Relationship between growth rateand ribonucleic acid concentration in some invertebrates.Journal of the Fisheries Research Board of Canada 27:606–609.
Taylor, C. R., N. C. Heglund, and G. M. O. Maloiy. 1982.Energetics and mechanics of terrestrial locomotion. I. Met-abolic energy consumption as a function of speed and bodysize in birds and mammals. Journal of Experimental Bi-ology 97:1–21.
Thompson, D. W. 1942. On growth and form: a new edition.Cambridge University Press, Cambridge, UK.
Tilman, D. 1988. Plant strategies and the dynamics and struc-ture of plant communities. Princeton University Press,Princeton, New Jersey, USA.
Tilman, D., M. Mattson, and S. Langer. 1981. Competitionand nutrient kinetics along a temperature-gradient: an ex-perimental test of a mechanistic approach to niche theory.Limnology and Oceanography 26:1020–1033.
Turchin, P. 2001. Does population ecology have generallaws? Oikos 94:17–26.
Van Valen, L. M. 1973. A new evolutionary law. Evolution-ary Theory 1:1–30.
Verity, P. G. 1985. Grazing, respiration, excretion, andgrowth rates of tintinnids. Limnology and Oceanography30:1268–1282.
Vitousek, P. M. 1982. Nutrient cycling and nutrient use ef-ficiency. American Naturalist 119:553–572.
Volterra, V. 1926. Fluctuations in the abundance of a speciesconsidered mathematically. Nature 118:558–560.
West, G. B., J. H. Brown, and B. J. Enquist. 1997. A generalmodel for the origin of allometric scaling laws in biology.Science 276:122–126.
West, G. B., J. H. Brown, and B. J. Enquist. 1999a. A generalmodel for the structure and allometry of plant vascularsystems. Nature 400:664–667.
West, G. B., J. H. Brown, and B. J. Enquist. 1999b. Thefourth dimension of life: fractal geometry and allometricscaling of organisms. Science 284:1677–1679.
West, G. B., J. H. Brown, and B. J. Enquist. 2001. A generalmodel for ontogenetic growth. Nature 413:628–631.
West, G. B., W. H. Woodruff, and J. H. Brown. 2002. Al-lometric scaling of metabolic rate from molecules and mi-tochondria to cells and mammals. Proceedings of the Na-tional Academy of Sciences (USA) 99:2473–2478.
Withers, P. C. 1992. Comparative animal physiology. Brooks/Cole Thompson Learning, Pacific Grove, California, USA.

1790
FORUM
The Metabolic Theory of Ecology1
Scaling in biology has a rich and important history. Typically body mass, or some otherparameter relating to organism size, is related to anatomical, physiological, and ecological pa-rameters across species. Quite remarkably, diverse organisms, from tiny microbes to the earth’slargest organisms are found to fall along a common slope, with a high degree of variance explained.The beauty of such scaling ‘‘laws’’ has been the generality in biotic organization that they suggest,and the challenge (for ecologists) has often been interpreting their mechanistic bases and eco-logical consequences.
Scaling laws have thus far inspired scientists in at least three major areas. First, scaling lawsmay illuminate biology that is otherwise shrouded. For example, if scaling relationships canaccount for variation in a parameter of interest, the residual variation may be much more easilyexamined because the major influence of some trait, say, body size, is removed. Second, somescientists have taken an interest in ‘‘the exponent’’—essentially the exponential scaling valuesthat produce the allometric relationship. What are the precise values of these exponents? Arethey all from a family of particular values (quarter powers) for many different biological rela-tionships? This area seeks to define the generality of patterns in nature and to explore the empiricalrobustness of the relationships. Third, from a mechanistic perspective, if scaling laws are mech-anistic and truly general, then this suggests some underlying common biological process thatforms the structure and function of species and ultimately generates biological diversity. Themechanistics of scaling from metabolism and the currently favored fractal network model ofresource acquisition and allocation may allow scientists to understand the laws of how lifediversified and is constrained. Perhaps more importantly, such a mechanistic understanding shouldallow the successful prediction of evolutionary trends, responses of organisms to global change,and other basic and applied biological problems.
The Ecological Society of America’s MacArthur Award winner, James H. Brown, workingtogether with colleagues for over a decade on scaling in biology, has arrived at an outline for ametabolic theory of ecology—a proposal for a unifying theory employing one of the most fun-damental aspects of biology, metabolism. This metabolic theory incorporates body size, tem-perature (metabolic kinetics described by the Boltzmann factor), and resource ratios of the es-sential elements of life (stoichiometry). Indeed, this bold and visionary proposal is likely toinspire ecologists and provoke much discussion. My goal in assembling this Forum was to worktoward a balanced discussion of the power and logic of the metabolic theory of ecology. I haveasked both junior and senior scientists to evaluate the ideas presented in the metabolic theoryand to go beyond the listing of strong and weak points. As such, this collection of commentariesshould be viewed neither as a celebration of the theory nor as a roast of Jim Brown. It should,however, serve as a springboard for future research and refinements of the metabolic theory.
Several themes and axes of admiration and agitation emerge from the forum. The focus onmetabolism, and metabolic rate in particular, is an advance that most agree is the fundamentalbasis for the processes of acquisition of resources from the environment and, ultimately, survivaland reproduction of organisms. The combination of size, temperature, and nutrients has compellingpredictive power in explaining life-history traits, population parameters, and even broader-scaleecosystem processes. The key point here is that Brown et al. are making a direct link betweenfactors that affect the functioning of individuals and the complex role that those individuals playin communities and ecosystems. Although what we have before us is a proposal for a unifiedtheory of ‘‘biological processing of energy and materials’’ in ecosystems, Brown et al. embracethe unexplained variation and acknowledge other areas of ecology that may not be subject tometabolic laws.
1 Reprints of this 51-page Forum (including the MacArthur Lecture) are available for $7.75 each, eitheras pdf files or as hard copy. Prepayment is required. Order reprints from the Ecological Society of America,Attention: Reprint Department, 1707 H Street, N.W., Suite 400, Washington, D.C. 20006.

Forum
The commentaries presented in this Forum are unanimous in their admiration of Brown et al.’sbroad theoretical proposal and its clear predictions. Yet, points of discussion abound and rangewidely: What really is the correct exponent? Does the scale at which scaling is applied affect itsexplanatory power? Are the laws really based on mechanism or phenomena? How does theaddition of temperature and resource limitation enhance the power of scaling relationships? And,is scaling up from the metabolic rate and body mass of organisms to population dynamics,community structure, and ecosystem processes possible? This Forum ends with Brown’s responseto the commentaries. Although there will be continued debate over the correct exponent, the dataat hand from the broadest taxonomic groups support quarter powers. There is general agreementover the issue of scale and the fact that, depending on the scale of interest, metabolic theory mayhave more or less to offer. Finally, nutrient stoichiometry is the most recent addition to metabolictheory, and all agree that further research and refinement will determine the role for such nutrientratios in the ecological scaling. The benefits of a metabolic theory of ecology are clear. Theauthors of this Forum have outlined some of the future challenges, and tomorrow’s questionswill evaluate these theses.
—ANURAG A. AGRAWAL
Special Features Editor
Key words: allometry; biological scaling; body size; Boltzmann factor; ecophysiology; functionalecology; laws in ecology; MacArthur Award paper; macroecology; nutrient stoichiometry.
q 2004 by the Ecological Society of America

Forum
1792 METABOLIC THEORY OF ECOLOGY Ecology, Vol. 85, No. 7
Ecology, 85(7), 2004, pp. 1792–1794q 2004 by the Ecological Society of America
THE VALUE OF NULL THEORIES IN ECOLOGY
JOHN HARTE1
Energy and Resources Group, University of California, 310 Barrows Hall, Berkeley, California 94720 USA
Reactions to the metabolic theory of ecology (MTE)proposed by Brown et al. (2004, this issue) are likelyto fall into the following categories.
Enthusiastic support.—MTE persuasively demon-strates how a few simple, well-founded physical prin-ciples concerning energy and temperature can explainan impressive fraction of the natural variability in or-ganism-level productivity, developmental rates, mor-tality, and other life history traits, and in ecosystem-level carbon turnover, population density, and resourcepartitioning. This is particularly impressive, given thatthe theory assumes nothing about many of the conceptsthat most ecologists had probably thought to be essen-tial input to any comprehensive theory, such as repro-ductive strategies, succession, stability, food webs, spa-tial distribution of individuals and species, stochasticand cyclic temporal variability, the influence of dis-turbance regimes, and organism behavior (including itsrole in determining effective environmental tempera-ture). MTE will be a major component of a parsimo-nious theory of nearly everything in ecology. Here atlast is an agenda for ecology.
Limited admiration.—MTE explains parsimoniouslya very limited subset of ecosystem traits, but it cannothope to say anything useful about most of the thingsthat we care about in ecology, such as reproductivestrategies, succession, stability, food webs, spatial dis-tribution of individuals and species, stochastic and cy-clic temporal variability, the influence of disturbanceregimes, and organism behavior. A parsimonious the-ory of nearly everything in ecology is, at best, far inthe future. In the meantime, there are also critical ques-tions in applied ecology. What will ecosystems looklike under global warming? What sustains and whatthreatens ecosystem services? How can ecosystems berestored and managed? How can we best design re-serves? We do not have the luxury of waiting indefi-nitely for some future comprehensive theory of ecologyto answer these practical questions; unfortunately,MTE will not help us here.
Skeptical dismissal.—The unexplained variances inMTE are large and all those ignored aspects of ecology(listed in Limited admiration) would have to be ingre-dients in any theory that would convincingly explain
Manuscript received 14 October 2003. Corresponding Ed-itor: A. A. Agrawal. For reprints of this Forum (includingthe MacArthur Award paper), see footnote 1, p. 1790.
1 E-mail: [email protected]
even just the limited things that MTE purports to ex-plain. One needs to consider nearly everything to ex-plain anything in ecology; parsimony and ecology areimmiscible.
In some fields of science, responses to proposed newradical advances are more tightly bounded than this.Nearly all physicists accept the goal of a ‘‘theory ofeverything’’ (TOE), and they may well achieve thatgoal if ‘‘everything’’ is understood to mean all of thephysical phenomena that occur at subatomic and cos-mological scales. Less clear, however, is whether anysuch theory could also encompass emergent physicalphenomena at intermediate scales, where we live.
Brown et al. (2004), making the case for Enthusiasticsupport, suggest that MTE, in combination with pop-ulation genetics and evolution, can indeed provide thebasis for an ecological TOE. Although the successesof the physics-based MTE are unlikely to dispel skep-ticism about the possibility of a physics-based TOE forbiological phenomena, could MTE plus evolution andgenetics conceivably do the trick, as Brown et al. sug-gest? More generally, what would an ecological TOElook like? Is it possible in ecology, and if so, how wouldwe get there from here?
An ecological TOE would provide, at the very least,an accurate and predictive understanding, across allecologically interesting spatial and temporal scales, ofthe distribution and abundance of organisms in inter-action with each other and their environment. Unlikephysics, however, ecology has to deal with contingen-cy. A theory that beautifully describes the distributionand abundance of organisms at the spatial scale of ameadow and the temporal scale of an NSF grant wouldalso have to scale up spatially to deal with the geologiccontingency of continent edges and temporally to en-compass global warming. Because of that, most ecol-ogists would probably answer our rhetorical question‘‘Is a TOE possible?’’ with a resounding ‘‘no.’’ I tendto agree, although hesitantly, because I think we cango farther than we have—by embracing, rather thandismissing, approaches such as MTE.
Progress in science comes from the interplay of en-larging possibilities (envisioning options for how na-ture might work) and narrowing those options (empir-ical testing). Clearly stated null hypotheses and nullmodels help to accomplish the latter because their fail-ures permit us to identify situations in which a non-null alternative is needed. Failure is what drives scienceforward.

July 2004 1793METABOLIC THEORY OF ECOLOGY
Forum
MTE also will surely fail if pushed too far. The un-explained variances in the figures in Brown et al. (2004)are undoubtedly just a preview of what will arise asthe theory attempts to widen its domain of applicabil-ity. A recently proposed ‘‘neutral theory’’ of ecology(Hubbell 2001) is probably also ‘‘wrong,’’ and, indeed,instances of its failure to accurately describe patternsin nature have been suggested (Condit et al. 2002, Clarkand McLachlan 2003). If ecology were physics, thismight be considered sufficient evidence to dismiss suchtheories entirely, but given the parsimony of both ofthese theories, that would not promote progress in ecol-ogy.
Theories are of most interest when the ratio of thenumber of predictions that they make to the number ofassumptions and adjustable parameters in the theory islarge. The MT of Brown et al. (2004) and Hubbell’sneutral theory are examples of theories based on veryfew assumptions and very few adjustable parameters,yet they are potentially capable of predicting a widerange of phenomena.
Suppose that the interrelationships among manytypes of phenomena are reasonably well predicted bya theory, yet each phenomenon is, separately, betterpredicted by some ad hoc explanation or cobbled-to-gether model than by that theory. If those successfulexplanations or models each require a different set ofassumptions or parameters for each comparison, thenit may be premature to reject the theory. In other words,the insight afforded by the theory into the intercon-nections among phenomena previously thought to bedisconnected ought to trump slightly better fits affordedby ad hoc explanations.
As a natural extension of the idea of null hypothesesand null models, I suggest that the notion of a ‘‘nulltheory’’ is of value in ecology. By a null theory, I meana set of relatively few and clearly stated assumptionsthat can be used to make a comprehensive set of fal-sifiable predictions about a wide variety of issues inecology. In contrast to null models, which address spe-cific ecological questions, null theories attempt to pro-vide a single coherent set of answers to many questions.Without a null theory, those questions might have beenconsidered independent of one another; a null theorywould unify them under one framework. Each of thosequestions might be addressed with a null model, butin typical applications of null models, a unique nullmodel is tailored to each question. Thus, there are manyways to create models of what nature might be like ifit were random. For example, random models for thespecies–area relationship could involve random as-signments of individuals, random assignments of spe-cies, or random shuffling of census quadrats. If a com-mon set of assumptions about randomness were usedto create an array of null models that together addresseda comprehensive collection of questions, then the arrayof models would fit our notion of a null theory; indeed,it might be called a random null theory. But surely
there is no reason to restrict null theories to those thatare random.
A decade ago, a null metabolic theory of ecologycould have been constructed around the body-mass-to-the-two-thirds-power scaling law, because that is a nullexpectation based on surface : volume ratios. All of theequations that Brown et al. (2004) discuss could havebeen written then, with ⅔ replacing ¾, and an equallycomprehensive theory developed. Although such a the-ory was never constructed, falsification of the two-thirds-power metabolic rule paved the way for whatBrown et al. have accomplished.
Just as it is the failures of null hypotheses and nullmodels that most enlarge our understanding, so it isthe mismatches between collections of data and nulltheories that make null theories useful. We should ex-pect null theories to ‘‘fail,’’ just as we expect null hy-potheses and null models to fail under many circum-stances. However, by examining the instances in whicha null theory fails to describe all of the data, and inparticular looking carefully at the patterns in the dis-crepancies, we can establish more firmly the existenceof mechanisms in nature that explicitly violate the sim-ple assumptions underlying the theory, and therebylearn a great deal about how nature works. Whetherthe outcome of this is an improvement of the null the-ory or the development of a whole new theoreticalconstruct may be less important than is the added in-sight into the mechanisms at work in ecology.
Eventually, the patterns of success and failure of nulltheories may suggest the outlines of an ecological the-ory of nearly everything. Such a theory, rising fromthe ashes of null theories, might even be consideredjust another null theory—it won’t really matter whatwe call it. The important thing is that it be falsifiable,and that it parsimoniously predict many more phenom-ena than it has parameters to adjust. It would be ex-citing if its base were broader than physics.
MTE is certainly parsimonious and its predictionsmatch observations in nature to a remarkable degreeover many orders of magnitude of variation in biolog-ical parameter space. At the same time, it appears sofar to be able to address only a modest fraction ofquestions of concern to ecologists. It is a fine exampleof a null theory in that (1) it ties together multiplephenomena within one set of extremely simple as-sumptions, and (2) departures from its predictions caninform us about other factors besides metabolism andtemperature that are at work in ecology. In the searchfor a TOE, or at least a more comprehensive null theoryof ecology—one that would improve, and expand thescope of, MTE—Brown et al. should look forward toMTE’s failures with enthusiasm.
LITERATURE CITED
Brown, J. H., J. F. Gillooly, A. P. Allen, V. M. Savage, andG. B. West. 2004. Toward a metabolic theory of ecology.Ecology 85:1771–1789.

Forum
1794 METABOLIC THEORY OF ECOLOGY Ecology, Vol. 85, No. 7
Clark, J. S., and J. S. McLachlan. 2003. Stability of forestbiodiversity. Nature 423:635–638.
Condit, R., et al. 2002. Beta- diversity in tropical forest trees.Science 295:666–669.
Hubbell, S. P. 2001. The unified neutral theory of biodiversityand biogeography. Princeton University Press, Princeton,New Jersey, USA.
Ecology, 85(7), 2004, pp. 1794–1796q 2004 by the Ecological Society of America
METABOLIC ECOLOGY: LINKING INDIVIDUALS TO ECOSYSTEMS
PABLO A. MARQUET,1,3 FABIO A. LABRA,1 and BRIAN A. MAURER2
1Center for Advanced Studies in Ecology and Biodiversity and Departamento de Ecologıa, Pontificia Universidad Catolicade Chile, Alameda 340, Santiago, Chile
2Department of Fisheries and Wildlife, Michigan State University, East Lansing, Michigan 48823 USA
INTRODUCTION
Metabolism sustains life and controls the growth,reproduction, and longevity of living entities. AsBrown et al. (2003, 2004) show, the ‘‘fire of life’’ iscentral to our understanding of patterns and dynamicsat all levels of biological organization. However sim-ple, it took 70 years to substantiate this statement; fromKleiber’s (1932) conclusion that the mass of the or-ganism raised to the ¾ power was the best predictorof metabolism to the model of West et al. (1997, 1999)that explains this relationship as a consequence of fun-damental attributes of biological networks. This workpaved the way to the Metabolic Theory of Ecology(MTE) outlined by Brown et al. (2004). We think thatthe theory outlined by Brown and co-workers repre-sents a breakthrough that endows ecological scienceswith a fresh perspective and a quantitative theory totackle ecological complexity, from individuals to eco-systems. However, as with any new theory in science,it can be improved and refined.
THEORETICAL UNDERPINNINGS OF THE
METABOLIC THEORY
The ultimate success of the emerging metabolic theoryof ecology (Brown et al. 2003, 2004) depends to a largeextent on whether it is truly a mechanistic theory basedon first principles, or whether, like so many other theoriesin ecology, it is fundamentally phenomenological.
The theory is based on what we call a general met-abolic equation (GME):
P 5 F(M, T, R) (1)
where P is the rate of some metabolic process, whichis some function F of body mass (M), temperature (T),and the concentration of the materials (R) needed to
Manuscript received 20 October 2003. Corresponding Ed-itor: A. A. Agrawal. For reprints of this Forum (includingthe MacArthur Award paper), see footnote 1, p. 1790.
3 E-mail: [email protected]
fuel and maintain metabolism. Following Gillooly etal. (2001) and Brown et al. (2003), who argue that theeffects of M and T are multiplicative, and assumingthat the effects of concentration of materials is alsomultiplicative, Eq. 1 becomes
3/4P 5 B M exp(2E/kT)f(R)0 (2)
where B0 is a constant, E is the ‘‘activation energy ofmetabolism,’’ k is Boltzmann’s constant, and f is a here-tofore unspecified function. In the strictest sense, Eq.2 is not a mechanistic equation; rather, it is statisticalmechanical. By this we mean that the functions usedin the equation emerge from the properties of the en-semble of molecules that comprise the physical unitthat is generating metabolic energy (typically, an or-ganism).
The statistical mechanics of the body size effect hasa strong theoretical justification (West et al. 1997, 1999).However, the effect of temperature on metabolic rate asmodeled by Gillooly et al. (2001) uses the exponentialform given in Eq. 2 with relatively little theoretical jus-tification. In statistical mechanics, the term exp(2E/kT),often referred to as the ‘‘Boltzmann factor,’’ is propor-tional to the fraction of molecules of a gas that attainan energy state of E (Schrodinger 1941, Pauling 1970)at an absolute temperature T. To react, the moleculesmust possess ‘‘activation energy,’’ that is, they mustcollide with one another with sufficient energy to changetheir state (Pauling 1970). Temperature increases theproportion of molecules that attain sufficient energy toreact. Hence, the Boltzmann factor can be used to de-scribe the rate of the reaction. This heuristic approachfor using the Boltzmann factor in describing metabolismwould be extremely difficult to derive in a mechanisticfashion, considering the very large number of differentbiochemical reactions that comprise metabolism. Weshould therefore consider the Boltzmann formulationused by Gillooly et al. (2001) as an approximation of amuch more complicated functional relationship betweenmetabolism and temperature.

July 2004 1795METABOLIC THEORY OF ECOLOGY
Forum
The concentration of resources (R, or stoichiometry)is the third component of the GME. However, its re-lationship to metabolism lacks an analytical expres-sion, which prevents the MTE from making explicithow it interacts with T and M in affecting individualor population attributes. At first glance, it is not entirelyclear how to include stoichiometric effects in the GME(the function f in Eq. 2). However, it is reasonable toexpect that f should have a multiplicative effect onmetabolism, and because organisms often show a‘‘functional response’’ in reaction to changes in theabundance of a limiting resource, f could be modeledas a Michaelis-Menten function (Real 1978, Maurer1990). If the ingestion rate is proportional to the met-abolic rate, then one would expect that metabolic pro-cesses, such as biomass production, would show a sim-ilar sort of saturating response and that the Michaelis-Menten equation could be used. There is, in fact, ex-perimental evidence that such responses do occur(Giebelhausen and Lampert 2001).
Interestingly, each term in the GME relates to pro-cesses whose primary mechanistic effects occur on dif-ferent spatial and temporal scales. Temperature has itsprimary effect at the molecular scale, by influencingthe rate of molecular movements through the parts ofthe metabolic machinery that depend on passive dif-fusion. Body size affects metabolism at a larger scalevia constraints derived from fractal-like distributionnetworks. Finally, stoichiometric effects occur at thescale of the whole organism in interaction with its en-vironment. This feature of the GME bequeaths the MTEwith a desirable property: cross-scale integration.
We think that the MTE still requires refinement andfurther articulation. However, there is sufficient evi-dence to suggest that the MTE may provide a funda-mental theoretical link between what we know aboutphysical systems and what we know about ecologicalsystems.
THE MTE AND THE STRUCTURE OF LOCAL
ECOLOGICAL SYSTEMS
The MTE rests heavily on individual-level phenom-ena, which by aggregation allow one to make predictionsupon whole-system patterns, processes, and rates. It isstriking how strong the fit between predicted and ob-served patterns usually is, considering that most data onindividuals and species populations come from differentplaces around the world, with different biogeographichistories, disturbance regimes, and productivities. Itmight seem striking that a theory that is, for the mostpart, free of ecological context (Marquet 2002) can beso powerful. However, this is to some extent expected,given that the theory focuses on ‘‘bulk properties’’ ofecological systems that are less affected by local eco-logical idiosyncrasies. The MTE is a theory about centraltendencies in ecological phenomena that predicts howthe average individual, population, and ecosystemshould behave and be structured. Although many would
say that the interesting biology is in the scatter and thatsuch a thing as an average ecological system does notexist, but just different realizations of the average sys-tem, it is important to recognize that unless we have amechanistic theory that provides us with an expectedbaseline, we are not able to identify any deviation worthexplaining in the first place. In this sense, both ap-proaches are interesting and complementary.
We have no doubt that the MTE can provide manyinsights on fundamental ecological questions at local,regional, and global scales. In particular, at a localscale: (1) it provides an explanation of why, in a localcommunity, population density should scale as M23/4
within trophic levels and as M21 across them, a patternthat has been empirically observed in aquatic ecosys-tems (e.g., Marquet et al. 1990); and (2) it predicts thatpopulation energy use should be independent of bodymass within trophic levels, but should decrease at high-er trophic levels. Further, the amount of energy thatmoves from one level to the next should be affectedby the characteristic metabolic scaling of the speciesin each trophic level. However, there are other impor-tant patterns within local communities, such as speciesabundance and species size distributions, to which theMTE could be applied, and that, in principle, it shouldbe able to explain, since they affect and are affectedby energy fluxes.
A close examination of the MTE shows that severalpredictions can be made regarding the effects of re-source supply upon equilibrium abundance and howabundance should vary across resource and tempera-ture gradients for metabolically different organisms. Inparticular, Eq. 9 of Brown et al. (2004) states that theequilibrium number of individuals or carrying capac-ity (K) in a local community should vary as K }RM23/4eE/kT. Further, because metabolic rate (P) is P }M 3/4e2E/kT (Brown et al. 2004: Eq. 4), we can expresscarrying capacity as
RK } . (3)
P
Eq. 3 implies that, given a fixed amount of resourcesR, organisms with lower metabolic demands willachieve higher equilibrium population numbers or car-rying capacities. For any given temperature, mass-cor-rected metabolism is higher in some groups than others(see Brown et al. 2004: Fig. 1a); thus, everything elsebeing equal, carrying capacities should follow the in-verse pattern, decreasing from plants to endotherms. Inother words, there should be a negative relationshipbetween the intercept of the mass-corrected relation-ship between metabolic rate and temperature and thetotal abundance of metabolically different organismsin a given community. This relationship would be evenstronger if we were to consider trophic structure andthe fact that energy or resources become more limitingfarther up in a food chain. Because organisms with

Forum
1796 METABOLIC THEORY OF ECOLOGY Ecology, Vol. 85, No. 7
FIG. 1. Relationship between area-corrected number ofspecies expressed as the intercept of the species–area curve(CS), and mass- and temperature-corrected metabolic rate ex-pressed as the intercept of the mass-corrected metabolic ratevs. temperature (CM). Data are for the Channel Islands, Seaof Cortes, and West Indies, and include plants, reptiles, landsnails, birds, and mammals. Within each system, we only useislands for which data on all groups were available. The solidline corresponds to the best-fit exponential equation CS 5exp(15.6 2 0.75CM).
lower metabolic demands are more likely to sustainhigher population numbers, they will, on average, sup-port more populations of different species above theminimum size required for persistence. Thus, higherspecies richness should be expected for groups withlower metabolic needs. This argument, similar to theone traditionally used to explain the effect of energyavailability on species diversity (e.g., Wright 1983,Currie 1991), predicts that in a local community, spe-cies diversity in any given metabolic group should beinversely correlated with metabolic demands. Our anal-ysis shows (Fig. 1) that there is indeed a negative re-lationship (F1,12 5 67.07, P , 0.001, r2 5 0.84) betweenthe area-corrected number of species (represented bythe intercept of the species–area relationship CS) andthe temperature- and mass-corrected metabolic rate(represented by the intercept of the mass-corrected met-abolic rate vs. temperature, CM) for metabolically dif-ferent groups of organisms in islands. That this rela-tionship exists indicates the heuristic value and pre-dictive power of the MTE. It is especially significantbecause many other factors besides metabolism affectthe number of species on islands. In addition, resourcesupply rate is not the same for all species groups be-cause of their trophic position, yet the pattern seemsto be robust to this.
The main point that we want to make with this anal-ysis is that the MTE can provide fruitful insights andtestable predictions to advance our understanding of
the structure of local ecological systems. However, fur-ther development and testing of this approach will re-quire the collection of more and better data on therichness, density, biomass, and metabolic activity ofspecies within local ecosystems. We need standardizeddata on biodiversity, which will allow for rigorous testsof the MTEs predictions at a local scale. This mightbe a daunting task, but to advance in our understanding,we need comprehensive and complete analyses of eco-logical systems. The 13 years and millions of dollarsinvested in sequencing the human genome can help tosave lives, but to characterize ecological systems interms of their total species composition, abundance,and function, or the ‘‘econome,’’ can help to save thehuman enterprise on earth.
ACKNOWLEDGMENTS
We appreciate comments and discussion provided by Jen-iffer Dunne, Van Savage, James Gillooly, and David Storch.We acknowledge the support of the Santa Fe Institute throughan International Fellowship, FONDAP-FONDECYT 1501-0001 (both to P. A. Marquet) and a CONICYT graduate fel-lowship to F. A. Labra.
LITERATURE CITED
Brown, J. H., J. F. Gillooly, A. P. Allen, V. M. Savage, andG. B. West. 2004. Toward a metabolic theory of ecology.Ecology 85:1771–1789.
Brown, J. H., J. F. Gillooly, G. B. West, and V. M. Savage.2003. The next step in macroecology: from general em-pirical patterns to universal ecological laws. Pages 408–423 in T. M. Blackburn and K. J. Gaston, editors. Ma-croecology: concepts and consequences. Blackwell, Ox-ford, UK.
Currie, D. J. 1991. Energy and large scale patterns of animaland plant species richness. American Naturalist 137:27–49.
Giebelhausen, B., and W. Lampert. 2001. Temperature re-action norms of Daphnia magna: the effect of food con-centration. Freshwater Biology 46:281–289.
Gillooly, J. F., J. H. Brown, G. B. West, V. M. Savage, andE. L. Charnov. 2001. Effects of size and temperature onmetabolic rate. Science 293:2248–2251.
Kleiber, M. 1932. Body size and metabolism. Hilgardia 6:315–332.
Marquet, P. A. 2002. Of predators, prey, and power laws.Science 295:2229–2230.
Marquet, P. A., S. A. Navarrete, and J. C. Castilla. 1990.Scaling population density to body size in rocky intertidalcommunities. Science 250:1125–1127.
Maurer, B. A. 1990. Dipodomys populations as energy pro-cessing systems: regulation, competition, and hierarchicalorganization. Ecological Modelling 50:157–176.
Pauling, L. 1970. General chemistry. Dover, New York, NewYork, USA.
Real, L. A. 1978. The kinetics of functional response. Amer-ican Naturalist 111:289–300.
Schrodinger, E. 1941. Statistical thermodynamics. Dover,New York, New York, USA.
West, G. B., J. H. Brown, and B. J. Enquist. 1997. A generalmodel for the origin of allometric scaling laws in biology.Science 276:122–126.
West, G. B., J. H. Brown, and B. J. Enquist. 1999. The fourthdimension of life: fractal geometry and the allometric scal-ing of organisms. Science 284:1677–1679.
Wright, D. H. 1983. Species–energy theory and extension ofspecies–area theory. Oikos 41:496–506.

July 2004 1797METABOLIC THEORY OF ECOLOGY
Forum
Ecology, 85(7), 2004, pp. 1797–1799q 2004 by the Ecological Society of America
DOES METABOLIC THEORY APPLY TO COMMUNITY ECOLOGY?IT’S A MATTER OF SCALE
DAVID TILMAN,1 JANNEKE HILLERISLAMBERS, STAN HARPOLE, RAY DYBZINSKI, JOE FARGIONE,CHRIS CLARK, AND CLARENCE LEHMAN
Department of Ecology, Evolution and Behavior, 1987 Upper Buford Circle, University of Minnesota, St. Paul,Minnesota 55108 USA
When the seven of us read and discussed Brown etal. (2004), there were moments of insight, of enthu-siastic consensus, and of strongly divergent opinion.We agreed that the empirical relations and scaling the-ory of Brown et al. (2004) hold great appeal becauseof their power to abstract and simplify some of thecomplexity of nature. The earth harbors several millionspecies, each having unique aspects to its morphology,physiology, and life history. A fundamental goal ofscience is to simplify and explain such complexity.Brown et al. (2004) do just this. They have documentedrobust patterns relating the body size and temperatureof species to their basal metabolic rate; plotted on log–log scales, these empirical functions are well fit bystraight lines. Moreover, they have used these scalingrelations to make numerous predictions about other pat-terns and processes, thus greatly extending an approachthat already had been shown to have considerable pow-er (e.g., Huxley 1932, McMahon and Bonner 1983,Peters 1983, May 1986).
One question that generated considerable debateamong us was whether metabolic scaling theory rep-resents a fundamental mechanism that has shaped lifeon earth, or whether it is a description of correlatedpatterns of as yet poorly known causes. Brown et al.(2004) hypothesize that scaling relations have a fun-damental basis that comes from the universality of met-abolic activation energy and of the fractal branchingnetworks that determine resource distribution withinindividual organisms. This elegant hypothesis intriguedus. It brought to the forefront questions raised whenwe spent a semester last year reading many of the pa-pers upon which Brown et al. (2004) is based. Areslopes really multiples of ¼, or is this just the bestsmall-whole-number ratio approximation? How mightmechanical constraints, which may scale differentlywith body size (e.g., McMahon and Bonner 1983), con-tribute to these patterns? Larger organisms must, afterall, have a higher proportion of their mass in woodystems or bones or other support tissues that have lowmetabolic costs but high costs for their construction.
Manuscript received 3 November 2003. CorrespondingEditor: A. A. Agrawal. For reprints of this Forum (includingthe MacArthur Award paper), see footnote 1, p. 1790.
1 E-mail: [email protected]
Might growth rate (McMahon and Bonner 1983) be thecontrolling variable, rather than metabolic rate? Ormight body size and metabolism be easily measuredsurrogates of the actual traits that determine speciesinteractions and abundances? After all, within theframework of community ecology, it is traits such ascompetitive ability, dispersal, and predator defenses,and not metabolism and body size, that directly deter-mine which species win or lose, which persist and spe-ciate, or which go extinct.
Of the various predictions that Brown et al. (2004)derived, perhaps the most surprising to communityecologists may be that within a trophic level, speciesof vastly different body sizes should get equal sharesof their limiting resources. Simply put, all of the her-bivorous arthropods within a 10-fold range of bodysizes should consume roughly the same amount of foodas all of the herbivorous mammals within a 10-foldrange of body sizes. This suggests that, on average,species should be getting approximately equal-sized‘‘slices’’ of the limiting resources for which they com-pete. Does this mean that there are limits to similaritythat lead to relatively even packing of competing spe-cies along gradients? If so, what mechanisms couldcause this, and how would community ecologists testthis prediction in the field?
Another prediction made by Brown et al. (2004) isthat higher temperatures in the tropics may lead to fast-er metabolism, shorter generation times, and thus fasterrates of speciation, accounting for the latitudinal bio-diversity gradient. This is an interesting alternative toother hypotheses for latitudinal diversity gradients,such as the hypothesis that diversity is lower towardthe poles because of higher rates of extinction from aless stable climate and glaciation, or that there are few-er ways to survive and grow in progressively colderhabitats because life is a water-based (not an ice-based)process. The metabolic approach may also offer insightinto r vs. K selection. Brown et al. (2004) suggest thatspecies selected for fast population growth rates wouldnecessarily have higher metabolism, smaller body size,and higher temperature. K-selected species are not nec-essarily selected for slow population growth rates, butthis may be a consequence of selection for predationresistance or resource use efficiency, which often are

Forum
1798 METABOLIC THEORY OF ECOLOGY Ecology, Vol. 85, No. 7
FIG. 1. (A) Predictive power of body size. We used the data in Brown et al. (2004) and simulations to explore therelationship between the range of organism sizes studied and the explanatory power of size. First, we calculated the unexplainedvariance around the regression lines in Figs. 2, 3, 5, and 6 of Brown et al. (2004) using the slope, number of sample points,and R2 of relationships between size and organismal biomass growth rate, fish mortality, population growth rate, and populationdensity. Next we calculated R2 for simulated data sets of species covering narrower ranges in body size. To do this, werandomly sampled 100 ‘‘species’’ from a uniform distribution of body sizes between a specified size range. We next generatedresponse variables for each species (i.e., predicted biomass growth rate, fish mortality, population growth rate, and populationdensity) using observed slopes and intercepts and estimated variance. Finally, we used simple linear regressions to calculatethe R2 between organism size and the process of interest. We repeated this 200 times for each of 200 equally distributed sizeranges (from 0 to the size range used in Brown et al. [2004]). Lines connect the mean R2 values for each size range. (B)Size range of studied organisms, based on papers in the journal Ecology. We examined all recent papers in Ecology thatreferenced specific organisms or types of organisms (190 papers from issues 1–9, volume 84, 2003). We tabulated theorganisms described in each paper, assigned them to size classes, and then determined the orders of magnitude size range(difference between the log10 estimated mass in grams of the largest and smallest organisms). The horizontal axis is organismsize range; the vertical axis is the number of papers that studied species in that range.
enhanced by larger body size. These examples againsuggest that the robustness of scaling relations maycome not from their direct mechanistic relevance, butfrom the ability of a single variable, body size, to ab-stract a suite of correlated traits when making com-parisons across broad scales. Whatever the underlyingmechanisms might be, the predictions in Brown et al.(2004) demonstrate that scaling relations can be a pow-erful way to reduce dimensionality and to abstract someof the complexity of nature.
We had considerable debate, though, about thebreadth of applicability of metabolic scaling theory. Itis clear that scaling relationships hold best when ex-amining patterns across a wide spectrum of body sizes(such as from microbes to megafauna) within an eco-system, continent, or the globe (Fig. 1A). Because de-tailed, mechanistic treatments of the interactionsamong all species in an ecosystem are impossible, ab-straction is essential. Metabolic theory may, for in-stance, allow better parameterization and understand-ing of ecosystem nutrient and energy fluxes caused bythe large size range of species, such as from bacteriato sequoias, in ecosystems.
It is less clear, however, if metabolic scaling willprove useful in addressing many of the central ques-tions of population and community ecology, such as
population regulation and controls of coexistence, ofspecies relative abundance patterns, and of diversity(e.g., Tilman 1999, Hubbell 2001, Sterner and Elser2002, Chase and Leibold 2003). Much of communityecology pursues these questions by exploring the mech-anisms of local interactions among often similar-sizedspecies. An analysis of the relations reported by Brownet al. (2004) shows that the strength of the correlationbetween various ecological processes and body sizediminishes as the range in body sizes decreases (Fig.1A). The variation in species traits that seems so smallwhen comparing bacteria to elephants looms largewhen comparing beech trees to oaks, or a prairie grasswith a prairie forb.
The data presented in Brown et al. (2004) show thatorganisms of similar body size can have .20-fold dif-ferences in their traits. Moreover, these data show thatbody size explains only 2–20% of the observed vari-ance in predicted responses when species fall within a10-fold range in body sizes (Fig. 1A). Scaling relationsthus have increasingly limited predictive ability incomparisons of organisms of more similar size. Suchcomparisons, however, are a central part of ecology;roughly half of a sample of papers recently publishedin Ecology focused on only one species or on several
July 2004 1799METABOLIC THEORY OF ECOLOGY
Forum
species that were within an order of magnitude in bodymass (Fig. 1B).
Much of our recent work has focused on how theidentity and number of grassland plant species inter-acting in a local neighborhood influences processessuch as primary productivity. The species that we studyare herbaceous perennials that differ by less than ¾ ofan order of magnitude in adult body size. In our bio-diversity experiment (Tilman et al. 2001), the numberof plant species explained 37% of the variance in totalbiomass in 2002 (linear regression: N 5 168, P ,0.0001). Species number and functional group com-position explained 68% of this variance in total bio-mass (multiple regression: F28, 139 5 10.4, P , 0.0001).The scaling approach, which works so well across largescales of body size, predicts at most 12% of the vari-ance in various ecological processes for the range ofbody sizes in our study (Fig. 1A). Thus, on our scale,plant functional traits and plant diversity are muchmore important than body size. Conversely, our workon the local neighborhood effects of diversity giveslittle, if any, insight into the potential relationship be-tween diversity and productivity on geographic scaleswhere species come from different species pools andwhere other factors, such as climate, soil, and planttraits, are correlated and change simultaneously.
An analogy and an insight into the power and limitsof the scaling approach come from a consideration ofanother complex system with which we are familiar:computers and related digital devices. Like an organ-ism, a silicon circuit has a metabolism, measured byhow much electricity it consumes. The volume of in-formation that a digital device can process, the airflowneeded to cool it, its reliability and longevity, and otherproperties are all a function of its size and, thus, itsmetabolism. Such macroscopic properties of digital de-vices are essential for whole-system tasks like design-ing power supplies and writing warranties. The rela-tionship of metabolic scaling to ecology is analogous;it gives significant insights into macroscopic ecologicalpatterns and predicts other patterns and processesacross large scales and whole systems. Many differentfunctions, however, can be performed by digital de-vices with identical sizes and energy demands, just asmany different ecological roles can be performed byorganisms of similar size and temperature. It is theseecological roles, not metabolisms per se, that determinespecies coexistence and abundances and ecosystemfunctioning.
One of the mysteries of scaling theory is why it hassuch great explanatory power at large scales, but not
at small scales. The vast diversity of alternative rolesthat can be filled by organisms of equal body size prob-ably accounts for the $20-fold variation observedaround the mean scaling trend. Perhaps when compar-isons are made across larger body size ranges, the con-straints of body size and its correlates increasingly pre-dominate over the interspecific trade-offs in resourceuse, dispersal, and disease resistance that are the moreproximate determinants of species interactions andabundance. If, as seems likely, scaling relations do havetheir basis in metabolic activation energy, fractalbranching, and structural constraints, then these forcesmust be acting at a deeper level, such as by definingbody size and metabolic constraints that shaped theform and functioning of life as single-celled organismsevolved into multicellular plants and animals.
In summary, Brown et al. (2004) have provided anew window through which we can ponder nature. Thesimplicity and potential generality of the view that theyprovide is welcome; ecology as a discipline cannot af-ford to wallow in special cases. Metabolic theory pro-vides a unique and insightful macroscopic perspective,one that appears to have great utility for comparisonsof organisms of vastly different sizes. The possiblecauses of these patterns, the applicability of the ap-proach to studies of similar-sized organisms, and thepotential synthesis of mechanistic and macro-ecolog-ical approaches are challenges that are likely to be pur-sued for years to come.
LITERATURE CITED
Brown, J. H., J. F. Gillooly, A. P. Allen, V. M. Savage, andG. B. West. 2004. Toward a metabolic theory of ecology.Ecology 85:1771–1789.
Chase, J. M., and M. A. Leibold. 2003. Ecological niches:linking classical and contemporary approaches. Universityof Chicago Press, Chicago, Illinois, USA.
Hubbell, S. P. 2001. The unified neutral theory of biodiversityand biogeography. Monographs in Population Biology,Princeton University Press, Princeton, New Jersey, USA.
Huxley, J. S. 1932. Problems in relative growth. Methuen,London, UK.
May, R. M. 1986. The search for patterns in the balance ofnature: advances and retreats. Ecology 67:1115–1126.
McMahon, T. A., and J. T. Bonner. 1983. On size andlife.Scientific American/W. H. Freeman, New York, NewYork, USA.
Peters, R. H. 1983. The ecological implications of body size.Cambridge University Press, New York, New York, USA.
Sterner, R. W., and J. J. Elser. 2002. Ecological stoichiometry.Princeton University Press, Princeton, New Jersey, USA.
Tilman, D. 1999. The ecological consequences of changesin biodiversity: a search for general principles. Ecology 80:1455–1474.
Tilman, D., P. B. Reich, J. Knops, D. Wedin, T. Mielke,and C. Lehman. 2001. Diversity and productivity in along-term grassland experiment. Science 294:843–845.

Forum
1800 METABOLIC THEORY OF ECOLOGY Ecology, Vol. 85, No. 7
Ecology, 85(7), 2004, pp. 1800–1802q 2004 by the Ecological Society of America
USING THE METABOLIC THEORY OF ECOLOGY TO PREDICT GLOBALPATTERNS OF ABUNDANCE
MICHAEL KASPARI1
Department of Zoology, University of Oklahoma, Norman, Oklahoma 73019-0235 USA
INTRODUCTION
Studies of abundance (N)—the number of individ-uals of a taxon in a given area and time—have tradi-tionally focused on the dynamics of local species pop-ulations over generations. The conceptual basis of thisapproach has been demographic (i.e., dN/dt 5 birth rate2 death rate 1 migration rate). Brown and colleagues(2004) in introducing the Metabolic Theory of Ecologyfocus on a different question: how should abundancein entire communities at equilibrium vary as we moveabout in space and time? Their answer, the MetabolicTheory of Abundance (henceforth MTA), uses a massbalance approach (Odum 1971, Kaspari et al. 2000). Ithas the potential to guide work on this subject for yearsto come.
Brown and colleagues ask us to picture abundancenot as the net arrival of mortal, reproductive units withlegs, but as the number of co-occurring energy trans-formers. K is the equilibrial abundance of individualectotherms limited by the same resources, of similarsize, and that experience the same environment. Thisformulation of K may be strange to ecologists from thedemographic school. But the body size, trophic habits,and abundance of higher taxa and functional groupshave shown themselves worthy of study (e.g., Siemannet al. 1996).
In the MTA, K varies with resource availability, ac-cess to those resources, and the way the resources aredivided up among individuals:
23/4 E/kTK ; [R]M e . (1)
[R] is the resource supply rate. Brown and colleaguesfocus on energy, which places us on the familiargrounds of metrics like Net Primary Productivity (ingrams of carbon per square meter per year). The MTApredicts that K should increase linearly with [R], ceterisparibus, although no data are presented to support thisprediction. The ability of living cells to do metabolicwork, and hence to access available [R], is a negativedecelerating function of environmental temperature T(in Kelvin), E is the activation energy (;0.63 eV; 1eV 5 96.49 kJ/mol), and k is Boltzmann’s factor. This
Manuscript received 14 October 2003. Corresponding Ed-itor: A. A. Agrawal. For reprints of this Forum (includingthe MacArthur Award paper), see footnote 1, p. 1790.
1 E-mail: [email protected]
prediction holds for trees, and more messily, for a col-lection of animal ectotherms (Allen et al. 2002). So farwe have described the amount of energy captured byour taxon or trophic group. To find K, this energy mustbe divided up based on the individual’s capacity to useit. Whole-organism metabolism rate scales to M 3/4, soK should be a negative decelerating function of M (Da-muth 1981, Enquist et al. 1998). In sum, the MTAfocuses on how available energy is harvested and re-spired. It is thus explicitly bottom-up (Power 1992);mortality from predation is assumed to be negligibleor at least invariant with M, T, and [R].
The MTA is a clear offspring of macroecology(Brown 1995), meant to be tested at broad spatial andtaxonomic scales spanning a broad range of M, T, and[R]. It does what good theory should do. It builds fromfirst principles, addresses the shape of long-standingpatterns (Blackburn and Gaston 1997), predicts othernon-intuitive patterns (Damuth 1981), and would evenchange the way we plot our data (e.g., by a priori cor-recting for mass and temperature). Finally, it pulls to-gether [R], T, and M, three factors that have often beentreated in isolation. So what challenges and opportu-nities do we face as we gear up to test the MTA?
TESTING THE MTA—QUANTIFYING ABUNDANCE
The MTA focuses on how energy is captured andpartitioned by individuals. Because available energy[R] attenuates each time carbon-rich molecules are har-vested, excreted, and respired, Brown and colleagues(2004) are careful to specify that abundance ideallyrefers to all members of the same trophic group (analternative focus on taxon abundance would come withthe assumption that the proportion of [R] harvested bythat taxon is invariant across sites). It is thus not sur-prising that much of the early work in MTE (Enquistet al. 1998, Enquist and Niklas 2001) has mined globalplant data sets. Plants occupy an unambiguous trophicgroup. Plants are also easy to count. But where are thedata sets for consumer abundance across global gra-dients of [R] and T?
Global abundance data sets should be a basic goalof ecology. Such data are scarce, however, because mo-bile organisms are hard to count and relative abundanceestimators are hard to standardize across habitats(Southwood 1978). Luckily, terrestrial brown foodwebs (detritus, microbes, microbivores, and their pred-

July 2004 1801METABOLIC THEORY OF ECOLOGY
Forum
FIG. 1. Studies of 49 ant communities arrayed along theproductivity gradient ([R] is the resource supply rate) showthat trophic groups accumulate at different rates with netaboveground productivity (Kaspari 2001). Note the log–logscale.
ators) address many of these limitations (Copley 2000):they occur everywhere from the poles to the tropics;they can be quantified in 1-m2 plots (Coleman and Cros-sley 1996); and the taxa (the microbivores in a patchof litter may include ciliates, rhizopods, nematodes,collembola, oribatids, millipedes, and ants) span arange of M (Moore et al. 1988). I am confident that theMTA will foster the collection of new abundance datain the same way that quantitative biodiversity theory(Rosenzweig 1995, Hubbell 2001, Allen et al. 2002) ispromoting studies of species richness.
Ecological stoichiometry constitutes a second chal-lenge to the MTA. Individuals regularly confront ele-mental deficits beyond carbon (Mertz 1987). For ex-ample, primary consumers from the green and brownfood webs (herbivores and decomposer microbes, re-spectively) appear especially likely to face stoichio-metric imbalances (Kaspari and Yanoviak 2001, Stern-er and Elser 2002, Davidson et al. 2003). How can anenergy-based theory deal with environmental deficitsin elements like N, P, and Mb?
One solution is to quantify the energy costs of thoseactivities required to meet elemental deficits. The her-bivores that travel to find limiting sodium-rich plants(Belovsky 1978) or that compensate for defensive com-pounds in their food (Berenbaum and Zangerl 1994)are both doing so by catabolizing sugars. If so, the slopeof the [R]–K curve should be an inverse function ofthe group’s stoichiometric deficit. For example, soil antabundance increases as NPP3/4 (net primary production,as yet uncorrected for M; personal observation) acrossthe New World (Kaspari et al. 2000). Different anttrophic groups, however, accumulate differently (Fig.1; see Kaspari 2001). Herbivore abundance increasesslowly with NPP, predators and fungivores more quick-ly. Omnivores have an intermediate slope. A workinghypothesis is that ant herbivores have low [R]–K slopesbecause they must work harder than predators to meettheir stoichiometric deficits.
TWO VARIATIONS ON A THEME OF METABOLISM
AND ABUNDANCE
The MTA characterizes environments by their mean[R] and T. Both, however, become more seasonal mov-ing from the equator toward the poles. The MTA maythus ignore a key reality of ectotherm life: metaboliccosts and productivity vary seasonally. For example,in all but the most productive biomes (i.e., wet tropicalrain forests), the same NPP can be squeezed into a fewmonths or spread out over the year (contrast tundrawith mediterranean shrubland). In a seasonally coldbiome where NPP is concentrated in the summermonths, ectotherms can eat when food is plentiful andrespire less of that energy away when winter comes.In contrast, an ever-warm environment extracts year-long respiration costs. Somewhat counterintuitivelythen, environments with winters can provide a meta-bolic refuge and enhance K compared to aseasonal en-vironments with the same mean [R] and T (Kaspari etal. 2000). Seasonality matters. This may be anotherreason for the observation of Allen et al. (2002) thatN’s for ectotherms, but not endotherms, decline towardthe warm tropics.
Finally, holding [R] and T constant, K is predictedto decrease as M23/4. But why should M vary from placeto place? Intriguingly, two of the leading models forbody size gradients have [R] and T as their independentvariables. Where predation risk is high, the optimalbody size should decrease with NPP (Kozlowski 1992).Ectotherm size at maturity has long been shown todecrease with T (Atkinson 1995). If community bodysize gradients are real, this suggests that where M is afunction of T and [R], the MTA may be overparame-terized!
PROSPECTS
The MTA challenges community ecologists to lookbeyond our traditional focus on species toward theproperties of higher taxa and functional groups. It chal-lenges us to pursue fundamental natural history—size,abundance, trophic relationships—for all taxa at a glob-al scale. As ecologists, we obviously have some dis-tance to go before we understand even the basic pat-terns of abundance. The MTA provides one interestingand quantitative road map for the journey ahead.
ACKNOWLEDGMENTS
This material is based upon work supported by the NationalScience Foundation under Grant No. 0212386.
LITERATURE CITED
Allen, A. P., J. H. Brown, and J. F. Gillooly. 2002. Globalbiodiversity, biochemical kinetics, and the energetic-equiv-alence rule. Science 297:1545–1548.
Atkinson, D. 1995. Temperature and organism size—a bio-logical law for ectotherms? Advances in Ecological Re-search 25:1–58.
Belovsky, G. 1978. Diet optimization in a generalist herbi-vore: the moose. Theoretical Population Biology 14:103–134.

Forum
1802 METABOLIC THEORY OF ECOLOGY Ecology, Vol. 85, No. 7
Berenbaum, M. R., and A. R. Zangerl. 1994. Costs of in-ducible defense: protein limitation, growth, and detoxifi-cation in parsnip webworms. Ecology 75:2311–2317.
Blackburn, T. M., and K. J. Gaston. 1997. A critical assess-ment of the form of the interspecific relationship betweenabundance and body size in animals. Journal of AnimalEcology 66:233–249.
Brown, J. H. 1995. Macroecology. University of Chicago,Chicago, Illinois, USA.
Brown, J. H., J. F. Gillooly, A. P. Allen, V. M. Savage, andG. B. West. 2004. Toward a metabolic theory of ecology.Ecology 85:1771–1789.
Coleman, D. C., and D. A. Crossley. 1996. Fundamentals ofsoil ecology. Academic Press, New York, New York, USA.
Copley, J. 2000. Ecology goes underground. Nature 406:452–454.
Damuth, J. 1981. Interspecific allometry of population den-sity in mammals and other animals: the independence ofbody mass and population energy use. Biological Journalof the Linnaean Society 31:193–246.
Davidson, D. W., S. C. Cook, R. R. Snelling, and T. H. Chua.2003. Explaining the abundance of ants in lowland tropicalrainforest canopies. Science 300:969–972.
Enquist, B. J., J. H. Brown, and G. B. West. 1998. Allometricscaling of plant energetics and population density. Nature395:163–165.
Enquist, B. J., and K. J. Niklas. 2001. Invariant scaling re-lations across tree-dominated communities. Nature 410:655–660.
Hubbell, S. 2001. The unified neutral theory of biodiversityand biogeography. Princeton University Press, Princeton,New Jersey, USA.
Kaspari, M. 2001. Taxonomic level, trophic biology, and theregulation of local abundance. Global Ecology and Bio-geography 10:229–244.
Kaspari, M., L. Alonso, and S. O’Donnell. 2000. Three en-ergy variables predict ant abundance at a geographic scale.Proceedings of the Royal Society London B 267:485–490.
Kaspari, M., and S. Yanoviak. 2001. Bait use in tropical litterand canopy ants—evidence for differences in nutrient lim-itation. Biotropica 33:207–211.
Kozlowski, J. 1992. Optimal allocation of resources togrowth and reproduction: implications for age and size atmaturity. Trends in Ecology and Evolution 7:15–19.
Mertz. 1987. Trace elements in human and animal nutrition.Academic Press, San Diego, California, USA.
Moore, J. C., D. E. Walter, and H. W. Hunt. 1988. Arthropodregulation of micro- and mesobiota in below-ground de-trital food webs. Annual Review of Entomology 33:419–439.
Odum, E. P. 1971. Fundamentals of ecology. Third edition.Saunders, Philadelphia, Pennsylvania, USA.
Power, M. E. 1992. Top-down and bottom-up forces in foodwebs: do plants have primacy? Ecology 73:733–746.
Rosenzweig, M. L. 1995. Species diversity in space and time.Cambridge University Press, Cambridge, UK.
Siemann, E., D. Tilman, and J. Haarstad. 1996. Insect speciesdiversity, abundance and body size relationships. Nature380:704–706.
Southwood, T. R. E. 1978. Ecological methods. Second edi-tion. Chapman and Hall, London, UK.
Sterner, R. W., and J. J. Elser. 2002. Ecological stoichiom-etry: the biology of elements from molecules to the bio-sphere. Princeton University Press, Princeton, New Jersey,USA.
Ecology, 85(7), 2004, pp. 1802–1804q 2004 by the Ecological Society of America
AN ILLUSION OF MECHANISTIC UNDERSTANDING
HELENE CYR1 and STEVE C. WALKER
Department of Zoology, University of Toronto, Toronto, Ontario, Canada M5S 3G5
INTRODUCTION
James Brown and his colleagues (2004) are at theforefront of a recent resurgence of interest in explainingthe ubiquitous relationships between the body size oforganisms and everything that they do (West et al.1997, 1999). Here, Brown et al. argue that their generalallometric model for metabolism, expanded to includetemperature effects and stoichiometric constraints, of-fers a mechanistic framework to unify ecological think-ing. Body size, temperature, and stoichiometry havelong been recognized to drive many aspects of biologyand ecology; thus, in general terms, the approach isfamiliar and reasonable. The claim that a metabolictheory could link ecology as a whole is interesting and
Manuscript received 20 October 2003. Corresponding Ed-itor: A. A. Agrawal. For reprints of this Forum including theMacArthur Award paper, see footnote 1, p. 1790.
1 E-mail: [email protected]
challenging, but surprisingly poorly justified by Brownet al. (2004). We discuss two main problems with theirargument.
DO WE KNOW THE MECHANISM BEHIND
ALLOMETRIC RELATIONSHIPS? DO WE NEED TO?
The claim of a mechanistic basis to the metabolictheory of ecology is premature. There is currently noagreement on the mechanism(s) that generates allo-metric relationships. The network model proposed byWest et al. (1997, 1999) focuses on the metabolism ofindividuals and assumes optimal distribution of energythrough a fractal network, but this approach has beenstrongly criticized (Dodds et al. 2001). Several othermodels, based on very different processes and as-sumptions, also have been proposed (life history op-timization, Kozlowski and Weiner [1997]; internal me-tabolite transportation, Dreyer and Puzio [2001], Ban-

July 2004 1803METABOLIC THEORY OF ECOLOGY
Forum
avar et al. [2002]; resource partitioning, Kooijman[2000]; chemiosmosis and life history evolution, De-metrius [2003]; the multiplicity of biochemical path-ways, Hochachka et al. [2003]), but have not yet beencompared critically. We should not be lured by theillusion of mechanistic understanding.
Moreover, no single allometric exponent is generallyaccepted. We disagree with the dogmatic use of a ¾exponent by J. Brown and colleagues, to the point ofcorrecting body mass in their analyses by this exponent.A unique ¾ exponent for allometric relationships ofmetabolic rates is currently undefensible, both on the-oretical and on empirical grounds. In contrast to Westet al. (1999), most of the recent alternative models ofmetabolic rate allometry suggest a range of possibleexponents. Allometric exponents are expected to varywith the mass dependence of survivorship (Kozlowskiand Weiner 1997), thermal regulation ($⅔ for endo-therms, #1 for ectotherms; Kooijman [2000]), balancebetween metabolic supply and demand (although ¾ isan optimal value; Banavar et al. [2002]), level of ac-tivity (basal vs. maximum metabolic rate; Hochachkaet al. [2003]), and variability in population size (⅔ forspecies with rapidly fluctuating population sizes, ¾ forspecies with stable population sizes; Demetrius[2003]). Deviations from a ¾ exponent also have beenfound empirically. Recent analyses of very large datasets for birds and mammals support a ⅔ exponent(Dodds et al. 2001, White and Seymour 2003). Simi-larly, the exponents for population density–body sizerelationships vary among communities, and the overallrelationship has an exponent significantly steeper than2¾ (Cyr et al. 1997a, b). The energy equivalence ruleand the suggestion that trophic transfers explain thesteep slopes measured in pelagic systems were specif-ically tested with an extensive data set, and discountedby Cyr (2000). Despite more than a century of workon this topic, the jury is still out on the magnitude ofthe allometric exponents.
This lack of mechanistic understanding does not de-ter from the potential importance of a metabolic theoryof ecology. The existence and the strength of allometricand of temperature relationships are well established.The question raised by Brown et al. is really whetherthese powerful relationships account for ecological in-teractions at all other scales of interest, from populationto community to ecosystem ecology.
HOW DO WE CROSS SCALES WITH A METABOLIC
THEORY OF ECOLOGY?
A second, more serious problem arises in extendingthis metabolic framework to scales of increasing com-plexity. The approach proposed by Brown et al. (2004)is largely justified by the existence of macroecologicalpatterns. These general relationships are very useful inproviding a broad context to interpret data, but are notmeant to provide precise predictions under specificconditions. Unless these models are greatly refined (and
this is not a trivial matter of adjusting coefficients),they will be of little use to population and communityecologists. Few population ecologists would be satis-fied with values of rmax or K (sensu Brown et al. (2004),i.e., mean population density) that span several ordersof magnitude. This is not to say that a metabolic ap-proach cannot work.
A metabolic framework, if modeled at the right scale,can be powerful. More refined physiological modelsdo exist, and have been applied successfully in pop-ulation ecology (Kooijman 2000, Nisbet et al. 2000).These models assume that organisms have clear con-straints on how they can partition resources. The energyand material available to them (i.e., assimilated fromtheir food) are divided among metabolism (for main-tenance of tissues and basic functions), somatic pro-duction, and reproduction, and the input of energy andmaterial must match any change in biomass plus out-puts. The dynamic energy and material budget modelsproposed by Kooijman (2000) and Nisbet and col-leagues (2000) account for the effects of body size,temperature, and stoichiometry, and can be used topredict various aspects of population dynamics. Thesemodels offer a powerful framework to test theoreticalissues in population ecology, but are much more com-plex than the models proposed by Brown et al. (2004)and require careful parameterization for individual spe-cies. There are no shortcuts, yet.
The extension of these physiological models to morenatural conditions and to communities is less obvious.Careful tests of the dynamic budget models have shownthat even simple aspects of more natural systems (e.g.,low food availability, low food quality) can alter thedynamics of a population in very significant ways (e.g.,Nelson et al. 2001). It is well recognized that popu-lation dynamics are context dependent, and will changedepending on interactions with other species (compet-itors, predators) and with the environment (e.g., Chaseet al. 2002). The dynamics of natural populations areunlikely to simply follow from constraints on the en-ergy budget of individual organisms, but must take intoaccount a suite of external factors. Increasing the com-plexity of models beyond a few variables is generallycounterproductive, so a simple extension of these phys-iological models to natural populations or to commu-nities may not be possible. A different modeling frame-work may be required.
Community ecology is replete with general patterns(e.g., species–abundance curves, species–area curves,diversity–productivity relationships, density–body sizerelationships, community size spectra, food web struc-ture, predator–prey size ratios). The mechanisms gen-erating these relationships are still uncertain, but thereis no doubt that the availability of energy and materialaffects the biomass, productivity, and diversity of or-ganisms in communities. However, measuring howmuch resource is really available to organisms is adifficult task, and there is no reason to believe that

Forum
1804 METABOLIC THEORY OF ECOLOGY Ecology, Vol. 85, No. 7
species of all sizes have equal access to resources (assuggested by the energy equivalence rule). Even ap-parently simple questions have baffled ecologists fordecades. For example, how is energy divided amongspecies in a community and how efficiently is it trans-ferred through food webs? Models of energy and ma-terial transfer need to be tested on communities of or-ganisms that actually live in the same environment.Global allometric relationships built from data col-lected in many different communities, such as thoseused by Brown et al., include too many other sourcesof variability (Cyr 2000) and are useless for this task.A metabolic framework that would integrate commu-nity ecology is promising, but remains to be tested ina convincing manner.
The approach proposed by Brown et al. (2004) ismost easily justified for ecosystem ecology, and hasindeed been applied successfully in this context. Thereare two reasons for this. First, the currencies of interest(energy, nutrients, and other chemical elements) are thesame. Second, the error associated with predictionsfrom general allometric models is not unrealisticallylarge compared to errors associated with many eco-system variables. Ecosystem ecologists commonlyhave to use low-precision measurements and estimateswhen dealing with large spatial and temporal scales.When more precise predictions are necessary, the useof more detailed models (e.g., Kooijman 2000) is pos-sible. There are many good examples of the effective-ness of an allometric/metabolic approach in ecosystemecology (e.g., Vanni 2002).
Ecologists have long recognized the strength of al-lometric relationships and the ubiquitous role that tem-perature plays in biology. By proposing a metabolictheory of ecology, Brown et al. challenge us to explorethe implications of these well-known relationships atall scales. This approach has already shown promisingresults in theoretical population ecology and in eco-system ecology, but the case remains to be made con-vincingly for populations under more natural settingsand for communities. The mechanisms proposed byBrown et al. (2004) are interesting. However, the con-ceptual unification of ecology is more likely to dependon our ability to relate variables and processes acrossscales of increasing complexity than on a mechanisticinterpretation of patterns.
LITERATURE CITED
Banavar, J. R., J. Damuth, A. Maritan, and A. Rinaldo. 2002.Supply–demand balance and metabolic scaling. Proceed-
ings of the National Academy of Sciences (USA) 99:10506–10509.
Brown, J. H., J. F. Gillooly, A. P. Allen, V. M. Savage, andG. B. West. 2004. Toward a metabolic theory of ecology.Ecology 85:1771–1789.
Chase, J. M., P. A. Abrams, J. P. Grover, S. Diehl, P. Chesson,R. D. Holt, S. A. Richards, R. M. Nisbet, and T. J. Case.2002. The interaction between predation and competition:a review and synthesis. Ecology Letters 5:302–315.
Cyr, H. 2000. The allometry of population density and inter-annual variability. Pages 267–295 in J. H. Brown and G.B. West, editors. Scaling in biology. Oxford UniversityPress, Oxford, UK.
Cyr, H., J. A. Downing, and R. H. Peters. 1997a. Density–body size relationships in local aquatic communities. Oikos79:333–346.
Cyr, H., R. H. Peters, and J. A. Downing. 1997b. Populationdensity and community size structure: comparison of aquat-ic and terrestrial systems. Oikos 80:139–149.
Demetrius, L. 2003. Quantum statistics and allometric scal-ing of organisms. Physica A 322:477–490.
Dodds, P. S., D. H. Rothman, and J. S. Weitz. 2001. Re-examination of the ‘‘¾-law’’ of metabolism. Journal of The-oretical Biology 209:9–27.
Dreyer, O., and R. Puzio. 2001. Allometric scaling in animalsand plants. Journal of Mathematical Biology 43:144–156.
Hochachka, P. W., C. A. Darveau, R. D. Andrews, and R. K.Suarez. 2003. Allometric cascade: a model for resolvingbody mass effects on metabolism. Comparative Biochem-istry and Physiology, Part A 134:675–691.
Kooijman, S. A. L. M. 2000. Dynamic energy and mass bud-gets in biological systems. Cambridge University Press,Cambridge, UK.
Kozlowski, J., and J. Weiner. 1997. Interspecific allometriesare by-products of body size optimization. American Nat-uralist 149:352–380.
Nelson, W. A., E. McCauley, and F. J. Wrona. 2001. Multipledynamics in a single predator–prey system: experimentaleffects of food quality. Proceedings of the Royal Societyof London B 268:1223–1230.
Nisbet, R. M., E. B. Muller, K. Lika, and S. A. L. M. Kooij-man. 2000. From molecules to ecosystems through dy-namic energy budget models. Journal of Animal Ecology69:913–926.
Vanni, M. J. 2002. Nutrient cycling by animals in freshwaterecosystems. Annual Review of Ecology and Systematics33:341–370.
West, G. B., J. H. Brown, and B. J. Enquist. 1997. A generalmodel for the origin of allometric scaling laws in biology.Science 276:122–126.
West, G. B., J. H. Brown, and B. J. Enquist. 1999. The fourthdimension of life: fractal geometry and allometric scalingof organisms. Science 284:1677–1679.
White, C. R., and R. S. Seymour. 2003. Mammalian basalmetabolic rate is proportional to body mass2/3. Proceedingsof the National Academy of Sciences (USA) 100:4046–4049.

July 2004 1805METABOLIC THEORY OF ECOLOGY
Forum
Ecology, 85(7), 2004, pp. 1805–1807q 2004 by the Ecological Society of America
METABOLIC RATE OPENS A GRAND VISTA ON ECOLOGY
KATHRYN L. COTTINGHAM1 AND M. SCOT ZENS
Department of Biological Sciences, Dartmouth College, Hanover, New Hampshire 03755 USA
INTRODUCTION
Wouldn’t it be nice if ecologists could use a fewsimple parameters, such as the size of an organism andthe temperature at which it operates, to predict indi-vidual mortality, population growth rate, species di-versity, or ecosystem production? Boldly going wherefew ecologists tread, Jim Brown seeks a grand synthesisin ecology that transcends specific organisms and en-vironments. For much of the past decade, he and hiscolleagues have worked to develop unifying ecologicalprinciples from basic physical and chemical constraintson organisms.
In this new paper, Brown et al. (2004) open a newvista on ecology by (1) nominating metabolic rate asthe essential integrator of organismal biology, (2) pro-viding a bold new synthesis of the effects of mass andtemperature on metabolic rate, and (3) proposing anumber of hypotheses about the influences of mass andtemperature on aggregate ecological phenomena rang-ing from whole organisms to community structure toecosystem processes. In this commentary, we addresseach of these contributions, emphasizing the second.
METABOLIC RATE AS THE INTEGRATOR AND
ORGANIZER OF DISPARATE THEORY
Brown et al. (2004) begin by defining metabolismas the biological processing of energy and materials.Although it is difficult to measure field metabolic rates,much evidence suggests that basal metabolic rate isgoverned by resource uptake, chemical transformation,and the distribution of transformed resources through-out the body. Metabolic rate is therefore both a simpleand valuable integrating concept and a key linkage be-tween physical and chemical processes and the indi-vidual, community, and ecosystem. If we can measureit, metabolic rate gives us a holistic measure of indi-vidual performance unconfounded by issues of allo-cation to growth and reproduction.
A particularly novel component of this paper byBrown and colleagues is their deliberate challenge tothe long-standing tradition of considering energy andmaterials as separate currencies for examining ecolog-ical questions (e.g., Reiners 1986). Instead, Brown etal. argue that energy and materials ‘‘are inextricably
Manuscript received 16 October 2003. Corresponding Ed-itor: A. A. Agrawal. For reprints of this Forum including theMacArthur Award paper, see footnote 1, p. 1790.
1 E-mail: [email protected]
linked by the chemical equations of metabolism’’ (p.1774). This alternative viewpoint will definitely pro-voke spirited discussions among ecosystem ecologistsand may spark a careful reconsideration of the here-tofore independent research on energy and materials.
THE COMBINED EFFECTS OF MASS AND
TEMPERATURE ON METABOLISM
After making their argument for the primacy of met-abolic rate, Brown et al. (2004) provide an equationfor metabolic rate as a function of body size (as indexedby mass; West et al. [1997], Enquist et al. [1998]) andtemperature (as summarized by the Bolzmann factor;Gillooly et al. [2001]). Their equation predicts indi-vidual metabolic rate (MR) from the average mass (M,in grams) and the average operating temperature (T, inKelvin):
3/4 2E/(kT)MR 5 aM e (1)
where a is a scaling constant, E is the activation energy,and k is Boltzmann’s constant.
We believe that Eq. 1 has the potential to revolu-tionize the field of ecology. However, we consider itto be a working hypothesis for two reasons. First, theequation needs to be more explicitly rooted in quan-titative derivations from axiomatic properties of phys-ical and chemical systems. Second, the fundamentalhypotheses generated by this theory must face strongerand more appropriate empirical tests. We will detaileach of these concerns.
Concerns about the derivation
Eq. 1 is the cornerstone of Brown et al. (2004), buta full derivation of the form of the equation has notyet been provided. The partial derivation provided byGillooly et al. (2001) suggests that the equation restson the following logical steps.
1) Whole-organism metabolic rate (MR) is definedas the sum of the rates of energy produced by individualbiochemical reactions Ri:
MR 5 R . (2)O ii
We believe that this link between MR and its mecha-nistic underpinnings requires explicit support from thebiochemical literature, especially because the behaviorof a chain of reactions is usually better described bythe behavior of the limiting reaction than by the sumof the reactions in the chain (e.g., Voet and Voet 1995).

Forum
1806 METABOLIC THEORY OF ECOLOGY Ecology, Vol. 85, No. 7
2) Each individual reaction depends on the productof three components: the concentration of reactants (ci),the fluxes of reactants (fi), and the kinetic energy ofthe system (ki):
R } c f k .i i i i (3)
This unsupported assertion is logically necessary toallow the simple form of Eq. 1, but can kinetic energyreally be isolated from the fluxes of reactants in a chainof reactions? We would appreciate references to con-firm this claim.
3) To justify the independence of mass and temper-ature in Eq. 1, Gillooly et al. (2001:2249) state thatthe concentrations and fluxes ‘‘contain the majority ofthe body mass dependence,’’ (an apparent empiricalresult, not shown in the paper), such that their productscales with body mass as M 3/4 for each reaction:
3/4R } (M )k .i i (4)
This substitution rests on the work of West et al. (Westet al. 1997, Enquist et al. 1998), who predicted thatwhole-organism metabolism is constrained by the ef-fective surface areas across which resources are ex-changed with the environment. We would like to seethe substitution of M 3/4 for (cifi) for each reaction ex-plained more carefully, because different reactions dohave different mass dependencies (e.g., Hochachka etal. 2003) and the assumption of equal mass dependen-cies is what makes it possible to separate the mass andtemperature effects on metabolic rate (see [5]).
4) Assuming that ki ‘‘contains the dominant temper-ature dependence’’ (Gillooly et al. 2001:2249; an ap-parent empirical result not shown) and is therefore pro-portional to the Boltzmann factor for each reaction, weobtain:
3/4 2E /(kT)iR } (M )(e ).i (5)
5) Finally, by assuming that the activation energiesEi are identical for all reactions in the summation, Gil-looly et al. (2001) factored out the mass and temper-ature terms to obtain:
3/4 2E/(kT)MR 5 R } [(M )(e )]O Oii i
3/4 2E/(kT)} (M )(e ). (6)
That activation energies differ among the componentreactions of metabolism is supported by data providedin Gillooly et al. (2001) and Brown et al. (2004) in-dicating a range of Ei’s for different organisms andproperties.
Thus, we believe that the available literature doesnot yet provide the links to physical and chemical firstprinciples to support the independence of mass andtemperature effects on metabolic rate implied byEq. 1.
Concerns about the empirical analyses
At some point in its development, new theory needsto be confronted with real-world measurements (Hil-
born and Mangel 1997). We have some concerns aboutthe data and statistical methods used by Brown et al.(2004). First, field metabolic rates (FMR) for wholeorganisms are difficult, if not impossible, to measurein most organisms, so most tests of the metabolic the-ory have used laboratory estimates of basal metabolicrates (BMR). This is justified by Brown et al. (2004)by the curious biological phenomenon in which theaverage FMR is some ‘‘fairly constant multiple, typi-cally about two to three, of the basal metabolic rate’’(p. 1773). The assumed proportionality of FMR andBMR permits inference to organisms in the field, butwe see this assumption as an inferential chasm thatonly a strong theory of measurements (sensu Ford2000) could bridge. Second, the analyses of Brown etal. use a single value of metabolic rate, mass, and op-erating temperature for each species, and we are toldlittle about how the single values per species were de-rived (even in species with sexual dimorphism or in-determinate growth, for which choosing a single valueis not a trivial issue). Is it really appropriate to use amean or median to summarize the distribution of valuesexhibited by real organisms?
Third, the analyses in Brown et al. do not complywith current statistical standards for comparative stud-ies, as they fail to correct for the complications intro-duced by errors-in-variables (Model II regression; So-kal and Rohlf 1995, McArdle 2003) and the lack ofphylogenetic independence within taxa (Harvey andPagel 1991). Moreover, lack-of-fit tests (Draper andSmith 1981) indicate that a line is not the best fitthrough the observed data, at least for the analysesdepicted in Fig. 1 of Brown et al. (2004). In short, itis premature to draw conclusions about the similarityof mass and temperature effects estimated from datato the values predicted by metabolic theory, based onthe analyses provided by Brown et al. (2004).
The exciting prospects raised by Eq. 1
Despite our concerns, we strongly believe that thesynthesis by Brown et al. of mass and temperature ef-fects on metabolism lays the groundwork for a valuableand unique filter for studying the complexity of naturalsystems. For example, Eq. 1 of Brown et al. (2004)provides a way to disentangle the confounding effectsof mass and temperature and then to look for patternsin the residuals. Consider an example with the in-creased environmental temperatures expected underclimate change. Eq. 1 predicts the effects of increasedoperating temperature on the metabolic rate of organ-isms of a given mass. Consequent predictions of on-togenetic growth rate, standing biomass, and biomassturnover guide us to both what variables to monitorand their interpretation. Strong deviations from pre-dicted ontogenetic growth (e.g., Brown et al. 2004: Fig.3) or biomass turnover (e.g., Brown et al. 2004: Fig.9) would clearly indicate systems needing further in-vestigation.

July 2004 1807METABOLIC THEORY OF ECOLOGY
Forum
Alternatively, consider the genetically modified or-ganisms (GMOs) with modifications to growth rates(e.g., Atlantic salmon; Hew et al. [1995], Abrahamsand Sutterlin [1999]) and abiotic tolerances (e.g., manyfood crops; Sharma et al. [2002]) which are rapidlybeing incorporated into our environment. A metabolictheory of ecology could provide a baseline predictionfor how GMOs with altered growth rate or temperatureresponses should be different from their parent popu-lations. In fast-growing GMO salmon, for instance,metabolic rate should be elevated and the strengths ofinteractions with both competitors and prey should bepredictable.
EXTENSIONS OF THE METABOLIC THEORY BEYOND
INDIVIDUALS
The third major component of the Brown et al.(2004) paper extends the metabolic theory to popula-tion, community, and ecosystem metrics. Althoughspace prevents us from making a full comment on thisaspect of the paper, we would like to point out that inderiving the equations for these metrics, Brown andcolleagues generally assume that the combined dynam-ics of multiple organisms are at steady state. For ex-ample, the equation to predict population-level survivaland mortality rates from the average individual massand operating temperature relies on a ‘‘population bal-ance’’ in which organisms that die are replaced by newindividuals (i.e., the net population growth rate is 0).This assumption allows Brown et al. to bypass the com-plexity of temporal dynamics within particular organ-isms or ecosystems, which matches the static, cross-system comparisons used in their paper. However, it ismuch less likely to apply when the focus is on thedynamics of specific real-world populations. We be-lieve that the same physical and chemical principleswill almost certainly constrain individuals whether ornot they are at a population or community equilibrium,and we urge ecologists to work toward relaxing theequilibrium assumption in further extensions of themetabolic theory to higher level ecological processes.
ACKNOWLEDGMENTS
We thank Mark McPeek, Eric Schaller, Roger Sloboda, andMegan Donahue for their advice on some of the issues raised
in this commentary. Drew Allen, Jamie Gillooly, and BrianEnquist fielded our esoteric inquiries while Jim Brown wasunreachable in the Australian Outback.
LITERATURE CITED
Abrahams, M. V., and A. Sutterlin. 1999. The foraging andantipredator behaviour of growth-enhanced transgenic At-lantic salmon. Animal Behaviour 58:933–942.
Brown, J. H., J. F. Gillooly, A. P. Allen, V. M. Savage, andG. B. West. 2004. Toward a metabolic theory of ecology.Ecology 85:1771–1789.
Draper, N. R., and H. Smith. 1981. Applied regression anal-ysis. Second edition. John Wiley, New York, New York,USA.
Enquist, B. J., J. H. Brown, and G. B. West. 1998. Allometricscaling of plant energetics and population density. Nature395:163–165.
Ford, E. D. 2000. Scientific method for ecological research.Cambridge University Press, New York, New York, USA.
Gillooly, J. F., J. H. Brown, G. B. West, V. M. Savage, andE. L. Charnov. 2001. Effects of size and temperature onmetabolic rate. Science 293:2248–2251.
Harvey, P. H., and M. D. Pagel. 1991. The comparative meth-od in evolutionary biology. Oxford University Press, NewYork, New York, USA.
Hew, C. L., G. L. Fletcher, and P. L. Davies. 1995. Transgenicsalmon: tailoring the genome for food production. Journalof Fish Biology 47:1–19.
Hilborn, R., and M. Mangel. 1997. The ecological detective:confronting models with data. Cambridge University Press,New York, New York, USA.
Hochachka, P. W., C. A. Darveau, R. D. Andrews, and R. K.Suarez. 2003. Allometric cascade: a model for resolvingbody mass effects on metabolism. Comparative Biochem-istry and Physiology A—Molecular and Integrative Phys-iology 134:675–691.
McArdle, B. H. 2003. Lines, models, and errors: regressionin the field. Limnology and Oceanography 48:1363–1366.
Reiners, W. A. 1986. Complementary models for ecosystems.American Naturalist 127:59–73.
Sharma, H. C., J. H. Crouch, K. K. Sharma, N. Seetharama,and C. T. Hash. 2002. Applications of biotechnology forcrop improvement: prospects and constraints. Plant Science163:381–395.
Sokal, R. R. and F. J. Rohlf. 1995. Biometry, Third edition.W. H. Freeman, New York, New York, USA.
Voet, D., and J. G. Voet. 1995. Biochemistry. Second edition.John Wiley, New York, New York, USA.
West, G. B., J. H. Brown, and B. J. Enquist. 1997. A generalmodel for the origin of allometric scaling laws in biology.Science 276:122–126.
Forum
1808 METABOLIC THEORY OF ECOLOGY Ecology, Vol. 85, No. 7
Ecology, 85(7), 2004, pp. 1808–1810q 2004 by the Ecological Society of America
CAN FUNCTION AT THE ORGANISMAL LEVEL EXPLAINECOLOGICAL PATTERNS?
M. A. R. KOEHL1 AND BRYCE D. WOLCOTT
Department of Integrative Biology, University of California, Berkeley, California 94720-3140 USA
INTRODUCTION
Brown et al. (2004) propose that ‘‘first principles ofchemistry, physics, and biology’’ can be used to linkthe function of individual organisms to ecological pro-cesses. By arguing that metabolic rate controls eco-logical processes at all levels of organization, from theindividual to the biosphere, they propose that a met-abolic theory of ecology can be a powerful unifyingprinciple. Because the scope of their vision is so broad,and because the models on which these ideas are basedare controversial, the papers by Brown, West, and theircollaborators (cited in Brown et al. 2004) have stim-ulated lively intellectual debate within and betweendisciplines, and have spawned new research in a num-ber of different fields. By stirring the pot with theirbroad-reaching ideas, Brown and his colleagues aremaking a significant contribution to the advancementof both physiology and ecology, whether or not theirtheories turn out to be correct or general in their ap-plicability.
MECHANISTIC VS. PHENOMENOLOGICAL MODELS
Mathematical models in ecology and organismal bi-ology can be mechanistic or phenomenological. Thestrengths and limitations of these two approaches havebeen debated (reviewed by Schoener 1986, Koehl1989). Mechanistic models assume that particular pro-cesses determine the behavior of a system, and builda quantitative description of how the system worksbased on these underlying mechanisms. An example ofsuch an approach is the modeling cited by Brown etal. (2004) of how materials are distributed within or-ganisms by branching transport systems. This mecha-nistic approach shows how uptake and transport ratesof resources within an organism can limit its metabolicrate, and predicts that whole-organism basal metabolicrate should scale as body mass raised to the ¾ power.In contrast, other models are phenomenological de-scriptions of a system. For example, the regressionequations describing the data in Figs. 1–5 in Brown etal. (2004) provide quantitative expressions of how thesystems being plotted behave, showing that processes
Manuscript received 13 November 2003. CorrespondingEditor: A. A. Agrawal. For reprints of this Forum (includingthe MacArthur Award paper), see footnote 1, p. 1790.
1 E-mail: [email protected]
occur at particular rates, rather than how those ratesare produced. Although phenomenological models pro-vide an effective way of organizing observations toreveal patterns and of making predictions about theperformance of systems for which we have data, mech-anistic models can be powerful tools for developingour understanding of how a system works.
STUDYING ORGANISM-LEVEL FUNCTION TO
UNDERSTAND ECOLOGICAL PROCESSES
Brown et al. (2004) argue that metabolic theory canhelp to explain the patterns observed in many ecolog-ical processes. This approach is part of a long, althoughsometimes ignored, tradition of studying how processesoperating at the level of individual organisms can de-termine the properties of populations, communities,and ecosystems (reviewed in Koehl 1989). The phil-osophical underpinnings of using such a reductionistapproach in ecology were discussed by Schoener(1986). To put the metabolic theory of Brown et al.(2004) in perspective, we will mention a few examplesof earlier attempts to use basic laws of physics andchemistry to explain defined aspects of organismal-level function and the ecological consequences of thosefunctions.
Theories of heat and mass transport have been cou-pled with analyses of physical aspects of the environ-ment to reveal constraints on distributions and inter-actions of organisms. This approach has been used toexplain ecological phenomena ranging from predator–prey interactions (Porter et al. 1975) to reproductivestrategies (Kingsolver 1983). More recently, this bio-physical approach has been used to explore some ofthe ecological consequences of global climate change(e.g., Grant and Porter 1992, Helmuth et al. 2002). Adifferent reductionist approach, focusing on the func-tion of heat-shock proteins, is also being used to ex-plore how thermal tolerance relates to biogeographicpatterns of species distributions (e.g., Tomanek and So-mero 1999).
Foraging ecology provides some other examples ofusing basic principles of chemistry and physics to re-late the function of organisms to ecological processes.Chemical reactor theory has been used to understandthe kinetics of digestion by guts of different designs,and the functional insights emerging from such anal-yses have been used to explain ecological patterns in

July 2004 1809METABOLIC THEORY OF ECOLOGY
Forum
foraging strategies (e.g., Penry and Jumars 1987). Sim-ilarly, basic rules of aerodynamics have been used toexplain the mechanical and energetic constrains on for-aging by flying animals, providing functional expla-nations of ecological patterns, such as the absence offolivory among flying animals (Dudley and Vermeij1992), or the different foraging strategies used by hum-mingbirds living at low vs. high altitudes (Feinsingeret al. 1979).
Basic principles of fluid and solid mechanics havealso been used to analyze the susceptibility of benthicand intertidal marine organisms to physical disturbance(e.g., Denny 1999, Koehl 1999), an important processin structuring many communities. A scaling rule thatemerged from the physics was hypothesized to explainthe observation that organisms on wave-swept shoresare small, but subsequent research showed that thisphysical constraint is usually not what limits the sizeof those organisms (Denny 1999). However, investi-gation of the hypothesis led to many discoveries aboutthe mechanical design of marine organisms, the spatialand temporal patterns of physical stresses in wave-swept habitats, and the interplay of mechanical designand life history strategy in variable environments (re-viewed in Denny 1999, Koehl 1999).
The metabolic theory of ecology of Brown et al.(2004) is much more ambitious than any of the ex-amples just cited. Earlier applications of organismalfunctional biology to address ecological problems havefocused on specific processes, such as foraging or dis-turbance. In contrast, Brown et al. (2004) point out theapplicability of the metabolic theory to a wide rangeof ecological issues, from life history to populationinteractions and ecosystem processes. Therefore, as or-ganismal biologists and ecologists debate and test theassumptions and predictions of the metabolic theory,its impact no doubt will be far greater than that of theearlier, more narrowly focused links between basicchemistry and physics with ecology.
THE MODEL HAS STIMULATED NEW SYNTHESIS
AND RESEARCH IN ORGANISMAL BIOLOGY
An earlier attempt to provide a mechanistic expla-nation for the scaling of metabolic rate with body size,the elastic similarity model of McMahon (1973), wascontroversial and spawned a flurry of research activityand new discoveries about the biomechanics of skeletaldesign in animals and plants, and of locomotion. Thecontroversies swirling around the models proposed byBrown and collaborators seem to be having a similareffect on the field of physiology. For example, debateabout one of the underlying assumptions of the model,that the terminal branches of a biological transport net-work (such as capillaries, or mitochondria) are invari-ant in size, has led to re-examination of experimentaldata about the morphology and performance of car-diovascular systems (Dawson 2001) and about mito-
chondrial structure and function (Porter 2001) in ani-mals of different sizes.
Physiologists studying metabolic pathways have ob-jected to the idea that a single process, transport ofmaterials through hierarchical, fractal-like networks,limits metabolic rate (e.g., Darveau et al. 2002). Al-though the alternative model proposed by Darveau etal. (2003) is seriously flawed (e.g., Banavar et al. 2003),we should not ignore the body of experimental workshowing that a variety of interrelated physiological andbiochemical processes all contribute to limiting therates of ATP synthesis and use in cells. These pro-cesses, some of which are important in controlling theoverall metabolic rate of an animal when it is at restwhile others play a larger control role when the animalis active, scale differently with body size.
Another assumption of the metabolic theory ofBrown et al. (2004) is that natural selection has actedto minimize energy expenditure within a biologicaltransport system. This assumption flies in the face oflong-standing arguments that complex physiological ormorphological systems that perform a variety of dif-ferent functions that affect fitness, and that evolve inchanging environments, are not likely to show opti-mization of a single criterion (reviewed in Dudley andGans 1991). Nonetheless, optimization models haveproven to be powerful tools in guiding empirical re-search (reviewed in, e.g., Koehl 1989), and the modelsof Brown and colleagues are clearly serving as a cat-alyst for interesting new discussions and experimentsin physiology.
IF THE MODEL IS PHENOMENOLOGICAL, WILL IT
STILL BE USEFUL TO ECOLOGISTS?
Even if the mechanisms responsible for the size de-pendence of metabolic rate that have been hypothesizedby Brown et al. (2004) turn out to be inconsistent withfuture experimental evidence, the allometric equationsproduced by their model may still prove to be usefuldescriptions of how the rates of various ecologicallyimportant processes vary with body size and temper-ature. However, several cautionary notes should bementioned about their central theme that metabolic ratevaries with body mass raised to the ¾ power. Whetheran exponent of ¾ can be statistically distinguished fromone of ⅔, given the scatter in the data, has been ex-amined by a number of investigators (e.g., Dodds etal. 2001). Furthermore, although the universal modeldescribing the metabolic rate data spanning 20 ordersof magnitude in body mass (from tiny microbes to largemammals) has an exponent of ¾, the exponents forspecific clades of organisms within the composite dataset can be higher or lower (e.g., Riisgard 1998, Dawson2001, Dodds et al. 2001). Perhaps more worrying isthe observation, for a variety of invertebrates, that themetabolic rates of young, rapidly growing individualsscale with body mass raised to higher exponents thando those of slowly growing older stages and adults

Forum
1810 METABOLIC THEORY OF ECOLOGY Ecology, Vol. 85, No. 7
(Riisgard 1998). Because of ontogenetic changes andspecies differences in temperature sensitivity, Rom-bough (2003) also cautions against using models thatare based on comparisons across different life stagesand types of organisms to make predictions about re-sponses of particular species.
Brown et al. (2004) are the first to point out thatvariation of the data not explained by their metabolictheory provides clues to factors other than body sizeand temperature that can affect metabolic and ecolog-ical processes, and they list some ecological patternsthat probably do not have a metabolic explanation.Nonetheless, the simple expression that they have de-veloped to predict the combined effect of size and tem-perature on whole-organism metabolic or productionrate (Brown et al. 2004: Eq. 4) is a useful way ofsummarizing observations spanning a vast range of or-ganism size, thereby providing a powerful tool for mak-ing predictions about various ways in which the me-tabolism of individual organisms might determine im-portant ecological processes. Whether or not all of theaspects of the metabolic theory of Brown et al. (2004)turn out to be right, this theory will make significantcontributions to our understanding of how organismsand ecosystems work because it is focusing attentionon the importance of metabolism to ecological pro-cesses, is inspiring so much new research, and is serv-ing as a catalyst for communication between organis-mal biologists and ecologists.
LITERATURE CITED
Banavar, J. R., J. Damuth, A. Maritan, and A. Rinaldo. 2003.Allometric cascades. Nature 421:713–714.
Brown, J. H., J. F. Gillooly, A. P. Allen, V. M. Savage, andG. B. West. 2004. Toward a metabolic theory of ecology.Ecology 85:1771–1789.
Darveau, C. A., R. K. Suarez, R. D. Andrews, and P. W.Hochachka. 2002. Allometric cascade as a unifying prin-ciple of body mass effects on metabolism. Nature 417:166–170.
Dawson, T. H. 2001. Similitude in the cardiovascular systemof mammals. Journal of Experimental Biology 204:395–407.
Denny, M. 1999. Are there mechanical limits to size in wave-swept organisms? Journal of Experimental Biology 202:3463–3467.
Dodds, P. S., D. H. Rothman, and J. S. Weitz. 2001. Re-examination of the ‘‘‘¾-law’’ of metabolism. Journal ofTheoretical Biology 209:9–27.
Dudley, R., and C. Gans. 1991. A critique of symmorphosisand optimality models in physiology. Physiological Zool-ogy 64:627–637.
Dudley, R., and G. J. Vermeij. 1992. Do the power require-ments of flapping flight constrain folivory in flying ani-mals? Functional Ecology 6:101–104.
Feinsinger, P., R. K. Colwell, J. Terborgh, and S. B. Chaplin.1979. Elevation and the morphology, flight energetics, andforaging ecology of tropical hummingbirds. American Nat-uralist 113:481–497.
Grant, B. W., and W. P. Porter. 1992. Modeling global mac-roclimatic constraints on ectotherm energy budgets. Amer-ican Zoologist 32:154–178.
Helmuth, B., C. D. G. Harley, P. M. Halpin, M. O’Donnell,G. E. Hofmann, and C. A. Blanchette. 2002. Climatechange and latitudinal patterns of intertidal thermal stress.Science 298:1015–1017.
Kingsolver, J. G. 1983. Ecological significance of flight ac-tivity in Colias butterflies: implications for reproductivestrategy and population structure. Ecology 64:546–551.
Koehl, M. A. R. 1989. From individuals to populations. Pages39–53 in J. Roughgarden, R. M. May, and S. A. Levin,editors. Perspectives in ecological theory. Princeton Uni-versity Press, Princeton, New Jersey, USA.
Koehl, M. A. R. 1999. Ecological biomechanics: life history,mechanical design, and temporal patterns of mechanicalstress. Journal of Experimental Biology 202:3469–3476.
McMahon, T. A. 1973. Size and shape in biology. Science179:349–351.
Penry, D. L., and P. A. Jumars. 1987. Modeling animal gutsas chemical reactors. American Naturalist 129:69–96.
Porter, R. K. 2001. Allometry of mammalian cellular oxygenconsumption. Cellular and Molecular Life Sciences 58:815–822.
Porter, W. P., J. W. Mitchell, W. A. Beckman, and C. R. Tracy.1975. Environmental constraints on some predator–preyinteractions. Pages 347–364 in D. M. Gates and R. B.Schmerl, editors. Perspectives of biophysical ecology.Springer-Verlag, New York, New York, USA.
Riisgard, H. U. 1998. No foundation of a ‘‘¾ power scalinglaw’’ for respiration in biology. Ecology Letters 1:71–73.
Rombough, P. 2003. Modelling developmental time and tem-perature. Nature 424:268–269.
Schoener, T. W. 1986. Mechanistic approaches to communityecology: a new reductionism. American Zoologist 26:81–106.
Tomanek, L., and G. N. Somero. 1999. Evolutionary andacclimation-induced variation in the heat-shock responsesof congeneric marine snails (genus Tegula) from differentthermal habitats: implications for limits of thermo toleranceand biogeography. Journal of Experimental Biology 202:2925–2936.

July 2004 1811METABOLIC THEORY OF ECOLOGY
Forum
Ecology, 85(7), 2004, pp. 1811–1813q 2004 by the Ecological Society of America
ENERGY PARTITIONING BETWEEN DIFFERENT-SIZED ORGANISMS ANDECOSYSTEM STABILITY
BAI-LIAN LI,1,3 VICTOR G. GORSHKOV,2 AND ANASTASSIA M. MAKARIEVA2
1Department of Botany and Plant Sciences, University of California, Riverside, California 92521 USA2Theoretical Physics Division, Petersburg Nuclear Physics Institute, 188300, Gatchina, St. Petersburg, Russia
INTRODUCTION
The metabolic approach to ecology presented byBrown et al. (2004) stems from the seminal work ofWest et al. (1997). They hypothesized that materialtransport within living beings is organized such as tominimize the scaling of total hydrodynamic resistancethrough vascular networks. Based on this assumption,the organismal metabolic power P was theoreticallypredicted to scale with body mass M as P } M 3/4. Byadditionally assuming that organismal metabolic pro-cesses accelerate with temperature in the same manneras individual biochemical reactions, a temperature cor-rection factor was added to this scaling:
3/4 2E/kTP } M e . (1)
At the organismal level, these results were criticizedon both theoretical and empirical grounds (e.g., Doddset al. 2001, Chen and Li 2003, Makarieva et al. 2003,2004a). In particular, Makarieva et al. (2004a) showedhow the application of the metabolic approach to theontogenetic growth problem (West et al. 2001) resultedin violation of the energy conservation law. In this shortcommentary, however, we will focus on the potentialof the metabolic approach to explain patterns in pop-ulation and ecosystem dynamics.
LINKING INDIVIDUAL AND ECOSYSTEM ENERGETICS:THE LOGIC
The relationship linking individual to population en-ergetics is:
NP 5 R (2)
where N (number of individuals per square meter) isthe population density of individuals of a given bodysize, P is the rate of individual energy use (Watts perindividual), and R (Watts per square meter) is the area-specific rate at which the population consumes energyresources from the environment. Eq. 2 is obvious andessentially identical to Eq. 9 of Brown et al. (2004), ifthe latter is related to unit area and Eq. 1 is taken intoaccount.
Manuscript received 20 October 2003. Corresponding Ed-itor: A. A. Agrawal. For reprints of this Forum (includingthe MacArthur Award paper), see footnote 1, p. 1790.
3 E-mail: [email protected]
A variable of critical importance in both ecology andorganismal biology is body size. A successful biolog-ical theory is expected to be able to predict the de-pendence of individual metabolic power on body sizeon the basis of some fundamental assumptions per-taining to organismal morphology and biochemistry.For example, the assumptions that underlie Eq. 1 canbe classified as being of this kind.
Similarly, an ecological theory will be able to suc-cessfully predict the scaling of population energy use,R, with body size only if it identifies and takes intoaccount some fundamental principles of an ecologicalcommunity’s organization. As long as the basic prin-ciples of the metabolic approach are restricted to theorganismal level, none of them is relevant to the eco-system-level question of whether larger organismsshould claim larger, smaller, or equal shares of an eco-system’s productivity than smaller organisms. The met-abolic approach stretches to the ecosystem scale bymaking a simplifying assumption that if R is indepen-dent of body size, then the scaling of population densityN with body size will be determined by the scaling ofindividual metabolic power.
However, it is unclear whether there is a dependenceof R on body size. If there is such a dependence, whatare the fundamental causes and consequences? Al-though the metabolic approach refrains from answeringthis question, a growing body of evidence suggests thatthe scaling of R with body size varies predictably withthe degree of ecosystem stability, thus providing cluesto this central problem of modern ecology (McCann2000).
ENERGETIC DOMINANCE OF SMALLER ORGANISMS
IN STABLE ECOSYSTEMS
There is some evidence showing that the smallerorganisms claim larger shares of an ecosystem’s pro-ductivity in relatively stable ecosystems. For example,Sprules and Munawar (1986) studied the scaling ofphytoplankton population density N } Mb in 67 sitesforming a stability gradient: from self-sustainable,oligotrophic ecosystems of open ocean and large lakesto highly unstable, ‘‘flushing’’ eutrophic ecosystemsof shallow lakes and coastal zones that receive majordischarges of nutrients and contaminants. They foundthat the scaling exponent consistently increases from

Forum
1812 METABOLIC THEORY OF ECOLOGY Ecology, Vol. 85, No. 7
b ø 21.16 in stable ecosystems to b ø 20.76 inunstable ones. These results indicate that in stableecosystems smaller organisms consume a larger pro-portion of the ecosystem’s energy flux than largerones, whereas in unstable ecosystems the energy par-titioning among different-sized organisms becomesmore equitable. Biddanda et al. (2001) confirmed theemerging pattern and showed that in the most stableaquatic ecosystems, bacteria (the smallest organisms)fully control the energy use, accounting for 91–98%of total ecosystem’s respiration. In highly eutrophicwaters, the share of bacterial respiration decreases to9%, indicating the growing role of larger heterotrophsin less stable ecosystems.
In an extensive survey of phytoplankton (6339 sea-water samples), Li (2002) grouped the phytoplanktoncommunity into three size classes; the difference in cellmass between the smallest and the largest classes isabout three orders of magnitude (Msmall/Mlarge ; 1023).The pattern characterized by Li (2002) was that theratio between population densities of the smallest andthe largest cells grows with increasing degrees of theecosystem’s stability, the latter being estimated by thedegree of eutrophy and intensity of water mixing (Li2002: Figs. 2a and 3a, respectively). In stable ecosys-tems, the smallest cells outnumber the largest ones byabout four orders of magnitude, Nsmall/Nlarge ; 104. Thisallows the estimation of the scaling exponent b as b; log10(Nsmall/Nlarge)/log10(Msmall/Mlarge) ; 24/3. Again,we are faced with energetic dominance of the smallestorganisms in stable ecosystems. In unstable ecosys-tems, the difference between Nsmall and Nlarge is aboutone order of magnitude only, producing an approximateslope of b ; 21/3.
When the differences in the degree of stability ofstudied ecosystems are ignored and all phytoplanktondata are pooled in one plot (Li 2002: Fig. 2b), oneobtains b 5 20.78. The ecological meaningfulness ofthis result (interpreted by Brown et al. [2004] as sup-portive of their approach) is questionable. Dependingon the degree to which stable and unstable ecosystemsare represented in the cumulative data set, the scalingexponent can vary within broad margins, being morea function of data assortment procedure than reflectingproperties of real ecosystems.
Turning to terrestrial ecosystems, Damuth (1993) re-ported 39 values of scaling exponent b for a total of557 mammalian species grouped according to habitattypes, which he classified into closed (forests, woods)and open (savannahs, grasslands). Thus defined, openecosystems appear to be more unstable both in termsof biomass fluctuations (e.g., Van de Koppel and Prins1998) and environmental degradation processes likesoil erosion (Lal 1990). The 39 scaling exponents listedby Damuth (1993) vary from 21.4 to 10.42, with amean of 20.71. However, if one analyzes the scalingexponents separately in closed vs. open ecosystems, itis observed that the closed (more stable) ecosystems
are, on average, characterized by a significantly morenegative scaling exponent b than are open (less stable)ecosystems, (20.88 6 0.31 vs. 20.50 6 0.40, mean6 1 SD; P , 0.01), consistent with the results for aquat-ic ecosystems.
PERSPECTIVES FOR THEORETICAL RESEARCH OF THE
ALLOMETRIC R—M SCALING
These analyses suggest that the potential of the R—M scaling as an informative indicator of ecosystemstability is tangible and calls for a serious scrutiny(Makarieva et al. 2004b). There are straightforwardarguments justifying the direct relevance of the energyuse patterns to ecosystem stability and opening the wayfor theoretical research (Gorshkov et al. 2000). In ac-cordance with the statistical law of large numbers, sev-eral small organisms consume the same energy flux ina more balanced manner than does one large organism,thus lowering the risk of both underexploitation oroverexploitation of the available resources and reduc-ing fluctuations of a community’s biomass and nutrient-cycling processes. This is like dividing your moneyamong several investments; return will be stabilizedand loss minimized. Ecosystems where energy use isdominated by smaller organisms (but not for terrestrialplants, as we will discuss) are therefore expected to bemore stable than ecosystems where large organismsconsume considerable portions of a community’s en-ergy flux.
The large apparent size of many plants (e.g., trees)is due to a large amount of metabolically inactive tis-sues (wood) that do not participate in energy conver-sion processes (Makarieva et al. 2003). Instead, thephotosynthetic power in terrestrial plants is exerted byunits of relatively small size: leaves and needles. Incontrast to rigidly correlated organs within an animalbody, different photosynthesizing units of the sameplant are correlated only very weakly. This allowsplants to make use of the law of large numbers and tostabilize the flux of primary productivity, in the samemanner as numerous small heterotrophs are able to sta-bilize the flux of decomposition. Our prediction istherefore that, similar to the way in which the smallestphytoplankton (unicellular photosynthesizing units)dominate energy flux in stable aquatic ecosystems (Li2002), the major flux of solar energy in stable terrestrialecosystems should also be claimed by plants havingthe smallest photosynthesizing units. For example, sta-ble late-successional stages in boreal forests are dom-inated by conifers that have much smaller photosyn-thesizing units (needles) than grasses and deciduoustrees of early-successional stages (Whittaker 1975). Webelieve that studying the nature and size of photosyn-thesizing units (rather than the currently emphasizedapparent plant size) will yield important insights intohow terrestrial ecosystems are organized.
The increasing anthropogenic pressure imposed onnatural life-support systems makes the problem of eco-

July 2004 1813METABOLIC THEORY OF ECOLOGY
Forum
system stability a major challenge for ecological re-search (McCann 2000). This challenge is unlikely tobe met by the ecological theory if it confines itself totheoretically unjustified, axiomatic assumptions, likethe assumption of R } M0 within the metabolic ap-proach of Brown et al. (2004), which, as we have ar-gued, is empirically unsupported.
LITERATURE CITED
Biddanda, B., M. Ogdahl, and J. Cotner. 2001. Dominanceof bacterial metabolism in oligotrophic relative to eutrophicwaters. Limnology and Oceanography 46:730–739.
Brown, J. H., J. F. Gillooly, A. P. Allen, V. M. Savage, andG. B. West. 2004. Toward a metabolic theory of ecology.Ecology 85:1771–1789.
Chen, X., and B.-L. Li. 2003. Testing the allometric scalingrelationships with seedlings of two tree species. Acta Oec-ologica 24:125–129.
Damuth, J. 1993. Cope’s rule, the island rule and the scalingof mammalian population density. Nature 365:748–750.
Dodds, P. S., D. H. Rothman, and J. S. Weitz. 2001. Re-examination of the ‘‘3/4-law’’ of metabolism. Journal ofTheoretical Biology 209:9–27.
Gorshkov, V. G., V. V. Gorshkov, and A. M. Makarieva. 2000.Biotic regulation of the environment: key issue of globalchange. Springer-Verlag, London, UK.
Lal, R. 1990. Soil erosion and land degradation: the globalrisks. Pages 129–172 in R. Lal and B. A. Stewart, editors.Advances in soil science. Volume 11. Soil degradation.Springer-Verlag, New York, New York.
Li, W. K. W. 2002. Macroecological patterns of phytoplank-ton in the northwestern North Atlantic Ocean. Nature 419:154–157.
Makarieva, A. M., V. G. Gorshkov, and B.-L. Li. 2003. Anote on metabolic rate dependence on body size in plantsand animals. Journal of Theoretical Biology 221:301–307.
Makarieva, A. M., V. G. Gorshkov, and B.-L. Li. 2004a.Ontogenetic growth: models and theory. Ecological Mod-elling, in press.
Makarieva, A. M., V. G. Gorshkov, and B.-L. Li. 2004b. Bodysize, energy consumption and allometric scaling: a newdimension in the diversity-stability debate. EcologicalComplexity, in press.
McCann, K. S. 2000. The diversity–stability debate. Nature405:228–233.
Sprules, W. G., and M. Munawar. 1986. Plankton size spectrain relation to ecosystem productivity, size, and perturba-tion. Canadian Journal of Fisheries and Aquatic Science43:1789–1794.
Van de Koppel, J., and H. H. T. Prins. 1998. The importanceof herbivore interactions for the dynamics of African sa-vanna woodlands: an hypothesis. Journal of Tropical Ecol-ogy 14:565–576.
West, G. B., J. H. Brown, and B. J. Enquist. 2001. A generalmodel for ontogenetic growth. Nature 413:628–631.
West, G. B., B. J. Enquist, and J. H. Brown. 1997. A generalmodel for the origin of allometric scaling laws in biology.Science 276:122–126.
Whittaker, R. H. 1975. Communities and ecosystems. Mac-Millan, New York, New York, USA.
Ecology, 85(7), 2004, pp. 1813–1816q 2004 by the Ecological Society of America
A ONE-RESOURCE ‘‘STOICHIOMETRY’’?
ROBERT W. STERNER1
Ecology, Evolution and Behavior, University of Minnesota, St. Paul, Minnesota 55108 USA
The approach of Brown et al. (2004) might succeedor fail on two levels. On one level, it can be used asa purely statistical, predictive tool. Examples given byBrown and colleagues leave no doubt that temperatureand body size ‘‘explain’’ (in the statistical sense) a greatdeal. We do need good predictive models for manyreasons, one of them for incorporating more ecologyand thus improving models of global change. The sec-ond, more difficult, level has to do with the reasonswhy those statistical predictor variables work the waythey do, and why they are good predictors in the firstplace. The processes that Brown et al. propose—fractalscaling of distribution networks and thermodynamickinetics of ‘‘metabolism’’—may truly be the mecha-nistic basis for the observed patterns, but that, of
Manuscript received 3 November 2003. CorrespondingEditor: A. A. Agrawal. For reprints of this Forum (includingthe MacArthur Award paper), see footnote 1, p. 1790.
1 E-mail: [email protected]
course, is less certain than is the existence of goodstatistical correlations.
Brown et al. view the ‘‘big three’’ variables to betemperature, body size, and stoichiometry. Tempera-ture turns out to be approachable using decades-oldformulations of Arrhenius, Boltzmann, and others. Itis a shock that these models, which have been shownto work for ‘‘simple’’ biological functions such as ox-ygen consumption or even bacterial growth (Johnsonet al. 1974), also do a splendid job with the more com-plex variables of standing stock and even diversity(which are not even rates). The critical and surprisingresult here is that so much ecological temperature de-pendence is described by the Arrhenius-Boltzmannequation, with near-constant activation energy. Whatthat success itself means is a fascinating question, per-haps related to just what is ‘‘metabolism.’’ In spite oftheir complexity, do one or a small number of coremetabolic pathways regulate organism growth, so that

Forum
1814 METABOLIC THEORY OF ECOLOGY Ecology, Vol. 85, No. 7
those kinetics dominate the signals at these higher lev-els of observation? Body size relationships also havehad a long history of study, and a family of power lawshas been explored very thoroughly; this literature hasbeen reenergized by the fractal distribution theory.
Given the success of models with just these two var-iables (e.g., Brown et al. 2004: Figs. 1–8), why mightthe third—stoichiometry—even be needed? At least inthe statistical sense, not much is left to explain. Buthere the mechanistic sense must be considered. Ratelimitation of growth (and therefore metabolism, as de-fined by Brown et al.) usually involves scarcity of somematerial(s) or resource(s). Therefore, although it mightbe that models without explicit mention of materialresources can be good statistical tools (level one), tounderstand how these systems work and why they havethe structure they do, we must explicity include therate-limiting steps and processes (level two). The frac-tal scaling of distribution networks might relate tomovement of many kinds of materials, but it is veryhard to reconcile a temperature–kinetic control of onestep of metabolism with the fact that ecologists knowthat, in nature, organisms face multiple limiting con-staints. Either many key biochemical steps have nearlyidentical temperature dependence, or the Bolzmann-temperature interpretation collides with current under-standings about the multiplicity of limiting factors innature.
What is the best way to incorporate material limi-tations with temperature and body size models intobroad-scale, macroecology models? Or, stated moregenerally, what does a combination of metabolic con-trol theory (see Fell 1997) and ecology look like?Brown et al. (2004) suggest one possibility. They in-corporate a single term, linear with organism nutrientcontent, and generate a comprehensive model includingstoichiometry (see also Brown et al. 2004: Fig. 9). Isthis then the cardinal equation of macroecology,
23/4 2E/kTX 5 M e R 1 error
where M, E, k, and T are as in Brown et al. (2004),and X stands for some ecological parameter of interest,and R stands for ‘‘resource’’? Might such an equationreally ‘‘explain’’ (in both senses, statistical and mech-anistic) so much?
We can ask if a single linear term in R is enough todo the job. If we correct for M and T, or let them besubsumed into the error term, and just explore how Xvaries with R, we now are simply asking how someparameter of interest varies with the amount of a lim-iting resource. Stoichiometrically, if there is but onepotentially limiting reagent and all else remains equal,product yield will indeed be a simple linear functionof the limiting reagent’s amount. However, when morethan one reagent may limit a reaction, the expectationis more complicated. Over broad ranges of productivityand, hence, resource abundance, many ecological phe-nomena are nonlinear with productivity. Over broad
ranges, biomass often increases with the limiting nu-trient via a saturating, not linear, function (Sterner andElser 2002). Work with even- and odd-link trophicmodels (Oksanen et al. 1981, DeAngelis 1992) suggeststhat responses to nutrient enrichment are dependent ontrophic structure. Diversity may increase, decrease, orhave some hump shape with respect to productivity(Rosenzweig 1995). There are many other examples ofnonlinear resource effects, and these cast considerabledoubt as to whether there is a Boltzmann-equivalentterm with a single functional form when dealing withlimiting substances.
Resources are a more heterogenous lot than is tem-perature. They range from light and chemical energyto water and a handful of nutrient elements. In somecontexts, space itself, or hiding or nesting sites arelimiting. Often, more than one of these resources playssome role in controlling rates at any one time, andsometimes having a lot of one resource means that youcan do with less of another. Also, do we mean resourceswithin or external to the organism? Finally, in manycontexts, these substances exist in a plethora of formsand the simple act of determining what pool of re-sources is involved provides some real limitation touniversality of these measures.
Brown et al. (2004) sidestep all of this complexitywhen they assert: ‘‘Far from being distinct ecologicalcurrencies, as some authors have implied (Reiners1986, Sterner and Elser 2002), the currencies of energyand materials are inextricably linked by the chemicalequations of metabolism.’’ First, a clarification: whatis ecological stoichiometry about, if it is not about theseinextricable linkages? Elser and I agree that resourcesare linked! The critical point is the nature of the link-age. The context in which the statement of Brown etal. is true is under fixed stoichiometric coefficients.With fixed stoichiometric coefficients (i.e., constant nu-trient ratios), knowing one substance tells you every-thing about all substances, because they are all simpleproportions of one another. At a sufficiently broadscale, such an assumption might be fine, in that thechemistries of different living systems are more alikethan they are different: they all are based on C, N, P,etc., and all living things need proteins, phospholipidmembranes, nucleic acids, etc. At some highly ap-proximate level, living things do have a uniform stoi-chiometry. However, I say ‘‘might’’ because even withfixed coefficients, strategies for winning in a world ofscarce ‘‘resource one’’ might not work for other re-sources. One need only think of the different strategiesthat plants need for obtaining light compared to soilresources. In lakes, systems under strong N limitationoften become dominated by large, inedible species ofcyanobacteria, whereas P or Fe limitation produces sys-tems of very different structure and dominance by verymuch smaller cells; other trophic-level effects followfrom these. Community and ecosystem structure andfunction are strongly controlled by the identity of the

July 2004 1815METABOLIC THEORY OF ECOLOGY
Forum
limiting resources. The saturating functions of biomassand productivity alluded to in the previous paragraphare probably caused by shifts in the identity of limitingsubstances when one of them becomes very abundant.Lessons can be learned from dynamic consumer–re-source models. A larger number of potentially limitingsubstances opens up opportunities for coexistence (Til-man 1982), a theoretical prediction recently elegantlyshown empirically by Interlandi and Kilham (2001).When the number of resources increases from one toonly three, entirely new, complex dynamics are pos-sible (Huisman and Weissing 2001). For another ex-ample, several of my co-workers and I have done workat a variety of time and space scales on light gradientswhere the fixed stoichiometry of a simple, single-spe-cies population of herbivores creates positive relation-ships between primary and secondary productivity inone range of the experiment, but negative relationshipsin the other range (Urabe and Sterner 1996, Sterner etal. 1998, Urabe et al. 2002). At low light levels, bothprimary and secondary production are energy limited,whereas at high light levels, herbivores switch to ma-terial (phosphorus, we believe) limitation. These kindsof shifts—driven by element linkage, not in spite ofelement linkage, as a casual reading of Brown et al.might imply—are a signal that the identity of resourcesdoes matter a great deal; it will not generally work toboil them all down to a single, univariate measure. Ihypothesize that for most ‘‘X,’’ it does matter whetherthe limiting resource is light, or nitrogen, or iron, orsome combination of all of these.
Furthermore, for many important ecological ques-tions, assumptions of fixed stoichiometry simply breakdown. Plants have different composition than animals,for example, and even within species, differing growthrates are associated with different chemical contents(Elser et al. 2003). Organisms do link the rates of up-take and use of separate resources, but in an adaptive,flexible way that responds to shifting stoichiometricratios. Note, for example, the very different fluxes ofC, N, and P in metabolic networks under different lim-iting factors in the study of Dauner et al. (2001). Towhat extent does the set of all possible resources con-tain redundant information, so that the set can be col-lapsed to a univariate measure? The claim by Brownet al. (2004) that one can overlook the multiplicity oflimiting resources because they are all linked together,and are all linked to a single universal currency ofenergy is an echo of a previous era in ecology, wherebioenergetics was the hoped-for organizing concept(Slobodkin 1972, Morowitz 1992, Hairston and Hair-ston 1993). It was not, and we are beyond that.
Incorporation of materials into broad-scale macro-ecology models need not be distastefully complex, orso idiosyncratic as to resist all generality. I think thatthere is quite a bit more work to do and that ultimately,even at broad scale, we will almost always need a mul-tivariate, not a univariate, perspective on resources.
Biology has evolved fascinating responses to the op-timization problems that the shifting availability ofthese resources creates.
Again, so that this message is not lost: I’m a fan ofthe Brown et al. (2004) approach. Macroecology hasproduced a set of amazing, inspiring, and, I believe,also extremely useful microbes-to-monsters plots. Butmuch of the important work ahead of us in ecology isat finer spatial and temporal scale. I also believe it tobe the case that the utility of macroecology models willbe proportional to the scale of interest. Tools are mostuseful when applied to the right job.
ACKNOWLEDGMENTS
Among my colleagues who read and commented on thiscommentary, I want especially to thank Adam Kay, Bob Me-gard, and Dave Tilman, and, as usual, Jim Elser, for theirinsightful reading.
LITERATURE CITED
Brown, J. H., J. F. Gillooly, A. P. Allen, V. M. Savage, andG. B. West. 2004. Toward a metabolic theory of ecology.Ecology 85:1771–1789.
Dauner, M., T. Storni, and U. Sauer. 2001. Bacillus subtilismetabolism and energetics in carbon-limited and excess-carbon chemostat culture. Journal of Bacteriology 183:7308–7317.
DeAngelis, D. L. 1992. Dynamics of nutrient cycling andfood webs. Chapman and Hall, New York, New York, USA.
Elser, J. J., K. Acharya, M. Kyle, J. Cotner, W. Makino, T.Markow, T. Watts, S. Hobbie, W. Fagan, J. Schade, J. Hood,and R. W. Sterner. 2003. Growth rate: stoichiometry cou-plings in diverse biota. Ecology Letters 6:936–943.
Fell, D. 1997. Understanding the control of metabolism. Port-land Press, London, UK.
Hairston, N. G., Jr., and N. G. Hairston, Sr. 1993. Cause–effect relationships in energy flow, trophic structure, andinterspecific interactions. American Naturalist 142:379–411.
Huisman, J., and F. J. Weissing. 2001. Fundamental unpre-dictability in multispecies competition. American Natural-ist 157:488–494.
Interlandi, S., and S. S. Kilham. 2001. Limiting resourcesand the regulation of diversity in phytoplankton commu-nities. Ecology 82:1270–1282.
Johnson, F. H., H. Eyring, and B. J. Stover. 1974. The theoryof rate processes in biology and medicine. John Wiley, NewYork, New York, USA.
Morowitz, H. J. 1992. Beginnings of cellular life: metabolismrecapitulates biogenesis. Yale University Press, New Ha-ven, Connecticut, USA.
Oksanen, L., S. D. Fretwell, J. Arruda, and P. Niemala. 1981.Exploitation ecosystems in gradients of primary produc-tivity. American Naturalist 118:240–261.
Reiners, W. A. 1986. Complementary models for ecosystems.American Naturalist 127:59–73.
Rosenzweig, M. L. 1995. Species diversity in space and time.Cambridge University Press, Cambridge, UK.
Slobodkin, L. R. 1972. On the inconstancy of ecologicalefficiency and the form of ecological theories. Pages 293–305 in E. S. Deevey, editor. Growth by intussesception:ecological essays in honor of G. Evelyn Hutchinson. Trans-actions of the Connecticut Academy of Sciences, New Ha-ven, Connecticut, USA.
Sterner, R. W., J. Clasen, W. Lampert, and T. Weisse. 1998.Carbon : phosphorus stoichiometry and food chain pro-duction. Ecology Letters 1:146–150.

Forum
1816 METABOLIC THEORY OF ECOLOGY Ecology, Vol. 85, No. 7
Sterner, R. W., and J. J. Elser. 2002. Ecological stoichiom-etry: the biology of elements from molecules to the bio-sphere. Princeton University Press, Princeton, New Jersey,USA.
Tilman, D. 1982. Resource competition and communitystructure. Princeton University Press, Princeton, New Jer-sey, USA.
Urabe, J., M. Kyle, W. Makino, T. Yoshida, T. Andersen, andJ. J. Elser. 2002. Reduced light increases herbivore pro-duction due to stoichiometric effects of light : nutrient bal-ance. Ecology 83:619–627.
Urabe, J., and R. W. Sterner. 1996. Regulation of herbivoregrowth by the balance of light and nutrients. Proceedings ofthe National Academy of Sciences (USA) 93:8465–8469.
Ecology, 85(7), 2004, pp. 1816–1818q 2004 by the Ecological Society of America
COMMENTARY ON BROWN ET AL.’S ‘‘TOWARD A METABOLICTHEORY OF ECOLOGY’’
HENRY S. HORN1
Department of Ecology and Evolutionary Biology, Princeton University, Princeton, New Jersey 08544-1003 USA
What Brown has called ‘‘a metabolic theory of ecol-ogy’’ is powerful and exciting in scope, accomplish-ments, and promise, . . . and controversial in some ofits details. Let me confess that I am a spectator on thesidelines of the field, rather than an active player. In-deed, I am uncomfortable about commenting becausemost of my information comes from personal friend-ships with players on both sides of the controversialpart, and from privileged information in manuscriptsthat journal editors send me from a misinformed senseof my expertise. Accordingly, I shall take the easy paththat commentary offers, and make this a public state-ment of tentative thoughts rather than making any at-tempt at a scholarly piece. In particular, I shall cite asmall selection of papers deliberately construed to sup-port my points, rather than giving the literature thereview that it deserves. I hope that friends will remainfriends, and that editors will revise their impression ofmy wisdom.
It is hard to say enough about the excitement andinterpretive potential of a theory that unites the expla-nation of patterns of scaling from intracellular physi-ology to community dynamics, and that allows mea-surements throughout those scales to give useful ap-proximations of numbers needed to address global is-sues and to pose interesting evolutionary questions.Fortunately, the canonical proponents have done anexcellent job of advertisement, mostly in the pages ofScience and Nature, . . . and they have responded tothose of their critics who have also reached the samevenues. I cheerfully endorse most of what I have readthere. But there are still some important points thatleave me uneasy, along with students and colleaguesat home and abroad.
Manuscript received 13 November 2003. CorrespondingEditor: A. A. Agrawal. For reprints of this Forum (includingthe MacArthur Award paper), see footnote 1, p. 1790.
1 E-mail: [email protected]
The first point is the empirical question of whetherthe primary scaling factor is ⅔ or ¾, when for example,Fig. 1B of Brown et al. (2004), a log–log plot of nor-malized temperature-corrected metabolic rate againstbody mass, has a best-fit value of 0.71, . . . exactlymidway between ⅔ and ¾. This same point is mademore carefully and more forcefully by Dodds et al.(2001). The variety of contexts in which scaling factorsare modulo ¼ rather than modulo ⅓ is encouraging(Brown et al. 2004 and references therein), but it wouldbe worthwhile to review this literature to separate de-finitive tests from instances in which the ¾ scaling ofmetabolism with size entered as an assumption at theoutset.
There is also the semi-theoretical question of wheth-er there need be an ‘‘either–or’’ choice. The naıve ver-sion of the theoretical argument for exactly ⅔ assumesthat the fundamental organizing geometry of organismsis Euclidean and spherical; resources are acquired bysurfaces and used by volumes, but the distribution ofthese resources can complicate the analysis. The orig-inal argument for exactly ¾ assumes that the funda-mental geometry of organisms is fractal (West et al.1997). In the ¾ theory, resources are also acquired bysurfaces, but the theory explicitly and exactly opti-mizes a fractal network for distribution of these re-sources. Here I go into hazy analogical thinking, butit strikes me that different modalities of distributionand different shapes of organisms could favor the ap-plicability of different balances of the theories . . . anda scaling rule with power ¾, ⅔, or something in be-tween.
The third point is the paradox that the ¼-power scal-ing rule works so well over a range of sizes and shapesof organisms whose explicit resource-distributing net-works are variously fractal, tree-like but not fractal,and not even tree-like. This strongly suggests that thefractal assumption that lies at the heart of the devel-
July 2004 1817METABOLIC THEORY OF ECOLOGY
Forum
opment of the original version of the theory needs tobe replaced by a more general network. Such an ap-proach should explore explicitly how the cost and ef-ficiency of that network change with departures fromthe optimized fractal structure. Starts in this directionhave been made by the authors of the original theoryin its biological context (West et al. 1999, 2001), andby others (Banavar et al. 1999, 2002, Dodds et al. 2001,Gutierrez 2002), some of whom derive scaling rulesthat vary between ¾ power and ⅔ power. Particularexponents can also arise from mechanisms of compet-itive space-filling at the community level (e.g., Kinziget al. 1999), and it would be worthwhile to look forthem anywhere where resources flow through an arrayof tiny consumers that remove a fraction of what theyencounter (e.g., small leaves scattered through a bigtree [Horn 1971]; to pick an example only because Iknow the author). It is too early to make a generaliza-tion from this variety of ideas, but perhaps the networkof distribution need only be efficient and hierarchical,not just near-fractal, for exponents to be modulo ¼(West et al. 1999), or very near it (others cited pre-viously). Other modifications may come from biolog-ical variations in the dimensionality of the surface overwhich resources are acquired, and details of the metricof the volume over which they are distributed and used,. . . but I expect these to be small enough to contributemore to explaining residuals than to changing the av-erage scaling of attributes to body size.
The initial assumption of size-independent metabolicunits (West et al. 1997) has received little publishedcriticism, perhaps because most biologists can cite somany examples from their own specialties. According-ly, Brown et al.’s (2004) extension of the consequencesof this assumption to organism, population, and eco-system is novel, interesting, and powerful, independentof any arguable details.
Some would quibble about the possible role of mul-tiple normalization factors in fitting varied organismsto a common line on a graph, but it doesn’t bother me.As Brown et al. (2004) point out, the normalizationfactors are appropriate subjects for interpretation interms of specific biological attributes. Indeed, one ofthe great strengths of this metabolic theory is that ademonstrated allometry allows the all-pervasive effectof body size to be accounted for, so that residuals fromthe allometry may call for detailed biological interpre-tation. Alternatively, the residuals may provide datafrom organisms of different sizes to test theoreticalpredictions about such biological details. Brown et al.(2004) also point out that even after normalization theresiduals from some of their regressions span a 20-foldrange (and I read some of their figures as providing a50-fold range between extremes). That offers plenty ofopportunity for structural idiosyncracies and biologi-cally interesting details to ‘‘fine-tune’’ an average re-lationship that spans as much as 20 orders of magnitudein size. Brown et al. (2004) make this point over and
over again in a wide range of contexts, from physiologyto evolution and from cell to ecosystem.
Indeed this is what makes the whole enterprise of‘‘A Metabolic Theory of Ecology’’ so exciting andworthwhile. Brown et al. (2004) have derived an ex-traordinary range of interpretation and prediction from‘‘first principles.’’ The original framing of the first prin-ciples (West et al. 1997) engendered criticisms and sub-sequent modifications that made them less confining(West et al. 1999, 2001), and such improvements con-tinue. The extensions of the original theory to the pop-ulation and community levels have an internal bio-physical consistency, and strong empirical support thatstill allows enough variation to demand biological ex-planation. Furthermore, the theory may help in thesearch for that explanation.
Robert MacArthur would have been very pleasedwith Brown et al. (2004). He was always interested inpatterns at any scale from organism to community tobiogeography, and from ecology to evolution. He hada particular interest in how body size affected thosepatterns. He was a theoretician and a naturalist, witha conceptual brilliance when he combined the two.Here is how he might have viewed the controversy overdetails:
Ecological patterns, about which we construct the-ories, are only interesting if they are repeated. Theymay be repeated in space or in time, and they maybe repeated from species to species. A pattern whichhas all of these kinds of repetition is of special in-terest because of its generality, and yet these verygeneral events are only seen by ecologists with rath-er blurred vision. The very sharp-sighted always finddiscrepancies and are able to say that there is nogenerality, only a spectrum of special cases. Thisdiversity of outlook has proved useful in every sci-ence, but it is nowhere more marked than in ecology.
—MacArthur 1968:159.
LITERATURE CITED
Banavar, J. R., J. Damuth, A. Maritan, and A. Rinaldo. 2002.Supply–demand balance and metabolic scaling. Proceed-ings of the National Academy of Sciences (USA) 99:10506–10509.
Banavar, J. R., A. Maritan, and A. Rinaldo. 1999. Size andform in efficient transportation networks. Nature 399:130–132.
Brown, J. H., J. F. Gillooly, A. P. Allen, V. M. Savage, andG. B. West. 2004. Toward a metabolic theory of ecology.Ecology 85:1771–1789.
Dodds, P. S., D. H. Rothman, and J. S. Weitz. 2001. Re-examination of the ‘‘¾-law’’ of metabolism. Journal of The-oretical Biology 209:9–27.
Gutierrez, W. R. 2002. Volume integration of fractal distri-bution networks. Physical Review E 66:041906.
Horn, H. S. 1971. The adaptive geometry of trees. PrincetonUniversity Press, Princeton, New Jersey, USA.
Kinzig, A. P., S. A. Levin, J. Dushoff, and S. Pacala. 1999.Limiting similarity, species packing, and system stabilityfor hierarchical competition–colonization models. Ameri-can Naturalist 153:371–383.

Forum
1818 METABOLIC THEORY OF ECOLOGY Ecology, Vol. 85, No. 7
MacArthur, R. H. 1968. The theory of the niche. Pages 159–176 in R. C. Lewontin, editor. Population biology and evo-lution. Syracuse University Press, Syracuse, New York, USA.
West, G. B., J. H. Brown, and B. J. Enquist. 1997. A generalmodel for the origin of allometric scaling laws in biology.Science 276:122–126.
West, G. B., J. H. Brown, and B. J. Enquist. 1999. The fourthdimension of life: fractal geometry and allometric scalingof organisms. Science 284:1677–1679.
West, G. B., J. H. Brown, and B. J. Enquist. 2001. Ageneral model for ontogenetic growth. Nature 413:628–631.
Ecology, 85(7), 2004, pp. 1818–1821q 2004 by the Ecological Society of America
RESPONSE TO FORUM COMMENTARY ON‘‘TOWARD A METABOLIC THEORY OF ECOLOGY’’
JAMES H. BROWN,1,2 JAMES F. GILLOOLY,1 ANDREW P. ALLEN,1 VAN M. SAVAGE,2,3
AND GEOFFREY B. WEST2,3
1Department of Biology, University of New Mexico, Albuquerque, New Mexico 87131 USA2Santa Fe Institute, 1399 Hyde Park Road, Santa Fe, New Mexico 87501 USA
3Theoretical Division, MS B285, Los Alamos National Laboratory, Los Alamos, New Mexico 87545 USA
We welcome the opportunity to respond to the com-mentaries in this Special Feature. We are well awarethat this is not the last word. A full evaluation of themetabolic theory of ecology (MTE) will be renderedover time by the wider ecological community and willprobably take years. Here we address some general andspecific issues raised by the commentaries. The MTEis very much a work in progress—hence the ‘‘toward’’in the title of Brown et al. (2004). To facilitate progress,we try to clarify some of the controversial or at leaststill unresolved issues, rather than simply defend ourpaper.
We begin with some general points that emergedfrom several commentaries.
Is the exponent ⅔ or ¾?—The values of the allo-metric exponents for whole-organism metabolic rateand other biological rates and times are ultimately em-pirical questions. These questions have intrigued bi-ologists for about 70 years, ever since Kleiber (1932)measured the basal metabolic rates of mammals andbirds spanning a wide range of body masses, and foundthat the slope of his log–log plot was almost exactly¾. Extensive studies, culminating in several syntheticbooks on allometry in the 1980s, appeared to haveresolved the issue. These books unanimously conclud-ed that most allometric exponents were quarter powersrather than the third powers expected on the basis ofEuclidean geometric scaling (McMahon and Bonner1983, Peters 1983, Calder 1984, Schmidt-Nielsen1984).
The issue was reopened recently, in particular whenDodds et al. (2001) and White and Seymour (2003)analyzed data on basal metabolic rates of mammals and
Manuscript received 1 December 2003. CorrespondingEditor: A. A. Agrawal. For reprints of this Forum (includingthe MacArthur Award paper), see footnote 1, p. 1790.
birds and obtained exponents closer to ⅔ than ¾. Sav-age et al. (2004) have commented on these studies. Wesummarize only the two key points:
1) It is problematic to claim a definitive value basedon analyses of existing data on mammalian and avianbasal metabolic rates. The estimated exponent variesfrom ;0.65 to 0.85, depending on which measurementsand taxa are included, and which statistical proceduresare used.
2) Dodds et al. (2001) and White and Seymour (2003)compiled and analyzed data only on basal metabolicrates of mammals and birds. Savage et al. (2004) per-formed analyses of many additional data sets, includingbasal, field, and maximal whole-organism metabolicrates, and many other biological rates and times. Thedata included not just mammals and birds, but manyother taxa from both terrestrial and aquatic environ-ments. The variables ranged from cellular and molecularto whole-organism and population levels. The exponentsvaried, but showed distinct peaks and mean values atalmost exactly ¾ for whole-organism basal and fieldmetabolic rates, 2¼ for mass-specific metabolic ratesand many other biological rates (e.g., heart rates andpopulation growth rates), and ¼ for biological times(e.g., blood circulation times and gestation periods).
Based on this evidence, Savage et al. (2004) con-cluded that there is little justification for reopening theargument that biological allometries in general havethird-power exponents. Important additional evidencefor the pervasiveness of quarter-power exponentscomes from our recent research, which is based on newcompilations and analyses of published data. For ex-ample, refer to Figs. 2, 5, and 8 in Brown et al. (2004),which plot data for rates of whole-organism biomassproduction, maximal population growth (rmax), and eco-system carbon turnover across a wide range of body

July 2004 1819METABOLIC THEORY OF ECOLOGY
Forum
sizes, taxa, and environments. The exponents, 0.76,20.23, and 20.22, respectively, are very close to thepredicted values of ¾, 2¼, and 2¼, and the 95% con-fidence intervals do not include the Euclidean alter-natives of ⅔, 2⅓, and 2⅓.
What is the mechanistic basis for quarter-power ex-ponents?—The data on biological allometries are welldescribed by power laws, implying that they are theresult of self-similar or fractal-like processes. West etal. (1997, 1999a, b) developed general mechanisticmodels based on geometric and biophysical principlesthat explain the quarter-power exponents. These mod-els address the general problem of distributing meta-bolic resources within an organism and, more specif-ically, describe the structure and function of mammaland plant vascular systems. The models of West et al.hypothesize that the quarter-power scaling exponentsreflect the optimization of these transport networks dueto natural selection. Although the organisms them-selves are three-dimensional, an additional length var-iable is required to describe the branching networks,resulting in scaling exponents with 4, rather than theEuclidean 3, in the denominator. The structures anddynamics of resource distribution networks are hy-pothesized to be dominated by self-similar fractal-likebranching, although it is likely that some networks maybe ‘‘virtual’’ (e.g., within cells of prokaryotes) ratherthan ‘‘hard wired’’ (e.g., vascular systems of verte-brates and higher plants).
These models of West et al. have been criticized byseveral authors. Cyr and Walter (2004) cite most of thepublished critiques. West and collaborators are tryingto respond to the most serious criticisms, but this takesconsiderable effort and introduces inevitable time lags(see Brown et al. 1997, Enquist et al. 1999, West et al.2002; 2003a, b, in press, Allen et al. 2003, Brown etal. 2003, Gillooly et al. 2003). Several other responsesare still in press or unpublished. We will not addressthe criticisms here, except to state that we have yet tosee compelling theoretical or empirical evidence thatwould cause us to retract or substantially change themodels of West et al. Like the content and implicationsof the broader MTE, the rigor and realism of the modelsfor quarter-power scaling will be decided not by theparticipants in the immediate debates, but by the broad-er scientific community in the fullness of time.
What is a mechanism, and a mechanistic theory?—Several commentaries question the extent to whichMTE, as we have presented it, is truly mechanistic. Wehave three responses.
The first is that there is considerable variation in whatscientists consider to constitute a mechanism; one per-son’s mechanism is another’s empirical phenomenol-ogy. This is a long-standing problem. For example,physicists still don’t completely understand the mech-anistic basis of gravity, even though the force of gravitycan be characterized by analytical equations and usedas a first principle to make useful, accurate predictions
about everything from satellite orbits to biomechanicalproperties of bones. We freely admit that there is abun-dant room for additional research on mechanisms: from(1) how the kinetics of the multiple biochemical re-actions of metabolism determine the observed activa-tion energies at whole-organism and ecological levelsof organization; to (2) how the kinetics of species in-teraction, evolution, coevolution, speciation, and ex-tinction cause the observed temperature dependence inbiogeographic gradients of species diversity. We hopeother research groups will investigate some of themechanisms and we welcome all contributions to pro-ducing a more complete and mechanistic conceptualframework for MTE.
The second response is that mechanisms are de-scribed in much more detail in our other publications.Most equations in Brown et al. (2004) are the result ofmathematical models described in separate publica-tions. These models make explicit mechanistic con-nections between the metabolic processes of individualorganisms and their ecological and evolutionary con-sequences.
The third response is that empirical support for thesemodels and, in particular, for the predicted scalingswith size and temperature, suggests that metabolic rateis indeed the most fundamental biological rate, and thatits manifestations ramify to affect all levels of biolog-ical organization, from molecules to ecosystems. Datasources and statistical procedures are not described inBrown et al. (2004), but are documented in the originalpapers. It is important to recognize that the figures inBrown et al. (2004) are not just descriptive statisticalregression equations. Two points should be empha-sized: (1) theoretically predicted values for allometricexponents and activation energies, based on metabolicprocesses within individual organisms, are incorporat-ed directly into the analyses and into the plots of thedata; and (2) support for model predictions comes notonly from the high proportions of variation explainedby the regression equations (high values of r2), butmore importantly from the fact that 95% confidenceintervals for the slopes almost always include the pre-dicted allometric exponents and activation energies.
What about all the variation?—The authors of thecommentaries represent a wide spectrum of biologistsand ecologists, from those who seek unifying princi-ples, to those who emphasize diversity and complexity.Both approaches are valid—indeed both are requiredto keep the science focused, balanced, realistic, andprogressing. We are at one end of the spectrum, un-abashedly seeking unifying theory. For those who aremore concerned about the variation, we have threecomments.
First, the influence of metabolism on ecology is mostapparent when comparisons can be made across wideranges of body size and temperature, where the perva-sive influences of allometry and kinetics are strong.When body mass differs by only two- or threefold, or

Forum
1820 METABOLIC THEORY OF ECOLOGY Ecology, Vol. 85, No. 7
temperature varies by only a degree or two, other factorscan assume equal or greater importance. Many of thesefactors are outside the domain of metabolic theory. Forexample, allometry and kinetics are of little value inexplaining coexistence and species diversity of herbs inan old field or warblers in a forest, because there is littlevariation in both body size and temperature. In effect,these variables are ‘‘controlled’’ by the design of thestudy, thereby allowing other factors to be evaluated.Nevertheless, many systems studied by population andcommunity ecologists have sufficient variation in bodysize and temperature for metabolic theory to be directlyapplicable. For example, our model can explain ;90%of the variation in growth rates of zooplankton (Gilloolyet al. [2002]; see also egg-hatching rates in Brown etal. 2004: Fig. 3). The magnitudes of intra- and inter-specific variation in body mass and seasonal variationin environmental temperature make these results directlyrelevant to population and community dynamics of zoo-plankton in temperate lakes.
The second comment is that effects of allometry andkinetics on individual organisms and ecological sys-tems are powerful and pervasive. The very fact thatbody size and temperature account for most of the var-iation in log-scaled ‘‘microbe to monster’’ and ‘‘oceansto forests’’ plots is evidence that the allometry andkinetics of metabolic rate are fundamental to biologyand ecology. These processes are still operating evenwhen their influences may be obscured by variationdue to other processes. Suppose that we want to un-derstand the processes involved in secondary succes-sion from an old field to a forest. Then, the influenceof plant size on species interactions and ecosystem pro-cesses assumes major importance. Or suppose that wewant to predict the ecological consequences of a risein average environmental temperature by 28C. The ac-tual responses will undoubtedly be complicated by timelags, transient dynamics, initial species composition,effects of limiting material resources, and other vari-ables. Despite these sources of variation, however, met-abolic theory provides a good starting point: it predictsthat rates of individual-, population-, community-, andecosystem-level processes will increase as describedby the Boltzmann factor with an activation energy of0.6–0.7 eV (1 eV 5 96.49 kJ/mol).
The third point, also made in several commentaries,is that a theory soundly based on first principles, pro-vides a baseline—a point of departure—from which tounderstand the residual variation. Deviations from pre-dictions can be grouped loosely into four categories:(1) measurement errors or other biases in the data; (2)effects of factors not included in the model or theory;(3) exceptions that ‘‘prove the rule’’ by showing howviolating specific model assumptions leads to predict-able deviations; and (4) discrepancies that expose se-rious flaws in the assumptions or operations of the mod-el. Having a theoretically predicted baseline helps oneto evaluate these possibilities.
Specifics.—Most commentaries raise specific issuesthat warrant attention, but we address only two here.
First, Cyr and Walker (2004) extol the virtues of thedynamic energy budget (DEB) approach of Kooijman,Nisbet, and collaborators (e.g., Kooijman 2000, Nisbetet al. 2000). DEB models do indeed describe growthand reproduction of individuals in terms of metabolicprocesses and first principles of energy and materialbalance. And they do indeed incorporate more detail—many more variables and functions—than our delib-erately simple MTE. How much complexity in a modelis desirable or necessary is in part a matter of taste,and in part a matter of the purpose for which the modelis used. We view the DEB and MTE approaches ascomplementary. They make different trade-offs be-tween specificity and generality, and consequently havedifferent strengths, weaknesses, and applications.
Second, Sterner (2004) asks whether ‘‘one cardinalequation of macroecology, X 5 M 3/4e2E/kTR 1 error. . . ’’ with a ‘‘. . . single linear term in R is enough todo the job’’ (where R is the ‘‘amount’’ of some limitingmaterial resource). This is a straw man. We neverclaimed that this is the ‘‘one cardinal equation of ma-croecology.’’ We explicitly stated that many ecologicalphenomena, including macroecological species–areaand species–abundance relationships, are outside thepurview of MTE. We did not suggest that the unex-plained variation should be regarded as ‘‘error.’’ Weexplicitly noted that residual variation may be due todeterministic influences of stoichiometry, phylogeneticor functional group affinity, environment, and otherfactors that are not included in our models. We did notsay that resource limitation is due to a single reagentand is linear with respect to R and ‘‘organism nutrientcontent.’’ We do agree with Sterner that ‘‘there is quitea bit more work to do’’ on ecological stoichiometryand its relationship to energetics, and for this reasonwe deliberately omitted a term for resource abundancefrom our models (our Eqs. 4–8) for rates and times atthe individual organism level. We did include a linearterm, R, in our Eqs. 9–11 for abundance, biomass, andproductivity at the population to ecosystem levels.These models can be taken as testable hypotheses forthe effects of limiting material resources, together withbody size and temperature, on these ecological vari-ables. The chemical compositions of the fluxes andpools of material resources are central to organismalmetabolism and must be an essential ingredient of anycomplete MTE. Our earlier work has concentrated onallometry and kinetics. As indicated in Brown et al.(2004), we have begun to address many of the inter-relationships between energy and materials in both or-ganisms and ecosystems. A major research program ofSterner, Elser, and others has concentrated on ecolog-ical stoichiometry, and represents a major contribution(e.g., Elser et al. 2000, Sterner and Elser 2002). How-ever, we strongly disagree with Sterner that ‘‘we arebeyond that . . . previous era in ecology, where bio-

July 2004 1821METABOLIC THEORY OF ECOLOGY
Forum
energetics was the hoped for organizing concept.’’ Justchange the (our italics) to a. Energetics, updated, basedmore firmly on first principles, and interrelated to stoi-chiometry, is a powerful organizing concept for ecol-ogy.
We end by emphasizing that MTE is not intended tobe the theory of everything that is interesting and im-portant in ecology. Nor is it intended to account for allof the variation among living things and ecologicalsystems. Within its domain, however, MTE offersmechanistic explanations for linking many ecologicalpatterns and processes to biological, physical, andchemical constraints on individual organisms. MTEsuggests that underlying the diversity of living thingsand the complexity of ecological systems are funda-mental unities, some of which reflect how first prin-ciples of biology, physics, and chemistry govern thefluxes and pools of energy and materials within organ-isms and between organisms and their environments.
LITERATURE CITED
Allen, A. P., J. H. Brown, and J. F. Gillooly. 2003. Responseto Comment on ‘‘Global biodiversity, biochemical kinetics,and the energetic-equivalence rule.’’ Science 299:346.
Brown, J. H., A. P. Allen, and J. F. Gillooly. 2003. Heat andbiodiversity—Response. Science 299:512–513.
Brown, J. H., B. J. Enquist, and G. B. West. 1997. Allometricscaling laws in biology—Response. Science 278:372–373.
Brown, J. H., J. F. Gillooly, A. P. Allen, V. M. Savage, andG. B. West. 2004. Toward a metabolic theory of ecology.Ecology 85:1771–1789.
Calder, W. A. III. 1984. Size, function and life history. Har-vard University Press, Cambridge, Massachusetts, USA.
Cyr, H., and S. C. Walker. 2004. An illusion of mechanisticunderstanding. Ecology 85:1803–1805.
Dodds, P. S., D. H. Rothman, and J. S. Weitz. 2001. Re-examination of the ‘‘¾-law’’ of metabolism. Journal of The-oretical Biology 209:9–27.
Elser, J. J., R. W. Sterner, E. Gorokhova, W. F. Fagan, T. A.Markow, J. B. Cotner, J. F. Harrison, S. E. Hobbie, G. M.Odell, and L. J. Weider. 2000. Biological stoichiometryfrom genes to ecosystems. Ecology Letters 3:540–550.
Enquist, B. J., J. H. Brown, and G. B. West. 1999. Plantenergetics and population density—Reply. Nature 15:573–573.
Gillooly, J. F., E. L. Charnov, J. H. Brown, V. M. Savage,and G. B. West. 2002. Allometry: how reliable is the bi-ological time clock? Reply. Nature 424:270–270.
Kleiber, M. 1932. Body size and metabolism. Hilgardia 6:315–332.
Kooijman, S. A. L. M. 2000. Dynamic energy and mass bud-gets in biological systems. Cambridge University Press,Cambridge, UK.
McMahon, T. A., and J. T. Bonner. 1983. On size and life.Freeman Press, New York, New York, USA.
Nisbet, R. M., E. B. Muller, K. Lika, and S. A. L. M. Kooij-man. 2000. From molecules to ecosystems through dy-namic energy budget models. Journal of Animal Ecology69:913–926.
Peters, R. H. 1983. The ecological implications of body size.Cambridge University Press, Cambridge, UK.
Savage, V. M., J. F. Gillooly, W. H. Woodruff, G. B. West,A. P. Allen, B. J. Enquist, and J. H. Brown. 2004. Thepredominance of quarter-power scaling in biology. Func-tional Ecology, in press.
Schmidt-Nielsen, K. 1984. Scaling: why is animal size soimportant? Cambridge University Press, Cambridge, UK.
Sterner, R. W. 2004. A one-resource ‘‘stoichiometry’’? Ecol-ogy 85:1813–1816.
Sterner, R. W., and J. J. Elser. 2002. Ecological stoichiometry.Princeton University Press, Princeton, New Jersey, USA.
West, G. B., J. H. Brown, and B. J. Enquist. 1997. A generalmodel for the origin of allometric scaling laws in biology.Science 276:122–126.
West, G. B., J. H. Brown, and B. J. Enquist. 1999a. A generalmodel for the structure and allometry of plant vascularsystems. Nature 400:664–667.
West, G. B., J. H. Brown, and B. J. Enquist. 1999b. Thefourth dimension of life: fractal geometry and allometricscaling of organisms. Science 284:1677–1679.
West, G. B., J. H. Brown, and B. J. Enquist. In press. Growthmodels based on first principles or phenomenology? Func-tional Ecology.
West, G. B., B. J. Enquist, and J. H. Brown. 2002. Onto-genetic growth: modelling universality and scaling—reply.Nature 420:626–627.
West, G. B., V. M. Savage, J. F. Gillooly, B. J. Enquist, W.H. Woodruff, and J. H. Brown. 2003a. Why does metabolicrate scale with body size? Nature 421:713–713.
West, G. B., V. M. Savage, J. F. Gillooly, B. J. Enquist, W.H. Woodruff, and J. H. Brown. 2003b. Red herrings androtten fish. arXiv. ^http://arXiv.org/abs/physics/0211058&.
White, C. R., and R. S. Seymour. 2003. Mammalian basalmetabolic rate is proportional to body mass(⅔). Proceed-ings of the National Academy of Sciences (USA) 100:4046–4049.