Tourists Responses to Mobile Augmented Reality Travel ...
30
1 Tourists Responses to Mobile Augmented Reality Travel Guides: the Role of Emotions on Adoption Behavior Panos Kourouthanassis 1 , Konstantinos Boletsis 2 , Cleopatra Bardaki 3 , Dimitra Chasanidou 4 1 Department Informatics, Ionian University. 7 Tsirigoti Square, Corfu, Greece. Email: [email protected], Tel: +30 26610 87701, Fax: +30 26610 87766 2 Faculty of Computer Science and Media Technology, Gjøvik University College. Gjøvik, Norway. Email: [email protected], Tel: +47 61135498 3 Department Informatics, Ionian University. 7 Tsirigoti Square, Corfu, Greece. Email: [email protected], Tel: +30 26610 87701, Fax: +30 26610 87766 4 SINTEF ICT, Networked Systems and Services. Forskningsveien 1, Oslo, Norway. Email: [email protected], Tel: +47 22067621 Abstract This research presents a mobile augmented reality (MAR) travel guide, named CorfuAR, which supports personalized recommendations. We report the development process and devise a theoretical model that explores the adoption of MAR applications through their emotional impact. A field study on Corfu visitors (n=105) shows that the functional properties of CorfuAR evoke feelings of pleasure and arousal, which, in turn, influence the behavioral intention of using it. This is the first study that empirically validates the relation between functional system properties, user emotions, and adoption behavior. The paper discusses also the theoretical and managerial implications of our study. Keywords: Mobile augmented reality; tourist guide; personalization; adoption study; emotional design *Manuscript Click here to view linked References Costas Author-created version of: Panos Kourouthanassis, Costas Boletsis, Cleopatra Bardaki, Dimitra Chasanidou "Tourists responses to mobile augmented reality travel guides: The role of emotions on adoption behavior". Pervasive and Mobile Computing 2014; Elsevier. The final publication is available at: http://www.sciencedirect.com/science/article/pii/S1574119214001527
Transcript of Tourists Responses to Mobile Augmented Reality Travel ...
1
Tourists Responses to Mobile Augmented Reality Travel Guides: the Role
of Emotions on Adoption Behavior
Panos Kourouthanassis1, Konstantinos Boletsis
2, Cleopatra Bardaki
3, Dimitra Chasanidou
4
1Department Informatics, Ionian University. 7 Tsirigoti Square, Corfu, Greece. Email:
[email protected], Tel: +30 26610 87701, Fax: +30 26610 87766
2Faculty of Computer Science and Media Technology, Gjøvik University College. Gjøvik,
Norway. Email: [email protected], Tel: +47 61135498
3 Department Informatics, Ionian University. 7 Tsirigoti Square, Corfu, Greece. Email:
[email protected], Tel: +30 26610 87701, Fax: +30 26610 87766
4SINTEF ICT, Networked Systems and Services. Forskningsveien 1, Oslo, Norway. Email:
[email protected], Tel: +47 22067621
Abstract
This research presents a mobile augmented reality (MAR) travel guide, named CorfuAR, which
supports personalized recommendations. We report the development process and devise a theoretical
model that explores the adoption of MAR applications through their emotional impact. A field study
on Corfu visitors (n=105) shows that the functional properties of CorfuAR evoke feelings of pleasure
and arousal, which, in turn, influence the behavioral intention of using it. This is the first study that
empirically validates the relation between functional system properties, user emotions, and adoption
behavior. The paper discusses also the theoretical and managerial implications of our study.
Keywords: Mobile augmented reality; tourist guide; personalization; adoption study; emotional
design
*Manuscript
Click here to view linked References
Costas
Author-created version of: Panos Kourouthanassis, Costas Boletsis, Cleopatra Bardaki, Dimitra Chasanidou"Tourists responses to mobile augmented reality travel guides: The role of emotions on adoption behavior". Pervasive and Mobile Computing 2014; Elsevier.The final publication is available at: http://www.sciencedirect.com/science/article/pii/S1574119214001527

2
Tourists Responses to Mobile Augmented Reality Travel Guides: the Role
of Emotions on Adoption Behavior
1. Introduction
Mobile and wireless technologies enable the provision of novel applications that support visitors while
on the move. Such applications include mobile travel guides [1,2] and location-based infotainment
services [e.g. GIS-based recommendations [3,1], annotation and bookmarking [4], and mobile social
networking [5] to name but a few popular application types]. In essence, these applications allow
tourists to have seamless and ubiquitous access to travel-related information during their visiting
experience, which is presented in a multimedia-rich way. At the same time, location sensing
capabilities of mobile devices facilitate filtering of the travel information in order to be tailored to the
travelers‘ needs and wants. The value of mobile travel solutions capitalizes on the properties of leisure
and travel; they both concern intangible goods that are highly experiential and might be consumed on
an ad-hoc basis. Therefore, efficient organization and travelers-tailored presentation of travel-related
information is of paramount importance for both tourists and tourism industry stakeholders.
Considering the above, it is not surprising that mobile travel-related applications have received
scholars‘ attention from both an academic and practical perspective. Topics of interest include
approaches and methods to design and implement mobile travel systems and services [1,6-8], user
adoption studies [9-11,2]; and business model formulation [12]. An underlying commonality among
the different research themes refers to the design scope of such applications. Mobile guides involve
users to be situated in the surrounding environment of a built place [13,14]. Nevertheless, the design
of mobile guides assumes that the built place will fit the mobile device; people, places, and any point
of interest (POI) are encoded in digital maps or context-aware notifications. Hence, the design focus of
mobile guides lies on one principle; developing digital metaphors of the real-world that assist travelers
in covering their information needs while on the move.
Mobile augmented reality (MAR) follows a different design paradigm. Instead of developing a virtual
incarnation of the real world, MAR augments the real world with digital information. As such, the
design canvas is expanded from the limited space of the mobile phone to also include the physical
properties of the built world. MAR is a relatively new technology that offers new affordances for
interaction. In essence, MAR promises to enhance user experience by superimposing digital objects or
content over the surroundings of the real world [15]. Whilst early research focused on resolving the
technical challenges of MAR [16-19] and demonstrating its application potential in several settings
[20-23], few studies associate the value of MAR with the domains of travel and tourism [24-27].
This study attempts to shed light on the potential of MAR for supporting mobile tourism applications.
We present CorfuAR, a mobile augmented reality tour guide, which supports personalized content

3
provision and navigation features to tourists on the move. We describe the development efforts of our
MAR travel guide and emphasize on building the users‘ profile for the personalized version based on
static, pre-discovered activity preferences of users and tracking of their actual behavior. Moreover, we
report evidence of an adoption study that assessed the users‘ intention to use CorfuAR not only in
accordance with their perceived performance and usability, but also the emotional impact of the MAR
prototype by employing Mehrabian and Russell‘s [28] PAD theory. The field study revealed the
design choices of MAR travel guides that lead to increased user satisfaction and usage intention. All in
all, we aspire to provide help to prospective designers and developers to engineer MAR tourism
applications.
The paper is organized as follows. Section 2 discusses the functionality of mobile travel guides, the
properties of mobile augmented reality applications and the potential for MAR in tourism. Section 3
outlines the functionality and architecture of CorfuAR. Section 4 emphasizes on the personalized
version of the mobile augmented reality tourist guide. Section 5 details the methodology and results of
the field study that we performed in order to assess the performance, usability and experiential impact
of CorfuAR. Finally, we conclude the paper with a critical discussion on the academic and practical
implications of our research pertaining the development and evaluation of mobile augmented reality
tourism applications.
2. Background
2.1. Mobile Travel Guides
Mobile travel guides have been the subject of scrutiny over the past years by academic scholars.
Emphasis has been paid primarily to the identification of their architectural, technological and
functional properties [1,29,30]. Consolidating their findings, mobile travel guides provide partially or
fully four types of functionality: navigation services, content-based services, social and
communication services, and commercial services.
The main concern of navigation services is routing users from their current location to a preferred
point of interest (POI) by usually displaying a map of the surrounding area [31]. Content-based
services refer to the provision of travel or POI related information. Specifically, these may include
personalization features that filter and adapt the visualized content according to users‘ current context
and profile [8,32]. Also, such services may incorporate search facilities to locate and receive
information regarding places, topics, or exhibits of interest [33]; and bookmarking which allows users
to add locations to an ad-hoc generated itinerary in order to better plan, manage, and share their leisure
experience [34].
Social and communication services support liaison between the travelers and the accommodation
providers, exhibition owners and other stakeholders involved in service provision [35,12]. Moreover,

4
they enable sharing of tourists‘ experiences through a variety of websites (Facebook, Twitter,
TripAdvisor, Blogger, and many other popular online social networks); and in different ways, ranging
from posting their stories, their comments, to even their pictures and movie clips [36,5]. It should be
noted that recently, social media have emerged as a substantial part of the online tourism domain [37].
Finally, commercial services support mobile purchases and reservations of tourism-related products
[38,39].
These functional properties of mobile travel guides follow a common user experience metaphor.
Instead of reinforcing the relationship of the travelers with the physical surroundings, these guides
develop a simulated environment where individuals are required to be immersed in for requesting and
receiving digital content and information. On the contrary, mobile augmented reality aims at shifting
the attention of individuals back to the real world, not its digital incarnation. The following
subsections discuss the characteristics of MAR technology that justify the growing` interest in MAR-
enhanced travel and tourist services and applications.
2.2. Mobile Augmented Reality (MAR)
The concept of MAR was developed around the mid-1990s, applying Augmented Reality (AR) in
mobile settings. Rather than trying to create an entirely simulated environment, MAR starts with
reality itself and then augments it by overlaying digital information on top of the real world. The
novelty of MAR relies on its usability aspect; it enhances the traditional user experience while
interacting with a mobile device [40].
Using a display, such as a mobile phone or a tablet, users may see a live view of the world surrounding
them, augmented with digital annotations, graphics and other information superimposed upon it. The
user points the device in the direction of an item of interest and the system augments the output with
additional information about the environment. The extra information varies from names of buildings
visible on a city skyline, or information related to the points of interest; to real-time notifications
regarding location or time dependent events (e.g. menu discounts in restaurants).
As such, the properties of MAR-enhanced systems rely on augmented reality principles: they combine
real and virtual objects in a real environment; they run interactively, and in real time; and they register
real and virtual objects with each other [41]. Likewise, MAR minimizes task-switching by promoting
continuous use and reducing distractions [42]. As such, it is not surprising that industrial scholars have
decided to capitalize on MAR experiential features and devise new mobile-based, enhanced
interaction means. For example, Google Glass [i.e. a wearable AR head-mounted display (HMD)]
augments users‘ visual perception of their world by adding layers of virtual information on top of it.
The same principles apply to audio information that complements users‘ audio perception of the
world. In the same spirit, it is widely believed that AR technologies are maturing and become well
established; this fact favors the broad implementation of AR applications within the next ten years

5
[43]. Respectively, the recent advances in mobile computing hardware and software, but specifically
the proliferation of smart mobile phones, seem to pave the way for mass, faster adoption of mobile
augmented reality applications [44-46]. Recent introductions of publicly available MAR development
platforms (e.g. Layar, Wikitude and Junaio) confirm the growing interest in MAR systems and
services, as well as support the implementation of such applications.
In agreement with industry, academia foresees an enormous potential for MAR technology;
researchers have acknowledged that the combination of mobile and AR features presents unique
opportunities for the deployment of novel applications in diverse contexts. In fact, MAR has been
employed to support students learning [47,48,20], university campus touring [49], library services
[50], architectural design [51], smart home environments [52]; and phobias treatment [53] to name but
a few application domains.
2.3. MAR Applications: the potential for MAR in tourism
The emergence of MAR has given the opportunity to tourism organizations and destinations to provide
a large amount of relevant tourist information in a different form than simply checking online sources
or travel guides, thus enhancing the overall tourism experience [54-56,44]. In a nutshell, from a
business standpoint, MAR can influence the marketing of travel destinations and reach more
customers by enhancing their travel experiences.
Specifically, MAR systems are ideal tools for guiding tourists through unfamiliar environments and
providing useful information about them. Navigation and way finding was one of the first application
areas for MAR and still remains the most widely used feature in prototypes and commercial tourism-
related applications [30]. But we should emphasize that augmented displays have the potential to
reduce the mental effort required for navigation, as well as provide to travellers with an opportunity to
discover unknown surroundings through visual, audio and 3D location-based information [55]. MAR
can show virtual paths and directional arrows to facilitate navigation (e.g. Nearest Tube application),
deliver augmented and interactive information regarding dining, museums, entertainment et al.
(examples of such applications include mTrip, Tuscany+, and MobiAR), as well as provide real-time
immediate translation of written text on signs, menus et al. (e.g. Word Lens) [57].
Moreover, AR systems can help tourists to re-live historic life and events by reviving ancient temples
and historic buildings as 3D objects, which are placed on the actual monument. The first cultural
heritage site that benefited from an augmented virtual reconstruction of an ancient temple was
Olympia in Greece, where researchers developed the ArcheoGuide AR system [58].
Further, in terms of motivating and engaging tourists, thus enhancing the overall tourism experience,
AR applications have the strengths of developing enjoyable holiday trips through the integration of
AR gaming (e.g. TimeWarp [59]). These applications provide opportunities for tourists to become
familiar with unknown areas in an enjoyable and educational manner.

6
MAR applications may also assist destination-marketing organizations to gain competitive advantage
through the use of advanced information technologies [60]. A significant characteristic of MAR,
which differentiates it from other context-aware systems and mostly contributes to enhancing the
tourist experience, is its innovative technological character, which engages and impresses the user.
This element of MAR functionality provides applications that follow MAR design principles with
advanced marketing-related capabilities, which - when applied correctly – can lead to strong
destination branding and reaching more tourists. An example of a destination that aims to enhance the
overall tourist experience using AR is Dublin, with the Dublin AR project [60]. The use of AR in
Dublin originated from the idea to support Dublin‘s brand development of ―innovative city‖ in
Europe. During this project, they developed a mobile AR application for the tourism industry, which
will be applied via tourist trails in various parts of the destination by considering various tourism
stakeholders.
Even though literature contains several frameworks and principles surrounding the design of MAR
(e.g. [61,57]), such works highlight the need of examining MAR development from a user-centered
point of view, i.e. developing sample MAR applications, evaluating their use acceptance and
experiential qualities and, finally, fleshing good design practices for further use and improvement.
Naturally, the development process should be described in full detail for research repeatability
purposes. This study presents the development of a MAR tourist guide for the principal city of Corfu
island in Greece. The ultimate purpose is to report evidence and provide the first insights regarding the
design of MAR applications for tourism and the visitors‘ intention to adopt such MAR services,
through a field study. As a research sub-question, the work goes one step beyond usability by
exploring the experiential impact and the stimulation of emotions from the use of the developed MAR
travel guide.
3. CorfuAR: a Mobile Augmented Reality Travel Guide Supporting
Personalized Recommendations
3.1. System overview
CorfuAR is a high fidelity prototype of a MAR tour guide for the principal city of Corfu island in
Greece, which is also named Corfu. The guide is available for Android devices in two versions: a
personalized and a non-personalized one. Generally, the system provides the basic functionality of a
mobile travel guide, namely displaying information about points of interest (POI), routing to selected
locations; as well as social media features (i.e. recommendation of POIs to other peers of the same
cluster). Moreover, the personalized version recommends specific points of interest to the system users
based on a combination of pre-discovered and real-time, dynamically updated preferences. User
preferences and segmentation have been extrapolated based on a technique recommended by the
World Tourism Organization.

7
3.2. Functionality
Initially, the application welcomes the user and presents the available options (figure 1). Users may
select the non-personalized version of CorfuAR, in which all content is available without any means of
filtering or aggregation. Alternatively, users may prefer the personalized CorfuAR, in which content is
automatically filtered based on user profile and contextual data. It should be noted that this option is
offered only the first time the user interacts with the system. In all future usage interactions, the guide
proceeds with the initial user preference; users may change their selection through a respective option
in the welcome menu.
Fig 1 The homepage of CorfuAR mobile augmented reality application
CorfuAR supports nine categories of POIs (figure 2). The personalized version of the application
contains all the content of the non-personalized version (approximately 90 POIs); however it
visualizes the filtered, recommended POIs in a different way, through colors, in order to easily notify
the user about recommended content in his/her surroundings. Thus, no content is excluded in the
personalized version; on the contrary, the relevant information is highlighted.
The size of each POI‘s icon is dynamically changing according to the distance of users from that POI.
The larger the icon, the closer the user is to the POI (figure 3). All POIs are displayed as grey 2D
icons, apart from the personalized ones that are displayed as colored 2D icons. We use three different
colors (red, green and blue) corresponding to three users‘ groups with common preferences produced
by the users‘ segmentation process described in section 4.
Naturally, marker-based and geo-based AR is prone to the ―occlusion problem‖; the real world (e.g.
the user‘s hand) or the AR contents itself (e.g. an AR object) may visually cover the AR content that is
being displayed, thus the user can lose valuable information [54,57]. The CorfuAR application is no
8
exception; indeed, the possibility of a close large POI icon that covers a smaller one of a distant POI
exists. However, we took any measure technologically possible to provide to the user extra options
that solve the occlusion problem. The user can see all the POIs in list view or on a map (using Google
Maps). Alternatively, the user can set a distance filter, excluding POIs that are very far away and may
cause extra ―noise‖. The default value for the distance filter is 500 meters.
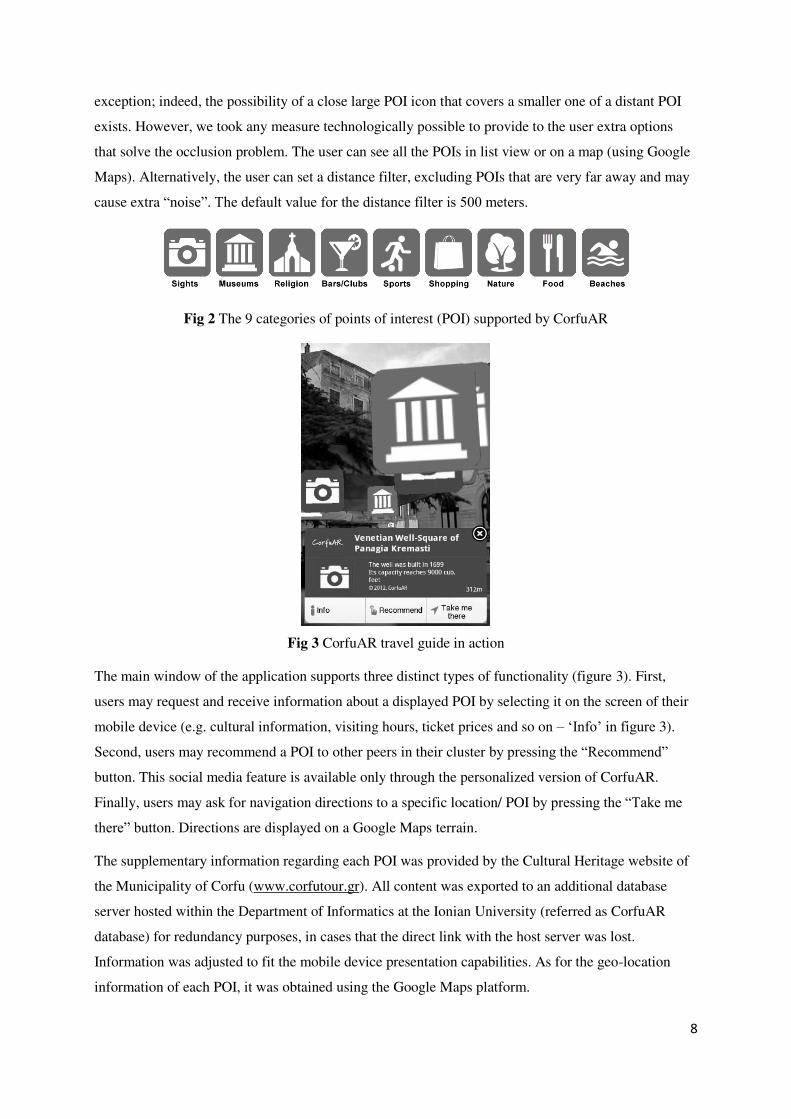
Fig 2 The 9 categories of points of interest (POI) supported by CorfuAR
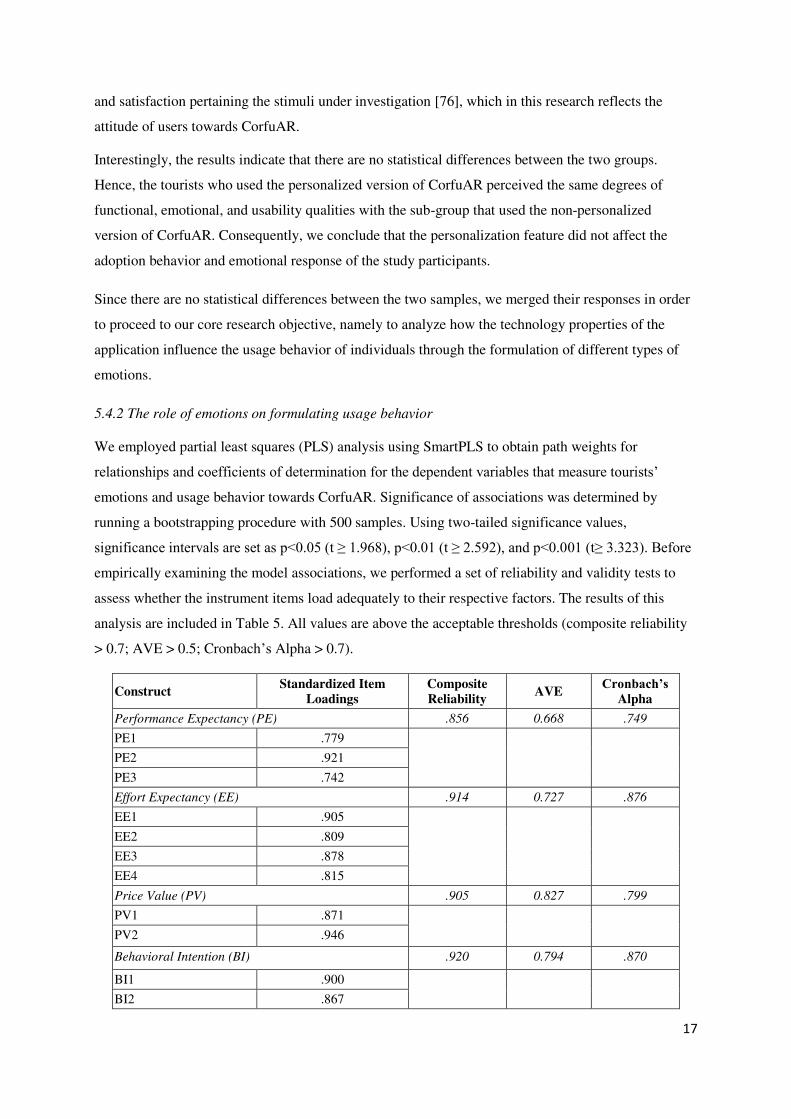
Fig 3 CorfuAR travel guide in action
The main window of the application supports three distinct types of functionality (figure 3). First,
users may request and receive information about a displayed POI by selecting it on the screen of their
mobile device (e.g. cultural information, visiting hours, ticket prices and so on – ‗Info‘ in figure 3).
Second, users may recommend a POI to other peers in their cluster by pressing the ―Recommend‖
button. This social media feature is available only through the personalized version of CorfuAR.
Finally, users may ask for navigation directions to a specific location/ POI by pressing the ―Take me
there‖ button. Directions are displayed on a Google Maps terrain.
The supplementary information regarding each POI was provided by the Cultural Heritage website of
the Municipality of Corfu (www.corfutour.gr). All content was exported to an additional database
server hosted within the Department of Informatics at the Ionian University (referred as CorfuAR
database) for redundancy purposes, in cases that the direct link with the host server was lost.
Information was adjusted to fit the mobile device presentation capabilities. As for the geo-location
information of each POI, it was obtained using the Google Maps platform.

9
3.3. Architecture
The CorfuAR application was implemented using the Layar platform and is available for Android
devices. Layar is an AR browser, which adds ―layers‖ of AR content on top of the real worldview.
CorfuAR is developed as a ―layer‖ of Layar, utilizing the functionality and the high quality features of
this platform.
According to the system architecture (figure 4), when the users open the CorfuAR application, they
have to choose between the two versions: personalized and non-personalized (getVersion in figure 4).
Then, in case the users have selected the personalized version, they fill the clustering questionnaire for
the personalized version, which is implemented in PHP scripting language and is hosted in the
CorfuAR server. Following the initial categorization of application users into one cluster, CorfuAR
opens one of the 4 respective versions (basic, blue, red, or green) and initiates communication with the
Layar Platform. The CorfuAR Client sends a getPOIs request to the Layar Platform, which, in turn,
forwards the request to the CorfuAR Service Provider (requestPOIs in figure 4). Then, the CorfuAR
Service Provider sends the augmented reality content back to the Layar Platform (getPOIs in figure 4).
Finally, the Layar Platform validates the getPOIs response and passes it to the CorfuAR Client
(getPOIs in figure 4), which visualizes the content to the mobile device.
A very important element of CorfuAR‘s architecture is the CorfuAR database, which consists of 4
tables corresponding to the versions of CorfuAR. Each CorfuAR database table contains – amongst
the Layar-related ID information – all the POIs‘ GPS coordination (longitude, latitude, altitude), the
2D icons of each cluster and a direct link to the information content providers. The cultural
information of each POI is also stored in the CorfuAR database (respecting the terms and conditions of
the source for copying and distributing the material), to ensure the availability of the information even
if the original source/webpage is down (requestEduInfo and getEduInfo in figure 4).
Finally, the personalization feature of CorfuAR is implemented following a two rounds algorithm.
During the first round, the application identifies in which cluster users belong to, based on their
responses in the clustering questionnaire. Users may save their preferences for all future usage
sessions, but they can also modify them should they desire to switch from one personalization layer to
another. Respectively, the second round of the algorithm takes into account the number of
‗Recommendations‘ of each POI and the total number of visits that each POI received from other users
of the same cluster. The first 15 POIs with the highest count (popularity) are automatically displayed
as colored 2D icons (blue, red or green according to the cluster) since they are the recommended ones,
whereas all the other POIs (90-15=75) are displayed keeping the ―basic‖ grey icon (requestIcons and
getIcons in figure 4). This algorithm that enables personalization in CorfuAR is further analyzed in
Section 4.

10
Fig 4 The architecture of CorfuAR
4. The Personalized Version of CorfuAR: Discovery and Evolution of
Users Preferences
Personalizing the information provision might prove to be an important element in the design of
mobile augmented reality applications in order to minimize risks of information overload [16]. In this
research, we embellished the CorfuAR system with personalization capabilities by developing a
filtering tool that automatically selects and presents to the users the content that matches their
preferences. Naturally, the discovery of the users‘ preferences and the subsequent users clustering are
prerequisite to the application of this filtering tool. The filtering tool presents the application content
that we have pre-allocated to each cluster (users‘ profile).
Actually, we employed the tourists‘ segmentation practice of the World Tourism Organization in order
to cluster the users and, thus, to provide the personalized content. In the mid-90s, the Irish National
Tourism Organization applied a tourist management plan based on categorization of tourists according
to their activities when in Ireland. The same technique of classifying the visitors was officially adopted
by the World Tourism Organization under the name ―activity segmentation‖. This technique is
implemented based on an activities-related questionnaire, where tourists choose the activities
appealing to them during their stay [62].
Activity segmentation captures the activities range of tourists while they visit a destination. The
tourism industry can take advantage of this method to discover and define new discrete market
segments corresponding to activities groups, as well as document the activities and examine the
visitors‘ level of satisfaction. Each activity is documented through qualitative and quantitative
research, so as to separate opportunistic activities from activities than define market segments. Hence,
the long-term benefit is the design and provision of products and services that really cover the tourist
needs or the evaluation and improvement of the existing ones.

11
We applied the ―activity segmentation‖ technique to cluster the CorfuAR users because activities,
which can define discrete market segments, are those that are supported by facilities, locations, and
services in various places. Even though activities are not the main reason for visiting a place, they can
be an important part of the overall tourist experience [63]. Therefore, the categorization and tracking
of tourist activities could be seen as an essential and investigative guide, in order to preserve, and
improve the experiential performance of destinations. The more the tourism industry knows about the
behavior of the average tourist, the more capable it is to provide a satisfactory plan to him [64].
Specifically for CorfuAR, we used nine activity categories to segment the Corfu tourists into three
clusters, namely three user‘s profiles. Three categories of activities were assigned to each cluster (see
table 1). Users are instructed to fill the questionnaire with those activities during their first interaction
with the application (see figure 5). The results of the questionnaire-based segmentation process assign
each user to one of the three clusters. We adopted this number of clusters based on extant
segmentation studies in tourism journals (e.g. [65-67]), which indicate that tourists may be classified
in three broad clusters based on their activities: thematic-based (i.e. business, religious etc.),
entertainment-based (i.e., shopping, night-life), and action-driven tourism (i.e. sports, tripping etc.). In
CorfuAR, the blue cluster represents thematic-driven tourists; the red and the green cluster represent
entertainment-driven tourists and action-driven tourists, respectively.
Users’ cluster (profile) Activity
Blue
Business (seminars, conferences, business meetings)
Culture (monuments, sights, arts, history, museums, architecture)
Religion (churches, monastic sites, temples, holy shrines)
Red
Shopping (clothing stores, souvenirs, hobbies, gifts)
Nightlife (bars, clubs, events, meeting people)
Gastronomy (food, restaurants, tavernas)
Green
Nature Study (nature reserves, bird watching, wild life)
Tripping (walking, exploration, tripping, hiking)
Water sports (boating, surfing, waterskiing, sailing)
Table 1 Activities assigned to the three users‘ clusters (profiles)
Ultimately, the personalized version of CorfuAR displays the personalized POIs to the user as red,
blue or green icons according to the user‘s predefined profile. Nevertheless, we put an effort to
accomplish real-time update of the pre-discovered users‘ preferences and assignment to one of the
three clusters. In effect, we utilize a two-fold approach to explore and interpret the users‘ behavior
during their visit in Corfu. First, we apply a Google Analytics tracking code to every webpage with
POI-related content. Thus, we have the opportunity to find out those POIs that caught the users‘
attention and they wanted to take additional information about them. Likewise, by tracking the GPS
data on a user‘s mobile device, we were able to infer when a user physically visited a POI that was
included in his recommended list of POIs and, also, increase the relevance of the POI with the cluster

12
each user belonged to. Based on this real-time captured information about the users‘ preferences, the
users‘ questionnaire-based assignment to one of the three clusters was either corroborated or updated.
Hence, the application supports real-time switching of tourists between different clusters. In effect, if
tourists systematically express interest about POIs that do not belong to their cluster (either by
requesting information about them or by physically visiting them) the application will eventually
switch them to the cluster that better grasps their travel needs.
Fig 5 Sample of the activity-related questionnaire for discovering the user‘s profile
5. Evaluation
After its first upload on Google Play online store on May 2012, CorfuAR has been uniquely
downloaded and installed 729 times. The research team has not undergone any marketing/ promotion
activities to reinforce the usage of CorfuAR, because the application comprises an academic effort and
its respective downloading and use is free of charge. To assess the performance, usability and
experiential impact of CorfuAR prototype, we performed a field study. In particular, visitors of Corfu
city were invited to download, install, and use the application during their stay. As a final request, the
participants of the field study were asked to fill in an evaluation questionnaire.
5.1. Users sampling
We used convenience sampling methodology to invite prospective users of CorfuAR travel guide. Our
sample pool consisted of individuals who would visit Corfu city for leisure or business activities, were
owners of Android devices and had experience in using mobile applications. In order to achieve the
heterogeneity of the sample, instead of just enlisting only academia-related participants, we turned into
the general population by enlisting individuals in the proximity in order to avoid bias and ensure the
credibility of the results. Invitations to Corfu visitors were extended randomly and for a period of two

13
weeks. The research team approached random groups of friends and/ or family members, verified that
they were owners of Android devices, and explained to them the objectives of the study. In case those
visitors were interested in participating to the study, they were prompted to download the application
to their mobile phone.
The study was executed twice, in August 2013 and June 2014. These months exhibit high activity in
the local tourism sector; therefore we consider them as appropriate to measure the effectiveness of the
developed application. In total, 105 tourists accepted our invitation to participate in our field study (33
during August 2013 and 72 during June 2014). Table 2 includes the sample demographics. The sample
comprised of almost equally distributed men and women. Furthermore, the majority of the participants
were educated (holders of a university degree) and over 26 years old. All participants had over six
years experience of using mobile applications.
Dimension Value Total (N) Percentage
Gender Male 52 49.6%
Female 53 50.4%
Age
19-25 28 26.7%
26-35 42 40%
36-50 28 26.7%
50+ 7 6.6%
Education
School graduate 15 14.2%
University graduate 45 42.9%
Post-graduate 45 42.9%
Table 2 Sample demographics
5.2. Methodology
Initially, the research team explained the objectives of the study to randomly approached groups of
tourists. Should the approached individuals expressed interest to participate to the study; they were
directed to the Google Play store to download the CorfuAR application to their mobile phone.
Subsequently, they were asked to use the system as a guiding tool during their visit to Corfu. The
participants used their own Android devices, in order for us to capture the effect of the hardware
heterogeneity (hardware performance and how that affects the overall experience), as well as to
exclude any ―wow effect‖ that introducing a new device to the participants could cause and,
potentially, skew the experiential results. Along this line, participants were free to use between the
personalized and non-personalized version of the application. Before ending their visit to Corfu,
participants were asked to fill in an evaluation questionnaire. Each questionnaire was associated with
the corresponding version of the application, based on the users‘ preferences in the home menu.
The study had a two-fold objective. First, we opted to evaluate the perceived adoption behavior of
individuals towards CorfuAR. To this end, we employed established factors from extant technology
adoption theories and environmental psychology to measure the performance, usability, emotional

14
stimulus, and usage behavior of the application. Specifically, driven by the experiential qualities of
mobile augmented reality [40], we explored the underlying process whereby the technological
attributes of CorfuAR influence the usage behavior of the application through the formulation of
different types of emotions. Second, we sought for differences between individuals using the
personalized version of the application and ones using the non-personalized version on the selected
user adoption and emotional factors.
5.3. Instrument Development
The evaluation questionnaire enclosed measurement dimensions that have been validated in past
information systems studies. To assess the adoption behavior of CorfuAR prototype users, we
employed factors from the second iteration of the Unified Theory of Acceptance and Use of
Technology, which is commonly referred to as UTAUT2 [68]. This framework has been originally
used to explain the adoption of mobile applications. Moreover, UTAUT2 has been utilized as a
guiding charter to explore the adoption of other application types, which are similar to CorfuAR, such
as virtual worlds [69] and multimedia heritage archive services [70].
Respectively, we measured emotions stimulation from the use of CorfuAR by employing Mehrabian
and Russell‘s [28] PAD theory, which has been primarily used to explain consumer behavior in
marketing studies [71,72]. According to this theory, all emotional responses to physical and social
stimuli can be captured on three affective states: pleasure, arousal, and dominance (PAD). Individual
positions against these emotional states may, in turn, express human affective reactions and,
consequently, influence behavior formulation. Recently, information systems scholars have articulated
PAD as a supportive basis to explain information technology adoption, usually in conjunction with
another established technology adoption theory [73]. In this spirit, we postulate that pinpointing the
emotional impact of the MAR application will be critical for understanding the degree of users
satisfaction, morale, or performance; and generally their adoption behavior. Finally, since MAR travel
applications are technological innovations for tourism, we measured the effect of participants‘
perceived innovativeness on the adoption of CorfuAR. Our consolidated framework, combining both
theories, is illustrated in Figure 6.
To bridge UTAUT2 and PAD, we employed the Stimulus-Organism-Response model (S-O-R) model,
which was originally developed by Mehrabian and Russell [28] and dictates that stimuli (e.g.,
performance of an information system) evoke individuals' emotional states, which in turn determine
behavioral responses. The framework has been validated in the context of high-technology products
[74], as in the case of MAR applications, therefore it constitutes a suitable core for our analysis.
Table 3 summarizes the measurement factors included in our evaluation instrument. Each factor was
captured by multiple items. We used a Likert scale anchored from 1 (completely disagree) to 7

15
(completely agree) to collect individual item scores. The detailed items of the questionnaire can be
found in the Appendix.
Fig 6 Research framework
Dimension Measurement
Factor Definition
# of
items Reference
CorfuAR
Attributes
Performance
expectancy
The degree to which using the application
will benefit users in their travel-related
activities.
3
Venkatesh et
al. [68] Effort expectancy The degree of usability associated with using
the application. 4
Continuance
Intention
Behavioral
Intention
The perceived intention to continue using the
application after the initial usage. 3
Emotional
States
Pleasure The degree to which the application evokes a
pleasant (or unpleasant) emotion to users. 6
Mehrabian
and Russell
[28]
Arousal The intensity degree of the pleasant or
unpleasant emotion. 6
Dominance The controlling and dominant nature of the
emotion. 6
Cognitive
Traits
Personal
Innovativeness
Individuals‘ propensity to experiment with new information technologies.
3 Agarwal and
Prasad [75]
Price value
Cognitive tradeoff between the perceived
benefits of the application and the cost of
using it (e.g. network usage).
2 Venkatesh et
al. [68]
Table 3 Instrument dimensions and definitions
5.4. Results
5.4.1 The effect of personalization on adoption behavior and emotional responses
Table 4 illustrates the consolidated results per evaluation factor. First, we report the average scores for
the full sample of respondents (N=105). Then, we distinguish scores between the samples that used the

16
personalized version of the application (N=69) and the non-personalized version (N=36) respectively,
because we are interested in the differences between them.
To probe for statistical differences between both groups, we performed an independent samples t-test,
the results of which are also included in Table 4. Out of the 69 individuals that used the personalized
version of the application, 24 were allocated under the blue cluster, 25 were allocated under the red
cluster and the remaining 20 were allocated under the green cluster. To preserve user privacy, we did
not associate each individual questionnaire with its corresponding cluster. Therefore, we cannot report
the demographics information of each cluster.
Evaluation factor Total AVG (Std)
(N=105)
Personalized Version
AVG (Std)
(N=69)
Non-Personalized
Version AVG (Std)
(N=36)
t-test results
(Personalized-Non-
Personalized)
Performance
expectancy
5.69 (.94) 5.68 (1.01) 5.71 (.832) -.187 (p=.852)
Effort expectancy 5.69 (1.02) 5.62 (1.09) 5.82 (.889) -.950 (p=.344)
Price value 6.43 (.84) 6.39 (.903) 6.52 (.705) -.789 (p=.432)
Behavioral
Intention
4.88 (1.23) 4.81 (1.25) 5.01 (1.21) -.812 (p=.418)
Pleasure 5.28 (1.03) 5.18 (1.13) 5.48 (.799) -1.435 (p=.154)
Arousal 4.42 (.82) 4.44 (.86) 4.40 (.751) .189 (p=.850)
Dominance 4.75 (1.01) 4.77 (1.01) 4.71 (.895) .300 (p=.765)
Personal
innovativeness
5.50 (1.21) 5.60 (1.20) 5.31 (1.21) 1.141 (p=.257)
Table 4 Descriptive Statistics of evaluation dimensions and comparison between personalized and
non-personalized version
Overall, participants favored the performance and usability of CorfuAR. Subjects appreciated the
usefulness of the application in terms of giving information about displayed points of interest and
providing navigation guidelines (mean score 5.69, SD .94). Likewise, they valued the ease of use that
mobile augmented reality introduces in the interaction elements of mobile guides (mean score: 5.69,
SD 1.02).
Furthermore, the study participants esteemed the application‘s value compared to its acquisition cost.
We treat these findings with caution, because we acknowledge that CorfuAR was offered free of
charge; users were only subject to indirect costs that, primarily, included 3G network usage.
Regarding usage behavior, the respondents expressed their overall willingness to use the system again
during their next visit to Corfu (mean score: 4.88, SD: 1.23).
From an emotional standpoint, the evaluation results suggest that participants were overall satisfied
with CorfuAR. Indeed, positive emotions predominated among the perceived feelings of individuals
that used the MAR application. Pleasure received the highest score among the three emotional states
(mean score 5.28, SD: 1.03) followed by dominance (mean score 4.75, SD: 1.01) and arousal (mean
score 4.42, SD: .82). Such responses usually indicate that participants exhibit feelings of happiness
17
and satisfaction pertaining the stimuli under investigation [76], which in this research reflects the
attitude of users towards CorfuAR.
Interestingly, the results indicate that there are no statistical differences between the two groups.
Hence, the tourists who used the personalized version of CorfuAR perceived the same degrees of
functional, emotional, and usability qualities with the sub-group that used the non-personalized
version of CorfuAR. Consequently, we conclude that the personalization feature did not affect the
adoption behavior and emotional response of the study participants.
Since there are no statistical differences between the two samples, we merged their responses in order
to proceed to our core research objective, namely to analyze how the technology properties of the
application influence the usage behavior of individuals through the formulation of different types of
emotions.
5.4.2 The role of emotions on formulating usage behavior
We employed partial least squares (PLS) analysis using SmartPLS to obtain path weights for
relationships and coefficients of determination for the dependent variables that measure tourists‘
emotions and usage behavior towards CorfuAR. Significance of associations was determined by
running a bootstrapping procedure with 500 samples. Using two-tailed significance values,
significance intervals are set as p<0.05 (t ≥ 1.968), p<0.01 (t ≥ 2.592), and p<0.001 (t≥ 3.323). Before
empirically examining the model associations, we performed a set of reliability and validity tests to
assess whether the instrument items load adequately to their respective factors. The results of this
analysis are included in Table 5. All values are above the acceptable thresholds (composite reliability
> 0.7; AVE > 0.5; Cronbach‘s Alpha > 0.7).
Construct Standardized Item
Loadings
Composite
Reliability AVE
Cronbach’s Alpha
Performance Expectancy (PE) .856 0.668 .749
PE1 .779
PE2 .921
PE3 .742
Effort Expectancy (EE) .914 0.727 .876
EE1 .905
EE2 .809
EE3 .878
EE4 .815
Price Value (PV) .905 0.827 .799
PV1 .871
PV2 .946
Behavioral Intention (BI) .920 0.794 .870
BI1 .900
BI2 .867

18
BI3 .904
Personal Innovativeness (PI) .891 0.732 .821
PI1 .924
PI2 .769
PI3 .866
Pleasure (P) .912 0.634 .886
P1 .837
P2 .767
P3 .827
P4 .832
P5 .789
P6 .720
Arousal (A) .876 0.542 .836
A1 .601
A2 .772
A3 .761
A4 .692
A5 .761
A6 .810
Dominance (D) .884 0.563 .845
D1 .813
D2 .824
D3 .794
D4 .762
D5 .717
D6 .559
Table 5 Confirmatory factor and reliability analysis results
Table 6 reflects all the correlations among constructs with diagonal elements containing the square
root of the average variance extracted (AVE). The correlation for every pair of constructs did not
exceed the square root of AVE, meaning that all constructs measure different objects and differ from
each other, indicating high discriminant validity. We also assessed multicollinearity through the
Variance Inflation Factor (VIF). For all constructs, VIF was slightly above 1 and below 3, thus
indicating an absence of collinearity between items.
PE EE PV BI PI P A D
Performance Expectancy
(PE) .817
Effort Expectancy (EE) .524 .853
Price Value (PV) .394 .425 .909
Behavioral Intention (BI) .749 .451 .170 .891
Personal Innovativeness (PI) .308 .389 .027 .461 .856
Pleasure (P) .455 .413 .194 .491 .214 .796
Arousal (A) .306 .237 .032 .446 .203 .582 .736
Dominance (D) .390 .308 .225 .414 .273 .656 .505 .750
Table 6 Factor correlations and square root of AVE of final measurement model

19
The results of the PLS algorithm with significance of weights are depicted in Table 7. The model
explains 45.1% of the variance for CorfuAR behavioral intention, 29% for pleasure, 12.5% for
arousal, and 24.7% for dominance.
Paths Β C.R.
(t-value) Path Significance
TECHNOLOGY PROPERTIES EMOTIONAL STATES
Effort Expectancy Pleasure .258 2.264 Significant at p<.05
Effort Expectancy Arousal .093 .567 Not significant
Effort Expectancy Dominance .269 3.018 Significant at p<.01
Performance Expectancy Pleasure .358 3.914 Significant at p<.001
Performance Expectancy Arousal .296 2.143 Significant at p<.05
Performance Expectancy Dominance .301 3.738 Significant at p<.001
EMOTIONAL STATES USAGE BEHAVIOR
Pleasure Behavioral Intention .257 2.171 Significant at p<.05
Arousal Behavioral Intention .223 2.136 Significant at p<.05
Dominance Behavioral Intention .022 .186 Not significant
COGNITIVE TRAITS USAGE BEHAVIOR
Personal Innovativeness Behavioral Intention .372 4.551 Significant at p<.001
Price Value Behaviorial Intention .085 .839 Not significant
Table 7 PLS results and significance levels
Our findings suggest a positive association between the technology properties of CorfuAR and the
examined emotional scales. In effect, the functional qualities of CorfuAR primarily evoke feelings of
pleasure (β=.358, p<.001), followed by feelings of control over the application (β=.301, p<.001) and
arousal (β=.296, p<.05). The enhanced usability provided by MAR interaction modalities induce
primarily emotions of control over CorfuAR (β=.269, p<.01) followed by feelings of pleasure (β=.258,
p<.05). The path analysis did not show any statistical association between effort expectancy and
arousal.
Furthermore, our analysis revealed that not all of the affective elements of MAR-centric interactions
are likely to influence users‘ intention to continue using the application. Only pleasure (β=.257, p<.05)
and arousal (β=.223, p<.05) were found to be statistically significant predictors of usage behavior.
This outcome is consistent with past technology adoption studies, which displayed that pleasure and
arousal can adequately capture the range of appropriate emotional responses [77]. Based on the above,
we suggest that manipulating the MAR application in such a way that evokes feelings of pleasure or
excitement will likely lead to increased usage intention. In contrast, incorporating functional elements
that generate feelings of potency do not seem to positively influence usage intention. Moreover, the
path analysis indicated a positive association between personal innovativeness and usage behavior
(β=.372, p<.001); the more prone an individual is to experiment with a technology innovation, the
more likely he/she will continue using CorfuAR. Finally, we did not find any positive relationship

20
between price value and usage behavior. We attribute this result to the fact that CorfuAR is offered
free of charge.
6. Conclusions & Discussion
6.1 Summary and theoretical contribution
This research presented CorfuAR, a fully-functional prototype of a mobile augmented reality tour
guide, which supports tourists on the move. CorfuAR displays information about the points of interest
(POI) a user selects on the screen of its smart phone; and gives navigation directions to specific,
requested POIs. In addition, CorfuAR embeds personalization features, which recommend to the users
specific POIs (i.e. the colored icons in the mobile screen) according to their profile and offer an extra
social media feature; the users may rate places they have visited and recommend them to other peers
in the same cluster. The users‘ profile for the personalized version is built on static and dynamically
updated users‘ preferences. This is the first time the activity segmentation methodology of the World
Tourism Organization is followed for recognizing the visitors‘ activity profile in order to classify the
visitors and provide them with personalized content through a MAR-based travel guide application.
The personalized version of our MAR tourist guide updates these static, pre-discovered activity
preferences of visitors by tracking their actual behavior during their stay (e.g. if they physically visited
a recommended POI). The personalization features are optional. Tourists may opt to use the non-
personalized version, which provides the same functionalities with the personalized one apart from
the recommendation and social networking features.
Our study assessed the development efforts of our MAR travel guide and, specifically, emphasized on
the system‘s evaluation by tourists visiting Corfu, an island in Greece. Conducting a field study, we
assessed the users‘ intention to use the MAR tourist guide in accordance with their perceived
performance, usability and experiential effect of CorfuAR. Now that MAR technologies are
considered robust enough to provide valuable, effective services, it is critical for the broad social
acceptance of MAR services to investigate what potential users expect and need. Extant research on
MAR largely focused on the engineering challenges of the technology and users‘ perceptions of such
services appears to be the least explored issue [44,78]. To our knowledge, this is the first study that
provides empirical evidence regarding the performance of MAR applications and relates their adoption
potential with experiential attributes.
Indeed, this study paves the ground for developing new theories, tailored specifically to MAR, that
incorporate emotional qualities at their core. Extant research on technology adoption (e.g. [68,79])
primarily examines organizational settings, and the selected information technology products are
functional products devoid of any hedonic dimension. Researchers adopt this stance because these
theories are concerned with explaining individuals‘ usage behavior towards systems that aid them in
work-related tasks. In comparison, our study is set in a setting where users assume a role of service

21
consumers. In this role, technology simply intervenes to augment the user experience and supports
personal needs that are both utilitarian and hedonic. Therefore, the usage behavior of such applications
will logically be balanced around their functional and experiential qualities. Our research validates this
claim by highlighting a direct association of usage attitudes with feelings of pleasure and arousal.
Based on these findings, we posit that there is an opportunity for academic scholars to devise emotion-
centric theories that address the adoption behavior of highly experiential information technology
artifacts, such as MAR services.
Driven by studies that underline a positive effect of personalization on mobile usability (e.g. [80,61]),
we probed for differences between users of the personalized version and ones using the non-
personalized version. Nevertheless, the field study did not highlight any statistical differences between
the two versions of the application. We attribute this finding to our functional operationalization of
personalization. On the one hand, personalization in CorfuAR was not implemented as a core feature
but rather as an assistive functionality in the form of targeted recommendations. Tourists using the
personalized version of the application could distinguish POIs that suited their travel needs through a
color-coding scheme and had the opportunity to recommend POIs through a social networking feature.
Yet, all content of the non-personalized version was also available to their mobile screen making the
differences in functionality between the two versions of the application marginal. As such, we argue
that a different implementation of the personalization functionality might produce statistically
significant results between the two versions of the application. An indicative alternative
implementation would display only the relevant POIs to each cluster and completely hide the
irrelevant ones.
6.2 Design implications for MAR travel guides
This research provides useful insights to designers of MAR travel guides. First, we demonstrate that
the interaction technology that a designer selects for providing tourism and travel-related services can
strongly affect the interaction of a tourist application and the overall use experience. In our case, AR
enriched the use with data from several sensors (GPS, magnetic compass, and accelerometer),
improving the functionality and fidelity of location-based services, which in combination with the
mobile device see-through visualization of the tourism-related content provided a useful and pleasing
experience. Since in mobile tourism, there is the need of engaging the user while she is on the go, the
combination of aesthetically pleasing and reliable space-time content may lead to high degrees of
usability and overall performance [81], as well as provide a user-friendly interaction modality
compared to plain mobile computing metaphors. Based on the results of our field study, we
acknowledge that individuals‘ tendency to experiment with new information technologies (i.e.,
personal innovativeness) plays a significant part in engaging the user to initially adopt the provided
tourism services. When the novelty effect wears off, it is the usefulness and consistency of the content
that should kick in and further engage the user.

22
When it comes to interacting with mobile tourism applications, the minimization of cognitive overload
is a key design aspect. Naturally, when a tourist is constantly moving, the application should provide
relevant-to-the-task content and cultivate semantic associations in users‘ cognition, in order to
minimize the necessary interaction steps, thus not affecting the user‘s real world navigation and
awareness of the physical surroundings. Methods like the ones implemented in this study
(personalization based on predefined criteria, location-based filtering, theme-based filtering, use of
widely-known icons and symbols) are a few examples of how to eliminate the information ‗noise‘ and
support users‘ procedural and semantic memory. Although our study did not reveal any statically
significant differences between the personalized and non-personalized versions of the application, we
posit that the intuitive and user-friendly interaction modality supported by MAR plays the pivotal role
in enhancing tourists‘ user experience. Personalization may be perceived as an add-on that further
enhances the user experience with information that is tailored to users‘ needs and wants.
Finally, our study highlighted the importance of emotions regarding the design of MAR applications.
Emotional design is a recent stream of product design which postulates that the design outcome may
initiate the users‘ emotions and induce affective responses that may make them feel happy, annoyed,
excited, or frustrated [82]. Designers may manipulate the properties of the artifact to trigger the
desired emotional state. At the very least MAR travel guide designers should devise ways that
minimize the formulation of negative emotions. Negative emotions may be stimulated through various
means, such as lack of real-time feedback regarding user-system interaction, which may leave users in
a state of uncertainty [83] and privacy concerns stemming from collection and manipulation of
personal information [40]. In CorfuAR we addressed these challenges through infrastructural and
privacy-aware schemes, focusing on a) minimizing user frustration from system slow or unexpected
responses during interactions and b) dealing with mistrust by offering a non-personalized version of
the application and by allowing users to de-activate the personalized recommendations should they
desired. Moreover, designers should not neglect the importance of reinforcing positive emotions. Our
field study showed that behavioral intention to use the system was positively affected through feeling
of pleasure and excitement. This provides an indication to MAR application designers to carefully
select the functionality provided by the service. Functional elements that reinforce positive feelings
(e.g. social media features and content provision based on gamification principles) might constitute the
optimal design choices.
6.3 Limitations and avenues for further research
As with any empirical study, our outcomes are subject to certain limitations. First, the findings are
based on self-reported data; qualitative methods such as in-depth interviews and observations could
provide additional insights regarding specific elements of CorfuAR, which influenced the perceptions
of tourists that participated in the user study. Likewise, such methods would allow emotional
responses to be captured as soon as they are experienced, minimizing the distortion imposed by time

23
on the recall of feelings. Second, we followed a convenience sampling approach and we acknowledge
that our results are subject to this limitation. A longitudinal user study that includes a more stratified
sample, especially in terms of mobile experience and education, controlling also for possible novelty
effects, would significantly enhance the generalization of the findings. Nevertheless, we posit that our
research provides significant value in terms of devising a theoretically rigorous framework that
captures user adoption of MAR services. Future research could apply our theoretical framework to
explore individuals‘ adoption of other experiential information technologies, such as online social
networks and innovative technology products (e.g. tablets and wearable systems). Indeed, the value of
our research model lies in its capability of allowing the prediction and understanding of behavior in an
emotions-based context.
References
1. Gavalas D, Kenteris M (2011) A web-based pervasive recommendation system for mobile
tourist guides. Pers Ubiquit Comput 15 (7):759-770. doi:10.1007/s00779-011-0389-x
2. Ghiani G, Paternò F, Santoro C, Spano LD (2009) UbiCicero: A location-aware, multi-
device museum guide. Interacting with Computers 21 (4):288-303.
doi:http://dx.doi.org/10.1016/j.intcom.2009.06.001
3. Noguera JM, Barranco MJ, Segura RJ, Martínez L (2012) A mobile 3D-GIS hybrid
recommender system for tourism. Information Sciences 215 (0):37-52.
doi:http://dx.doi.org/10.1016/j.ins.2012.05.010
4. Viana W, Miron A, Moisuc B, Gensel J, Villanova-Oliver M, Martin H (2011) Towards the
semantic and context-aware management of mobile multimedia. Multimed Tools Appl 53
(2):391-429. doi:10.1007/s11042-010-0502-6
5. Hsu H-H, Liao H-T (2011) A mobile RFID-based tour system with instant microblogging.
Journal of Computer and System Sciences 77 (4):720-727.
doi:http://dx.doi.org/10.1016/j.jcss.2010.02.011
6. Kenteris M, Gavalas D, Economou D (2009) An innovative mobile electronic tourist guide
application. Pers Ubiquit Comput 13 (2):103-118
7. Kenteris M, Gavalas D, Economou D (2011) Mytilene E-guide: a multiplatform mobile
application tourist guide exemplar. Multimed Tools Appl 54 (2):241-262.
doi:10.1007/s11042-010-0519-x
8. Hopken W, Fuchs M, Zanker M, Beer T (2010) Context-Based Adaptation of Mobile
Applications in Tourism. Information Technology & Tourism 12 (2):175-195.
doi:10.3727/109830510x12887971002783
9. Peres R, Correia A, Moital M (2011) The indicators of intention to adopt mobile electronic
tourist guides. Journal of Hospitality and Tourism Technology 12 (2):120-138
10. Pianesi F, Graziola I, Zancanaro M, Goren-Bar D (2009) The motivational and control
structure underlying the acceptance of adaptive museum guides – An empirical study.
Interacting with Computers 21 (3):186-200.
doi:http://dx.doi.org/10.1016/j.intcom.2009.04.002

24
11. Lanir J, Kuflik T, Wecker AJ, Stock O, Zancanaro M (2011) Examining proactiveness
and choice in a location-aware mobile museum guide. Interacting with Computers 23 (5):513-
524. doi:http://dx.doi.org/10.1016/j.intcom.2011.05.007
12. Schmidt-Rauch S, Schwabe G (2013) Designing for mobile value co-creation—the case of
travel counselling. Electron Markets:1-13. doi:10.1007/s12525-013-0124-8
13. Paay J, Kjeldskov J (2005) Understanding and modelling built environments for mobile
guide interface design. Behaviour & Information Technology 24 (1):21-35.
doi:10.1080/01449290512331319012
14. O'Grady MJ, O'Hare GMP, Sas C (2005) Mobile agents for mobile tourists: a user
evaluation of Gulliver's Genie. Interacting with Computers 17 (4):343-366.
doi:http://dx.doi.org/10.1016/j.intcom.2005.01.003
15. Bolter JD, Engberg M, MacIntyre B (2013) Media studies, mobile augmented reality, and
interaction design. interactions 20 (1):36-45. doi:10.1145/2405716.2405726
16. Rosenblum L, Feiner S, Julier S, Swan JE, II, Livingston M (2012) The Development of
Mobile Augmented Reality. In: Dill J, Earnshaw R, Kasik D, Vince J, Wong PC (eds)
Expanding the Frontiers of Visual Analytics and Visualization. Springer London, pp 431-448.
doi:10.1007/978-1-4471-2804-5_24
17. Behzadan AH, Timm BW, Kamat VR (2008) General-purpose modular hardware and
software framework for mobile outdoor augmented reality applications in engineering.
Advanced Engineering Informatics 22 (1):90-105.
doi:http://dx.doi.org/10.1016/j.aei.2007.08.005
18. Wagner D, Reitmayr G, Mulloni A, Drummond T, Schmalstieg D (2010) Real-Time
Detection and Tracking for Augmented Reality on Mobile Phones. Visualization and
Computer Graphics, IEEE Transactions on 16 (3):355-368. doi:10.1109/TVCG.2009.99
19. Langlotz T, Mooslechner S, Zollmann S, Degendorfer C, Reitmayr G, Schmalstieg D
(2012) Sketching up the world: in situ authoring for mobile Augmented Reality. Pers Ubiquit
Comput 16 (6):623-630. doi:10.1007/s00779-011-0430-0
20. Arvanitis T, Petrou A, Knight J, Savas S, Sotiriou S, Gargalakos M, Gialouri E (2009)
Human factors and qualitative pedagogical evaluation of a mobile augmented reality system
for science education used by learners with physical disabilities. Pers Ubiquit Comput 13
(3):243-250. doi:10.1007/s00779-007-0187-7
21. Wetzel R, Blum L, Broll W, Oppermann L (2011) Designing Mobile Augmented Reality
Games. In: Furht B (ed) Handbook of Augmented Reality. Springer New York, pp 513-539.
doi:10.1007/978-1-4614-0064-6_25
22. Guven S, Oda O, Podlaseck M, Stavropoulos H, Kolluri S, Pingali G Social mobile
Augmented Reality for retail. In: Pervasive Computing and Communications, 2009. PerCom
2009. IEEE International Conference on, 9-13 March 2009 2009. pp 1-3.
doi:10.1109/PERCOM.2009.4912803
23. Fragoso V, Gauglitz S, Zamora S, Kleban J, Turk M TranslatAR: A mobile augmented
reality translator. In: Applications of Computer Vision (WACV), 2011 IEEE Workshop on, 5-
7 Jan. 2011 2011. pp 497-502. doi:10.1109/WACV.2011.5711545
24. Damala A, Cubaud P, Bationo A, Houlier P, Marchal I (2008) Bridging the gap between
the digital and the physical: design and evaluation of a mobile augmented reality guide for the

25
museum visit. Paper presented at the Proceedings of the 3rd international conference on
Digital Interactive Media in Entertainment and Arts, Athens, Greece,
25. Choubassi M, Nestares O, Wu Y, Kozintsev I, Haussecker H (2010) An Augmented
Reality Tourist Guide on Your Mobile Devices. In: Boll S, Tian Q, Zhang L, Zhang Z, Chen
Y-P (eds) Advances in Multimedia Modeling, vol 5916. Lecture Notes in Computer Science.
Springer Berlin Heidelberg, pp 588-602. doi:10.1007/978-3-642-11301-7_58
26. Balduini M, Celino I, Dell‘Aglio D, Della Valle E, Huang Y, Lee T, Kim S-H, Tresp V
(2012) BOTTARI: An augmented reality mobile application to deliver personalized and
location-based recommendations by continuous analysis of social media streams. Web
Semantics: Science, Services and Agents on the World Wide Web 16 (0):33-41.
doi:http://dx.doi.org/10.1016/j.websem.2012.06.004
27. Choudary O, Charvillat V, Grigoras R, Gurdjos P (2009) MARCH: mobile augmented
reality for cultural heritage. Paper presented at the Proceedings of the 17th ACM international
conference on Multimedia, Beijing, China,
28. Mehrabian A, Russell JA (1974) An approach to environmental psychology. MIT Press,
Cambridge, MA
29. Grun C, Werthner H, Proll B, Retschitzegger W, Schwinger W Assisting Tourists on the
Move- An Evaluation of Mobile Tourist Guides. In: Mobile Business, 2008. ICMB '08. 7th
International Conference on, 7-8 July 2008 2008. pp 171-180. doi:10.1109/ICMB.2008.28
30. Emmanouilidis C, Koutsiamanis R-A, Tasidou A (2013) Mobile guides: Taxonomy of
architectures, context awareness, technologies and applications. Journal of Network and
Computer Applications 36 (1):103-125. doi:http://dx.doi.org/10.1016/j.jnca.2012.04.007
31. Suh Y, Shin C, Woo W, Dow S, MacIntyre B (2011) Enhancing and evaluating users'
social experience with a mobile phone guide applied to cultural heritage. Pers Ubiquit
Comput 15 (6):649-665. doi:10.1007/s00779-010-0344-2
32. Buján D, Martín D, Torices O, López-de-Ipiña D, Lamsfus C, Abaitua J, Alzua-Sorzabal
A (2013) Context Management Platform for Tourism Applications. Sensors 13 (7):8060-8078
33. Rasinger J, Fuchs M, Beer T, pken W (2009) Building a Mobile Tourist Guide based on
Tourists' On-Site Information Needs. Tourism Analysis 14 (4):483-502.
doi:10.3727/108354209x12596287114255
34. Bilandzic M, Foth M (2007) Urban computing and mobile devices: Mobile Location
Bookmarking. IEEE Pervasive Computing 6 (3):53-57
35. Buhalis D, Pistidda L (2008) The Impact of WiMAX on Tourist Destinations. In:
O'Connor P, Hopken W, Gretzel U (eds) Information and Communication Technologies in
Tourism 2008. Springer Vienna, pp 383-394. doi:10.1007/978-3-211-77280-5_34
36. Carlsson C, Walden P, Yang F Travel MoCo - A Mobile Community Service for Tourists.
In: 7th International Conference on Mobile Business, 7-8 July 2008 2008. pp 49-58.
doi:10.1109/icmb.2008.40
37. Xiang Z, Gretzel U (2010) Role of social media in online travel information search.
Tourism Management 31 (2):179-188. doi:http://dx.doi.org/10.1016/j.tourman.2009.02.016
38. Kwon JM, Bae J, Blum SC (2013) Mobile applications in the hospitality industry. Journal
of Hospitality and Tourism Technology 4 (1):81-92

26
39. Wang H-Y, Wang S-H (2010) Predicting mobile hotel reservation adoption: Insight from
a perceived value standpoint. International Journal of Hospitality Management 29 (4):598-
608. doi:http://dx.doi.org/10.1016/j.ijhm.2009.11.001
40. Olsson T, Lagerstam E, Karkkainen T, Vaananen-Vainio-Mattila K (2013) Expected user
experience of mobile augmented reality services: a user study in the context of shopping
centres. Pers Ubiquit Comput 17 (2):287-304. doi:10.1007/s00779-011-0494-x
41. Azuma R, Baillot Y, Behringer R, Feiner S, Julier S, MacIntyre B (2001) Recent advances
in augmented reality. Computer Graphics and Applications, IEEE 21 (6):34-47.
doi:10.1109/38.963459
42. Liu C, Huot S, Diehl J, Mackay W, Beaudouin-Lafon M (2012) Evaluating the benefits of
real-time feedback in mobile augmented reality with hand-held devices. Paper presented at the
Proceedings of the 2012 ACM annual conference on Human Factors in Computing Systems,
Austin, Texas, USA,
43. Chi H-L, Kang S-C, Wang X (2013) Research trends and opportunities of augmented
reality applications in architecture, engineering, and construction. Automation in Construction
33 (0):116-122. doi:http://dx.doi.org/10.1016/j.autcon.2012.12.017
44. Kurkovsky S, Koshy R, Novak V, Szul P Current issues in handheld augmented reality.
In: Communications and Information Technology (ICCIT), 2012 International Conference on,
26-28 June 2012 2012. pp 68-72. doi:10.1109/ICCITechnol.2012.6285844
45. Prochazka D, Stencl M, Popelka O, Stastny J (2011) Mobile Augmented Reality
Applications.
46. Papagiannakis G, Singh G, Magnenat‐Thalmann N (2008) A survey of mobile and
wireless technologies for augmented reality systems. Computer Animation and Virtual
Worlds 19 (1):3-22
47. Santana-Mancilla PC, Garc‘a-Ruiz MA, Acosta-Diaz R, Juárez CU (2012) Service
Oriented Architecture to Support Mexican Secondary Education through Mobile Augmented
Reality. Procedia Computer Science 10 (0):721-727.
doi:http://dx.doi.org/10.1016/j.procs.2012.06.092
48. Albrecht U-V, Behrends M, Matthies H, Jan U (2013) Medical Students Experience the
Mobile Augmented Reality Blended Learning Environment: An Attractive Concept for the
Net Generation? In: Sampson DG, Isaias P, Ifenthaler D, Spector JM (eds) Ubiquitous and
Mobile Learning in the Digital Age. Springer New York, pp 109-113. doi:10.1007/978-1-
4614-3329-3_7
49. Chou T-L, ChanLin L-J (2012) Augmented Reality Smartphone Environment Orientation
Application: A Case Study of the Fu-Jen University Mobile Campus Touring System.
Procedia - Social and Behavioral Sciences 46 (0):410-416.
doi:http://dx.doi.org/10.1016/j.sbspro.2012.05.132
50. Hahn J (2012) Mobile augmented reality applications for library services. New Library
World 113 (9/10):429-438
51. Skov MB, Kjeldskov J, Paay J, Husted N, Nørskov J, Pedersen K (2013) Designing on-
site: Facilitating participatory contextual architecture with mobile phones. Pervasive and
Mobile Computing 9 (2):216-227. doi:http://dx.doi.org/10.1016/j.pmcj.2012.05.004
52. Oh S, Woo W (2009) CAMAR: Context-aware mobile augmented reality in smart space.
Proc of IWUVR 9:48-51

27
53. Botella C, Breton-López J, Quero S, Baños RM, García-Palacios A, Zaragoza I, Alcaniz
M (2011) Treating cockroach phobia using a serious game on a mobile phone and augmented
reality exposure: A single case study. Computers in Human Behavior 27 (1):217-227.
doi:http://dx.doi.org/10.1016/j.chb.2010.07.043
54. Yovcheva Z, Buhalis D, Gatzidis C (2013) Engineering Augmented Tourism Experiences.
In: Cantoni L, Xiang Z (eds) Information and Communication Technologies in Tourism 2013.
Springer Berlin Heidelberg, pp 24-35. doi:10.1007/978-3-642-36309-2_3
55. Kounavis CD, Kasimati AE, Zamani ED, Giaglis G Enhancing the Tourism Experience
through Mobile Augmented Reality: Challenges and Prospects. In: the Proceedings of the 2nd
Advances in Hospitality and Tourism Marketing & Management (AHTMM 2012)
Conference, Corfu, Greece, 2012.
56. Van Krevelen D, Poelman R (2010) A survey of augmented reality technologies,
applications and limitations. International Journal of Virtual Reality 9 (2):1
57. Kourouthanassis P, Boletsis C, Lekakos G (2013) Demystifying the design of mobile
augmented reality applications. Multimed Tools Appl:1-22. doi:10.1007/s11042-013-1710-7
58. Vlahakis V, Ioannidis N, Karigiannis J, Tsotros M, Gounaris M, Stricker D, Gleue T,
Daehne P, Almeida L (2002) Archeoguide: an augmented reality guide for archaeological
sites. Computer Graphics and Applications, IEEE 22 (5):52-60.
doi:10.1109/MCG.2002.1028726
59. Iris H, Anne-Kathrin B, Rod M, Wolfgang B (2008) TimeWarp: interactive time travel
with a mobile mixed reality game. Paper presented at the Proceedings of the 10th
international conference on Human computer interaction with mobile devices and services,
Amsterdam, The Netherlands,
60. Han D-I, Jung T, Gibson A (2013) Dublin AR: Implementing Augmented Reality in
Tourism. In: Information and Communication Technologies in Tourism 2014. Springer, pp
511-523
61. Ko SM, Chang WS, Ji YG (2013) Usability Principles for Augmented Reality
Applications in a Smartphone Environment. International Journal of Human-Computer
Interaction 29 (8):501-515. doi:10.1080/10447318.2012.722466
62. World Tourism Organization (2007) Handbook on Tourism Market Segmentation -
Maximising Marketing Effectiveness. World Tourism Organization, Madris, Spain
63. Bornhorst T, Brent Ritchie JR, Sheehan L (2010) Determinants of tourism success for
DMOs & destinations: An empirical examination of stakeholders' perspectives. Tourism
Management 31 (5):572-589. doi:http://dx.doi.org/10.1016/j.tourman.2009.06.008
64. Xiao H, Smith SLJ (2007) The use of Tourism knowledge: Research Propositions. Annals
of Tourism Research 34 (2):310-331. doi:http://dx.doi.org/10.1016/j.annals.2006.09.001
65. Andreu L, Kozak M, Avci N, Cifter N (2006) Market segmentation by motivations to
travel: British tourists visiting Turkey. Journal of Travel & Tourism Marketing 19 (1):1-14
66. Jang S, Cai LA (2002) Travel motivations and destination choice: A study of British
outbound market. Journal of Travel & Tourism Marketing 13 (3):111-133.
doi:10.1080/10548400209511570
67. Kim K-Y, Jogaratnam G (2003) Travel Motivations. Journal of Travel & Tourism
Marketing 13 (4):61-82. doi:10.1300/J073v13n04_04
28
68. Venkatesh V, Thong JYL, Xu X (2012) Consumer acceptance and use of information
technology: Extending the unified theory of acceptance and use of technology. MIS Quarterly
36 (1):157-178
69. Mäntymäki M, Salo J (2013) Purchasing behavior in social virtual worlds: An
examination of Habbo Hotel. International Journal of Information Management 33 (2):282-
290. doi:http://dx.doi.org/10.1016/j.ijinfomgt.2012.12.002
70. Ongena G, van de Wijngaert L, Huizer E (2012) Exploring determinants of early user
acceptance for an audio-visual heritage archive service using the vignette method. Behaviour
& Information Technology:1-9. doi:10.1080/0144929X.2012.726648
71. Donovan RJ, Rossiter JR, Marcoolyn G, Nesdale A (1994) Store atmosphere and
purchasing behavior. Journal of Retailing 70 (3):283-294. doi:http://dx.doi.org/10.1016/0022-
4359(94)90037-X
72. Holbrook MB, Batra R (1987) Assessing the Role of Emotions as Mediators of Consumer
Responses to Advertising. Journal of Consumer Research 14 (3):404-420
73. Kulviwat S, Bruner Ii GC, Kumar A, Nasco SA, Clark T (2007) Toward a unified theory
of consumer acceptance technology. Psychology and Marketing 24 (12):1059-1084.
doi:10.1002/mar.20196
74. Lee S, Ha S, Widdows R (2011) Consumer responses to high-technology products:
Product attributes, cognition, and emotions. Journal of Business Research 64 (11):1195-1200.
doi:http://dx.doi.org/10.1016/j.jbusres.2011.06.022
75. Agarwal R, Prasad J (1998) A conceptual and operational definition of personal
innovativeness in the domain of information technology. Information systems research 9
(2):204-215
76. Russell JA, Mehrabian A (1977) Evidence for a three-factor theory of emotions. Journal
of Research in Personality 11 (3):273-294. doi:http://dx.doi.org/10.1016/0092-
6566(77)90037-X
77. Koo D-M, Ju S-H (2010) The interactional effects of atmospherics and perceptual
curiosity on emotions and online shopping intention. Computers in Human Behavior 26
(3):377-388. doi:http://dx.doi.org/10.1016/j.chb.2009.11.009
78. Zhou F, Duh HB-L, Billinghurst M (2008) Trends in augmented reality tracking,
interaction and display: A review of ten years of ISMAR. Paper presented at the Proceedings
of the 7th IEEE/ACM International Symposium on Mixed and Augmented Reality,
79. Bhattacherjee A (2001) Understanding information systems continuance: an expectation-
confirmation model. MIS quarterly:351-370
80. Coursaris CK, Kim DJ (2011) A meta-analytical review of empirical mobile usability
studies. Journal of usability studies 6 (3):117-171
81. Norman D (2002) Emotion & design: attractive things work better. interactions 9 (4):36-
42
82. Ho AG, Siu KWM (2012) Emotion Design, Emotional Design, Emotionalize Design: A
Review on Their Relationships from a New Perspective. The Design Journal 15 (1):9-32.
doi:10.2752/175630612X13192035508462

29
83. Liu C, Huot S, Diehl J, Mackay W, Beaudouin-Lafon M Evaluating the benefits of real-
time feedback in mobile augmented reality with hand-held devices. In: Proceedings of the
SIGCHI Conference on Human Factors in Computing Systems, 2012. ACM, pp 2973-2976
Appendix: Measurement Instrument
Measurement
Factor
Coding Items Reference
Performance
expectancy
PE1 I find CorfuAR useful when navigating through the city
Venkatesh
et al. [68]
PE2 Using CorfuAR helps me getting information about points
of interest and better guidance in the city
PE3 Using CorfuAR increases my interest for new places
Effort expectancy
EE1 Learning how to use CorfuAR is easy for me
EE2 My interaction with CorfuAR is clear and understandable
EE3 I find CorfuAR easy to use
EE4 It is easy for me to become skillful at using CorfuAR
Behavioral Intention
BI1 I intend to continue using CorfuAR in the future
BI2 I will always try to use CorfuAR in my daily tours
BI3 I plan to continue using CorfuAR frequently
Please note the level that better represents your emotional state after using CorfuAR
Mehrabian
and
Russell
[28]
Pleasure
P1 Unhappy ----- Happy
P2 Annoyed ----- Pleased
P3 Unsatisfied ----- Satisfied
P4 Melancholic ----- Contented
P5 Despairing ----- Hopeful
P6 Bored ----- Relaxed
Arousal
A1 Relaxed ----- Stimulated
A2 Calm ----- Excited
A3 Sluggish ----- Frenzied
A4 Dull ----- Jittery
A5 Sleepy ----- Wide awake
A6 Unaroused ----- Aroused
Dominance
D1 Controlled ----- Controlling
D2 Influenced ----- Influential
D3 Cared for ----- In control
D4 Awed ----- Important
D5 Submissive ----- Dominant
D6 Guided ----- Autonomous
Personal
Innovativeness
PI1 I like to experiment with new technologies Agarwal
and Prasad
[75] PI2 If I heard about a new technology, I would look for ways
to experiment with it
PI3 Among my peers, I am usually the first to explore new
technologies
Price value PV1 CorfuAR is reasonably priced. Venkatesh
et al. [68] PV2 CorfuAR is a good value for the money.
30
Figure captions
Fig 1 The homepage of CorfuAR mobile augmented reality application
Fig 2 The 9 categories of points of interest (POI) supported by CorfuAR
Fig 3 CorfuAR travel guide in action
Fig 4 The architecture of CorfuAR
Fig 5 Sample of the activity-related questionnaire for discovering the user‘s profile
Fig 6 Research framework