Tourist Satisfaction and Destination Competitiveness Perspective of Tourists Prof. Haiyan Song The...
43
Tourist Satisfaction and Tourist Satisfaction and Destination Competitiveness Destination Competitiveness Perspective of Tourists Perspective of Tourists Prof. Haiyan Song Prof. Haiyan Song The Hong Kong Polytechnic University The Hong Kong Polytechnic University P. R. China P. R. China
-
Upload
brandon-simpson -
Category
Documents
-
view
224 -
download
0
Transcript of Tourist Satisfaction and Destination Competitiveness Perspective of Tourists Prof. Haiyan Song The...
Tourist Satisfaction and Tourist Satisfaction and Destination Competitiveness Destination Competitiveness
Perspective of Tourists Perspective of Tourists
Prof. Haiyan SongProf. Haiyan Song
The Hong Kong Polytechnic UniversityThe Hong Kong Polytechnic University
P. R. ChinaP. R. China

Background Research Objectives Literature Review Methodology Main Results and Comparisons Further development of the Project Conclusion and Implications
Outline

Overview of Hong Kong Tourism
Hong Kong is situated on the southeastern coast of China including 262 outlying islands and the climate is sub-tropical.
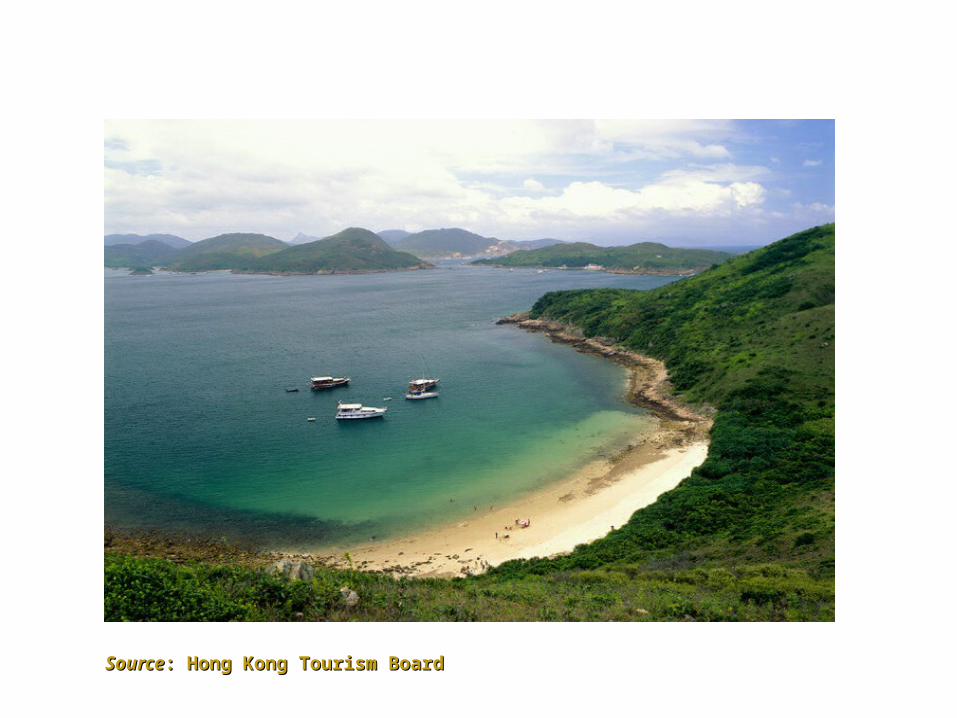
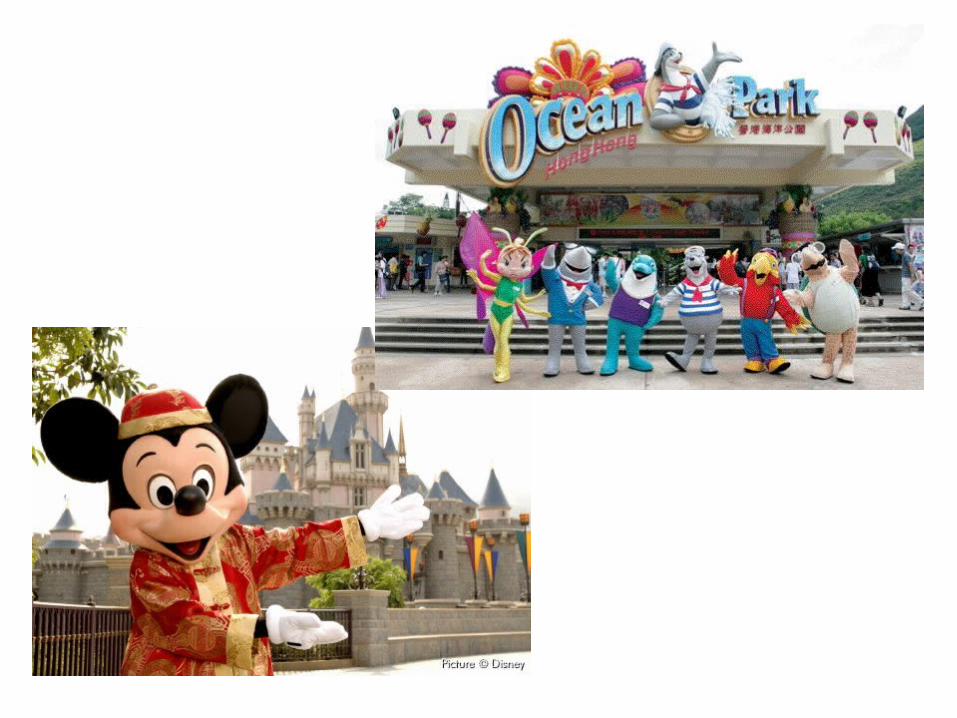
The unique blend of eastern and western influences, matched by diverse attractions and stunning countryside, has made Hong Kong the Asia's prime tourist destination.
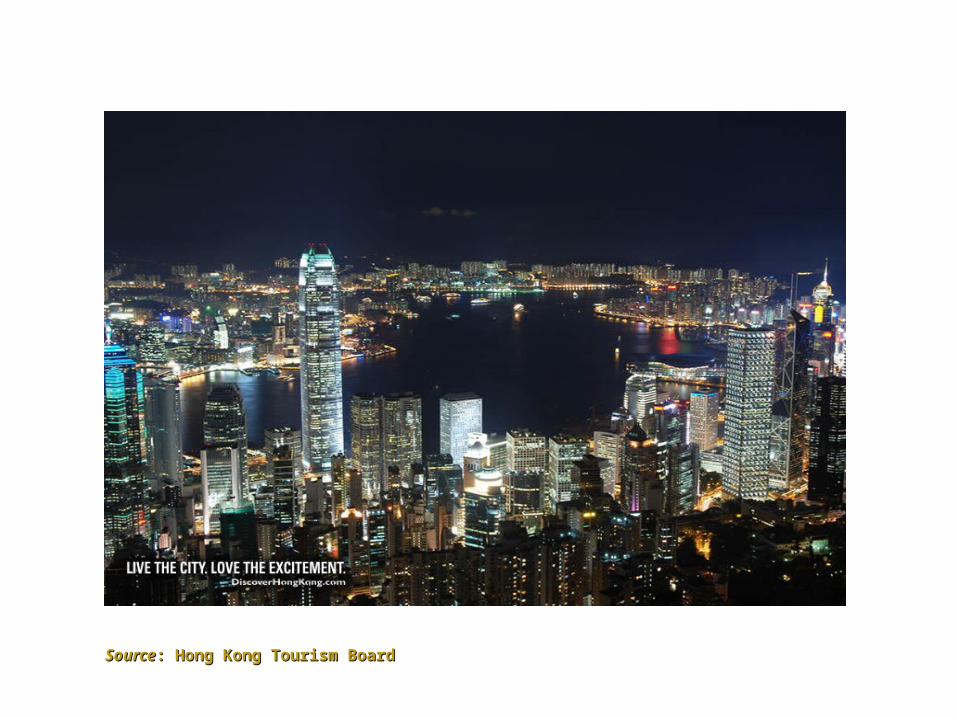
SourceSource: Hong Kong Tourism Board: Hong Kong Tourism Board

SourceSource: Hong Kong Tourism Board : Hong Kong Tourism Board
SourceSource: Hong Kong Tourism Board : Hong Kong Tourism Board
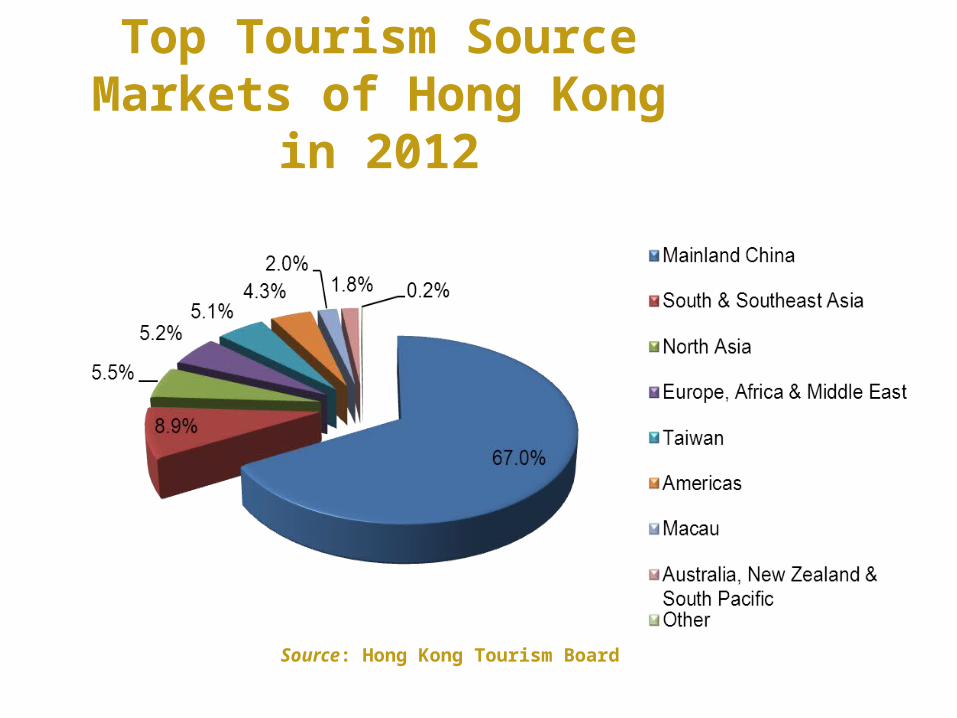
Top Tourism Source Markets of Hong Kong
in 2012
Source: Hong Kong Tourism Board
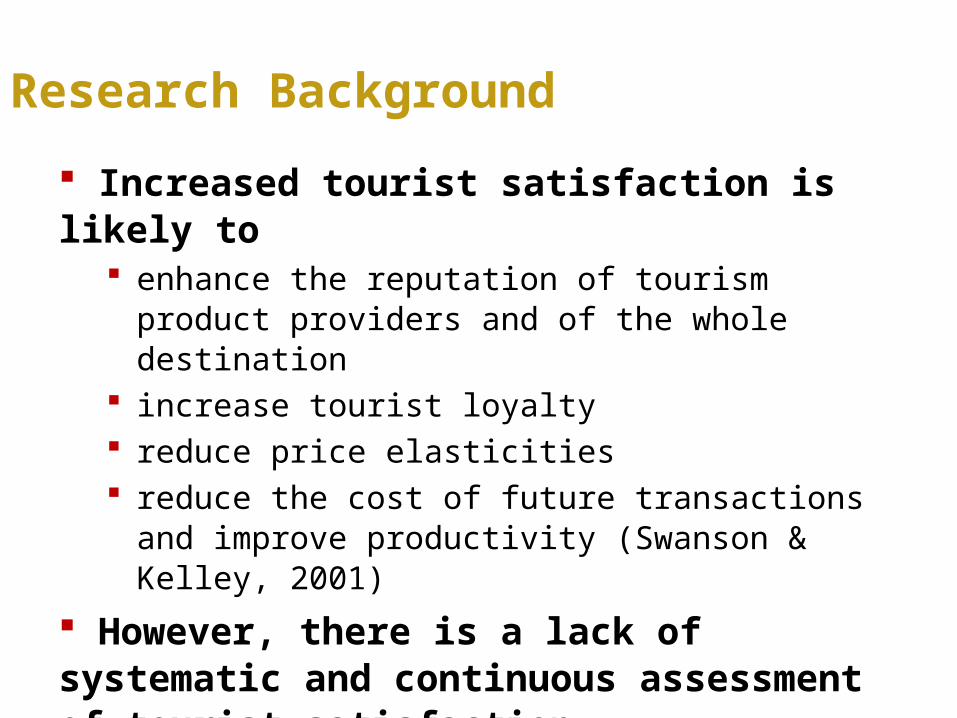
Research Background
Increased tourist satisfaction is likely to
enhance the reputation of tourism product providers and of the whole destination
increase tourist loyalty reduce price elasticities reduce the cost of future transactions and
improve productivity (Swanson & Kelley, 2001)
However, there is a lack of systematic and continuous assessment of tourist satisfaction.

To develop a systematic approach to tourist satisfaction assessment.
To provide useful quantitative information of service performance of relevant tourism sectors and implications for service quality improvement.
To inform the stakeholders of the tourism industry about the competitiveness of the tourism related sectors and of the whole destination.
Research Objectives
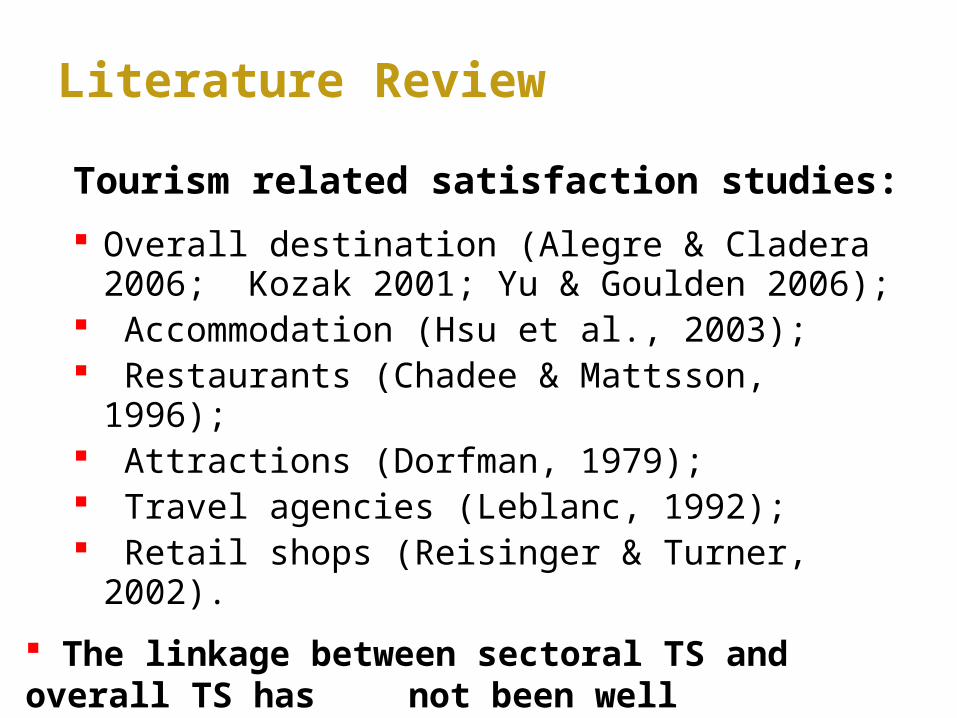
Tourism related satisfaction studies:
Overall destination (Alegre & Cladera 2006; Kozak 2001; Yu & Goulden 2006);
Accommodation (Hsu et al., 2003); Restaurants (Chadee & Mattsson, 1996); Attractions (Dorfman, 1979); Travel agencies (Leblanc, 1992); Retail shops (Reisinger & Turner, 2002).
The linkage between sectoral TS and overall TS has not been well established.
Literature Review
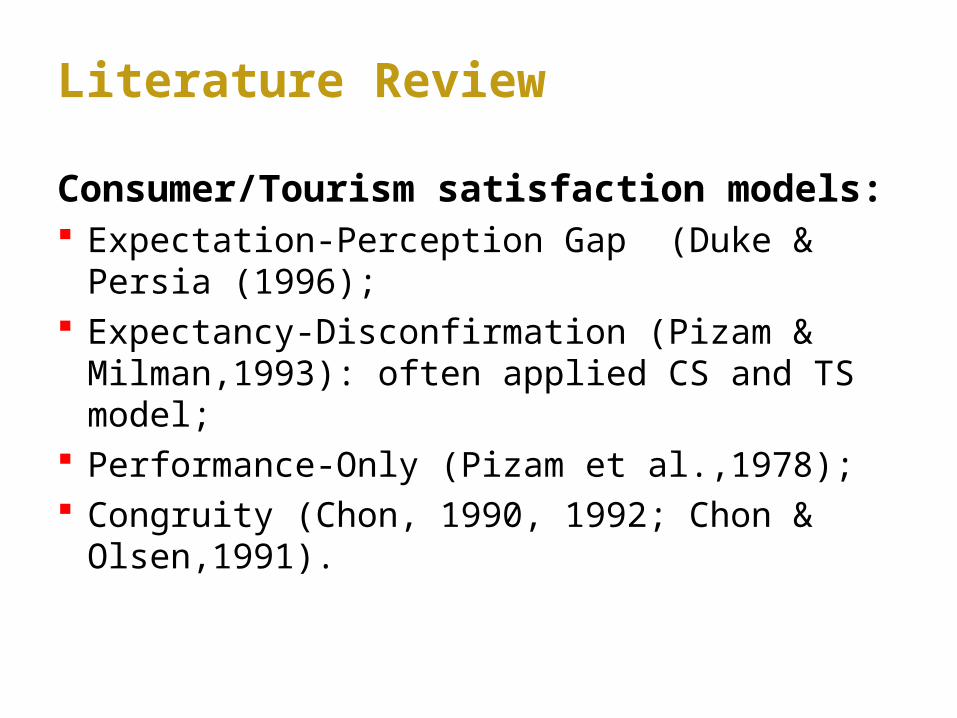
Consumer/Tourism satisfaction models: Expectation-Perception Gap (Duke & Persia
(1996); Expectancy-Disconfirmation (Pizam &
Milman,1993): often applied CS and TS model; Performance-Only (Pizam et al.,1978); Congruity (Chon, 1990, 1992; Chon &
Olsen,1991).
Literature Review
Literature Review
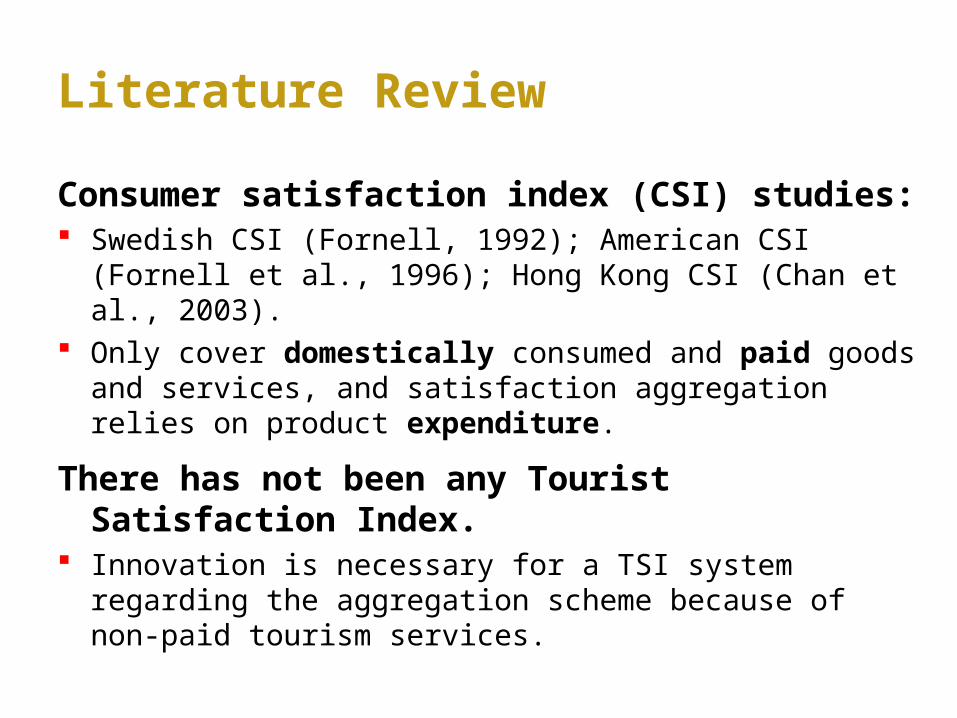
Consumer satisfaction index (CSI) studies: Swedish CSI (Fornell, 1992); American CSI (Fornell et
al., 1996); Hong Kong CSI (Chan et al., 2003). Only cover domestically consumed and paid goods
and services, and satisfaction aggregation relies on product expenditure.
There has not been any Tourist Satisfaction Index.
Innovation is necessary for a TSI system regarding the aggregation scheme because of non-paid tourism services.
The developed TSI system conducts a two-stage evaluation at the sectoral and destination levels.
The theoretical framework integrates alternative approaches and captures multiple dimensions of tourist satisfaction.
The sectoral-level tourist satisfaction evaluation is a structural equation model in which tourists’ satisfaction is evaluated with relevant antecedents and consequences.
Methodology

Sectoral-Level TSI Model
Overall satisfactionComparison with expectationsComparison with ideal
Price given qualityQuality given price
Revisit intentionsRecommendation to others
Intentions to complain to employeeIntentions to complain to others
Overall performanceCustomizationReliability
PerceivedPerformance
Overall expectationsCustomization Reliability
Tourist SatisfactionAssessed Value
Expectations
Complaint Intentions
Loyalty

Sectoral TSI Calculation
Sectoral TSI
where y31, y32 and y33 are measures of TS, and ωs are factor loadings from the estimated SEM as weights.
10333231
333231 333231
yyy

Six tourism service sectors are included: hotels, restaurants, retail shops, attractions, transportation and immigration/custom services.
TSI at the sectoral level is directly comparable because each sector is measured by the same set of indicators.
The destination-level TSI is derived from an innovative aggregation scheme based on a multiple indicators and multiple causes (MIMIC) model.
Methodology

Aggregation Model of TSI
Overall Satisfaction
Aggregate Service
Satisfaction
Hotels
Immigration
Attractions
Restaurants
Retails Shops
Transportation
Expectations
Compared to Ideal
Overall Destination Satisfaction
Aggregation Model of TSI
Aggregate Service Satisfaction vs Overall Destination Satisfaction The gap reflects the influences of non-
service attributes of a destination on tourists’ satisfaction with their overall experience.
Both indexes are weighted averages, with the weighting schemes derived from the estimated MIMIC model.

Methodology
Partial least square (PLS) based variance estimation method instead of maximum likelihood (ML) based covariance structure analysis method was employed for SEM estimation.
PLS method has advantages of avoiding problems of improper solutions, factor indeterminacy and violations of distribution assumptions (Chan, et al., 2003).
Smart PLS computing programme was used.

Sampling and Sample Size
A quota sampling method was employed and the quotas were set up in line with HKTB statistics.
Source Market N %
Americas 302 13
Australia, New Zealand & Pacific 302 13
Europe, Africa & Middle East 360 15
Japan & Korea 330 14
Mainland China 455 19
South & Southeast Asia 290 12
Taiwan & Macau 298 13
Total 2,337 100
Sample size by source market (PolyU TSI, 2012)

Main Results
The PolyU
Tourist Satisfaction Index :
Hong Kong 2009-2012

Estimated Sector-Level Model
Overall satisfactionComparison with expectationsComparison with ideal
Price given qualityQuality given price
Revisit intentionsRecommendation to others
Intentions to complain to employeeIntentions to complain to others
Overall performanceCustomizationReliability
PerceivedPerformance
Overall expectationsCustomization Reliability
Tourist SatisfactionAssessed Value
Expectations
Complaint Intentions
Loyalty
--
--
--
Diagnostic Tests: Attraction-Sector Model
Model Diagnostic Statistics
Expectations Perceived Performance
Assessed Value
Tourist Satisfaction
Complaint Intentions
Loyalty
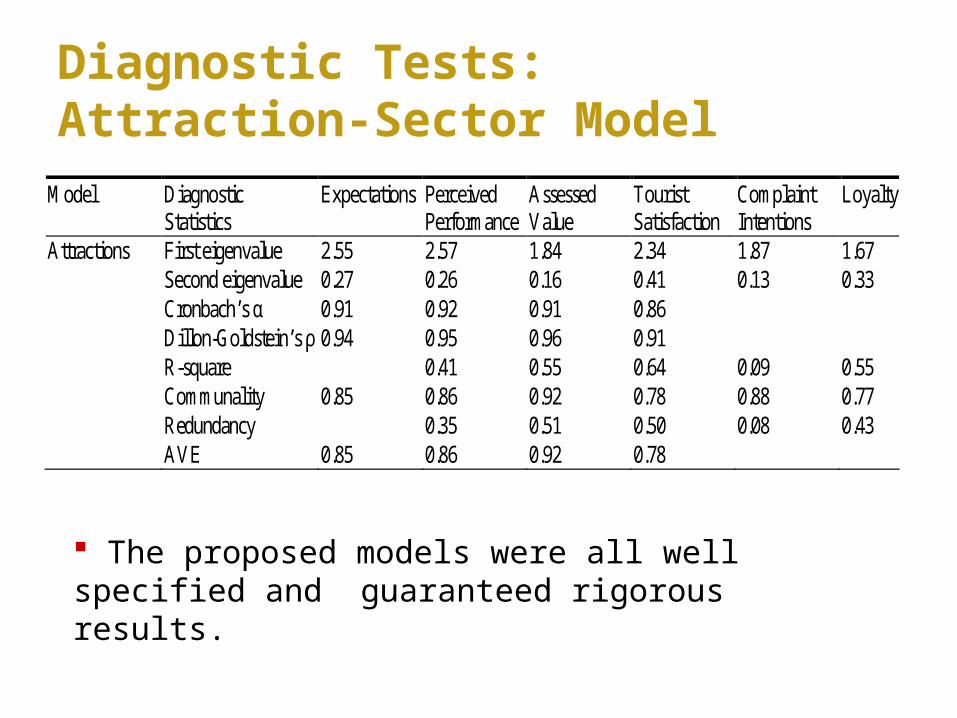
Attractions First eigenvalue 2.55 2.57 1.84 2.34 1.87 1.67 Second eigenvalue 0.27 0.26 0.16 0.41 0.13 0.33 Cronbach’s α 0.91 0.92 0.91 0.86 Dillon-Goldstein’s ρ 0.94 0.95 0.96 0.91 R-square 0.41 0.55 0.64 0.09 0.55 Communality 0.85 0.86 0.92 0.78 0.88 0.77 Redundancy 0.35 0.51 0.50 0.08 0.43 AVE 0.85 0.86 0.92 0.78
The proposed models were all well specified and guaranteed rigorous results.

The PolyU Tourist Satisfaction Index(2009–2012)
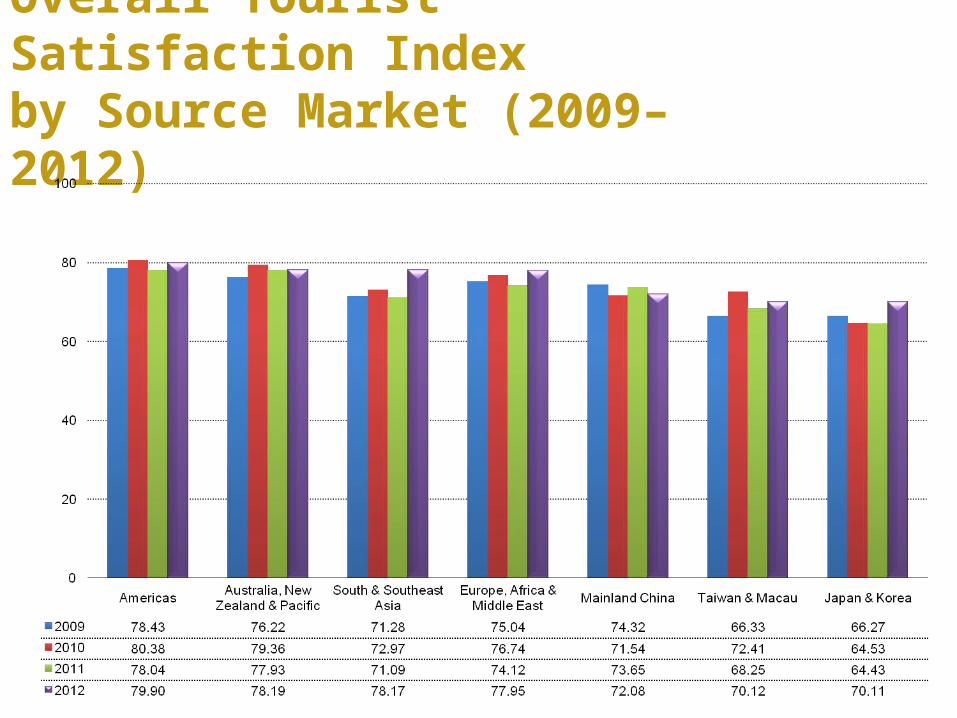
Overall Tourist Satisfaction Index by Source Market (2009–2012)
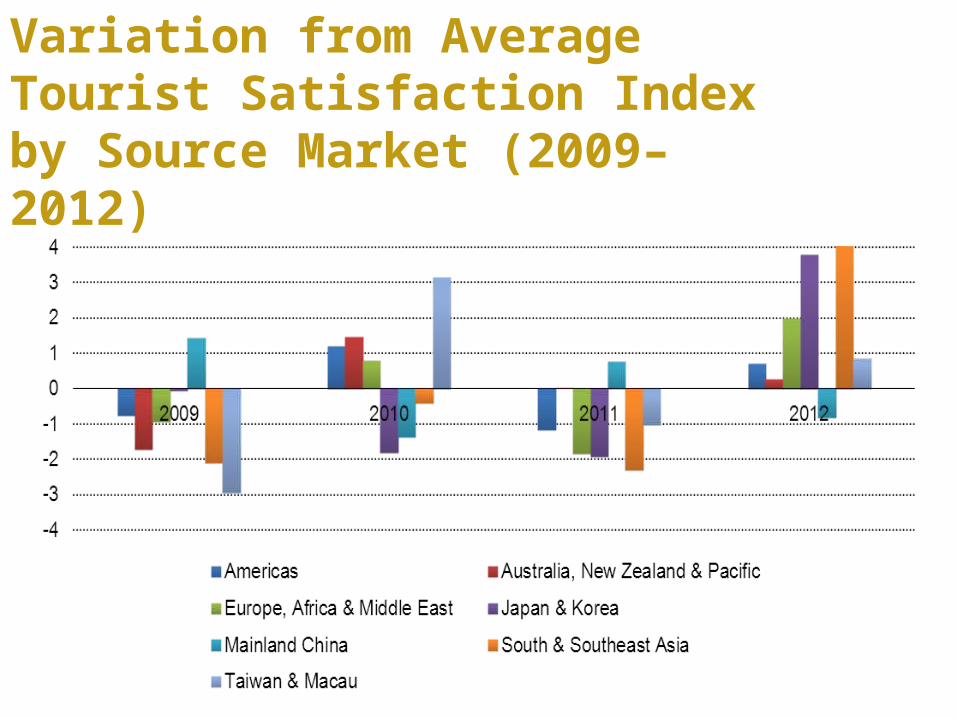
Variation from Average Tourist Satisfaction Index by Source Market (2009–2012)

Overall Tourist Satisfaction Index by Service Sector (2009–2012)
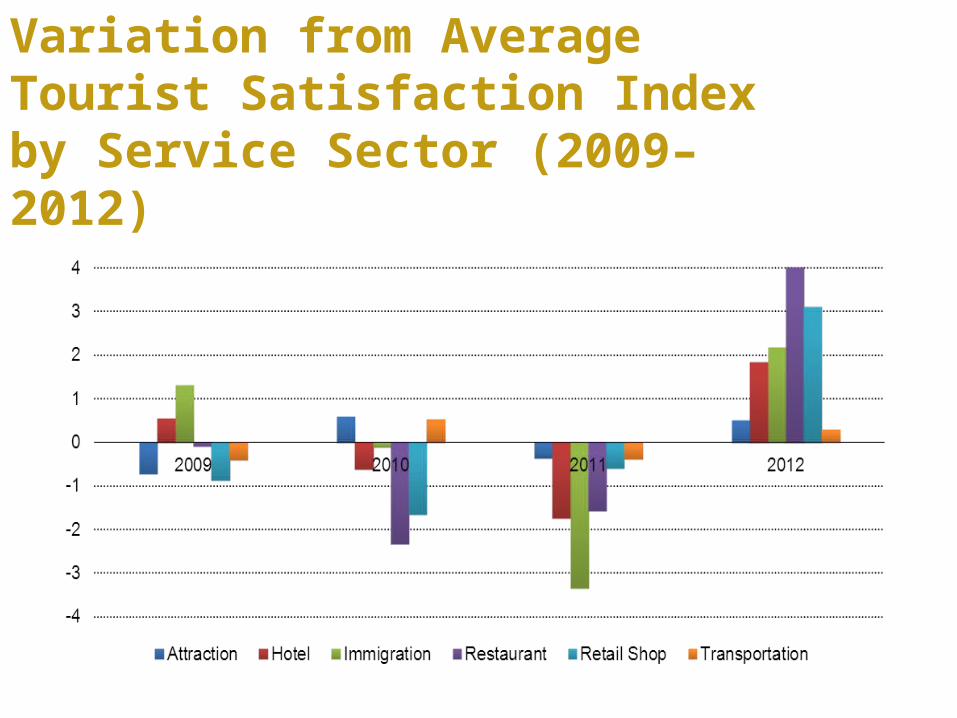
Variation from Average Tourist Satisfaction Index by Service Sector (2009–2012)
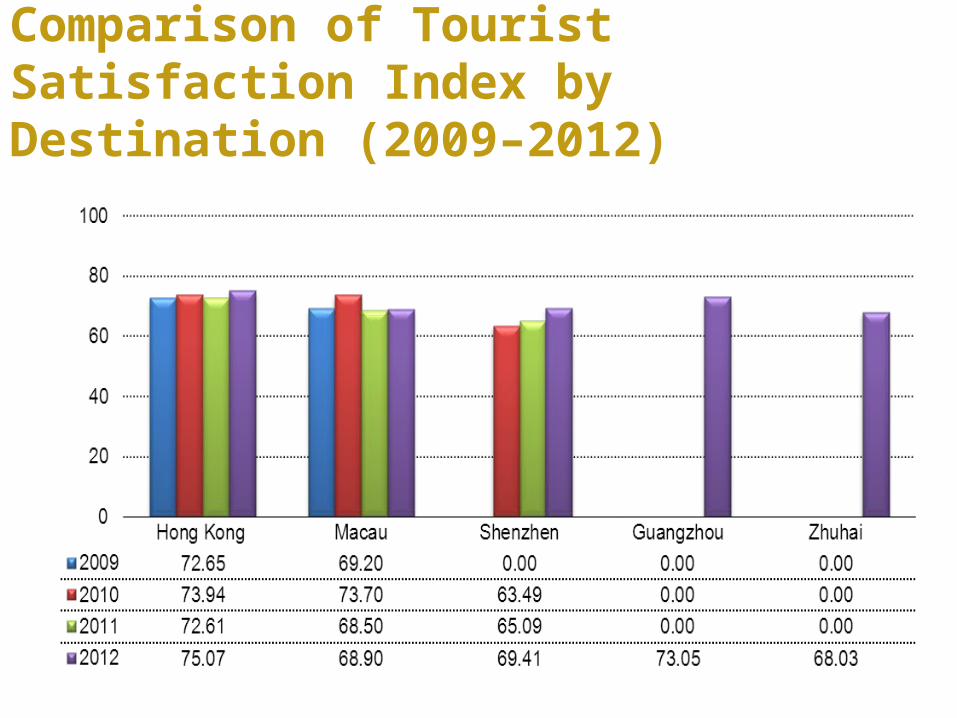
Comparison of Tourist Satisfaction Index by Destination (2009–2012)

Overall Satisfaction
0.757 Aggregate Service Satisfaction
Hotels
Immigration
Attractions
Restaurants
Retails Shops
Transportation
Expectations
Compared to Ideal
Overall Destination Satisfaction
0.233
0.210
0.265
0.170
0.247
0.297
0.946
0.906
0.935
The Estimated TSI Aggregation Model
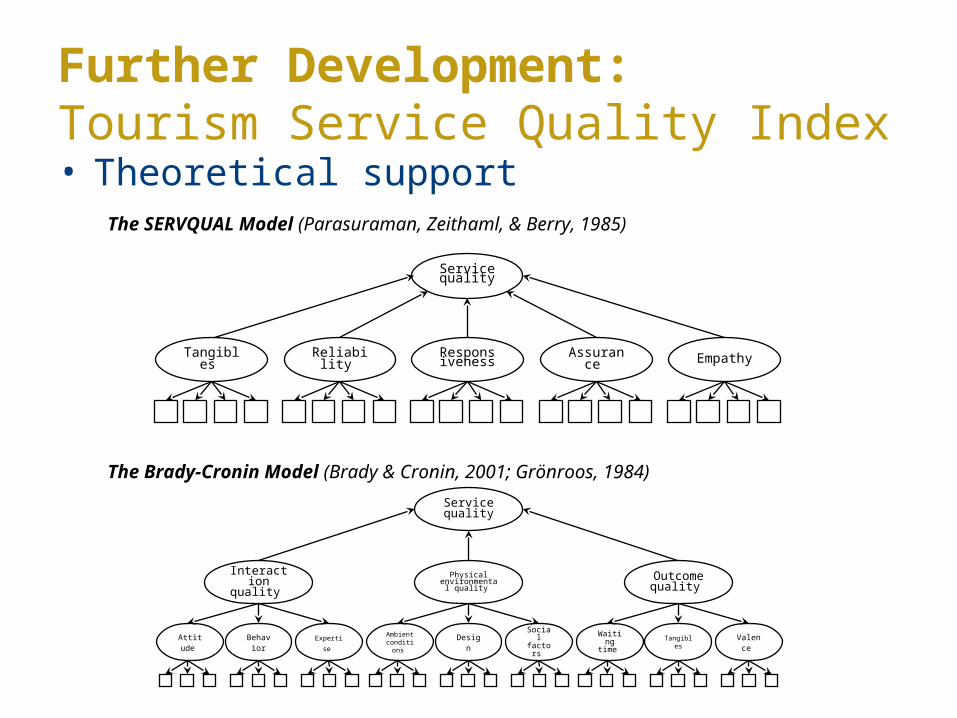
Further Development:Tourism Service Quality Index • Theoretical support
Tangibles
Service quality
Reliability
Responsiveness
Assurance
Empathy
Interaction quality
Service quality
Attitude Behavio
rExpertise
Physical environmental
quality
Ambient conditions Design
Social factors
Outcome quality
Waiting time Tangibles Valence
The SERVQUAL Model (Parasuraman, Zeithaml, & Berry, 1985)
The Brady-Cronin Model (Brady & Cronin, 2001; Grönroos, 1984)
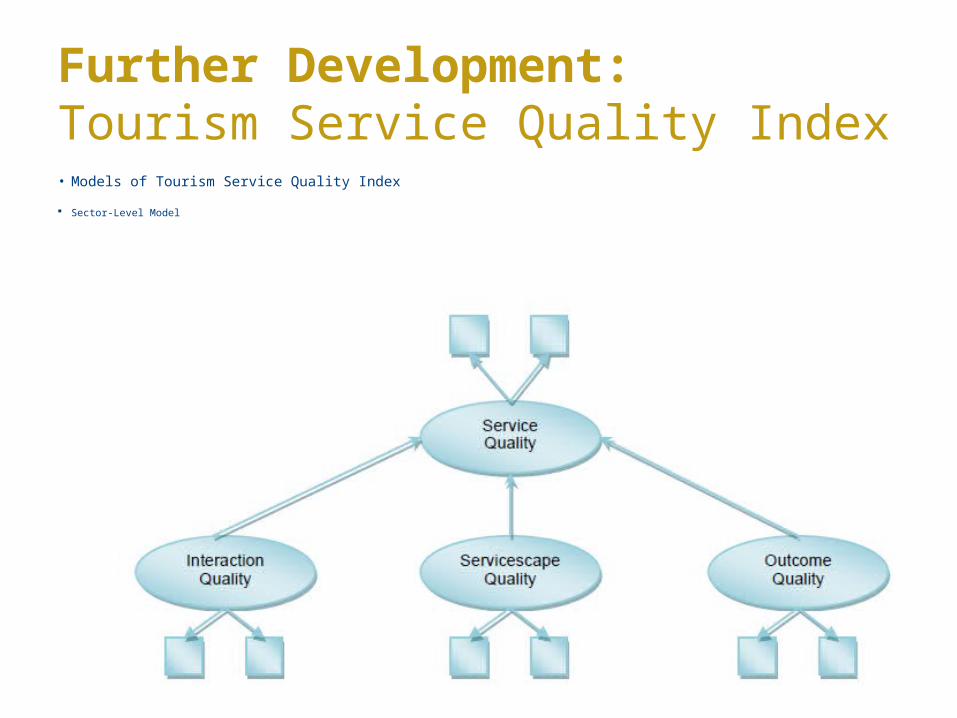
Further Development:Tourism Service Quality Index • Models of Tourism Service Quality Index
Sector-Level Model

Further Development:Tourism Service Quality Index • Models of Tourism Service Quality Index
Aggregation Model

Main Results
The PolyU
Tourism Service Quality Index:
Hong Kong 2012
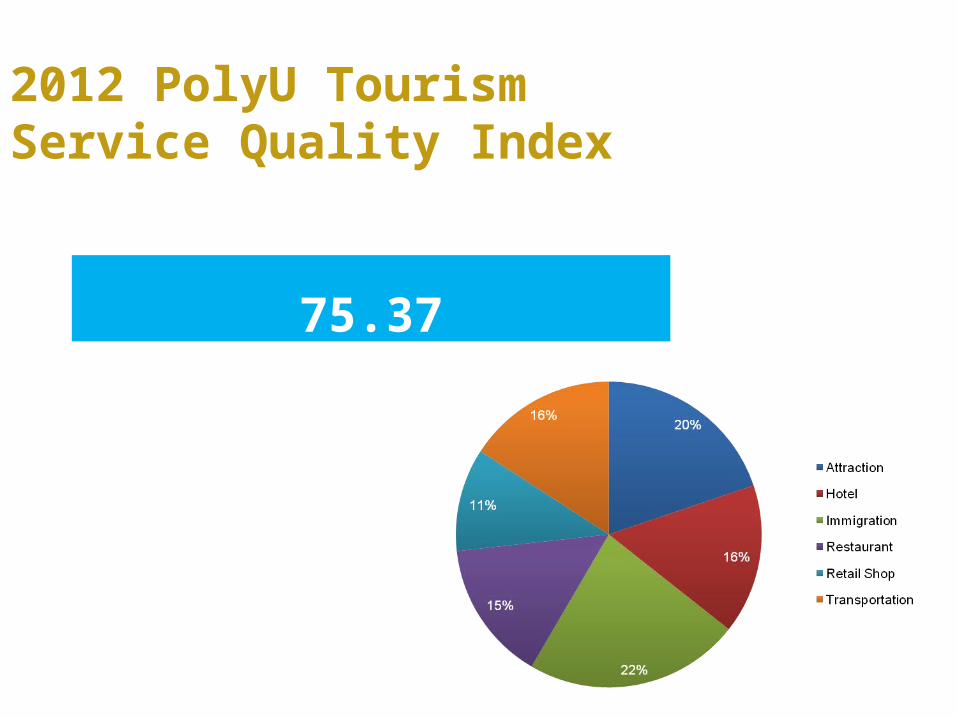
2012 PolyU Tourism Service Quality Index
75.37
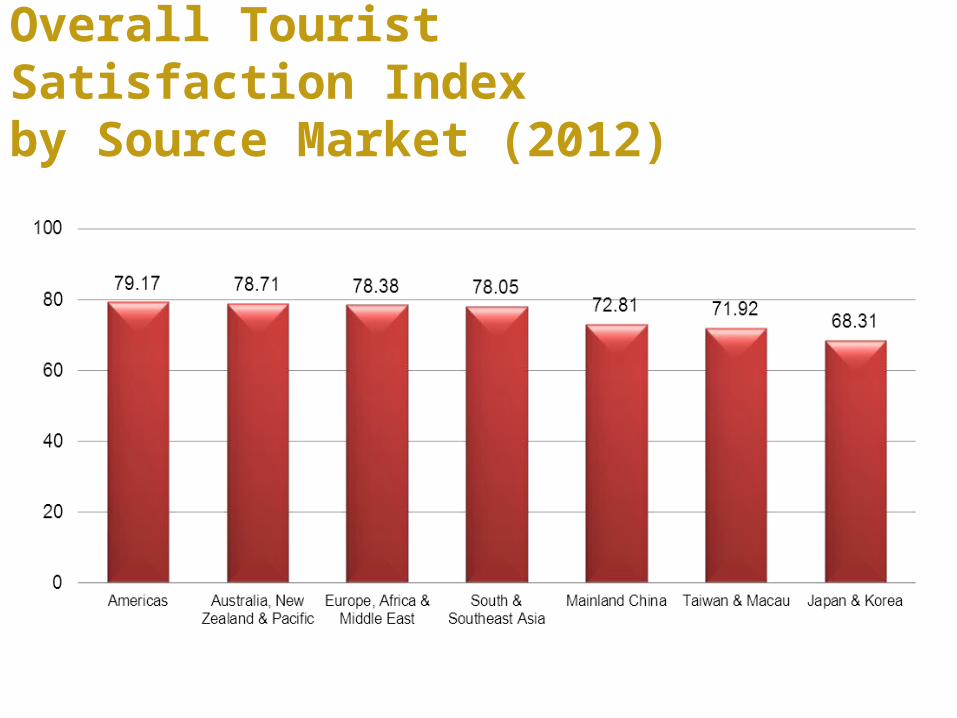
Overall Tourist Satisfaction Index by Source Market (2012)

Overall Tourist Satisfaction Index by Service Sector (2012)
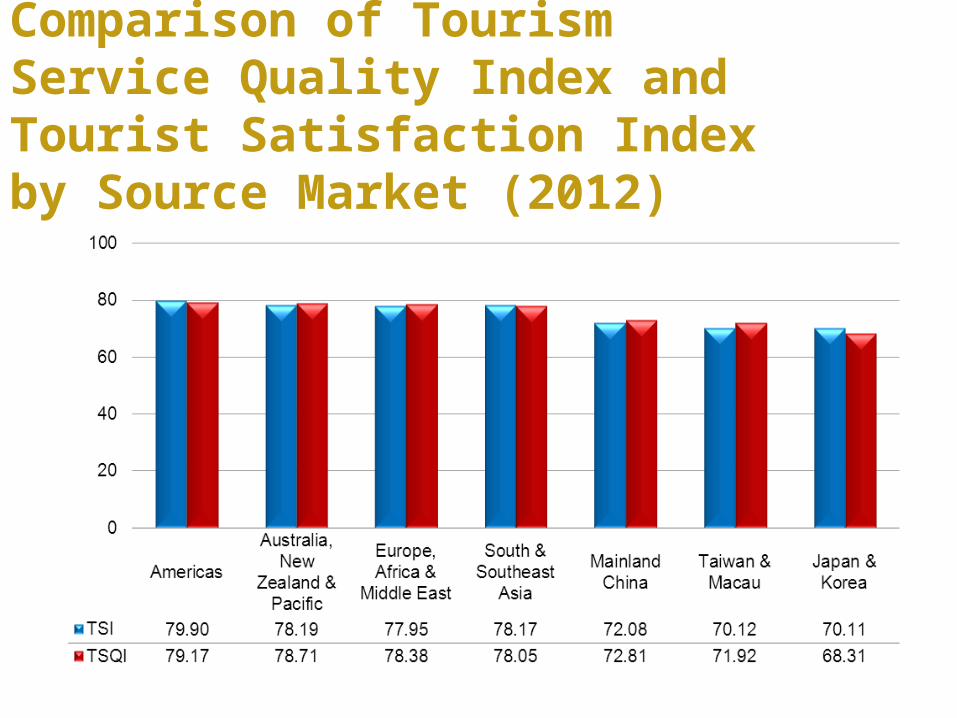
Comparison of Tourism Service Quality Index and Tourist Satisfaction Index by Source Market (2012)
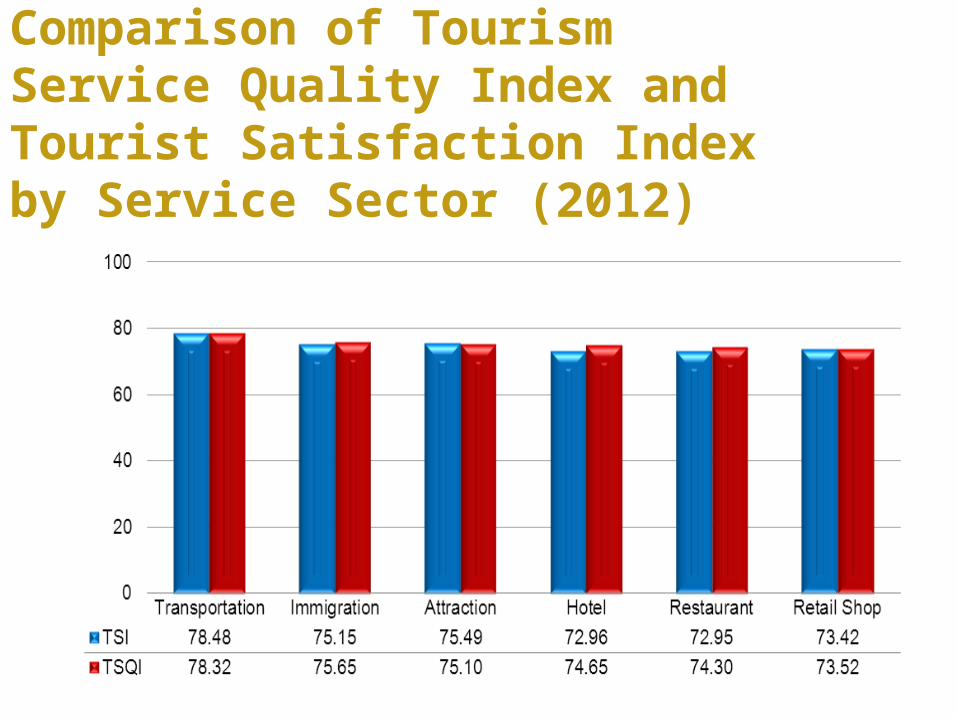
Comparison of Tourism Service Quality Index and Tourist Satisfaction Index by Service Sector (2012)
A systematic approach to assessing Hong Kong’s competitiveness as an international tourism destination.
It can be used as benchmark for tourism related organizations in both private and public sectors.
It is a reliable performance indicator of tourism-related firms, sectors and that of the whole tourism industry, and is useful to monitor the dynamic changes.
Conclusion and Implications
Key Publications Li, G., Song, H., Chen, J. C. and Wu, D. C. (2012). Comparing
Mainland Chinese Tourists’ Satisfaction with Hong Kong and the UK Using Tourist Satisfaction Index. Journal of China Tourism Research, 8: 371–392.
Song, H., van der Veen, R., Li, G. and Chen, J. L. (2012) Hong Kong Tourist Satisfaction Index. Annals of Tourism Research, 39(1): 459-479.
Song, H., Li, G., van der Veen, R. and Chen, J. (2011). Assessing Mainland Chinese Tourists’ Satisfaction with Hong Kong Using the Tourist Satisfaction Index, International Journal of Tourism Research, 13(1): 82-96.
Song, H., Li, G., van der Veen, R. and Chen, J. C. (2009). Assessing Mainland Chinese Tourists’ Satisfaction with Hong Kong Using the Tourist Satisfaction Index, in A. Fyall, M. Kozak, L. Andreu, J. Gnoth and S. S. Lebe (eds). Marketing Innovations for Sustainable Destinations, pp113-122. Oxford: Goodfellow Publishing.

THANK YOU!THANK YOU!
Questions?