Tourism Survey for Andhra Pradesh
122
AC Nielsen ORG-MARG Executive Summary – Tourism Survey For Andhra Pradesh 1.0 1.0 BACKGROUND Ministry of Tourism (Market Research Division) Government of India Tourism Survey for Andhra Pradesh By Final Report
Transcript of Tourism Survey for Andhra Pradesh
AC Nielsen ORG-MARG
Executive Summary – Tourism Survey For Andhra Pradesh
1.0 1.0 BACKGROUND
Ministry of Tourism (Market Research Division)
Government of India
Tourism Survey for Andhra Pradesh
By
Final Report

AC Nielsen ORG-MARG
Executive Summary – Tourism Survey For Andhra Pradesh i
TABLE OF CONTENTS
E.1 Tourism in Andhra Pradesh ii E.2 Research Aim ii E.3 Research Methodology iii E.4 Tourist Destinations Surveyed v E.5 Trends Observed in Andhra Pradesh ix E.6 Sample Distribution among Destinations for Short Survey x E.7 Sample Distribution among Districts for Exit Survey xv E.8 Month Wise Short Survey Sample Covered for the Study xvi
E.9 Month Wise and District Wise Domestic Visitor in Andhra Pradesh (July '09 till June '10) xvii
E.10 Month Wise and District Wise Foreign Visitor in Andhra Pradesh (July '09 till June '10) xviii
E.11 Month Wise and District Wise Total Visitor in Andhra Pradesh (July '09 till June '10) xix
E.12 District Wise Details of Total Number of accommodation Units in Andhra Pradesh xx
Final Report For The State of Andhra Pradesh 1 Annexure 1 : Methodology 26 Annexure 2 : Estimation Procedure 32 Annexure 3 : Questionnaires / Survey Instruments 41 Annexure 4 : Additional Tables 53 Annexure 5 : Supplementary Tables 58
Ministry of Tourism AC Nielsen ORG-MARG Government of India
Executive Summary – Tourism Survey For Andhra Pradesh ii
Executive Summary
E.1 Tourism in Andhra Pradesh
India, a tourism hotspot in the world, has a large bouquet of tourist attractions to
boast of. Its widespread diversity has always attracted both foreigners as well as
its’ own citizens alike, to explore its mirth and gaiety that it has to offer the world.
The fourth largest state in India is famous for the Nizams. The main tourist
attractions are HYDERABAD - The capital city offers an interesting perspective of
a cross culture and historical tradition, the charming city of Charminar and many
more heritage structures. Lakes, rocks, monuments, modern structures.
CHARMINAR-Over 400 years old landmark of Hyderabad, MECCA MASJID-
Largest in Southern India.
HUSSAIN SAGAR- picturesque lake unites the twin cities Hyderabad and
Secunderabad In the middle of the lake is the ‘Rock of Gibraltar, on which stands
the statue of Buddha. GOLCONDA FORT-Golconda is one of the famous Forts
in South India. NAGARJUNASAGAR DAM-The world’s tallest masonry dam.
KANAKADURGA TEMPLE-One of the most important centres mentioned in the
sacred texts is the Kanakandurga Temple. Built atop a hill, the temple is
synonymous with Vijayawada. TIRUPATI-The famous abode of lord
Venkatesvara– Tirumala
Keeping this in mind the Ministry of Ministry of Tourism, Government of India has
awarded ACNielsen ORG-MARG, one of the largest market research and consultancy organizations in this part of the continent, to conduct an study for a period of one year for collection of Tourism Statistics.
E.2 Research Aim
Aim of the proposed research would be to collect relevant tourist related
statistics, from the State of Andhra Pradesh, which would enable analyzing
subtle trends as well as preparation of month wise and annual estimates
separately for foreign and domestic visitors –with a break –up of overnight
tourists & same day visitors for the selected tourist places.

Ministry of Tourism AC Nielsen ORG-MARG Government of India
Executive Summary – Tourism Survey For Andhra Pradesh iii
E.3 Research Methodology
The detailed methodology followed for estimating the total number of domestic
and foreign visitors and tourists to the state of Andhra Pradesh from July 2009 till
June 2010 is given in the Annexure -1 of this report. The estimation procedure
used is given in detail in Annexure – 2 of this report. The Methodology,
Estimation Procedure and the survey instruments were developed by the Maket
Research Division of Ministry of tourism, Government of India.
However, to briefly define the methodology, the various steps of the operational
methodology are given below:-
a. This study was conducted in 34 districts of Andhra Pradesh and at 150
destinations of tourist interest b. Selection of Tourist Destinations and Locations: Important
destinations of tourist attraction and their location in the district were
selected in consultation with the State Tourism Department c. Survey Period: The field survey was conducted for a period of 12
months (July 2009 till June 2010) at selected destinations. In a particular
month at a particular destination the survey was done for 7 days covering
two specified weeks. The details are available at Annexure-1 d. Survey Instruments: The survey instruments or questionnaires given at
Annexure - 3 covers three types of survey, namely, survey at destinations
(Short Survey), survey at exit point(s) (Exit Point Survey) and survey at
accommodation units (AUs) specified briefly below.
e. In total of 4 surveys were conducted for this study. They were:
The Counting Survey: In this survey, head counts were taken at
each tourist destination in the state. This survey was conducted
every month from July 2009 till June 2010
The Short Survey: In this survey, 800 tourists per district were
interviewed at each tourist location and information regarding
tourists’ duration of visit, place of stay, frequency of visit,
nationality/residence state, etc. was collected. This survey was
conducted every month from July 2009 till June 2010

Ministry of Tourism AC Nielsen ORG-MARG Government of India
Executive Summary – Tourism Survey For Andhra Pradesh iv
The Accommodation Survey: In this survey, accommodation
units in the district were visited and information regarding number
of domestic and foreign guests staying, number of bed nights
spent, employee details and residency state/ country of guests
was collected. This survey was done every month from July 2009
till June 2010
The Exit Survey: In this survey, information regarding,
background of tourists, their expenditure, their place of stay,
mode of traveling, etc. were collected. This survey was conducted
on a quarterly basis and 200 tourists or visitors were interviewed
per district each quarter in this survey.
f. Data from all the above surveys were used to calculate the number of
tourists or visitors to the districts and hence to the state of Andhra
Pradesh.

Ministry of Tourism AC Nielsen ORG-MARG Government of India
Executive Summary – Tourism Survey For Andhra Pradesh v
E.4Tourist Destinations Covered The destinations which were included in the study are given below. These
destinations were included, based on secondary research and after discussions with officials from MR division of Ministry of Tourism, Government of India and officials from Andhra Pradesh Tourism Ministry.
Districts Towns Destination
Adilabad Asifabad (CT) Pranahita Bhainsa (NP) Basar Nirmal (M) Kadam Dam Nirmal (M) Pochera falls Nirmal (M) Kuntala falls Nirmal (M) Kawal & Sivaram wildlife sanctuary
Nizamabad Nizamabad (M) Alisagar Nizamabad (M) Sai Baba Temple Nizamabad (M) District Archelogical Museum (Gupta garden) Nizamabad (M) Neelakanteshwara Temple Nizamabad (M) Dichpalli Temple Nizamabad (M) Limbadrigutta Temple Nizamabad (M) Basavalinga Temple Nizamabad (M) Quilla Ramalym Kamareddy (M) Domakonda Fort
Karimnagar Ramagundam (M) Ramagundam Jagtial (M) Dharmapuri Temple Jagtial (M) Jogityal fort Karimnagar (M) Kaleshwaram (Mukteshwara Swamy temple) Karimnagar (M) Ramagiri Fort Sircilla (M) Vemulavada (Sri Raja Rajeshwari temple)
Medak Medak (NP) Edupayalu (Kanaka Durga Temple) Medak (NP) Medak fort Sangareddy (M) Manjira Wildlife & Bird Sanctuary Sangareddy (M) Kondapur
Hyderabad Hyderabad Charminar Hyderabad Golconda Fort Hyderabad/Secunderabad Hussainsagar lake Hyderabad Birla Temple Hyderabad Botanical Gardens Hyderabad Salarjung Hyderabad Shilparamam (Craft village)
Ranga Reddy Ranga Reddy Ramoji film city Ranga Reddy Keesaragutta (35 k.m from Hyderabad)
Mahaboobnagar Mahaboobnagar Mahaboobnagar Narayanpet (NP) Narayanpet (Handloom Saree)
Nalgonda Yadagirigutta (CT) Yadagirigutta(Sri Lakshmi Narasimha Swami Temple)
Bhongir (M) Jain temple at Aler Bhongir (M) Kolanpak Jain Temple

Ministry of Tourism AC Nielsen ORG-MARG Government of India
Executive Summary – Tourism Survey For Andhra Pradesh vi
Districts Towns Destination Nalgonda Bhongir (M) Devarakonda
Bhongir (M) Kisara gutta Nalgonda (M) Panagal (Chaya Someswara Temple) Nalgonda (M) Bhadrachalam Devarakonda (CT) Rajiv Gandhi Wildlife Sanctuary Devarakonda (CT) Nagarjuna konda Devarakonda (CT) Nagarjunasagar Miryalaguda (M) Ethipothala
Warangal Warangal (M Corp.) Warangal fort Warangal (M Corp.) Thoudand pillar Temple Warangal (M Corp.) Sankruti Vihar Warangal (M Corp.) Tadvai Wildlife Sanctuary Warangal (M Corp.) Rammappa Temple Warangal (M Corp.) Eturnagaram Sanctuary Warangal (M Corp.) Ghapur group of temple.
Khammam Khammam (M) Kothagudam Khammam (M) Khammam fort Bhadrachalam (CT) Bhadrachalam ( Sri Sitaramachandra Swamy
Temple) Srikakulam Srikakulam (M) Asasavalli
Srikakulam (M) Kalingapatnam Beach Srikakulam (M) Telineelapuram (Null) Srikakulam (M) Telukunchi bird sanctuaries Srikakulam (M) Srikakulam (Sri Kurmanadha Swamy temple) Srikakulam (M) Salihundam Srikakulam (M) Srimukhalingam Temple
Vizianagaram Bobbili (M) Bobbili Fort Bobbili (M) Ramatheertham Bobbili (M) Punyagiri Vizianagaram (M) Vizianagaram Fort Vizianagaram (M) Thatipuri reservoir Vizianagaram (M) Govindapuram
Visakhapatnam Bheemunipatnam (M) Bheemunipatnam Beach Anakapalle (M) Sankaram Visakhapatnam (M Corp.) Dolphin's Nose Visakhapatnam (M Corp.) Indira Gandhi Zoological park Visakhapatnam (M Corp.) Kailasagiri Visakhapatnam (M Corp.) Lawsons bay Visakhapatnam (M Corp.) Borra Caves (Kirinrandal) Visakhapatnam (M Corp.) Bavikonda Visakhapatnam (M Corp.) Thotlakonda (Mangamaripeta ) Visakhapatnam (M Corp.) Rushikonda Visakhapatnam (M Corp.) Simhachalam (Sri Lakshmi Narasimha Swamy) Visakhapatnam (M Corp.) Tyda Visakhapatnam (M Corp.) Yerramattidibbalu (Bheemunipatnam Beach) Visakhapatnam (M Corp.) Ananthagiri Hills

Ministry of Tourism AC Nielsen ORG-MARG Government of India
Executive Summary – Tourism Survey For Andhra Pradesh vii
Districts Towns Destination Visakhapatnam Visakhapatnam (M Corp.) Araku velly East Godavari Rampachodavaram (CT) Rampachodavaram Water Falls
Rampachodavaram (CT) Maredumilli forests Tuni (M) Annavaram Ramachandrapuram (M) Drakshararamam Rajahmundray (M.Corp.) Rajahmundray Rajahmundray (M.Corp.) Dhawaleshwaram Kakinada (M) Biccavolu Kakinada (M) Papikonda Wild life Sanctuary Kakinada (M) Adurru (Dubaraju Gudi) Kakinada (M) Kakinada Amalapuram (M) Balayogi Gardens Amalapuram Amalapuram (M) Antarvedi
West Godavari Eluru (M) Kolleru Lake Bird Sanctuary Eluru (M) Sri Dwaraka Tirumala (Chinna Tirupati) Eluru (M) Eluru Bhimavaram (M) Gunupudi Someswara Temple Bhimavaram (M) Bhimavaram (Gunupudi Someswara Temple) Narasapur (M) Sri Adikesava Embermannar Swamy Temple Narasapur (M) Perupalem Beach Palacole (M) Ksheera Ramalingeswara Swamy temple
Krishna Vijayawada (M Corp.) Bhavani Island Vijayawada (M Corp.) Gindhi Hill Vijayawada (M Corp.) Hazrat Bal Mosque Vijayawada (M Corp.) Kondapalli fort Vijayawada (M Corp.) Victoria Jubilee Museums Vijayawada (M Corp.) Mogalarajapuram caves Machilipatnam (M) Manginapudi Beach & Machilipatnam
Guntur Narasaraopet (M) Kotappakonda Guntur (M Corp.) Amaravathi Guntur (M Corp.) Peddakani Guntur (M Corp.) Mangalagiri Guntur (M Corp.) Undavalli cave Bapatla (M) Bapatla Beach(Suryalanka)
Prakasam Markapur (M) Markapuram (Sri Chenna Kesava swamy temple)
Chirala (M) Vodarevu Beach Ongole (M) Ongole (Kothapatnam Beach)
Nellore Nellore (M) Koduru Nellore (M) Maipadu Beach Nellore (M) Nelapattu Bird Sanctuary Nellore (M) Udayagiri fort
Cuddapah Jammalamadugu (CT) Gandikota Fort Cuddapah (M) Tallapaka Temple Cuddapah (M) Pushpagiri Temple Cuddapah (M) Chand Phira Gumbadh

Ministry of Tourism AC Nielsen ORG-MARG Government of India
Executive Summary – Tourism Survey For Andhra Pradesh viii
Cuddapah (M) Vontimitta Districts Towns Destination
Cuddapah Cuddapah (M) Sri Venkateswara wild life Sanctuary Cuddapah (M) Sri Lanka Malleswara Wild life Sanctuary Cuddapah (M) Bhagavan Mahavir Government Museum
Kurnool Kurnool (M Corp.) Kurnool Fort Kurnool (M Corp.) Rollapadu Bird Sanctuary Kurnool (M Corp.) Belum Caves Adoni (M) Mantralayam (Raghavendra Swamy Temple) Srisailam Project (Right Flank Colony) Township (CT)
Srisailam-Nagarjuna Sagar Tiger Reserve
Srisailam Project (Right Flank Colony) Township (CT)
Srisailam Temple
Nandyal (M) Sri Lakshmi Narasimha Swamy Temple Nandyal (M) Mahanadi Nandyal (M) Ahobilam ( Sri Lakshmi Narasimha Swamy
Temple) Nandyal (M) Yaganti Caves
Anathapur Rayadurg (M) Rayadurga Fort, Rayadurg Gooty (CT) Gooty Fort Anantapur (M) Thimmamma Marrimanu Dharmavaram (M) Dharmavaram Hindupur (M) Hemavati Hindupur (M) Penukonda fort Hindupur (M) Prasanthinilayam Hindupur (M) Lepakshi (Lord Veerabhadra Temple)
Chittoor Tirupati (M) Goddess Alamelumanga Temple Tirupati (M) Lord Venkateswara Temple Tirupati (M) Chandragiri fort Tirupati (M) Sri Venkateswara Sanctuary Tirupati (M) Kanipakam Madanapalle (M) Talakona Madanapalle (M) Horsley Hills Srikalahasti (M) Srikalahasti Puttur (CT) Nagalapuram Temple Puttur (CT) Narayanavanam Puttur (CT) Kailasanatha kona. Punganur (NP) Kaundinya Wildlife Sanctuary

Ministry of Tourism AC Nielsen ORG-MARG Government of India
Executive Summary – Tourism Survey For Andhra Pradesh ix
E.5 Trends Observed in Tourism in Andhra Pradesh
Total number of tourist / visitor arrivals in the state of Andhra Pradesh during
the period of 1st July 2009 - 30th June 2010 is 7,48,71,378
Out of the total number of visitors, domestic tourists in Andhra Pradesh
account for 99% (7,44,92,309), due to the presence of the religious shrine of
Tirupati in the state, where maximum domestic visitors throng
Total number of foreign tourist arrivals in Andhra Pradesh during the period of
1st July 2009 - 30th June 2010 is 3,79,069. Foreign tourists in Andhra
Pradesh account for only 1% of the total tourists/ visitors to the state
Maximum domestic overnight tourists visited Andhra Pradesh in the month of
October 2009 (38,67,108)
Same day domestic visitors were highest in Andhra Pradesh in the month of
October 2009 (38,77,186)
10% of the total number of domestic visitors/ tourists to the state visit the
state during the month of October
13% of the total foreign tourists to the state visit it during the month of
January
51% of the total domestic visitors to the state visit the district of Chittoor
during the study period. This is due to the presence of the holy shrine of
Tirupati in the district. Hyderabad follows as the next favorite place of visit for
domestic tourists (12%)
77% of the foreign tourists / visitors to the state of Andhra Pradesh visit
Hyderabad. The next favorite is Visakhapatnam (10%)
30% of the domestic overnight visitors/ tourists to the state of Andhra
Pradesh belong to the state of Maharashtra. 15% of domestic overnight
visitors are from Karnataka. This data is from the accommodation survey
22% of the foreign overnight tourists / visitors are from the USA, while 17%
are from United Kingdom. This data is from the accommodation survey
The most visited destination is Tirupati in Chittoor district Amongst different types of packages, both domestic and foreign visitors have
opted more for Travel+Transport+Accommodation+Food packages and have
spent more on this types of packages (on an average)
Ministry of Tourism AC Nielsen ORG-MARG Government of India
Executive Summary – Tourism Survey For Andhra Pradesh x
Accommodation and food ans drinks are the major non-package components
where both domestic and foreign visitors spend more
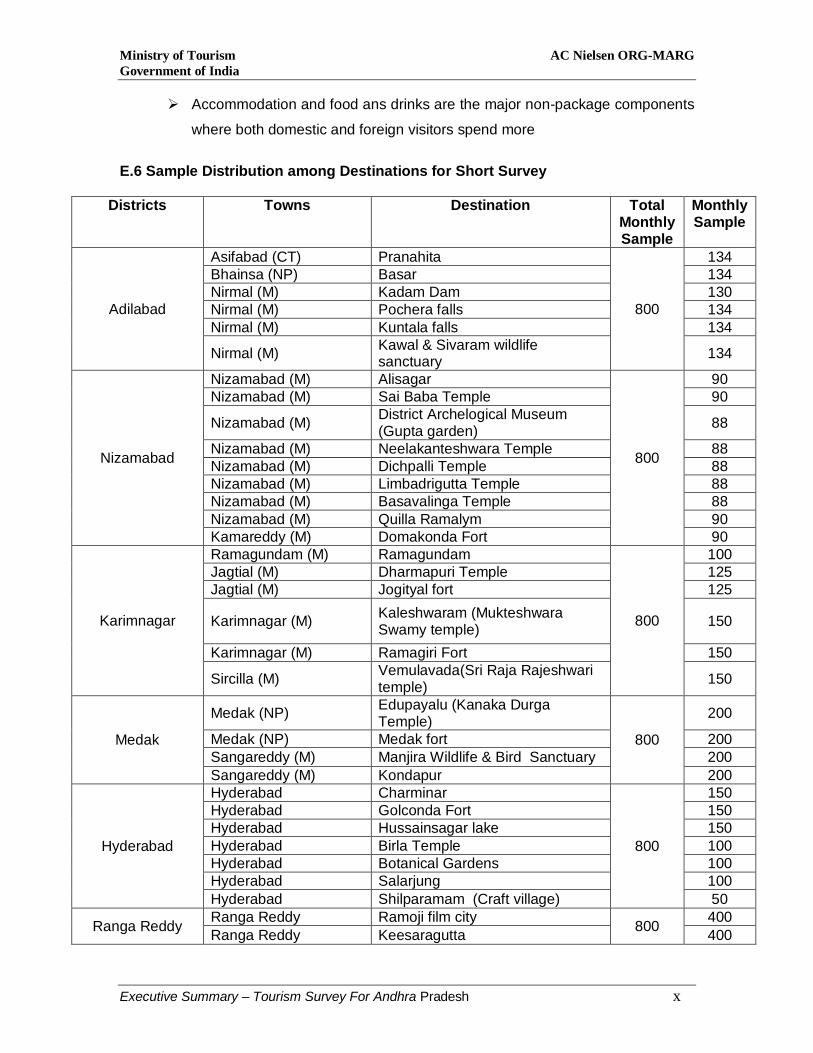
E.6 Sample Distribution among Destinations for Short Survey
Districts Towns Destination Total Monthly Sample
Monthly Sample
Adilabad
Asifabad (CT) Pranahita
800
134 Bhainsa (NP) Basar 134 Nirmal (M) Kadam Dam 130 Nirmal (M) Pochera falls 134 Nirmal (M) Kuntala falls 134
Nirmal (M) Kawal & Sivaram wildlife sanctuary 134
Nizamabad
Nizamabad (M) Alisagar
800
90 Nizamabad (M) Sai Baba Temple 90
Nizamabad (M) District Archelogical Museum (Gupta garden) 88
Nizamabad (M) Neelakanteshwara Temple 88 Nizamabad (M) Dichpalli Temple 88 Nizamabad (M) Limbadrigutta Temple 88 Nizamabad (M) Basavalinga Temple 88 Nizamabad (M) Quilla Ramalym 90 Kamareddy (M) Domakonda Fort 90
Karimnagar
Ramagundam (M) Ramagundam
800
100 Jagtial (M) Dharmapuri Temple 125 Jagtial (M) Jogityal fort 125
Karimnagar (M) Kaleshwaram (Mukteshwara Swamy temple) 150
Karimnagar (M) Ramagiri Fort 150
Sircilla (M) Vemulavada(Sri Raja Rajeshwari temple) 150
Medak
Medak (NP) Edupayalu (Kanaka Durga Temple)
800
200
Medak (NP) Medak fort 200 Sangareddy (M) Manjira Wildlife & Bird Sanctuary 200 Sangareddy (M) Kondapur 200
Hyderabad
Hyderabad Charminar
800
150 Hyderabad Golconda Fort 150 Hyderabad Hussainsagar lake 150 Hyderabad Birla Temple 100 Hyderabad Botanical Gardens 100 Hyderabad Salarjung 100 Hyderabad Shilparamam (Craft village) 50
Ranga Reddy Ranga Reddy Ramoji film city 800 400 Ranga Reddy Keesaragutta 400

Ministry of Tourism AC Nielsen ORG-MARG Government of India
Executive Summary – Tourism Survey For Andhra Pradesh xi
Mahaboobnagar Mahoobnagar Mahoobnagar 800 400 Narayanpet (NP) Narayanpet (Handloom Saree) 400
Nalgonda
Yadagirigutta (CT) Sri Lakshmi Narasimha Swami Temple
800
50
Bhongir (M) Jain temple at Aler 50 Bhongir (M) Kolanpak Jain Temple 50 Bhongir (M) Devarakonda 50 Bhongir (M) Kisara gutta 50
Nalgonda (M) Panagal (Chaya Someswara Temple) 50
Nalgonda (M) Bhadrachalam 100 Devarakonda (CT) Rajiv Gandhi Wildlife Sanctuary 100 Devarakonda (CT) Nagarjuna konda 100 Devarakonda (CT) Nagarjunasagar 100 Miryalaguda (M) Ethipothala 100
Warangal
Warangal (M Corp.) Warangal fort
800
150 Warangal (M Corp.) Thoudand pillar Temple 150 Warangal (M Corp.) Sankruti Vihar 100 Warangal (M Corp.) Tadvai Wildlife Sanctuary 100 Warangal (M Corp.) Rammappa Temple 100 Warangal (M Corp.) Eturnagaram Sanctuary 100 Warangal (M Corp.) Ghapur group of temple. 100
Khammam
Khammam (M) Kothagudam
800
200 Khammam (M) Khammam fort 200
Bhadrachalam (CT) Bhadrachalam ( Sri Sitaramachandra Swamy Temple) 400
Srikakulam
Srikakulam (M) Asasavalli
800
100 Srikakulam (M) Kalingapatnam Beach 150 Srikakulam (M) Telineelapuram (Null) 100 Srikakulam (M) Telukunchi bird sanctuaries 100
Srikakulam (M) Srikakulam (Sri Kurmanadha Swamy temple) 100
Srikakulam (M) Salihundam 100 Srikakulam (M) Srimukhalingam Temple 150
Vizianagaram
Bobbili (M) Bobbili Fort
800
150 Bobbili (M) Ramatheertham 150 Bobbili (M) Punyagiri 100 Vizianagaram (M) Vizianagaram Fort 150 Vizianagaram (M) Thatipuri reservoir 100 Vizianagaram (M) Govindapuram 150
Visakhapatnam
Bheemunipatnam (M) Bheemunipatnam Beach
800
75 Anakapalle (M) Sankaram 50 Visakhapatnam (M Corp.) Dolphin's Nose 50
Visakhapatnam (M Corp.) Indira Gandhi Zoological park 50
Visakhapatnam (M Corp.) Kailasagiri 50

Ministry of Tourism AC Nielsen ORG-MARG Government of India
Executive Summary – Tourism Survey For Andhra Pradesh xii
Visakhapatnam (M Corp.) Lawsons bay 75
Visakhapatnam (M Corp.) Borra Caves (Kirinrandal) 50
Visakhapatnam (M Corp.) Bavikonda 50
Visakhapatnam (M Corp.) Thotlakonda (Mangamaripeta ) 50
Visakhapatnam (M Corp.) Rushikonda 50
Visakhapatnam (M Corp.)
Simhachalam (Sri Lakshmi Narasimha Swamy) 50
Visakhapatnam (M Corp.) Tyda 50
Visakhapatnam (M Corp.)
Yerramattidibbalu (Bheemunipatnam Beach) 50
Visakhapatnam (M Corp.) Ananthagiri Hills 50
Visakhapatnam (M Corp.) Araku velly 50
East Godavari
Rampachodavaram (CT) Rampachodavaram Water Falls
800
75
Rampachodavaram (CT) Maredumilli forests 75
Tuni (M) Annavaram 50 Ramachandrapuram (M) Drakshararamam 50
Rajahmundray (M.Corp.) Rajahmundray 75
Rajahmundray (M.Corp.) Dhawaleshwaram 50
Kakinada (M) Biccavolu 75 Kakinada (M) Papikonda Wild life Sanctuary 75 Kakinada (M) Adurru (Dubaraju Gudi) 50 Kakinada (M) Kakinada 75 Amalapuram (M) Balayogi Gardens Amalapuram 75 Amalapuram (M) Antarvedi 75
West Godavari
Eluru (M) Kolleru Lake Bird Sanctuary
800
100
Eluru (M) Sri Dwaraka Tirumala (Chinna Tirupati) 100
Eluru (M) Eluru 100 Bhimavaram (M) Gunupudi Someswara Temple 100 Bhimavaram (M) Bhimavaram 100
Narasapur (M) Sri Adikesava Embermannar Swamy Temple 100
Narasapur (M) Perupalem Beach 100
Palacole (M) Ksheera Ramalingeswara Swamy temple 100

Ministry of Tourism AC Nielsen ORG-MARG Government of India
Executive Summary – Tourism Survey For Andhra Pradesh xiii
Krishna
Vijayawada (M Corp.) Bhavani Island
800
125 Vijayawada (M Corp.) Gindhi Hill 100 Vijayawada (M Corp.) Hazrat Bal Mosque 125 Vijayawada (M Corp.) Kondapalli fort 125 Vijayawada (M Corp.) Victoria Jubilee Museums 125 Vijayawada (M Corp.) Mogalarajapuram caves 100
Machilipatnam (M) Manginapudi Beach & Machilipatnam 100
Guntur
Narasaraopet (M) Kotappakonda
800
150 Guntur (M Corp.) Amaravathi 100 Guntur (M Corp.) Peddakani 150 Guntur (M Corp.) Mangalagiri 100 Guntur (M Corp.) Undavalli cave 150 Bapatla (M) Bapatla Beach(Suryalanka) 150
Prakasam Markapur (M) Markapuram
800 200
Chirala (M) Vodarevu Beach 300 Ongole (M) Ongole (Kothapatnam Beach) 300
Nellore
Nellore (M) Koduru
800
200 Nellore (M) Maipadu Beach 200 Nellore (M) Nelapattu Bird Sanctuary 200 Nellore (M) Udayagiri fort 200
Cuddapah
Jammalamadugu (CT) Gandikota Fort
800
100 Cuddapah (M) Tallapaka Temple 100 Cuddapah (M) Pushpagiri Temple 100 Cuddapah (M) Chand Phira Gumbadh 100 Cuddapah (M) Vontimitta 100
Cuddapah (M) Sri Venkateswara wild life Sanctuary 100
Cuddapah (M) Sri Lanka Malleswara Wild life Sanctuary 100
Cuddapah (M) Bhagavan Mahavir Government Museum 100
Kurnool
Kurnool (M Corp.) Kurnool Fort
800
100 Kurnool (M Corp.) Rollapadu Bird Sanctuary 75 Kurnool (M Corp.) Belum Caves 75 Adoni (M) Mantralayam 100
Srisailam Project Srisailam-Nagarjuna Sagar Tiger Reserve 75
Srisailam Project Srisailam Temple 75
Nandyal (M) Sri Lakshmi Narasimha Swamy Temple 75
Nandyal (M) Mahanadi 75
Nandyal (M) Ahobilam ( Sri Lakshmi Narasimha Swamy Temple) 75
Nandyal (M) Yaganti Caves 75 Anathapur Rayadurg (M) Rayadurga Fort, Rayadurg 800 100
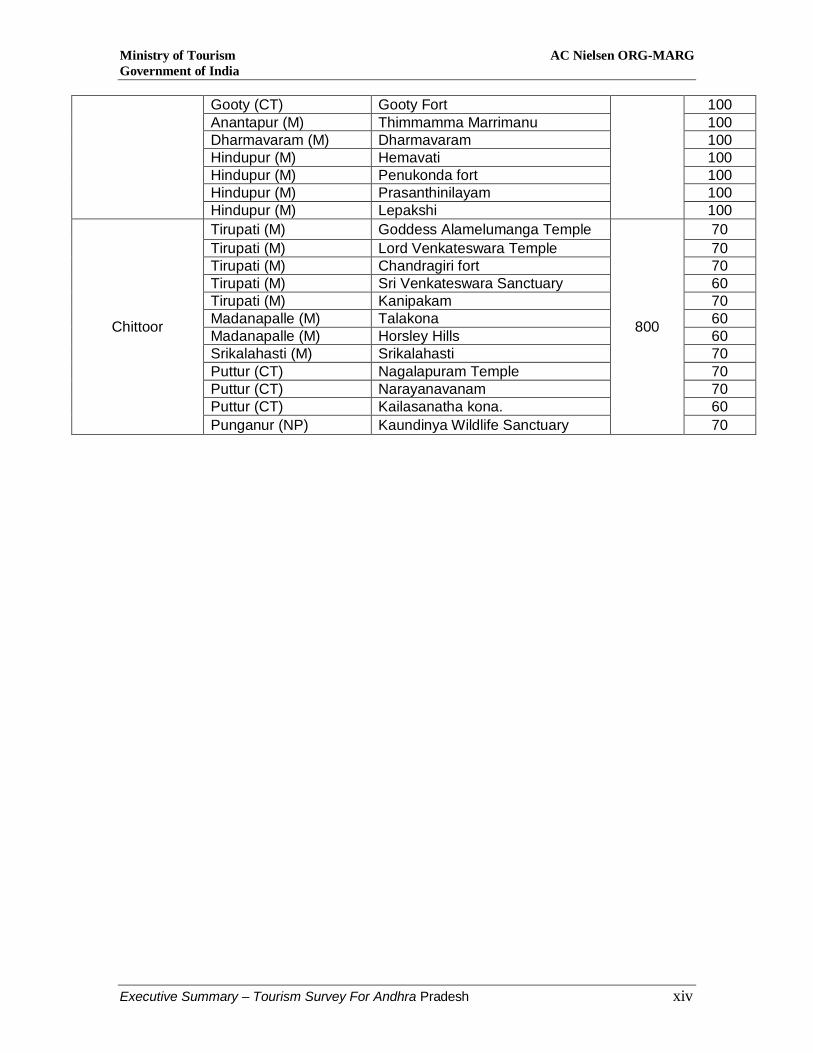
Ministry of Tourism AC Nielsen ORG-MARG Government of India
Executive Summary – Tourism Survey For Andhra Pradesh xiv
Gooty (CT) Gooty Fort 100 Anantapur (M) Thimmamma Marrimanu 100 Dharmavaram (M) Dharmavaram 100 Hindupur (M) Hemavati 100 Hindupur (M) Penukonda fort 100 Hindupur (M) Prasanthinilayam 100 Hindupur (M) Lepakshi 100
Chittoor
Tirupati (M) Goddess Alamelumanga Temple
800
70 Tirupati (M) Lord Venkateswara Temple 70 Tirupati (M) Chandragiri fort 70 Tirupati (M) Sri Venkateswara Sanctuary 60 Tirupati (M) Kanipakam 70 Madanapalle (M) Talakona 60 Madanapalle (M) Horsley Hills 60 Srikalahasti (M) Srikalahasti 70 Puttur (CT) Nagalapuram Temple 70 Puttur (CT) Narayanavanam 70 Puttur (CT) Kailasanatha kona. 60 Punganur (NP) Kaundinya Wildlife Sanctuary 70

Ministry of Tourism AC Nielsen ORG-MARG Government of India
Executive Summary – Tourism Survey For Andhra Pradesh xv
E.7 Sample Distribution among Districts for the Exit Survey
The sample size for each district to be covered in the Exit Survey was 800. Out of this 400 Domestic tourists and 400 Foreign Tourists were to be interviewed. The distribution of tourists interviewed in the Exit survey for each of the 4 Quarters (July 2009, October 2009, January 2010 and April 2010) is given below.
District July October January April Total Gross
Total Domestic Foreign Domestic Foreign Domestic Foreign Domestic Foreign Domestic Foreign Adilabad 200 0 196 4 200 0 112 4 792 8 800 Nizamabad 200 0 200 0 200 0 200 0 800 0 800 Karimnagar 200 0 200 0 200 0 200 0 800 0 800 Medak 200 0 200 0 200 0 200 0 800 0 800 Hyderabad 162 38 135 65 148 52 143 57 588 212 800 Ranga Reddy 200 0 188 12 200 0 188 12 776 24 800 Mahaboobnagar 200 0 200 0 200 0 200 0 800 0 800 Nalgonda 200 0 200 0 200 0 200 0 800 0 800 Warangal 200 0 200 0 200 0 200 0 800 0 800 Khammam 200 0 200 0 200 0 200 0 800 0 800 Srikakulam 200 0 200 0 200 0 200 0 800 0 800 Vizianagaram 200 0 200 0 200 0 200 0 800 0 800 Visakhapatnam 192 8 177 23 157 43 187 13 687 113 800 East Godavari 200 0 179 21 185 15 183 17 747 53 800 West Godavari 188 12 179 21 190 10 200 0 757 43 800 Krishna 200 0 200 0 200 0 200 0 800 0 800 Guntur 200 0 195 5 200 0 200 0 795 5 800 Prakasam 200 0 200 0 200 0 200 0 800 0 800 Nellore 200 0 200 0 200 0 200 0 800 0 800 Cuddapah 200 0 197 3 200 188 12 785 15 800 Kurnool 200 0 200 0 200 0 200 0 800 0 800 Anathapur 200 0 200 0 200 0 200 0 800 0 800 Chittoor 200 55 196 39 200 13 58 20 673 127 800 TOTAL 2800 0 2800 0 2800 0 2800 0 17800 600 18400

Ministry of Tourism AC Nielsen ORG-MARG Government of India
Executive Summary – Tourism Survey For Andhra Pradesh xvi
E.8 Month Wise Short Survey Sample Covered For the Study
Andhra Pradesh Month July August September October November December January February March April May June Aggregate Sample Size 15209 14789 17749 16311 16184 16508 17233 18250 16580 16202 17525 17105
Overnight Tourists
Foreigner 1% 2% 1% 1% 2% 2% 1% 1% 1% 1% 1% 1% Domestic (from within the state) 8% 11% 29% 25% 4% 26% 33% 31% 29% 21% 16% 10% Domestic (from outside the state) 21% 27% 22% 14% 20% 27% 30% 27% 27% 29% 30% 24%
Same Day Visitor
Foreigner 0% 0% 0% 0% 0% 0% 0% 0% 0% 0% 0% 0% Domestic (from within the state) 61% 50% 48% 57% 71% 43% 35% 39% 40% 47% 52% 60% Domestic (from outside the state) 8% 9% 0% 3% 2% 0% 1% 0% 3% 2% 1% 5%

Ministry of Tourism AC Nielsen ORG-MARG Government of India
Executive Summary – Tourism Survey For Andhra Pradesh xvii
E.9 Month Wise and District Wise Domestic Visitor in Andhra Pradesh (July ’09 till June’10)
District July August September October Nov Dec January February March April May June Total Adilabad 9391 13312 16620 42266 46664 32686 44203 27478 20773 19880 18574 17172 309020 Nizamabad 91813 67958 85971 70913 85544 68997 75295 94304 77332 73885 70662 67882 930557 Karimnagar 198414 25114 32176 119108 121098 95687 98119 103105 80694 77362 68837 56928 1076643 Medak 7339 13249 15464 24919 25089 22386 22907 38253 24752 22892 16422 15134 248807 Hyderabad 854340 436881 413578 529437 589741 592461 723332 733994 912238 869841 959609 1020757 8636207 Ranga Reddy 57251 199670 175722 308025 343040 291751 139604 200629 83444 71203 77200 73680 2021217 Mahaboobnagar 88372 61736 67846 25937 23684 19442 21703 19055 14756 14094 12868 10582 380077 Nalgonda 77428 66725 78225 88248 84663 47099 53631 59488 65009 61037 58757 67472 807782 Warangal 267020 30657 37184 48501 43686 35938 52061 168173 80897 72176 80504 80232 997028 Khammam 57847 25230 31514 25657 25276 20744 25041 43280 38978 37030 36903 35588 403088 Srikakulam 30779 86435 89565 63236 72085 46616 49588 49590 30954 28344 24233 18394 589819 Vizianagaram 74152 124342 84085 114336 114316 141271 128337 29916 34069 32767 28011 25435 931037 Visakhapatnam 446732 398785 383672 532016 608481 411055 404374 367438 566345 567861 546625 499806 5733190 East Godavari 115706 215083 248402 208946 221544 243168 273709 237557 130845 281627 288036 276839 2741464 West Godavari 54203 141514 144097 149727 151330 180586 198134 129896 112367 208987 214830 170320 1855993 Krishna 187707 164052 145974 232382 191117 217641 212061 180219 173261 155794 170629 164896 2195732 Guntur 30499 48987 52191 120651 124210 135672 140817 91695 82891 80777 83830 82926 1075145 Prakasam 28196 14011 12486 22944 17769 19518 19343 17019 25323 27641 26674 21454 252378 Nellore 39808 32615 35795 66420 50258 72669 100187 83159 66891 71268 66249 65372 750690 Cuddapah 31406 52669 61050 155936 157388 145590 151855 46825 41767 30103 28921 31171 934682 Kurnool 110146 70364 73230 73708 70839 88170 94122 53436 61290 51883 58340 61170 866698 Anathapur 46576 200145 209155 188731 194323 260939 288898 162627 253831 257653 261611 261070 2585560 Chittoor 2840253 3403011 3242226 4532248 3631183 3242283 2838547 2686497 2653170 3069840 3069615 2960623 38169496 TOTAL 5745379 5892545 5736229 7744294 6993325 6432369 6155869 5623634 5631877 6183946 6267938 6084904 74492309

Ministry of Tourism AC Nielsen ORG-MARG Government of India
Executive Summary – Tourism Survey For Andhra Pradesh xviii
E.10 Month Wise and District Wise Foreign Visitor in Andhra Pradesh (July ’09 till June’10)
District July August September October November December January February March April May June Total Adilabad 9 0 10 16 27 125 71 2 0 0 0 0 261 Nizamabad 41 21 86 0 0 221 19 22 12 0 0 0 420 Karimnagar 0 0 0 0 0 65 2 0 0 0 0 0 67 Medak 0 0 0 43 0 132 4 0 7 6 4 0 196 Hyderabad 22916 22525 23850 20949 24126 29426 38758 36197 20130 18102 17226 16263 290466 Ranga Reddy 0 0 747 0 0 583 970 261 644 175 302 218 3899 Mahaboobnagar 12 0 0 0 4 0 0 0 0 0 0 0 15 Nalgonda 0 0 30 175 145 713 95 22 11 7 9 6 1213 Warangal 223 68 93 0 0 1 82 52 18 12 7 0 556 Khammam 6 7 29 0 0 0 0 0 0 0 0 0 42 Srikakulam 41 45 57 0 0 93 2 68 28 26 0 0 361 Vizianagaram 30 14 0 14 19 52 35 24 5 6 1 0 199 Visakhapatnam 2935 3370 3055 5679 5968 5835 3718 2236 1736 1544 1719 1838 39632 East Godavari 130 467 230 571 599 778 102 55 30 20 35 11 3027 West Godavari 7 0 94 65 75 834 49 2 3 0 0 0 1128 Krishna 16 0 84 479 509 885 971 68 49 18 13 8 3101 Guntur 59 44 13 18 30 59 53 52 47 2 5 10 391 Prakasam 0 0 7 11 39 39 10 0 0 0 0 0 107 Nellore 42 50 70 30 38 28 2 88 24 4 2 0 378 Cuddapah 0 0 11 40 32 0 0 29 16 3 0 0 132 Kurnool 9 0 23 10 12 164 153 22 14 5 1 0 413 Anathapur 0 107 170 650 705 734 624 367 459 587 821 895 6120 Chittoor 3097 2675 1292 2525 5200 4488 3381 2385 1590 142 91 78 26945 TOTAL 29572 29394 29950 31273 37527 45255 49101 41954 24821 20660 20236 19327 379069
Ministry of Tourism AC Nielsen ORG-MARG Government of India
Executive Summary – Tourism Survey For Andhra Pradesh xix
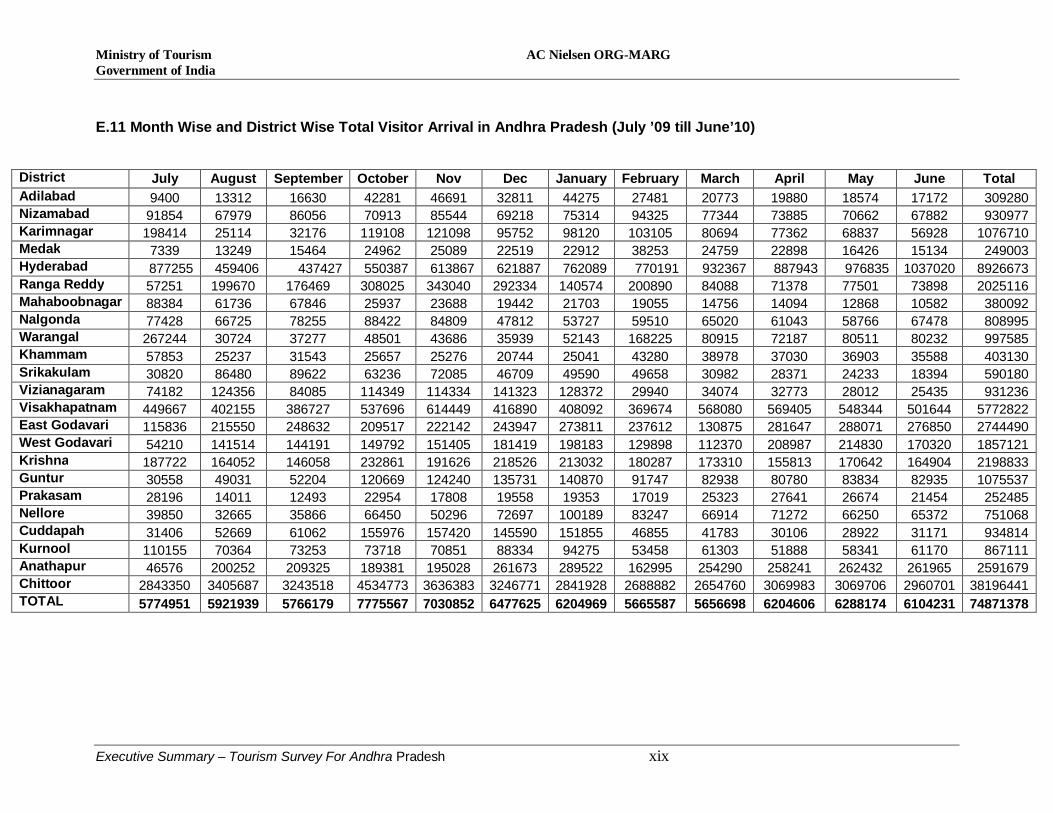
E.11 Month Wise and District Wise Total Visitor Arrival in Andhra Pradesh (July ’09 till June’10)
District July August September October Nov Dec January February March April May June Total Adilabad 9400 13312 16630 42281 46691 32811 44275 27481 20773 19880 18574 17172 309280 Nizamabad 91854 67979 86056 70913 85544 69218 75314 94325 77344 73885 70662 67882 930977 Karimnagar 198414 25114 32176 119108 121098 95752 98120 103105 80694 77362 68837 56928 1076710 Medak 7339 13249 15464 24962 25089 22519 22912 38253 24759 22898 16426 15134 249003 Hyderabad 877255 459406 437427 550387 613867 621887 762089 770191 932367 887943 976835 1037020 8926673 Ranga Reddy 57251 199670 176469 308025 343040 292334 140574 200890 84088 71378 77501 73898 2025116 Mahaboobnagar 88384 61736 67846 25937 23688 19442 21703 19055 14756 14094 12868 10582 380092 Nalgonda 77428 66725 78255 88422 84809 47812 53727 59510 65020 61043 58766 67478 808995 Warangal 267244 30724 37277 48501 43686 35939 52143 168225 80915 72187 80511 80232 997585 Khammam 57853 25237 31543 25657 25276 20744 25041 43280 38978 37030 36903 35588 403130 Srikakulam 30820 86480 89622 63236 72085 46709 49590 49658 30982 28371 24233 18394 590180 Vizianagaram 74182 124356 84085 114349 114334 141323 128372 29940 34074 32773 28012 25435 931236 Visakhapatnam 449667 402155 386727 537696 614449 416890 408092 369674 568080 569405 548344 501644 5772822 East Godavari 115836 215550 248632 209517 222142 243947 273811 237612 130875 281647 288071 276850 2744490 West Godavari 54210 141514 144191 149792 151405 181419 198183 129898 112370 208987 214830 170320 1857121 Krishna 187722 164052 146058 232861 191626 218526 213032 180287 173310 155813 170642 164904 2198833 Guntur 30558 49031 52204 120669 124240 135731 140870 91747 82938 80780 83834 82935 1075537 Prakasam 28196 14011 12493 22954 17808 19558 19353 17019 25323 27641 26674 21454 252485 Nellore 39850 32665 35866 66450 50296 72697 100189 83247 66914 71272 66250 65372 751068 Cuddapah 31406 52669 61062 155976 157420 145590 151855 46855 41783 30106 28922 31171 934814 Kurnool 110155 70364 73253 73718 70851 88334 94275 53458 61303 51888 58341 61170 867111 Anathapur 46576 200252 209325 189381 195028 261673 289522 162995 254290 258241 262432 261965 2591679 Chittoor 2843350 3405687 3243518 4534773 3636383 3246771 2841928 2688882 2654760 3069983 3069706 2960701 38196441 TOTAL 5774951 5921939 5766179 7775567 7030852 6477625 6204969 5665587 5656698 6204606 6288174 6104231 74871378

Ministry of Tourism AC Nielsen ORG-MARG Government of India
Executive Summary – Tourism Survey For Andhra Pradesh xx
E.12 District Wise Details of Total Number of Accommodation Units in Andhra Pradesh: # This does not include Company Guest houses, Guest houses run by trusts, Dormitories, free dharamshalas, tourist bunglows and free accommodation units in the state of Andhra Pradesh.
DISTRICT TOWN Total Accommodation
Units
Total Rooms
ADILABAD ADILABAD 10 212 ANANTAPUR ANANTAPUR 33 850 CHITTOR TIRUPATI 199 4438 CUDDAPAH CUDDAPAH 17 363 EAST GODAVARI RAJAHMUNDRY 23 511 GUNTUR GUNTUR 42 811
HYDERABAD HYDERABAD 456 6975 SECUNDERABAD 6273
KARIMNAGAR KARIMNAGAR 23 1988 KHAMMAM KHAMMAM 15 1185 KRISHNA VIJAYAWADA 107 2194 KURNOOL KURNOOL 27 688 MEDAK MEDAK 6 68 MEHBOOBNAGAR MEHBOOBNAGAR 11 278 NALGONDA NALGONDA 12 435 NELLORE NELLORE 43 955 NIZAMABAD NIZAMABAD 22 2846 PRAKASAM ONGOLE 18 417 RANGAREDDY RANGAREDDY 11 466 SRIKAKULAM SRIKAKULAM 119 261 VISAKHAPATNAM VISAKHAPATNAM 19 3634 VIZIANAGARAM VIZIANAGARAM 53 285 WARANGAL WARANGAL 17 766 WEST GODAVARI BHIMAVARAM 10 284
TOTAL 1283 37183

Ministry of Tourism AC Nielsen ORG-MARG Government of India
Final Report for Andhra Pradesh – Tourism Survey 1
ADILABAD
ANDHRA PRADESH

Ministry of Tourism AC Nielsen ORG-MARG Government of India
Final Report for Andhra Pradesh – Tourism Survey 2
Table – 1
Total number of visits to Tourist Destinations by Domestic and Foreign Leisure Visitors
Andhra Pradesh
No. of visits by Domestic Tourists / Same Day Visitors
No of visits by Foreign Tourists / Same Day Visitor
Overnight Tourists
Same Day Visitors Total Overnight
Tourists Same Day
Visitors Total
Month (1) (2) (3) (4) (5) (6) (7)
July’09 1382250 4741873 6124123 63703 0 63703 August’09 1340234 4711968 6052202 62625 0 62625 September’09 1221470 4618574 5840043 63235 0 63235 October’09 1362590 4252693 5615283 23681 0 23681 November’09 1273613 3857229 5130842 28812 0 28812 December’09 1525634 3186279 4711913 35240 156 35396 January’10 2216105 4343486 6559591 114110 0 114110 February’10 1814908 4185515 6000423 83242 0 83242 March’10 1687656 4645381 6333038 48842 0 48842 April’10 1863558 5099056 6962614 43307 0 43307 May’10 1994113 5162967 7157080 41902 0 41902 June’10 2058777 4999381 7058158 39956 0 39956
Total 19740908 53804402 73545310 648655 156 648811
As inferred from the table above the maximum no. of visits by domestic leisure visitors to tourist destinations in Andhra Pradesh have been in the months of May –July and Jan - April. As far as foreign leisure tourists are concerned, maximum no. of visits to tourist destinations in Andhra Pradesh is in the month January.

Ministry of Tourism AC Nielsen ORG-MARG Government of India
Final Report for Andhra Pradesh – Tourism Survey 3
Table – 2 Total number of Domestic and Foreign Leisure Tourists / Same Day Visitors
Andhra Pradesh
No. Domestic Tourists / Visitor No of Foreign Tourists / Visitor Overnight Tourists
Same Day Visitors Total Overnight
Tourists Same Day
Visitors Total
Month (1) (2) (3) (4) (5) (6) (7)
July’09 597262 2216365 2813627 18841 0 18841 August’09 629981 2313779 2943760 18627 0 18627 September’09 598131 2254362 2852494 18885 0 18885 October’09 800828 3238147 4038975 18374 0 18374 November’09 719594 2892745 3612339 22700 0 22700 December’09 900018 2400820 3300838 26876 113 26989 January’10 918246 2219191 3137437 26446 0 26446 February’10 706081 2142775 2848855 21408 0 21408 March’10 624620 2322823 2947443 13214 0 13214 April’10 665817 2633254 3299071 12426 0 12426 May’10 706108 2637447 3343555 12354 0 12354 June’10 726908 2521940 3248848 11903 0 11903 Total 8593594 29793648 38387242 222053 113 222166
The maximum no. of domestic leisure visitors to Andhra Pradesh are spread across the months of October – December and April - June. For foreign leisure visitors to Andhra Pradesh, November December and January have been the preferred months for visit.
Table – 3 Total Number of Leisure and Non-Leisure Domestic Tourists and Same Day Visitors Andhra Pradesh No. of Over night Tourists No. of Same Day Visitors
Month Leisure Non Leisure
Total (col.2+3) Leisure Non
Leisure Total
(col.5+6) (1) (2) (3) (4) (5) (6) (7)
July’09 597262 2353686 2950948 2216365 578067 2794431 August’09 629981 2421929 3051910 2313779 526856 2840635 September’09 598131 2361124 2959256 2254362 522611 2776973 October’09 800828 3066280 3867108 3238147 639039 3877186 November’09 719594 2759036 3478631 2892745 621949 3514694 December’09 900018 2577028 3477046 2400820 554503 2955324 January’10 918246 2455735 3373981 2219191 562697 2781887 February’10 706081 2227206 2933287 2142775 547572 2690347 March’10 624620 2157274 2781894 2322823 527161 2849984 April’10 665817 2253354 2919171 2633254 631521 3264775 May’10 706108 2283854 2989962 2637447 640529 3277976 June’10 726908 2220505 2947413 2521940 615550 3137491
Total 8593594 29137013 37730607 29793648 6968054 36761702 Considering both leisure as well as non-leisure domestic tourists to Andhra Pradesh, the maximum no. of overnight visitors are in the period October -January. A majority of the same day visitors visited Andhra Pradesh in the months of September, October and November.

Ministry of Tourism AC Nielsen ORG-MARG Government of India
Final Report for Andhra Pradesh – Tourism Survey 4
Table – 4 Total Number of Leisure and Non-Leisure Foreign Tourists and Day Visitors
Andhra Pradesh No. of Over night Tourists No. of Same Day Visitors
Month Leisure Non Leisure
Total (col.2+3) Leisure Non
Leisure Total
(col.5+6) (1) (2) (3) (4) (5) (6) (7)
July’09 18841 10731 29572 0 0 0 August’09 18627 10766 29394 0 0 0 September’09 18885 11064 29950 0 0 0 October’09 18374 12900 31273 0 0 0 November’09 22700 14827 37527 0 0 0 December’09 26876 18266 45142 113 0 113 January’10 26446 22655 49101 0 0 0 February’10 21408 20546 41954 0 0 0 March’10 13214 11607 24821 0 0 0 April’10 12426 8234 20660 0 0 0 May’10 12354 7883 20236 0 0 0 June’10 11903 7424 19327 0 0 0
Total 222053 156903 378956 113 0 113
Considering both leisure as well as non-leisure foreign tourists to Andhra Pradesh, the maximum no. of overnight visitors are in the months of December and January.
Table – 5
Total Number of Domestic and Foreign Tourists and Day Visitors Andhra Pradesh No. of Tourists No. of Day Visitors
Month Domestic Foreign Total (col.2+3) Domestic Foreign Total
(col.5+6) (1) (2) (3) (4) (5) (6) (7)
July’09 2950948 29572 2980520 2794431 0 2794431 August’09 3051910 29394 3081303 2840635 0 2840635 September’09 2959256 29950 2989205 2776973 0 2776973 October’09 3867108 31273 3898382 3877186 0 3877186 November’09 3478631 37527 3516158 3514694 0 3514694 December’09 3477046 45142 3522188 2955324 113 2955437 January’10 3373981 49101 3423082 2781887 0 2781887 February’10 2933287 41954 2975241 2690347 0 2690347 March’10 2781894 24821 2806715 2849984 0 2849984 April’10 2919171 20660 2939832 3264775 0 3264775 May’10 2989962 20236 3010198 3277976 0 3277976 June’10 2947413 19327 2966740 3137491 0 3137491
Total 37730607 378957 38109564 36761703 113 36761815
Collating the findings of the previous tables, the total no. of domestic and foreign overnight tourists are most in the months of October - January. The total no. of domestic day visitors to Andhra Pradesh is most in the month of October and November.

Ministry of Tourism AC Nielsen ORG-MARG Government of India
Final Report for Andhra Pradesh – Tourism Survey 5
Table – 6 Distribution of Domestic and Foreign Tourists by place of Stay
The above table presents the distribution of domestic and foreign tourists, visiting Andhra Pradesh, by place of stay. As we can see the maximum no. of domestic visitors (19,839,166) to Andhra Pradesh are staying at hotels, followed by friends & relatives place (10,340,353). All the sample foreign tourists stayed at hotels during their visit to Andhra Pradesh.
Andhra Pradesh
No. Domestic Tourists No of Foreign Tourists Staying
at Hotels Staying
with F&R Staying elsewhe
re
Total (col.2+3+4)
Staying at
Hotels
Staying with F&R
Staying
elsewhere
Total (col.6+7
+8)
Month(1) (2) (3) (4) (5) (6) (7) (8) (9) July’09 1349916 922366 678666 2950948 29572 0 0 29572 August’09 1420981 961204 669725 3051910 29394 0 0 29394 September’09 1425891 916519 616846 2959256 29950 0 0 29950 October’09 1916781 1106426 843901 3867108 31273 0 0 31273 November’09 1800588 882514 795529 3478631 37527 0 0 37527 December’09 1826722 923537 726787 3477046 45142 0 0 45142 January’10 1946531 869103 558347 3373981 49101 0 0 49101 February’10 1672703 728167 532417 2933287 41954 0 0 41954 March’10 1556072 716053 509769 2781894 24821 0 0 24821 April’10 1613432 772901 532839 2919171 20660 0 0 20660 May’10 1664105 778980 546877 2989962 20236 0 0 20236 June’10 1645444 762583 539386 2947413 19327 0 0 19327 Total 19839166 10340353 7551089 37730607 378957 0 0 378957

Ministry of Tourism AC Nielsen ORG-MARG Government of India
Final Report for Andhra Pradesh – Tourism Survey 6
Table – 7 Country wise Total Number of Foreign Tourists/ Same Day Visitors
The above table gives an estimate of visitors to Andhra Pradesh from different countries. As evident from the table ratio is highest for UK, followed by USA and Australia, which implies foreign visitors from these countries are maximum.
Andhra Pradesh Estimated No. of Visitors (Non-
Leisure)
Estmatied No. of Visitors (Lesiure)
Estimated Total Visitors
Ratio
County of Origin
(1) UK 15363 24585 39948 0.11 USA 14836 24413 39249 0.10 Canada 12646 20948 33594 0.09 Germany 13131 18129 31261 0.08 Europe 16068 22915 38983 0.10 Australia 14684 21498 36182 0.10 Sri Lanka 7358 6465 13824 0.04 France 7760 10157 17917 0.05 Japan 3825 4825 8650 0.02 Malaysia 1848 2526 4374 0.01 Singapore 4139 5788 9928 0.03 Italy 2300 2845 5145 0.01 Nepal 1452 1758 3210 0.01 Netherlands 1788 5581 7370 0.02 Korea 783 780 1563 0.00 Israel 2119 2198 4317 0.01 Pakistan 4051 4205 8256 0.02 Bangladesh 5847 6311 12159 0.03 UAE 18748 18355 37104 0.10 Spain 3034 10926 13960 0.04 Switzerland 648 2610 3258 0.01 Saudi Arabia 8 75 83 0.00 Greece 0 14 14 0.00 Argentina 896 758 1654 0.00 Belgium 594 562 1156 0.00 Morocco 0 19 19 0.00 Cambodia 0 8 8 0.00 Maldives 0 13 13 0.00 Norway 931 932 1863 0.00 Philippines 509 437 946 0.00 Denmark 341 224 565 0.00 Egypt 25 68 93 0.00 South Africa 20 103 123 0.00 Finland 1148 1135 2283 0.01 Total 156903 222166 379069 1

Ministry of Tourism AC Nielsen ORG-MARG Government of India
Final Report for Andhra Pradesh – Tourism Survey 7
Table – 8 Ratio and estimated Number of Domestic Tourists Visitors visited from other state
Andhra Pradesh Estimated No. of Visitors
(Leisure)
Estmatied No. of Visitors (Non-
Lesiure)
Estimated Total Visitors
Ratio
Name of State
(1) AP 27356282 15965756 43322037 0.58 Maharashtra 1538618 5247965 6786583 0.09 Delhi 599022 310830 909853 0.01 Karnataka 1724583 5800986 7525569 0.10 Kerala 407387 1066921 1474308 0.02 MP 253885 310864 564749 0.01 Tamil Nadu 2276421 2930672 5207093 0.07 Chandigarh 15799 219597 235396 0.00 West Bengal 1173447 1847451 3020898 0.04 UP 394749 541576 936325 0.01 Assam 23036 46387 69423 0.00 Bihar 257606 45379 302984 0.00 Gujarat 251618 770441 1022059 0.01 Orissa 874059 417785 1291845 0.02 Jharkhand 143900 133716 277617 0.00 Rajasthan 140216 36400 176616 0.00 Chhatisgarh 172578 309754 482332 0.01 Punjab 274317 23072 297390 0.00 Haryana 130775 17851 148626 0.00 Pondicherry 16140 61665 77805 0.00 HP 1096 0 1096 0.00 J&K 9632 0 9632 0.00 Manipur 30198 0 30198 0.00 Meghalaya 60404 0 60404 0.00 Mizoram 14086 0 14086 0.00 Nagaland 3437 0 3437 0.00 Sikkim 58624 0 58624 0.00 Tripura 20933 0 20933 0.00 Uttaranchal 24979 0 24979 0.00 Andaman 25702 0 25702 0.00 Arunachal Pradesh 65605 0 65605 0.00 Dadar & Nagar Haveli 20446 0 20446 0.00 Daman & Diu 1042 0 1042 0.00 Goa 26618 0 26618 0.00 TOTAL 38387242 36105067 74492309 1
The above table gives the total estimated visitors to Andhra Pradesh from outside the state as well as same state. As evident from the table there is a high proportion of visitors from Karnataka and Maharashtra.

Ministry of Tourism AC Nielsen ORG-MARG Government of India
Final Report for Andhra Pradesh – Tourism Survey 8
Table - 9
No. of accommodation units, Rooms / Beds Available and Occupancy Rate
Andhra Pradesh
No. of Accommodation
units
No. of Rooms
Available per day
No. of Beds
Available per day
No. of Beds
Occupied per day
Occupancy Rate (%)
(Col5 as % of Col4) Months
(1) (2) (3) (4) (5) (6) July’09 1209 28735 66307 44327 67% August’09 1209 28735 66307 32160 49% September’09 1209 28735 66307 41177 62% October’09 1209 28735 66307 45814 69% November’09 1209 28735 66307 43854 66% December’09 1209 28735 66307 49488 75% January’10 1209 28735 67912 52058 77% February’10 1209 28735 67912 37042 55% March’10 1209 28735 67912 56852 84% April’10 1209 28735 67912 65121 96% May’10 1209 28735 67912 59281 87% June’10 1209 28735 67912 63665 94%
As evident from the table, it can be concluded that occupancy rate was the highest during the months of April and June. Also as the year progressed there was an increase in the absolute number of beds availability and occupancy of beds. The occupancy rate is highest during the period April to June.
Ministry of Tourism AC Nielsen ORG-MARG Government of India
Final Report for Andhra Pradesh – Tourism Survey 9
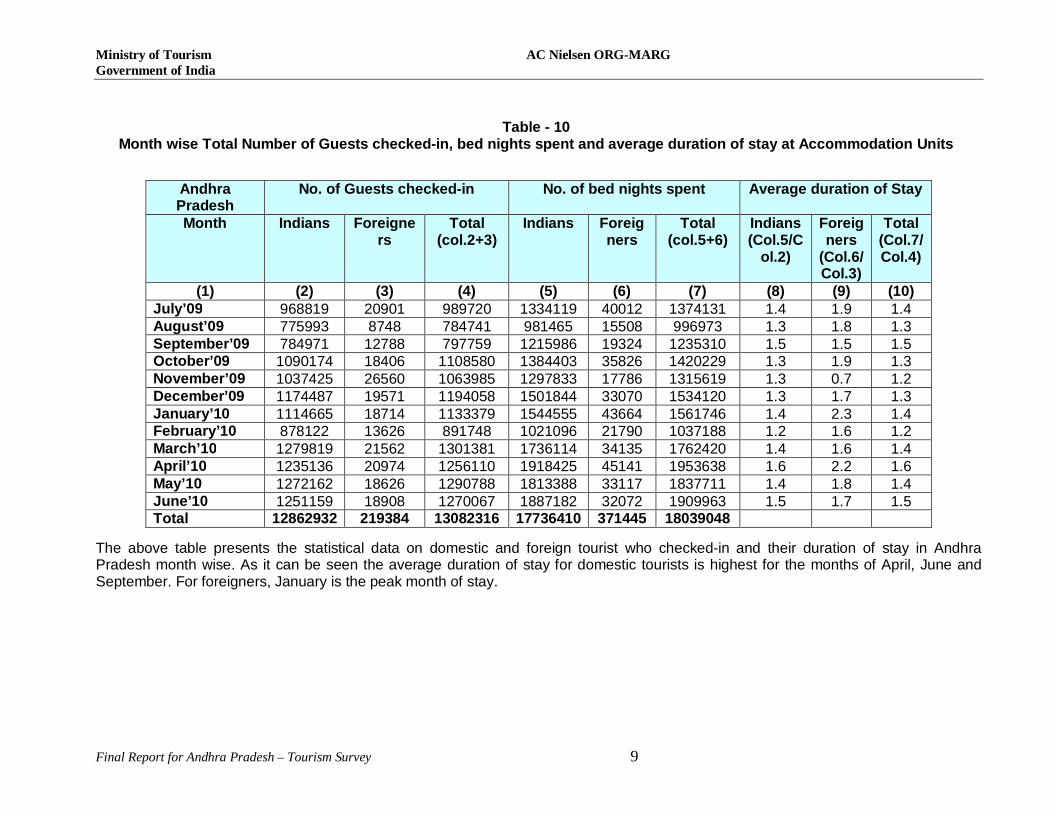
Table - 10 Month wise Total Number of Guests checked-in, bed nights spent and average duration of stay at Accommodation Units
The above table presents the statistical data on domestic and foreign tourist who checked-in and their duration of stay in Andhra Pradesh month wise. As it can be seen the average duration of stay for domestic tourists is highest for the months of April, June and September. For foreigners, January is the peak month of stay.
Andhra Pradesh
No. of Guests checked-in No. of bed nights spent Average duration of Stay
Month Indians Foreigners
Total (col.2+3)
Indians Foreigners
Total (col.5+6)
Indians (Col.5/C
ol.2)
Foreigners
(Col.6/Col.3)
Total (Col.7/Col.4)
(1) (2) (3) (4) (5) (6) (7) (8) (9) (10) July’09 968819 20901 989720 1334119 40012 1374131 1.4 1.9 1.4 August’09 775993 8748 784741 981465 15508 996973 1.3 1.8 1.3 September’09 784971 12788 797759 1215986 19324 1235310 1.5 1.5 1.5 October’09 1090174 18406 1108580 1384403 35826 1420229 1.3 1.9 1.3 November’09 1037425 26560 1063985 1297833 17786 1315619 1.3 0.7 1.2 December’09 1174487 19571 1194058 1501844 33070 1534120 1.3 1.7 1.3 January’10 1114665 18714 1133379 1544555 43664 1561746 1.4 2.3 1.4 February’10 878122 13626 891748 1021096 21790 1037188 1.2 1.6 1.2 March’10 1279819 21562 1301381 1736114 34135 1762420 1.4 1.6 1.4 April’10 1235136 20974 1256110 1918425 45141 1953638 1.6 2.2 1.6 May’10 1272162 18626 1290788 1813388 33117 1837711 1.4 1.8 1.4 June’10 1251159 18908 1270067 1887182 32072 1909963 1.5 1.7 1.5 Total 12862932 219384 13082316 17736410 371445 18039048

Ministry of Tourism AC Nielsen ORG-MARG Government of India
Final Report For Andhra Pradesh – Annexure 1: Methodology 10
Tables 11 – 16 give the quarterly data pertaining to information collected from accommodation survey held in the district of Andhra Pradesh. As shown in the tables below, the no. of accommodation units surveyed were 1283 during the period July’09 – June’10. Most of the accommodations units are sole proprietorship/partnership entities. These accommodation units employ nearly 22,000 persons. A majority of the accommodation units (1028) fall under the Non- Star category. The survey reveals that nearly 1126 accommodation units in Andhra Pradesh come under Non – Classified category.
Table - 11 Number of Accommodation units, Rooms, Beds and Employment
Andhra Pradesh
No. of AUs
No. of Rooms
No. of Beds
No. of Employees
Quarter
(1) (2) (3) (4) Temporary Permanent Total
(5) (6) (7) Quarter – 1 1283 28735 66307 13408 8939 22347 Quarter – 2 1283 28735 66307 13408 8939 22347 Quarter – 3 1283 28735 67912 13408 8939 22347 Quarter – 4 1283 28735 67912 13408 8939 22347
Table - 12 Distribution of Employees in Accommodation Units by Age Group
Andhra Pradesh
No. of AUs
No. of Employees
Distribution of employees by age-group
Quarter
(1) (2) (3) 18-25 yrs 26-30 yrs 31-40 yrs 41-50 yrs > 51 yrs
(4) (5) (6) (7) (8) Quarter – 1 1283 22347 8% 30% 31% 23% 8% Quarter – 2 1283 22347 8% 30% 31% 23% 8% Quarter – 3 1283 22347 8% 30% 31% 23% 8% Quarter – 4 1283 22347 8% 30% 31% 23% 8%
Table - 13
Distribution of Employees in Accommodation Units by Service
Andhra Pradesh
No. of AUs
No. of Employees
Distribution of employees by service
Quarter
(1) (2) (3) Management F&B House Keeping Others
(4) (5) (6) (7) Quarter – 1 1283 22347 12% 55% 30% 3% Quarter – 2 1283 22347 12% 55% 30% 3% Quarter – 3 1283 22347 12% 55% 30% 3% Quarter – 4 1283 22347 12% 55% 30% 3%

Ministry of Tourism AC Nielsen ORG-MARG Government of India
Final Report For Andhra Pradesh – Annexure 1: Methodology 11
Table - 14
Category-wise Distribution Accommodation Units
Andhra Pradesh
No. of Accommodation units
Quarter Classified
Non-classified Total Having
more than 20 rooms
10-20 rooms
Less than 10 rooms
Sub-Total (Col.
3+4+5) (1) (2) (3) (4) (5) (6) (7)
Quarter – 1 83 597 439 164 1126 1283 Quarter – 2 83 597 439 164 1126 1283 Quarter – 3 83 597 439 164 1126 1283 Quarter – 4 83 597 439 164 1126 1283
Table - 15 Distribution Accommodation Units by Types
Andhra Pradesh
No. of Accommodation units
Quarter Star Hotels
Apartment Hotels
Non-Star
Hotels
Youth/ YMCA
Hostels
Dharamshalas/ Sarais/
Musafirkhanas
Gurudwaras/ Temples/
Monastries
Bed & Breakfast
Units
Motels Total
Quarter – 1 180 11 1028 5 16 0 42 1 1283 Quarter – 2 180 11 1028 5 16 0 42 1 1283 Quarter – 3 180 11 1028 5 16 0 42 1 1283 Quarter – 4 180 11 1028 5 16 0 42 1 1283
Table - 16 Distribution Accommodation Units by Type of Ownership
State: No. of Accommodation units
Quarter Central Govt.
State Govt.
Pvt. Ltd.
Prop./ Partnership
Public Limited
PSU Charitable Trust/
Society
Others Total
Quarter – 1 3 3 172 1077 17 0 11 0 1283 Quarter – 2 3 3 172 1077 17 0 11 0 1283 Quarter – 3 3 3 172 1077 17 0 11 0 1283 Quarter – 4 3 3 172 1077 17 0 11 0 1283

Ministry of Tourism AC Nielsen ORG-MARG Government of India
Final Report For Andhra Pradesh – Annexure 1: Methodology 12
Visitors Profiling Tables
Table – 17 Age Distribution of Sample Visitors in the State
It is to be noted from the table above that predominant age group was 25-34 years among domestic overnight and day visitors. Most of the visitors to Andhra Pradesh are males with females comprising a small proportion.
Table – 18 Sex Distribution of Sample Visitors in the State
The gender wise distribution of sample visitors to Andhra Pradesh is mentioned in the table above. Male visitors are in majority in both the categories of domestic overnight as well as domestic day visitors.
Table – 19 Marital Status of Sample Visitors in the State
It is clear from the table above that most of the sample visitors to Andhra Pradesh have marital status as married. Unmarried visitors comprise of a small number. Others mentioned above cover the Widows, Divorcee etc.
Age Group %age of Domestic Overnight Visitors
%age of Domestic Day Visitors
%age of Foreign Overnight Visitors
Male Female Male Female Male Female (1) (2) (3) (5) (6) (8) (9)
15 – 24 Years 13% 2% 17% 4% 8% 2% 25 – 34 Years 38% 5% 38% 7% 21% 5% 35 – 44 Years 24% 3% 18% 5% 26% 2% 45 – 60 Years 11% 2% 9% 1% 28% 2%
>60 Years 1% 1% 1% 0% 5% 1%
Total 87% (10053)
13% (1415)
83% (5293)
17% (1046)
88% (522)
12% (71)
Gender %age of Domestic Overnight Visitors
%age of Domestic Day Visitors
%age of Foreign Overnight Visitors
(1) (2) (3) (4) Male 87% 83% 88%
Female 13% 17% 12% Total 100% (11468) 100% (6339) 100% (593)
Marital Status %age of Domestic Overnight Visitors
%age of Domestic Day
Visitors
%age of Foreign Overnight Visitors
(1) (2) (3) (4) Married 79% 73% 81%
Unmarried 20% 25% 17% Others 1% 2% 2% Total 100% (11468) 100% (6339) 100% (593)

Ministry of Tourism AC Nielsen ORG-MARG Government of India
Final Report For Andhra Pradesh – Annexure 1: Methodology 13
Table – 20
Educational Level of Sample Visitors in the State of
The above table represents the education level of sample visitors to Andhra Pradesh. It is evident from the table that almost half of the sample visitors have educational qualification as graduate & above and 1/4th of the visitors have a Higher Secondary qualification.
Table – 21 Occupation Pattern of Sample Visitors in the State of
The above table represents the occupation pattern of sample visitors to Andhra Pradesh. As it can be seen most of the visitors are either into private service or business. Self employed professionals and Industrialists are in a very small proportion.
Level of Education %age of Domestic Overnight Visitors
%age of Domestic Day Visitors
%age of Foreign Overnight Visitors
(1) (2) (3) (4) No Formal Education 1% 1% 1% Primary 4% 3% 1% Secondary 18% 16% 6% Higher Secondary 19% 22% 18% Graduate & Above 50% 50% 40% Technical & Professional of All Level 8% 8% 34%
Total 100% (11468) 100% (6339) 100% (593)
Occupation %age of Domestic Overnight Visitors
%age of Domestic Day Visitors
%age of Foreign Overnight Visitors
(1) (2) (3) (4) Industrialist / Trader / Shop Owner 3% 3% 9%
Self Employed Professional 4% 4% 21%
Government Service 14% 14% 4% Private Service 29% 28% 16% Student / Researcher 11% 17% 10% Business 25% 23% 33% Agriculture 6% 3% 5% Housewife 6% 6% 1% Other 2% 2% 1%
Total 100% (11468) 100% (6339) 100% (593)

Ministry of Tourism AC Nielsen ORG-MARG Government of India
Final Report For Andhra Pradesh – Annexure 1: Methodology 14
Table – 22
Purpose of visit by Sample Visitors in the State of
As it can be concluded from the table above, nearly one-third of visitors to Andhra Pradesh, were for the purpose of business. Holidays, leisure & recreation activities also drive a good number of tourists to Andhra Pradesh.
Table – 23
Mode of Transportation of Sample Domestic Visitors in the State The above table presents the mode of transportation used by sample domestic visitors in Andhra Pradesh. Most of the same day visitors from within the Andhra Pradesh used bus to travel. For overnight visitors as well as day visitors from outside Andhra Pradesh, train is the prominent mode of transportation.
Purpose %age of Domestic Overnight Visitors
%age of Domestic Day Visitors
%age of Foreign Overnight Visitors
(1) (2) (3) (4) Business 33% 27% 13% Holidays, Leisure & Recreation 23% 25% 40%
Social Activity 21% 19% 10% Pilgrimage / religious Activity 12% 13% 28%
Education / Training 5% 7% 7% Health & Medical 1% 1% 1% Shopping 3% 2% 0% Others 2% 6% 1% Total 100% (11468) 100% (6339) 100% (593)
Mode of Transportation
%age of visitors from within the State
%age of visitors from Outside the State
Overnight Visitors
Same day Visitors
Overnight Visitors
Same day Visitors
(1) (2) (3) (4) (5) Train 15% 19% 85% 86% Bus 83% 79% 13% 14% Air 0% 0% 1% 0% Personal Vehicle 2% 2% 1% 0%
Total 100% (3249)
100% (2736)
100% (8219)
100% (3593)

Ministry of Tourism AC Nielsen ORG-MARG Government of India
Final Report For Andhra Pradesh – Annexure 1: Methodology 15
Table – 24
Mode of Transportation of Sample Foreign Visitors in the State
The above table represents the mode of transportation used by foreign visitors to travel to Andhra Pradesh. As clearly stated above, nearly 70% of foreign tourists traveled by Air to Andhra Pradesh. Train is the next preferred option.
Table – 25
Travel Behavior of Sample Visitors in the State
The above table evaluates the travel behavior of sample visitors to Andhra Pradesh. It is clear from the table above that for most of the visitors to Andhra Pradesh; the frequency of visit is once in six months or once in a year.
Mode of Transportation %age of visitors from
Outside the State Overnight Visitors
(1) (4) Train 27% Air 67% Personal Vehicle 5% Taxi 1% Total 100% (593)
Frequency of Visits %age of Domestic Overnight Visitors
%age of Domestic Day Visitors
%age of Foreign Overnight Visitors
(1) (2) (3) (4) Once a week or more often 3% 5% 1%
Once a fortnight 12% 14% 7% Once a month 18% 17% 8% Once in 3 months 11% 10% 9% Once in 6 months 16% 18% 17% Once in a Year 22% 20% 38% Less Often 18% 16% 19% Total 100% (11468) 100% (6339) 100% (593)

Ministry of Tourism AC Nielsen ORG-MARG Government of India
Final Report For Andhra Pradesh – Annexure 1: Methodology 16
Table – 26
Propensity of availing package tour of Sample Visitors in the State of
The above mentioned is the measure the propensity of availing package tour among the sample visitors in the district of Andhra Pradesh. And we conclude less people avail package tours for traveling to Andhra Pradesh.
Table – 27
Travel Arrangement Mode of Sample Visitors in the State
As concluded from the previous table that few people avail package tour, thus most of the visitors traveling to Andhra Pradesh make their travel arrangements themselves, which can be justified from the findings presented in the above table.
%age of Domestic Overnight Visitors
%age of Domestic Day Visitors
%age of Foreign Overnight Visitors
(1) (2) (3) (4) Percentage of Tourists availing package tour
4% 6% 14%
Travel Arrangement Mode
%age of Domestic Overnight Visitors
%age of Domestic Day Visitors
%age of Foreign Overnight Visitors
(1) (2) (3) (4) Self 92% 91% 81% Office / Employer 2% 1% 2% Travel Agent 2% 3% 10% Tour Operator 4% 5% 7% Total 100% (11468) 100% (6339) 100% (593)

Ministry of Tourism AC Nielsen ORG-MARG Government of India
Final Report For Andhra Pradesh – Annexure 1: Methodology 17
Table – 28
Distribution of overnight visitors by place of stay of Sample Visitors in the State
The category wise details regarding the place of stay are presented above. It may be seen from the table above that most of the overnight tourist preferred non-star hotel as the place of stay. Friends & relatives place is the other prominent choice for place of stay.
Place of Stay %age of Domestic Overnight Visitors
%age of Foreign Overnight Visitors
(1) (2) (3) Star Hotel 7% 10% Non-Star Hotel 40% 36% Motel 1% 4% Govt. Guest House / Circuit House / Bhawan / Sadan 2% 0%
Private Guest House / Inn / Rest House / Tourist Bungalow 7% 15%
Dharamshala / Sarai / Musafirkhana 6% 13%
Gurudwara / Temple / Monastery / Other Temporary free stay in tent etc.
2% 5%
Friends & Relative 29% 13% Bed & Breakfast Unit 4% 3% Youth / YMCA Hostel 1% 0% Other (Company guest house, Community Dharamshalas, etc.) 1% 1%
Total 100% (11468) 100% (6339)

Ministry of Tourism AC Nielsen ORG-MARG Government of India
Final Report For Andhra Pradesh – Annexure 1: Methodology 18
Table – 29 Distribution of visitor by their preferred eating place of Sample Visitors in the State
The above table gives the percentage distribution of visitor by their preferred eating place of sample visitors in the district of Andhra Pradesh. It may be seen that proportion of domestic overnight and day visitors who preferred Restaurants for eating are the maximum.
Eating Place %age of Domestic Overnight Visitors
%age of Domestic Day Visitors
%age of Foreign Overnight Visitors
(1) (2) (3) (4) Restaurant 40% 31% 44% Fast Food Outlets 11% 16% 11% Cafeteria 1% 2% 9% Dhaba 10% 12% 2% Bars 2% 2% 4% Mobile Van 1% 1% 0% Refreshment Stand 2% 1% 5% Sharamshala / Sarai 4% 3% 2% Gurudwara / Temple / Monastery / Other free accommodation
3% 4% 3%
Friends & Relatives 26% 28% 15% Other 0% 0% 5% Total 100% (11468) 100% (6339) 100% (593)

Ministry of Tourism AC Nielsen ORG-MARG Government of India
Final Report For Andhra Pradesh – Annexure 1: Methodology 19
Table – 30
Satisfaction level of services by Sample Visitors in the State
* Combined sample size of all the 4 exit surveys.
Services %age of Domestic Overnight Visitors
%age of Domestic Day Visitors
%age of Foreign Overnight Visitors
Satisfied Dissatisfied Satisfied Dissatisfied Satisfied Dissatisfied (1) (2) (3) (4) (5) (6) (7)
Availability of Tour Operator 94% 6% 97% 3% 98% 2%
Availability of Transportation 97% 3% 98% 2% 98% 2%
Availability of Tourist Guide 91% 9% 94% 6% 96% 4%
Availability of good quality accommodation
98% 2% 99% 1% 98% 2%
Public Convenience 98% 2% 98% 2% 97% 3% Eating Places 97% 3% 97% 3% 98% 2% Information Centers 94% 6% 93% 7% 98% 2% Souvenir Shops 98% 2% 98% 2% 99% 1% Entertainment Places 93% 7% 95% 5% 97% 3%
Quality of Roads 98% 2% 99% 1% 94% 6% Security 98% 2% 97% 3% 100% Behavior of Local People 97% 3% 94% 6% 97% 3%
Shops other than souvenir ones 98% 2% 98% 2% 95% 5%
Upkeep of tourist sites 97% 3% 98% 2% 97% 3%
Accommodation tariff 95% 5% 96% 4% 95% 5%
Quality of Information 96% 4% 96% 4% 99% 1%
Total Total number of Visitors who responded: 11436
Total number of Visitors who responded: 6339
Total number of Visitors who responded: 497
Ministry of Tourism AC Nielsen ORG-MARG Government of India
Final Report For Andhra Pradesh – Annexure 1: Methodology 20
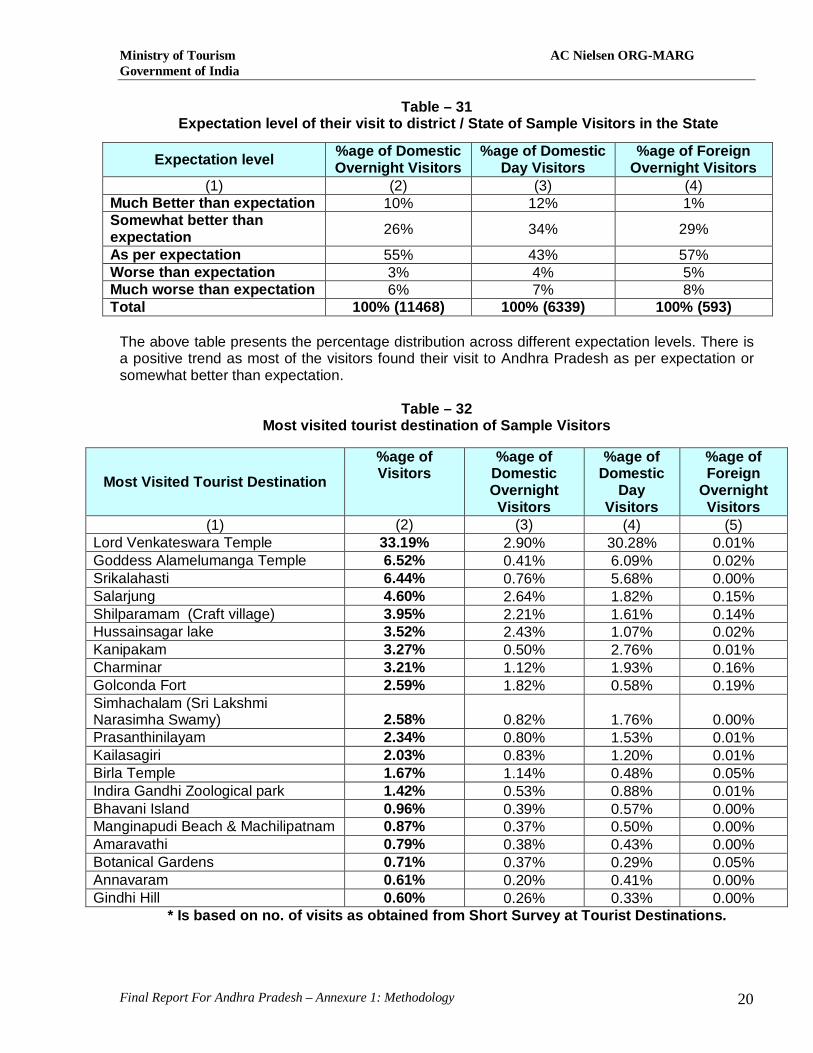
Table – 31 Expectation level of their visit to district / State of Sample Visitors in the State
The above table presents the percentage distribution across different expectation levels. There is a positive trend as most of the visitors found their visit to Andhra Pradesh as per expectation or somewhat better than expectation.
Table – 32
Most visited tourist destination of Sample Visitors
* Is based on no. of visits as obtained from Short Survey at Tourist Destinations.
Expectation level %age of Domestic Overnight Visitors
%age of Domestic Day Visitors
%age of Foreign Overnight Visitors
(1) (2) (3) (4) Much Better than expectation 10% 12% 1% Somewhat better than expectation 26% 34% 29%
As per expectation 55% 43% 57% Worse than expectation 3% 4% 5% Much worse than expectation 6% 7% 8% Total 100% (11468) 100% (6339) 100% (593)
Most Visited Tourist Destination %age of Visitors
%age of Domestic Overnight Visitors
%age of Domestic
Day Visitors
%age of Foreign
Overnight Visitors
(1) (2) (3) (4) (5) Lord Venkateswara Temple 33.19% 2.90% 30.28% 0.01% Goddess Alamelumanga Temple 6.52% 0.41% 6.09% 0.02% Srikalahasti 6.44% 0.76% 5.68% 0.00% Salarjung 4.60% 2.64% 1.82% 0.15% Shilparamam (Craft village) 3.95% 2.21% 1.61% 0.14% Hussainsagar lake 3.52% 2.43% 1.07% 0.02% Kanipakam 3.27% 0.50% 2.76% 0.01% Charminar 3.21% 1.12% 1.93% 0.16% Golconda Fort 2.59% 1.82% 0.58% 0.19% Simhachalam (Sri Lakshmi Narasimha Swamy) 2.58% 0.82% 1.76% 0.00% Prasanthinilayam 2.34% 0.80% 1.53% 0.01% Kailasagiri 2.03% 0.83% 1.20% 0.01% Birla Temple 1.67% 1.14% 0.48% 0.05% Indira Gandhi Zoological park 1.42% 0.53% 0.88% 0.01% Bhavani Island 0.96% 0.39% 0.57% 0.00% Manginapudi Beach & Machilipatnam 0.87% 0.37% 0.50% 0.00% Amaravathi 0.79% 0.38% 0.43% 0.00% Botanical Gardens 0.71% 0.37% 0.29% 0.05% Annavaram 0.61% 0.20% 0.41% 0.00% Gindhi Hill 0.60% 0.26% 0.33% 0.00%

Ministry of Tourism AC Nielsen ORG-MARG Government of India
Final Report For Andhra Pradesh – Annexure 1: Methodology 21
Table – 33
Popular Source of Information of tourist destination of the Sample Visitors in the State
The categories (Information Source) in the above table reflect on the popular source of information about tourist destinations in Andhra Pradesh. As seen from the table above, relatives & friends have been the most popular source of information for domestic visitors traveling to the district.
Table – 34
Annual Household income of the Sample Domestic Visitors in the State
The annual household income of the sample domestic visitors to Andhra Pradesh is spread across different categories as mentioned in the table above. The visitors fall under three different categories ranging from Rs. 60,000 to Rs. 5,00,000.
Information Source %age of Domestic Overnight Visitors
%age of Domestic Day
Visitors
%age of Foreign Overnight Visitors
(1) (2) (3) (4) Indian Embassy in your Country NA NA 0%
Indian Tourism Bureau in your country NA NA 0%
Indian Tourism Office in India 1% 0% 4%
State Tourism department 14% 9% 10% Travel Agent 10% 11% 12% Internet 10% 10% 26% Travel Books / Guides / Magazines / Newspaper 2% 3% 45%
Relatives / Friends 62% 67% 3% Other 1% 0% 0%
HH Income (Rs.) %age of Domestic Overnight Visitors
%age of Domestic Day Visitors
(1) (2) (3) Less than Rs.60,000 11% 12% Rs.60,001 – Rs.1,00,000 27% 35% Rs.1,00,001 – Rs.2,00,000 36% 30% Rs.2,00,001 – Rs.5,00,000 21% 19% Above Rs.5,00,000 5% 4% Total 100% (11468) 100% (6339)

Ministry of Tourism AC Nielsen ORG-MARG Government of India
Final Report For Andhra Pradesh – Annexure 1: Methodology 22
Table – 35
Annual Household income of the Sample Foreign Visitors in the State
The above table gives an idea about the household incomes of sample foreign visitors to Andhra Pradesh. Most of the foreign tourists have household income in the range of $40,000 to $1, 00,000.
Table – 36 Average Expenditure on Package Component of Sample Domestic Visitors availing
package tour in the State (Expenditure in Indian Rs.)
For visitors availing package tour to travel to Andhra Pradesh, spend on an average Rs. 2092 per person per night.
Table – 37 Average Expenditure on Package Component plus non-package component of Sample
Foreign Visitors availing package tour in the State (Expenditure in Rs.)
For a package component the average expenditure is Rs. 3800 approx. per person per night for foreign overnight visitors to Andhra Pradesh.
HH Income (US $) %age Foreign Overnight Visitors (1) (2)
Less than $.40,000 1% $.40,001 – $.60,000 32% $.60,001 – $.80,000 29% $.80,001 – $.1,00,000 27% Above $.1,00,000 11% Total 100% (593)
Package Component Overnight Visitors Expenditure No. of Visitors Average Exped.
(1) (2) (3) (10) Travel + Food 48755 49 995 Travel + Accommodation 139026 94 1479 Travel + Transport + Accommodation 253814 139 1826 Travel + Transport + Accommodation + Food 516736 176 2936
Total 958331 458 2092
Types of Packages Overnight Visitors
Expenditure No. of Visitors
Average Exped.
(1) (2) (3) (10) Travel + Food 4294 2 2147 Travel + Accommodation 18760 7 2680 Travel + Transport + Accommodation 121110 33 3670 Travel + Transport + Accommodation + Food 169945 41 4145 Total 314109 83 3784
Ministry of Tourism AC Nielsen ORG-MARG Government of India
Final Report For Andhra Pradesh – Annexure 1: Methodology 23
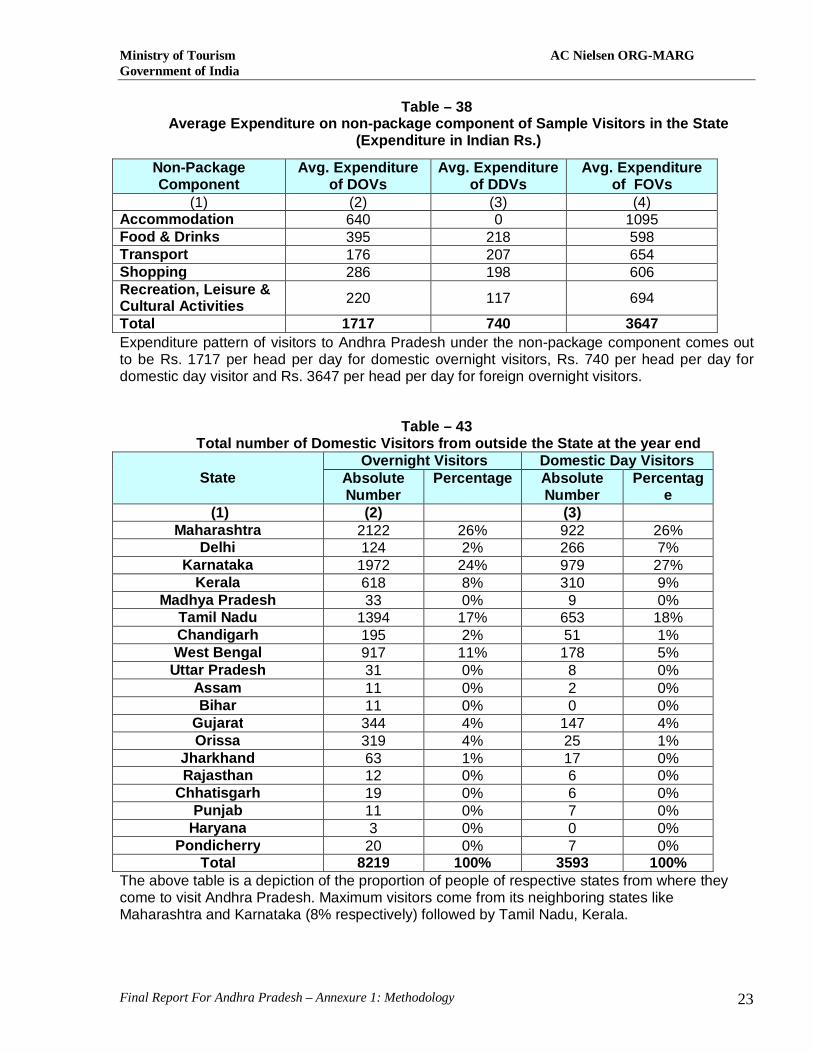
Table – 38 Average Expenditure on non-package component of Sample Visitors in the State
(Expenditure in Indian Rs.)
Expenditure pattern of visitors to Andhra Pradesh under the non-package component comes out to be Rs. 1717 per head per day for domestic overnight visitors, Rs. 740 per head per day for domestic day visitor and Rs. 3647 per head per day for foreign overnight visitors.
Table – 43 Total number of Domestic Visitors from outside the State at the year end
State Overnight Visitors Domestic Day Visitors
Absolute Number
Percentage Absolute Number
Percentage
(1) (2) (3) Maharashtra 2122 26% 922 26%
Delhi 124 2% 266 7% Karnataka 1972 24% 979 27%
Kerala 618 8% 310 9% Madhya Pradesh 33 0% 9 0%
Tamil Nadu 1394 17% 653 18% Chandigarh 195 2% 51 1% West Bengal 917 11% 178 5%
Uttar Pradesh 31 0% 8 0% Assam 11 0% 2 0% Bihar 11 0% 0 0%
Gujarat 344 4% 147 4% Orissa 319 4% 25 1%
Jharkhand 63 1% 17 0% Rajasthan 12 0% 6 0%
Chhatisgarh 19 0% 6 0% Punjab 11 0% 7 0%
Haryana 3 0% 0 0% Pondicherry 20 0% 7 0%
Total 8219 100% 3593 100% The above table is a depiction of the proportion of people of respective states from where they come to visit Andhra Pradesh. Maximum visitors come from its neighboring states like Maharashtra and Karnataka (8% respectively) followed by Tamil Nadu, Kerala.
Non-Package Component
Avg. Expenditure of DOVs
Avg. Expenditure of DDVs
Avg. Expenditure of FOVs
(1) (2) (3) (4) Accommodation 640 0 1095 Food & Drinks 395 218 598 Transport 176 207 654 Shopping 286 198 606 Recreation, Leisure & Cultural Activities 220 117 694
Total 1717 740 3647
Ministry of Tourism AC Nielsen ORG-MARG Government of India
Final Report For Andhra Pradesh – Annexure 1: Methodology 24
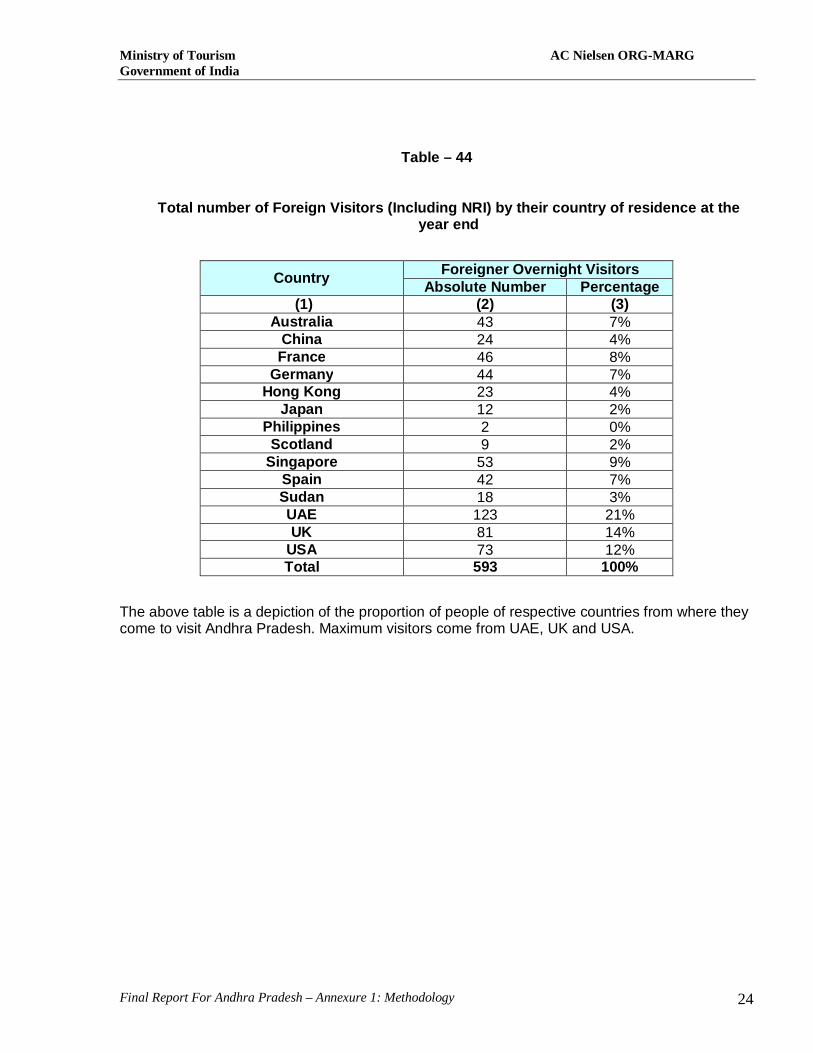
Table – 44
Total number of Foreign Visitors (Including NRI) by their country of residence at the year end
The above table is a depiction of the proportion of people of respective countries from where they come to visit Andhra Pradesh. Maximum visitors come from UAE, UK and USA.
Country Foreigner Overnight Visitors Absolute Number Percentage
(1) (2) (3) Australia 43 7%
China 24 4% France 46 8%
Germany 44 7% Hong Kong 23 4%
Japan 12 2% Philippines 2 0% Scotland 9 2%
Singapore 53 9% Spain 42 7% Sudan 18 3% UAE 123 21% UK 81 14%
USA 73 12% Total 593 100%

Ministry of Tourism AC Nielsen ORG-MARG Government of India
Final Report For Andhra Pradesh – Annexure 1: Methodology 25
Table – 45
Total number of Foreign Visitors (Excluding NRI) by their country of residence at the year end
Country Foreigner Overnight Visitors Absolute Number Percentage
(1) (2) (3) Australia 39 8%
China 23 5% France 36 8%
Germany 42 9% Hong Kong 19 4%
Japan 12 3% Philippines 2 0% Scotland 9 2%
Singapore 37 8% Spain 16 3% Sudan 13 3% UAE 77 17% UK 83 18%
USA 53 11% Total 461 100%
The above table is an indicator of foreign visitors excluding NRI’s. Ifwe take this parameter into consideration, even then results show maximum visitors are from Australia, USA & UAE.
Table – 46
Total number of NRI Visitors by country of residence at the year end
Country Foreigner Overnight Visitors
Absolute Number
Percentage
(1) (2) (3) Australia 6 5%
UAE 56 50% UK 21 19%
USA 12 11% Germany 2 2%
Hong Kong 4 4% Sudan 5 4%
Singapore 7 6% Total 132 100%
Taking into consideration, the proportion of NRI Visitors, from the above table we can conclude that most of the NRI visitors touring Andhra Pradesh come from Australia, USA and Canada.

Ministry of Tourism AC Nielsen ORG-MARG Government of India
Final Report For Andhra Pradesh – Annexure 1: Methodology 26
ANNEXURE – 1 Methodology for Estimation of Domestic and Foreign Tourists Visit at District Level in India I. Introduction Ministry of Tourism compiles data on domestic and foreign tourist visits in State/ UT based on the information received from the State/ UT Governments. Such information at State/ UT level is generally collected by State Tourism Departments on the basis of administrative records and returns. In many cases, the information supplied does not cover the same-day visitors, visitors staying with friends and relatives, etc. Doubts have been also expressed by experts about the reliability of the data on domestic and foreign tourist visits released every year. A need was felt to prepare a standard methodology for estimation of number of visitors at district level which can be used by the State/ UT Governments. This methodology should enable the compilation of such data on monthly basis. The methodology should also help in preparation of estimates of number of visitors for some period after the base line survey, mainly based on the information to be collected from the accommodation units without resorting to regular large scale survey. Keeping these requirements in view, a methodology has been prepared which will be initially used in the tourism surveys to be commissioned by the Ministry of Tourism in 5 states namely, Andhra Pradesh, Delhi, Jharkhand, Maharashtra and Punjab. The details of the methodology are given in the subsequent paragraphs. II. Definitions The definitions of various terms to be used in the survey are given below. Usual place of Residence: The usual place of residence of a person is the village/ town where the person has been staying continuously for at least 6 months prior to the date of the survey. Usual Environment: The usual environment refers to the geographical boundaries within which a person moves within his/ her regular routine of life. Trip: A trip refers to the travel by a person from the time of departure from his usual environment until he/ she returns. It, thus, refers to a round trip. A trip may be made up of visits to different places. Visitor: A visitor is a traveller taking a trip to a main destination outside his/ her usual environment for any main purpose (business, leisure or other personal purpose) other than to be employed at the place visited. Tourist: A visitor is classified as a tourist if his/ her trip includes an overnight stay. A tourist is also referred to as an overnight visitor. Same-day visitor: A visitor is classified as a same-day visitor if his/ her trip does not include an overnight stay. A same-day visitor is also referred to as an excursionist.
Ministry of Tourism AC Nielsen ORG-MARG Government of India
Final Report For Andhra Pradesh – Annexure 1: Methodology 27
Exclusion: The same-day visitors at a tourist destination for whom the tourism destination is part of their usual environment, are not considered same-day visitors for the purpose of this survey. Foreign Visitor: A visitor having a foreign passport will be treated as a foreign visitor. Even a Non- Resident Indian (NRI) will be treated as a foreign visitor. NRIs have Indian passports but may be living, or are likely to live, in other countries for 6 months or more. Domestic Visitor: A visitor, who is a resident Indian, will be treated as a domestic visitor. Tourist Destination: The tourist destinations would generally be as defined by the State in terms of geographical area and tourist interest. A tourist destination should be a clearly identified area/ location. A tourist location could be a ticketed closed area, non-ticketed closed area, or an open area without clearly specified boundaries. It may be a location maintained by Central Govt., State Govt., local body or any other organization, including those run by the private sector. A tourist location may consist of more than one tourist spots. However, the following norms should be adhered to for identifying a tourist location as a tourist destination: (i) Each ticketed tourist location will be considered as one tourist destination irrespective of the number of tourist spots at that location covered under the common ticket. (ii) If there are 2 or more tourist spots within close proximity which are not ticketed, the location would be considered to be a single destination if a visitor usually visits most or all the spots in the same visit. Town: Definition of the town will be same as that used in 2001 Population Census of India. III. Objective The field survey in a State will be conducted for a period of 12 months in all districts of the State. The survey will be used to obtain the following month-wise information for each district: a. Estimated number of visits (i) Visits by overnight visitors- staying at accommodation units;
- staying with friends and relatives - others, such as those staying in tented accommodations provided by State Govt. or by any other charitable organizations, etc.
(ii) Visits by same-day visitors b. Profile of visitors, their expenditure pattern, purpose of visits, etc. c. Occupancy rates and direct employment in accommodation units. IV. Approach To meet the objectives, first the tourist destinations have to be identified before the start of the survey. Two possible variables studied for identification of the tourist destination werenumber of tourists and number of accommodation units. However, interaction of the consultant with the state authority revealed that past data on number of tourists at various destinations are generally not available. Similarly, the analysis of the unit level data of Economic Census 2005 revealed that data on number of hotels below the district level are not available. Therefore, first towns important from tourist angle have to be identified. All the tourist destinations in the identified towns will be covered in the survey. In the identified towns two types of survey, namely Survey at tourist

Ministry of Tourism AC Nielsen ORG-MARG Government of India
Final Report For Andhra Pradesh – Annexure 1: Methodology 28
destination and Survey of Accommodation units will be done. The survey of tourist destination will broadly provide the estimate of tourists for leisure purpose, however, the purpose of the survey is to have an estimate of tourists for all type of purposes such as visiting friends and relatives, business, etc. Similarly, the Survey at tourist destination and at Accommodation unit will not provide information about the visitors staying with friends and relatives and in accommodation units but not visiting any tourist destination as well as same day visitors not visitors not visiting any tourist destinations. To get these information surveys at important Entry/Exit Points of the district will be also conducted. The ratio obtained from this exit survey will be used to find out the estimate of tourist for non-leisure purposes. However, this adjustment will be done only at district level. The district level estimates will be worked out by adding the leisure tourists at all the towns covered in the survey and multiplying it by the ratio of total urban population of the district to the total population of the towns covered in the survey. The estimate of non-leisure tourists will be worked out from the data of exit survey and added to the estimate of leisure tourists to find out the district level estimate of visitors. The state level estimate of visitors (tourists and same day visitors) will be worked out by adding the district level estimates of visitors. V. Methodology The methodology envisages three stage sampling. The first stage units will be the towns important from tourism perspective, the second stage units will be the tourist destinations in the selected town or linked to the selected town, and the visitors within a tourist destination will constitute the third stage units. The procedure for selection of first, second and third stage units are given below: (i) Selection of Towns important for Tourism In the absence of reliable information about the number of tourists or accommodation units at tourist destination, towns, which are important from tourism perspective, will be identified in each district in consultation with the State Government. Apart from such towns, the towns which cater to the accommodation needs of visitors to important tourist destinations located in non-urban areas will also be identified. For the latter cases, only one – the most important – town will be identified with one tourist destination. Therefore, as per this methodology, the first stage in this survey will be the identification of towns important for tourism purposes. (ii) Selection of Tourist Destinations in the Selected Town All the tourist destinations in a selected town will be covered in the survey. In case the number of tourist destinations in the selected town is large, only the important ones will be covered in the survey. (iii) Selection of Visitors at a Tourist Destination for brief profiling (a) Sample size of visitors at district level The sample is required for estimating the number of visitors at district level from the data collected at destination/ spot level. Statistically, the sample size may be obtained from the following expression, n = Z 2
1-α/2 p(1-p)/d2 Where p= anticipated proportion to be estimated 100(1- α /2) % is the confidence level and d=absolute precision required on either side in the proportion in percentage points

Ministry of Tourism AC Nielsen ORG-MARG Government of India
Final Report For Andhra Pradesh – Annexure 1: Methodology 29
Statistically, we require a sample size of about 400 respondents (384 to be exact) to get estimate of a parameter with a precision of 5% points and 95% level of confidence. As the data is required on monthly basis this sample size may be required on a monthly basis. (iv) Distribution of Sample Size in Towns and at Tourist Destinations (a) Distribution of sample size amongst selected towns in a district: The district sample size of 800 visitors will be distributed among the selected towns in proportion to the 2001 Census population of these towns. (b) Distribution of sample size among tourist destinations in a selected town: If there are more than one tourist destinations in a selected town, the sample size allocated for the town will be equally distributed among the tourist destinations. (c) Selection of days for survey of visitors in different months The survey will be conducted during all the 12 months of the year at each selected destination. Information about important festivals, fairs, religious events at the selected tourist destinations will be collected in advance for the 12-month period. In a particular month at a particular destination, survey will be done during 2 weeks. In the first week, first 3 days of the week will be covered, and in the second week last 4 days of the week will be covered. For this purpose, first day of the month will be considered as the first day of the week. The dates of survey at a tourist destination during the 12 months will be as follows.
Month Weeks Days of weeks Dates of the month
First First and Third 1st week: 1-3 days 3rd week: 4-7 days 1,2,3,18,19,20,21
Second Second and Fourth 2nd week: 1-3 days 4th week: 4-7 days 8,9,10, 25,26,27,28
Third First and Fourth 1st week: 1-3 days 4th week: 4-7 days 1,2,3,25,26,27,28
Fourth Second and Third 2nd week: 1-3 days 3rd week: 4-7 days 8,9,10,18,19,20,21
Fifth First and Second 1st week: 1-3 days 2nd week: 4-7 days 1,2,3,11,12,13,14
Sixth Third and Fourth 3rd week: 1-3 days 4th week: 4-7 days 15,16,17,25,26,27,28
Seventh to Twelve
Above pattern will be repeated
The date and week on which important tourism event is scheduled to take place at the selected tourist destination will be positively covered. If the important tourist event at the selected tourist destination falls outside the selected week and dates, the nearest week/dates will be substituted by the week/dates of the special event. (d) Canvassing of schedules to the visitors for brief profile The monthly sample size of visitors at a selected tourist destination should be distributed equally on the 7 days of the survey work (in 2 weeks) at the destination. The services of 2 investigators

Ministry of Tourism AC Nielsen ORG-MARG Government of India
Final Report For Andhra Pradesh – Annexure 1: Methodology 30
would be required on the selected days at non- ticketed tourist destinations. The first investigator will basically count the number of visitors and second investigator will canvass the schedule to seek the information about overnight/ same-day visitors, domestic/ foreign visitors, etc. At a ticketed tourist destinations perhaps one investigator will be able to canvass the schedule because counting of the visitors may not be required. (v) Details of the Surveys (A) Survey at Tourist Destinations A survey of visitors at tourist destinations has to be done to obtain the following information: (a) Total number of visits (i) Ticketed Destinations:- If the tourist destination is a ticketed destination with differential pricing for domestic and foreign visitors, the data on number of foreign and domestic visits separately during any day would be available from sale record of tickets. If the destination has common ticket for both domestic and foreign visitors, then an assessment of the distribution of visits by domestic and foreign visitors would have to be made by counting the visitors at the entry point(s). To capture the variations in visitors’ number on different days of the week as well as at different time periods of a day, this exercise would have to be carried out at different periods of time of the day, and on different days of the week. Many destinations attract large number of visitors during specific periods of the year, such as Kumbh Mela, Suraj Kund Mela, etc. Such periods should be identified in advance, and the survey should cover such specific periods. (ii) Non-Ticketed Destinations:- In such cases, the total number of visitors, during the day, along with its break-up into domestic and foreign visitors, has to be assessed by counting the number of such visitors at specified time slot at entry point (s). If there are more than one entry points to the tourist destination, all should be covered by pre-specified rotation, for counting the number and broad distribution. If there is no specific entry point, investigator will have to notionally designate appropriate points as entry points based on the flow of visitors to such a destination. (b) Brief Profile of Visitors Break-up of number of visitors into overnight visitors staying at accommodation units, overnight visitors staying with friends and relatives, other overnight visitors, and the same-day visitors, separately for domestic and foreign visitors, has to be obtained. For this, a small questionnaire, comprising 5-6 questions, has to be canvassed. As getting this information is the prime objective of the survey, the sample size should be adequate to provide the desired breakup of different type of visits. In para IV (A)(ii)(a), the desired sample size at district level has been worked out to be 400 visitors. However, it has been decided that the number of visitors to be selected for this short profile survey will be 800 per district per month. (B) Survey of Accommodation Units All the accommodation units (hotels, tourist lodges, dharamshalas, motels, Govt. / private companies, guest houses, etc.) in the selected towns will be listed with the help of Municipal Corporations or other competent authorities. If a tourist destination not located in the town is linked to a non-urban tourist destination in terms of providing accommodation facilities to tourists visiting that destination, the list of additional accommodation units located near such tourist destinations will also be included in the list of accommodation units of the town.
The accommodation units so listed will be grouped in the following categories:

Ministry of Tourism AC Nielsen ORG-MARG Government of India
Final Report For Andhra Pradesh – Annexure 1: Methodology 31
(ii) Classified hotels (iii) Other accommodation units
a. Having more than 20 rooms b. Having 10-20 rooms c. Having less than 10 rooms
From all the selected accommodation units, the following 2 types of information will be collected:
(i) Particulars of the accommodation unit- Apart from the identification details, the information would be collected on number of rooms, number of beds, total number of persons employed, annual turnover, etc. This information would be collected initially, and thereafter updated every quarter along with the updating of the list of accommodation units. (ii) Information about overnight visitors- Based on the records available with the accommodation units, information on number of guests checked-in, number of nights spent, whether domestic or foreign, residency status of the tourists (within the state, within country, outside country), etc. would be collected. This information has to be collected every month for the preceding month.
All the classified hotels would be covered for collecting both the information. For the remaining 3 categories of accommodation units, 10% of the units in each will be covered. These 10% accommodation units will be selected by using circular systematic sampling method. In metropolitan cities, list of all the accommodation units will have to be prepared for the survey work. For collecting information about the number of visitors and their other details as well as information about the accommodation units for a particular month, the selected accommodation units will be visited in the 1st week of the succeeding month. (C) Survey at Entry/Exit Points of the district The survey at the tourist destinations will not be able to capture the following categories of visitors:
(a) Visitors staying with friends and relatives and not visiting any tourist destination; (b) Visitors staying in accommodation units but not visiting any tourist destination; (c) Same day visitors not visiting any tourist destination
For having an idea about the total number of visitors in the district, information about visitors collected at tourist destinations has to be supplemented by information on the above categories of visitors. To meet this objective, exit survey of the visitors at the major exit/ entry points of the district will be conducted to have information about the above mentioned categories of visitors as well as for detailed profiling of the visitors. In view of the fact that profiling of the visitors is not likely to change over a short time interval, profile of visitors will be generated only at district level on quarterly basis. The requirement of the sample size for this exercise would also be less. It has been decided to conduct the interview of 200 visitors every quarter in each district. As the information collected in the exit survey used for estimating the number of non-leisure visitors in the district, the exit survey will be conducted only in the first month of the quarter so that its result can be used for the three months of the quarter. All the four weeks as well as the days (week days and weekends) in a month should be covered on representative basis.

Ministry of Tourism AC Nielsen ORG-MARG Government of India
Final Report For Andhra Pradesh – Annexure 2: Estimation Procedure 32
Annexure – 2: Estimation Procedure
I. Estimation from survey at Entry / Exit points in a Quarter From the survey at major entry/exit points of the district, we get the following: x DT – h-l = no. of domestic leisure visitors to the district in the sample at all exit points covered who
stayed at hotels. x DT – h-nl = no. of domestic non-leisure visitors to the district in the sample at all exit points
covered who stayed at hotels.
a DT – h-l = average no. of tourist destinations in the district visited by a domestic leisure tourist who stayed at a hotel based on the survey at exit points. Clearly, a DT – h-l ≥ 1 Similarly, we define x DT – f – l , x DT – f – nl, a DT – f – l for domestic tourists staying with Friends & Relatives x DT – o – l , x DT – o – nl, a DT – o – l for domestic tourists staying at other places x DS– l , x DS– nl, a DS – l for domestic same day visitors x FT– h - l , x FT–h-nl, a FT-h – l for foreign Tourist staying at hotels x FT– f - l , x FT–f-nl, a FT-f – l for foreign Tourist staying with friends and relatives x FT–o - l , x FT–o-nl, a FT-o – l for foreign tourists staying at other places x FS– l , x FS–nl, a FT – l for foreign same day visitors. II. Estimation of tourists for a tourist destination in a month Define the following notations: Assume that i stands for ith destination selected in the selected town, j stands for jth day selected for survey at the ith destination (j=1,2,…,di); k stands for the kth entry point at the ith destination (k=1,2,,…,ei); l stands for the lth entry hour at the kth entry point at ith destination (l=1,2,…,hik). DT
in No. of visits by domestic tourists surveyed at the ith destination on all days of survey at all entry points at all hours; hDT
in No. of visits by domestic tourists surveyed at the ith destination and stayed in hotels,

Ministry of Tourism AC Nielsen ORG-MARG Government of India
Final Report For Andhra Pradesh – Annexure 2: Estimation Procedure 33
fDTin No. of visits by domestic tourists surveyed at the ith destination and staying with friends
and relatives
oDTin No. of visits by domestic tourists surveyed at the ith destination and stayed at other
accommodation units.
DSin No. of visits by domestic same day visitors surveyed at the ith destination on all days of
survey at all entry points at all hours;
FTin No. of visits by foreign tourists surveyed at the ith destination on all days of survey
at all entry points at all hours;
hFTin No. of visits by foreign tourists surveyed at the ith destination and stayed in hotels
fFTin No. of visits by foreign tourists surveyed at the ith destination and staying with friends
and relatives
oFTin No. of visits by foreign tourists surveyed at the ith destination and stayed at other
accommodation units.
FSin No. of visits by foreign same day visitors surveyed at the ith destination on all days
of survey at all entry points at all hours;
)(sN DTi Total number of visits by domestic tourists at the ith destination on all days of
survey;
)(sN hDTi Total number of visits by domestic tourists at the ith destination who stayed in hotels
)(sN fDTi Total number of visits by domestic tourists at the ith destination and staying with
friends and relatives
)(sN oDTi Total number of visits by domestic tourists at the ith destination and stayed at other
accommodation units
)(sN DSi Total number of visits by domestic same day visitors at the ith destination on all
days of survey;
)(sN FTi Total number of visits by foreign tourists at the ith destination on all days of
survey; )(sN hFT
i Total number of visits by foreign tourists at the ith destination and stayed in hotel
)(sN fFTi Total number of visits by foreign tourists at the ith destination staying with friends and
relatives )(sN oFT
i Total number of visits by foreign tourists at the ith destination and stayed at other accommodation units

Ministry of Tourism AC Nielsen ORG-MARG Government of India
Final Report For Andhra Pradesh – Annexure 2: Estimation Procedure 34
)(sN FS
i Total number of foreign same day visitors at the ith destination on all days of survey;
DT
iN Total number of domestic tourists at the ith destination during the month hDT
iN Total number of visits by domestic tourists at the ith destination during the month and stayed in hotel fDT
iN Total number of visits by domestic tourists at the ith destination during the month and staying with friends and relatives oDT
iN Total number of visits by domestic tourists at the ith destination during the month and stayed at other accommodation units
DS
iN Total number of visits by domestic same day visitors at the ith destination during the month;
FT
iN Total number of visits by foreign tourists at the ith destination during the month; hFT
iN Total number of visits by foreign tourists at the ith destination during the month and stayed in hotel fFT
iN Total number of visits by foreign tourists at the ith destination during the month and staying with friends and relatives oFT
iN Total number of visits by foreign tourists at the ith destination during the month and stayed at other accommodation units
FS
iN Total number of visits by foreign same day visitors at the ith destination during the month;
iN Total number of visits at the ith destination during the month
= NiDT + Ni DS + Ni FT + Ni FS
From the survey at the destination, following distribution is available:
The estimation of number of visits at the three distinct types of destinations will be as follows: Case I: Non-ticketed destinations
Domestic Foreign hDT
in hFTin
fDTin fFT
in oDT
in oFTin
DSin FS
in

Ministry of Tourism AC Nielsen ORG-MARG Government of India
Final Report For Andhra Pradesh – Annexure 2: Estimation Procedure 35
In this case, it may be observed that i) iN is not available;
ii) )(sN Di and )(sN F
i are to be estimated by a count of visitors; iii) An estimate of iN is given by
)()( sNsNN Fi
Dii x(No. of days in the month/ di ); (di = 7)
iv) Estimates of DiN and F
iN are given by
DiN = )(sN D
i X 31* / 7
FiN = )(sN F
i X 31* / 7 * Number of days in the surveyed month
v) Estimates for tourists and same day visitors will be obtained as
DiD
i
hDTihDT
i Nn
nN .
F
iFi
hFTihFT
i Nn
nN .
DiD
i
fDTifDT
i Nn
nN .
F
iFi
fFTifFT
i Nn
nN .
DiD
i
oDTioDT
i Nn
nN .
F
iFi
oFTioFT
i Nn
nN .
DiD
i
DSiDS
i Nnn
N .
F
iFi
FSiFS
i Nnn
N .
For special occasions like Kumbh Mela, Surajkund Mela etc., it would be advisable to work out average number of tourists per day on the respective destination, based on the sample days observed during the occasion (Mela) period and estimate the number of tourists in that destination for the occasion (Mela) by multiplying the average number of tourists per day by the number of Mela days. The estimates for non-Mela days may be obtained as usual and monthly estimates may be obtained by pooling number of tourists for Mela and non-Mela days. Case II: Destinations with common ticketing It may be observed that i) iN is available
ii) )(sN Di and )(sN F
i are to be estimated by a count of visitors.

Ministry of Tourism AC Nielsen ORG-MARG Government of India
Final Report For Andhra Pradesh – Annexure 2: Estimation Procedure 36
iii) Steps (iv) and (v) of case I are to be followed. First divide iN into DiN and F
iN , and
then DiN into hDT
iN , fDTiN , oDT
iN and DSiN , and F
iN into hFTiN , fFT
iN , oFTiN and
FSiN respectively.
Case III: Destinations with differential ticketing In this case, i) iN , D
iN and FiN are available.
ii) DiN and F
iN will be split as in step (V) of case I
Exclusion of visitors for whom the destination is part of ‘usual environment’
In the case of a non-ticketed destination, the number of visitors, as recorded in the counting
sheet, also includes persons for whom the tourist destination is part of their ‘usual environment’.
Such persons are not to be included for the estimation of number of visitors in the current survey.
However, it is not possible to distinguish such persons while filling up the counting sheet. The
number of such persons has to be assessed on the basis of the number of persons who are
rejected for the short survey. For example, if 10 persons are interviewed for the short survey in a
day, the investigator may actually have contacted 30 persons, with 20 being rejected for interview
because the destination was part of their ‘usual environment’. Then the total number of visitors to
the destination would be assessed to be (10/30)*100% of the number available from the counting
sheet.
Estimation for a month including a special tourist Event For each identified destination, the list of important tourist events for the whole year, along with
the corresponding time period, should be prepared in advance in consultation with the officials of
State Tourism Departments.
The estimation of number of visitors for such destinations is outlined below with the help of an example:- Suppose that the tourist destination is an important temple attracting (i) a very high number of visitors on a particular day of the week (say Monday), every week, and (ii) an exceptionally high number of visitors during a special event spanning a period of, say, 9 days of November. The field work and estimation of number of visitors in the months other than November and in the month of November would be done in different ways.

Ministry of Tourism AC Nielsen ORG-MARG Government of India
Final Report For Andhra Pradesh – Annexure 2: Estimation Procedure 37
For the month of November The field work and surveys would be done for the following 3 categories of days:- (a) 9 days of the special event in November (b) 3 (or 4) Mondays of November excluding the 9 days of the special event (c) 18 (or 17) remaining days of November For (a), field work for adequate number of days (may be 2 or 3 or 4) would be done. For (b), field work would be done on 1 Monday selected as per the procedure described in the methodology note. For (c), field work would be done for 2 or 3 or 4 days depending on the number of days of field work for category (a). The estimation of number of visitors at this destination would be done separately for the three categories of days. For a month other than November (say January) If there are any special events in January, the survey and estimation procedure would be as for November. If there are no such special events, the month would have the following two categories of days:- (a) 4 (or 5) Mondays (b) 27 (or 26) remaining days of the month The 7 days of the survey work would be selected as per the prescribed methodology (these will include 1 Monday). The estimation of number of visitors would be done separately for the above two categories of days. III. Estimation of tourists for a town in a month Let the tourist destinations in uth town be numbered 1, 2,,………………t u . [Here, it may be noted that these destinations also include those that are not located in the town but are linked to the town from which the visitors visiting such destinations predominantly come from.] Let Mu = No. of visits by visitors to tourist destinations in the uth town in the month Mu DT – h = No. of visits by domestic tourists staying in hotels to tourist destinations in the uth town in the month.

Ministry of Tourism AC Nielsen ORG-MARG Government of India
Final Report For Andhra Pradesh – Annexure 2: Estimation Procedure 38
Similarly, we define Mu DT-f. Mu DT-o , Mu DS, Mu DT, Mu D, and Mu FT-h, Mu FT-f, Mu FT-o, Mu FS, Mu FT, Mu F
Then, tu tu Mu
DT - h = ∑ NiDT –h Mu
FT - h = ∑ NiFT –h
i = 1 i = 1
tu tu Mu
DT - f = ∑ NiDT –f Mu
FT - f = ∑ NiFT –f
i = 1 i = 1 tu tu Mu
DT - o = ∑ NiDT –o Mu
FT - o = ∑ NiFT -o
i = 1 i = 1 Mu
DT = MuDT – h + Mu
DT - f + MuDT – o Mu
FT = MuFT – h + Mu
FT - f + MuFT - o
tu tu Mu
DS = ∑ NiDS Mu
FS = ∑ NiFS
i = 1 i = 1 Mu
D = MuDT + Mu
DS MuF = Mu
FT + MuFS
Mu = Mu D + Mu F
Let the population of the town u be pu IV. Estimation for a District in a month Let Q = No. of visits by visitors at tourist destinations in all the surveyed towns (say u: 1, 2, …., t) in the district in the month. Q DT-h = No. of visits by domestic visitors at tourist destinations in all the surveyed towns in the district in the month who stayed in hotels. Similarly define Q DT-f, Q DT-o, Q DS, Q DT, Q D, Q FT-h, Q FT-f, Q FT-o, Q FS, QFT, QF Then, t t QDT - h = ∑ Mu
DT –h QFT - h = ∑ MuFT –h
u = 1 u = 1

Ministry of Tourism AC Nielsen ORG-MARG Government of India
Final Report For Andhra Pradesh – Annexure 2: Estimation Procedure 39
t t QDT - f = ∑ Mu
DT –f QFT - f = ∑ MuFT –f
u = 1 u = 1 t t QDT - o = ∑ Mu
DT –o QFT - o = ∑ MuFT –o
u = 1 u = 1 t t QDS = ∑ Mu
DS QFS = ∑ MuFS
u = 1 u = 1 QDT = QDT – h + QDT - f + QDT – o QFT = QFT – h + QFT - f + QFT - o QD = QDT + QDS QF = QFT + QFS Q = Q D + Q F Let the population of all the surveyed towns in the district be P t Then P = ∑ pu u = 1 Let the urban population of the district be P*. That is , if the surveyed towns are numbered 1,2,3,……….., t and the other towns in the district are numbered t +1, t +2,…………t + s, then t +s t t +s t +s Then P* = ∑ pu = ∑ pu + ∑ pu = P +∑ pu u = 1 u = 1 u = t + 1 u = t + 1 Let Q* = No. of visits by visitors at tourist destination in the district in the month Similarly define Q* DT-h , Q* DT-f , Q* DT-o , Q* DS , Q* DT , Q* D and Q* FT-h , Q* FT-f , Q* FT-o , Q* FS , Q* FT , Q* F
P* Then, Q* = Q X P P* Q * DT – h = Q DT – h X , and so on P Let Q # DT – h = No. of visitors who visited tourist destination in the district and stayed in hotels. Similarly define Q # DT – f, Q # DT – o, Q # DS
And

Ministry of Tourism AC Nielsen ORG-MARG Government of India
Final Report For Andhra Pradesh – Annexure 2: Estimation Procedure 40
Q # FT – h ,Q # FT – f, Q # FT – o, Q # FS
Then,
Q # DT – h = Q *DT – h / a DT – h - l Q # FT – h = Q *FT – h / a FT – h - l
Q # DT – f = Q *DT – f / a DT – f - l Q # FT – f = Q *FT – f / a FT – f - l
Q # DT – o = Q *DT – o / a DT – o - l Q # FT – o = Q *FT – o / a FT – o - l
Q # DS = Q *DS / a DS - l Q # FS = Q *FS / a FS - l
V. Estimation of total visitors in the district In the steps mentioned above, only leisure tourists (those visiting the destination) have been estimated. However, visitors also include the non-leisure tourists. Estimation of total number of visitors in a district will be done as follows. Let R = No. of visitors ( leisure + non- leisure) in the district Similarly define, R DT-h, R DT-f, R DT-o, RDS, RDT, RD and R FT-h, R FT-f, R FT-o, RFS, RFT, RF
x DT-h-l + x DT – h - nl Then R DT-h = X Q # DT-h x DT-h-l
Similarly estimate RDT- f, RDT-o, RDS and RFT-h, R FT-f, R FT-o, RFS R DT = RDT-h + R DT-f + R DT-o, RD = RDT + RDS R FT = RFT-h + R FT-f + R FT-o, RF = RFT + RFS R = RD + RF VI. Estimation of visitors at the State level District level estimates are to be added to obtain the state level estimates.

Ministry of Tourism AC Nielsen ORG-MARG Government of India
Final Report For Andhra Pradesh – Annexure 3: Questionnaires / Survey Instruments 41
TOURIST SURVEY (EXIT POINTS)
Month: [1] April [2] May [3] June [4] July [5] August [6] September [7] October [8] November [9] December [10] January [11] February [12] March Week: [1] First [2] Second [3] Third [4] Fourth
1. Survey Point (RECORD BY TICKING ONE OPTION) [1] Railway Station [2] Airport [3] Bus Station [4] Hotel DEMOGRAPHIC PROFILE: (IN CASE OF FAMILY / GROUP, RESPONDENT IS THE HEAD OF THE FAMILY / GROUP) 2. Type of tourist: [1] Over-night visitor [2] Same-day visitor 3.Name: _____________________________Telephone No. (With STD/ISD Codes)_________________________ 4. Please tell me your approximate age? ______Years 5. Record gender: [1] Male [2] Female 6. Are you? [1] Married [2] Recently Married [3] Never Married [4] Others---------(Widow etc) 7. When did you arrive here? Date: _________ 8. Are you traveling…? READ OUT OPTIONS & TICK (SINGLE RESPONSE) [1] Alone [2] With Family [3] With Friends [4] With Family and Friends <IF ANSWER TO Q. 8 IS 2 OR 3 OR 4, THEN ASK Q. NO. 9 & 10 > 9. How many people have traveled with you? ___________ 10. Please give the information about gender and age of people, who have traveled with you? ASK & RECORD
Male Age Comp. Yrs Female Age Comp. YRS 11. How many nights have you spent in this place __________ 12. Are you a… [1] Indian (GO TO Q.13) [2] Foreigner (GO TO Q. 20 ) [3] NRI (GO TO Q. 26) <IF RESPONDENT IS AN INDIAN IN Q. 12, THEN ASK Q. 13>
State
Dist
Dest
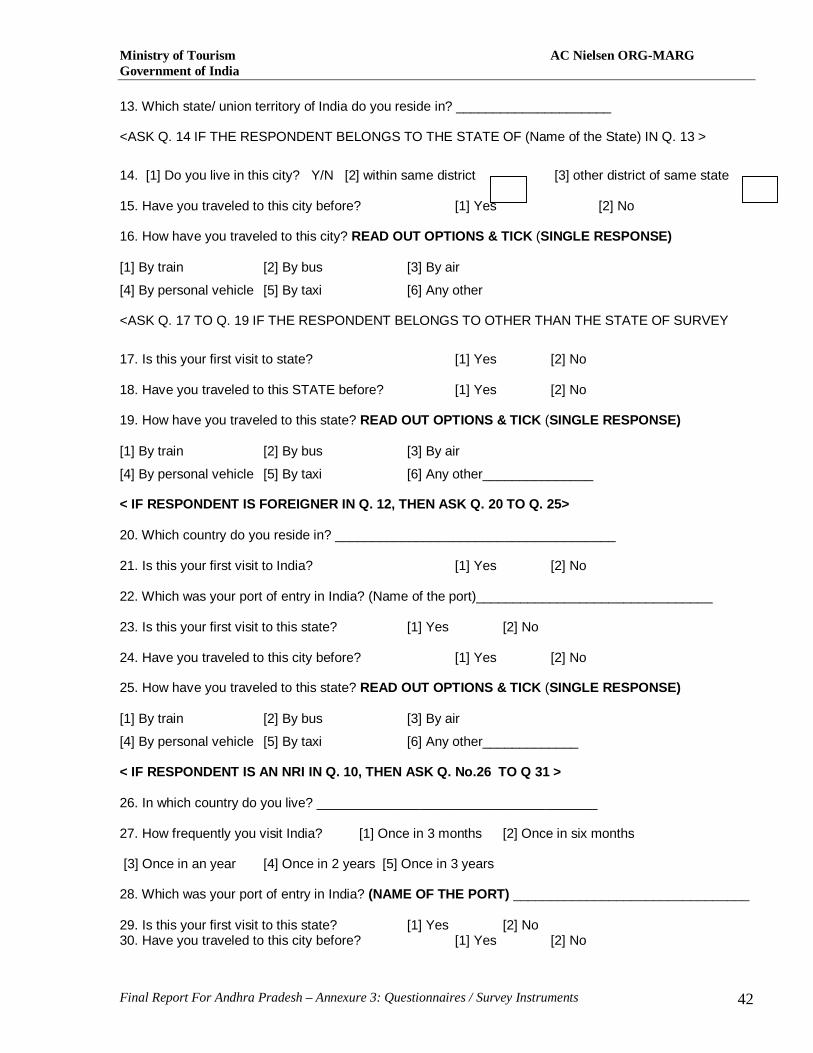
Ministry of Tourism AC Nielsen ORG-MARG Government of India
Final Report For Andhra Pradesh – Annexure 3: Questionnaires / Survey Instruments 42
13. Which state/ union territory of India do you reside in? _____________________ <ASK Q. 14 IF THE RESPONDENT BELONGS TO THE STATE OF (Name of the State) IN Q. 13 >
14. [1] Do you live in this city? Y/N [2] within same district [3] other district of same state 15. Have you traveled to this city before? [1] Yes [2] No 16. How have you traveled to this city? READ OUT OPTIONS & TICK (SINGLE RESPONSE) [1] By train [2] By bus [3] By air
[4] By personal vehicle [5] By taxi [6] Any other <ASK Q. 17 TO Q. 19 IF THE RESPONDENT BELONGS TO OTHER THAN THE STATE OF SURVEY
17. Is this your first visit to state? [1] Yes [2] No 18. Have you traveled to this STATE before? [1] Yes [2] No 19. How have you traveled to this state? READ OUT OPTIONS & TICK (SINGLE RESPONSE) [1] By train [2] By bus [3] By air
[4] By personal vehicle [5] By taxi [6] Any other_______________ < IF RESPONDENT IS FOREIGNER IN Q. 12, THEN ASK Q. 20 TO Q. 25> 20. Which country do you reside in? ______________________________________ 21. Is this your first visit to India? [1] Yes [2] No 22. Which was your port of entry in India? (Name of the port)________________________________ 23. Is this your first visit to this state? [1] Yes [2] No 24. Have you traveled to this city before? [1] Yes [2] No 25. How have you traveled to this state? READ OUT OPTIONS & TICK (SINGLE RESPONSE) [1] By train [2] By bus [3] By air
[4] By personal vehicle [5] By taxi [6] Any other_____________ < IF RESPONDENT IS AN NRI IN Q. 10, THEN ASK Q. No.26 TO Q 31 > 26. In which country do you live? ______________________________________ 27. How frequently you visit India? [1] Once in 3 months [2] Once in six months [3] Once in an year [4] Once in 2 years [5] Once in 3 years 28. Which was your port of entry in India? (NAME OF THE PORT) ________________________________ 29. Is this your first visit to this state? [1] Yes [2] No 30. Have you traveled to this city before? [1] Yes [2] No

Ministry of Tourism AC Nielsen ORG-MARG Government of India
Final Report For Andhra Pradesh – Annexure 3: Questionnaires / Survey Instruments 43
31. How have you traveled to this state? READ OUT OPTIONS & TICK (SINGLE RESPONSE) [1] By train [2] By bus [3] By air
[4] By personal vehicle [5] By taxi [6] Any other_____________
<ASK ALL> 32. What type of activities are you engaged in? READ OUT OPTIONS & TICK (SINGLE RESPONSE) [1] Industrialist/ Trader/ Shop Owner [2] Self Employed Professional (Chartered Accountant, Cost Accountant, Doctor, Lawyer, Engineer, Consultant, Proprietor of a firm or institute) [3] Government Service [4] Private Service [5] Student/ Researcher [6] Business [7] Agriculturist [8] Housewife [9] If any other, please specify__________________________ 33. What is your educational qualification? READ OUT OPTIONS & TICK (SINGLE RESPONSE) [1] No Formal Education [2] Primary [3] Secondary [4] Higher Secondary [5] Graduate & Above [6] Technical / Professional of all levels [7]Any other, please specify_____ 34. What is your approximate annual household income? READ OUT OPTIONS & TICK (SINGLE RESPONSE) <ASK FROM INDIAN VISITOR> [1] Less than Rs. 60,000 [2] Rs. 60,001 – Rs. 1,00,000 [3] Rs. 1,00,001 – Rs. 2,00,000 [4] Rs. 2,00,001 – Rs. 5,00,000 [5] Above Rs. 5,00,000 <ASK FROM FOREIGN VISITOR> [1] Less than US $ 40,000 [2] US $ 40,001 – US $ 60,000 [3] US $ 60,001 – US $ 80,000 [4] US $ 80,001 – US $ 100,000 [5] Above US $ 100,000 TRAVEL BEHAVIOR: 35. How often do you travel? READ OUT OPTIONS & TICK (SINGLE RESPONSE) [1] Once a week or more often [2] Once a fortnight [3] Once a month [4] Once in 3 months [5] Once in 6 months [6] Once in a year [7] Less often 36. What was your main purpose of visit? READ OUT OPTIONS & TICK (MULTIPLE RESPONSE) [1] Business [2] Holidaying, leisure & recreation [3]Social (visiting friends & relatives, attending marriages etc) [4] Pilgrimage /Religious activity [5] Education /Trainging [6] Health & Medical [7] Shopping [8] Others 37 If in < Q 36 >, purpose is not [2} , THEN did you visit any tourist spot during your stay_______________ 38. Are you a part of an organized group/ package tour? [1] Yes [2] No 39 If in 38, YES, then ask what the package include [1] Travel + Food [2] Travel +Accommodation [3] Travel +Transport +Accommodation [4] Travel + Transport + Accommodation + Food [5] Any other 40. How did you make your travel arrangement? READ OUT OPTIONS & TICK (MULTIPLE RESPONSES)

Ministry of Tourism AC Nielsen ORG-MARG Government of India
Final Report For Andhra Pradesh – Annexure 3: Questionnaires / Survey Instruments 44
[1] Self [2] Office / Employer [3] Travel Agent [4] Tour Operator [5] If any other, please specify__________________________ 41. Where did you stay during your visit? READ OUT OPTIONS & TICK (SINGLE RESPONSE) [1] 5 Star Deluxe Hotel [2] 5 Star Hotel [3] 4 Star Hotel [4] 3 Star Hotel [5] 2 Star Hotel [6] 1 Star Hotel [7] Apartment Hotel (Service Apartment) [8] Heritage Hotel [9] Non-star Hotel [10] Motel [11] Govt. Guest House/ Circuit House/ Bhawan/ Sadan [13] Dharamshala/ Sarai/ Musafirkhana [15] Friends & Relatives [14] Gurudwara / Temple/ Monastery /Other temporary free stay in tent etc [12] Private Guest House/ Inn / Rest House / Tourist Bungalow [16] Bed & Breakfast Unit [17] Youth/ YMCA Hostel 18] If any other, please specify ______________
42. Which of these eating-places did you eat in? READ OUT OPTIONS & TICK (MULTIPLE CODES)
[1] Restaurant [2] Fast Food Outlets [3] Cafeteria [4] Dhaba [5] Bars [6] Mobile Van [7] Food Kiosk [8] Refreshment Stand [9] Place of lodging [10] Dharamshala/ Sarai [12] Gurudwara/ Temple Monastery/Other free accommodation [13] Friends & Relatives [14] If any other, please specify ___________ 43. On an overall basis how satisfied or dissatisfied are you on account of… MENTION EACH PARAMETER? SHOW CARD No. 1 <Use 5 point scale> [5] Highly Satisfied [4] Satisfied [3] Satisfied but not completely [2] Dissatisfied [1] completely dissatisfied ASK SATISFACTION LEVEL ONLY IF RESPONSE IS <YES> PARAMETER Yes No Level of
Satisfaction
(Use Code)
1 Availability of Tour Operator
2 Availability of transportation
3 Availability of tourist guide
4 Availability of good quality accommodation
5 Public convenience
6 EATING PLACES
7 Information centres
8 Souvenir shops
9 Entertainment places
10 Quality of roads
11 Security
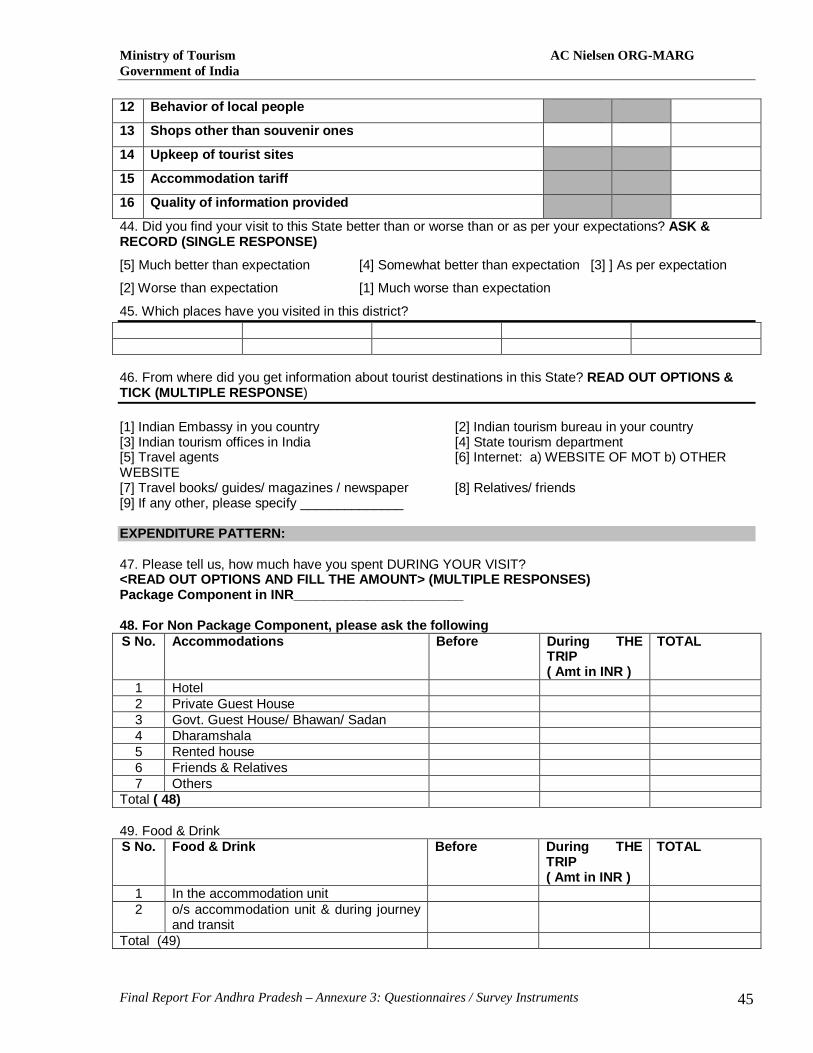
Ministry of Tourism AC Nielsen ORG-MARG Government of India
Final Report For Andhra Pradesh – Annexure 3: Questionnaires / Survey Instruments 45
12 Behavior of local people
13 Shops other than souvenir ones
14 Upkeep of tourist sites
15 Accommodation tariff
16 Quality of information provided
44. Did you find your visit to this State better than or worse than or as per your expectations? ASK & RECORD (SINGLE RESPONSE)
[5] Much better than expectation [4] Somewhat better than expectation [3] ] As per expectation
[2] Worse than expectation [1] Much worse than expectation
45. Which places have you visited in this district? 46. From where did you get information about tourist destinations in this State? READ OUT OPTIONS & TICK (MULTIPLE RESPONSE) [1] Indian Embassy in you country [2] Indian tourism bureau in your country [3] Indian tourism offices in India [4] State tourism department [5] Travel agents [6] Internet: a) WEBSITE OF MOT b) OTHER WEBSITE [7] Travel books/ guides/ magazines / newspaper [8] Relatives/ friends [9] If any other, please specify ______________ EXPENDITURE PATTERN: 47. Please tell us, how much have you spent DURING YOUR VISIT? <READ OUT OPTIONS AND FILL THE AMOUNT> (MULTIPLE RESPONSES) Package Component in INR_______________________ 48. For Non Package Component, please ask the following S No. Accommodations Before During THE
TRIP ( Amt in INR )
TOTAL
1 Hotel 2 Private Guest House 3 Govt. Guest House/ Bhawan/ Sadan 4 Dharamshala 5 Rented house 6 Friends & Relatives 7 Others
Total ( 48) 49. Food & Drink S No. Food & Drink Before During THE
TRIP ( Amt in INR )
TOTAL
1 In the accommodation unit 2 o/s accommodation unit & during journey
and transit
Total (49)

Ministry of Tourism AC Nielsen ORG-MARG Government of India
Final Report For Andhra Pradesh – Annexure 3: Questionnaires / Survey Instruments 46
50. Transport S No. Transport Before During THE
TRIP ( Amt in INR )
TOTAL
1 RAILWAYS 2 Road 3 WATER 4 AIR 5 Transport equipment rental 6 Travel agency services / tour operator 7 Others
Total (50) 51. Shopping S No. Shopping Before During THE
TRIP ( Amt in INR )
TOTAL
1 Clothing & garments 2 Processed food 3 Tobacco products 4 Alcohol 5 Travel related consumer goods 6 Footwear 7 Toiletries 8 Gems & Jewellery 9 Books. Journals, Magazines ,Stationery
etc
Total (51) 52. Recreation, Leisure, Cultural, Sporting activities S No. Recreation, Leisure, Cultural, Sporting
activities Before During THE
TRIP ( Amt in INR )
TOTAL
1 Cinema, theatre,amusement park 2 Entry fee & other expenses at religious
places
3 Entry fee & other expenses at cultural sites
4 Sporting activities 5 Medicine & health related
Total (52) 53. Others S No. Others Before During THE
TRIP ( Amt in INR )
TOTAL
1 2
54. GRAND TOTAL (SUMMATION OF Q 48+49+50+51+52+53)
*********************************************************************************************************************** Name of the investigator: ________________________________________Date: ____________________ Back Check Done: [ ] Tick Date: ______________ Back Checked by: _____________

ACNielsen ORG-MARG
Final Report For Andhra Pradesh – Annexure 3: Questionnaires / Survey Instruments 47
COUNTING SHEET Tourist Spot / Destination ______________________ State Code: ___________ District Code________________
DATE Volume count of tourists (Hourly Count by tally mark method )
10 – 11 AM 11-12 AM 12 AM- 1PM 1-2PM 02-03PM 03-04PM 04-05PM 05-06PM
Use one sheet for each date
Month: ……………… Year: ………………

ACNielsen ORG-MARG
Final Report For Andhra Pradesh – Annexure 3: Questionnaires / Survey Instruments 48
Short Survey Questionnaire:
Month: ________ Year: ___________ Entry Point:______________
1. Are you a [1] Indian [2] Foreigner [3] NRI 2 If Indian, where do you reside i) Within same city ii) Same district iii) Other district of the state iv) Outside the state, specify state code
If the answer in 1 is WITHIN SAME CITY, ask the following Frequency of visit to this Tourist spot a) Once in 7 days b) once in 15 days c) Once in a month d) Once in six months If response is a) OR b) OR c) TERMINATE THE QUESTIONNAIRE 3. Type of Tourist [1] Overnight visitor [2] same day visitor 4. If Foreigner country of nationality____________________________ 5. If NRI, country of residence ____________________________ 6. If overnight visitor, place of stay [1] Hired accommodation [2] Friends & relatives [3] other free accommodation 7. Sex: MALE /FEMALE
Name of the investigator: ________________________________________Date: ____________________ Back Check Done: [ ] Tick Date: ______________ Back Checked by: _____________
State
Dist
Dest

ACNielsen ORG-MARG
Final Report For Andhra Pradesh – Annexure 3: Questionnaires / Survey Instruments 49
ACCOMODATION SURVEY (CENSUS)
1. Name of accommodation unit: (Pls collect visiting card) 2. Type of accommodation unit RECORD BY TICKING (SINGLE CODE) [1] 5 Star Deluxe Hotel [2] 5 Star Hotel
[3] 4 Star Hotel [4] 3 Star Hotel
[5] 2 Star Hotel [6] 1 Star Hotel
[7] Apartment Hotel (Service Apartment) [8] Heritage Hotel
[9] Non-star Hotel [10] Youth/ YMCA Hostel
[11] Dharamshala / Sarai/ Musafirkhana [12] Gurudwara/Temple/Monastry
[13] BED & Breakfast Unit [14] Motel
3. Does your hotel belong to any group / chain of hotels? [1] Yes, Please specify_________________________ [2] No 4. In which year it was established? Year: ______________ 5. Ownership RECORD BY TICKING (SINGLE CODE) [1] Central Government [2] State Government [3] Private Limited
[4] Proprietorship/ Partnership [5] Public Limited [6] PSU
[7] Charitable Trust/ Society [8] If any other, please specify ______________ 6. Registered with…. RECORD BY TICKING (MULTIPLE CODES) [1] State Tourism Department [2] Ministry of Tourism, New Delhi [3] Municipal Corporation [4] Police Department [5] Health Department [6] None [7] If any other, please specify ________________________ 7. Please furnish the details of the following:
S.
No. Type of Room Number of
rooms Number of beds Room Tariff
Rs. US Dollar (US $)
1 Single AC 2 Double AC 3 Deluxe AC
State
Dist
Dest

ACNielsen ORG-MARG
Final Report For Andhra Pradesh – Annexure 3: Questionnaires / Survey Instruments 50
4 Suits AC 5 Single Non AC 6 Double Non AC 7 Deluxe Non AC 8 Suits Non AC 9 Dormitory / Hall
10 Any other
Total (Post Code)
8. Total number of employees: ______ (Permanent & Temporary) Departments Number of permanent
employees Number of casual or
temporary employees Total
(Post Code) Management Team Front Office F & B (Service) F & B (Kitchen) House Keeping Accounts EDP Security Sales & Marketing Purchase & Stores Human Resource Public Relation Engineering Telephone Health Club Laundry
Other departments
Total
9. Number of people working in the age group of: 18 – 25yrs 26 – 30yrs 31 – 40yrs 41 – 50yrs >50yrs
10. Category of accommodation unit for Sampling [1] Classified hotels [2] Having more than 20 rooms [3] 10 -20 rooms [4] less than 10 rooms

ACNielsen ORG-MARG
Final Report For Andhra Pradesh – Annexure 3: Questionnaires / Survey Instruments 51
ACCOMODATION SURVEY (MONTHLY)
1. Name of accommodation unit: (Pls collect visiting card) 2. Total number of employees: ______ (Permanent & Temporary) Departments Number of permanent
employees Number of casual or
temporary employees Total
(Post Code) Management Team Front Office F & B (Service) F & B (Kitchen) House Keeping Accounts EDP Security Sales & Marketing Purchase & Stores Human Resource Public Relation Engineering Telephone Health Club Laundry
Other departments
Total
3.1 Number of room days occupied in the last month: ______ 3.2 Occupancy % ____ (TO BE COMPUTED AS SUM OF NUMBER OF DAYS THAT EACH CUSTOMER HAS STAYED FOR) 3.3 Total number of customers: ____________ 3.4 Total number of domestic customers: ____________ 3.5 Total number of bed nights for domestic customers____________ 3.6 Total number of foreign customers: ____________ 3.7 Total number of bed nights for foreign customers: ____________ 4. Please generate the following statistics in respect of tourist inflow
State
Dist
Dest

ACNielsen ORG-MARG
Final Report For Andhra Pradesh – Annexure 3: Questionnaires / Survey Instruments 52
Sl. No.
Type of Tourists (Domestic – 1 Foreign – 2)
Name of the State ( In case of domestic tourists) / Name of the country (in case foreign tourists). Post the relevant state code/country code as provided in the list
Number of tourists Bed night spent
TOTAL
STATE CODES COUNTRY CODES 1 J & K 19 CHATTISGARH 1. UK 19 UAE 2 H.P. 20 BIHAR 2. USA 20 SPAIN 3 PUNJAB 21 JHARKHAND 3. CANADA 21 SWITZERLAND 4 HARYANA 22 A.P 4. GERMANY 22 CHINA 5 UTTARANCHAL 23 KARNATAKA 5. EUROPE 23 SAUDI ARABIA 6 U.P. 24 KERALA 6. AUSTRALIA 24 GREECE 7 DELHI 25 TAMIL NADU 7. SRI LANKA 25 ARGENTINA
8 MANIPUR 26 ARUNACHAL PRADESH 8. FRANCE 26 BELGIUM
9 TRIPURA 27 ASSAM 9. JAPAN 27 MOROCO 10 MEGHALAYA 28 NAGALAND 10. MALAYSIA 28 CAMBODIA 11 MIZORAM 29 GOA 11 SINGAPORE 29 MALDIVES
12 SIKKIM 30 ANDAMAN & NICOBAR 12 ITALY 30 NORWAY
13 WEST BENGAL 31 DAMAN & DIU 13 NEPAL 31 CYPRUS 14 ORISSA 32 LAKSHWADEEP 14 NETHERLANDS 32 PHILIPNIES 15 RAJASTHAN 33 PONDICHEERY 15 KOREA 33 DENMARK 16 GUJARAT 34 CHANDIGARH 16 ISRAEL 34 EGYPT
17 MAHARASHTRA 35 DADRA & NAGAR HAVELI 17 PAKISTAN 35 SOUTH AFRICA
18 M.P. 18 BANGLADESH 36 FINLAND

Ministry of Tourism AC Nielsen ORG-MARG Government of India
Final Report For Andhra Pradesh – Annexure 4: Additional Tables 53
ANNEXURE – 4: Additional Tables Table 1: Average Number of Places Visited
The Average number of places visited by leisure visitors is given in the following table. These ratios were used to convert Leisure visits to leisure visitors, hence, avoiding the perplexity of counting more than one visit of a single visitor to several destinations as more than one visitors.
Average Destinations Visited - Domestic
Exit Survey
Serial No.
Districts
Overnight
No. of visits by Domestic Same day
Visitors 1 Adilabad 1.44 1.78 2 Nizamabad 1.32 1.58 3 Karimnagar 1.48 1.60 4 Medak 1.60 1.73 5 Hyderabad 3.13 3.38 6 Ranga Reddy 1.13 1.35 7 Mahaboobnagar 1.09 1.33 8 Nalgonda 1.70 1.45 9 Warangal 1.63 1.50
10 Khammam 1.18 1.38 11 Srikakulam 1.34 1.45 12 Vizianagaram 1.43 1.53 13 Visakhapatnam 1.61 1.53 14 East Godavari 1.51 1.70 15 West Godavari 1.96 1.48 16 Krishna 1.76 1.68 17 Guntur 1.55 1.60 18 Prakasam 1.24 1.38 19 Nellore 1.33 1.53 20 Cuddapah 1.37 1.43 21 Kurnool 1.46 1.55 22 Anathapur 1.32 1.43 23 Chittoor 1.92 1.85 24 Andhra Pradesh 1.54 1.62

Ministry of Tourism AC Nielsen ORG-MARG Government of India
Final Report For Andhra Pradesh – Annexure 4: Additional Tables 54
Average Destinations Visited - Foreign
Exit Survey
Serial No.
Districts
Overnight
No. of visits by Domestic Same day
Visitors 1 Adilabad 1.58 1.73 2 Nizamabad 1.15 1.33 3 Karimnagar 1.28 1.45 4 Medak 1.28 1.50 5 Hyderabad 3.43 4.15 6 Ranga Reddy 1.48 1.73 7 Mahaboobnagar 1.08 1.18 8 Nalgonda 1.30 1.30 9 Warangal 1.35 1.38 10 Khammam 1.10 1.13 11 Srikakulam 1.13 1.13 12 Vizianagaram 1.30 1.20 13 Visakhapatnam 1.43 1.40 14 East Godavari 1.35 1.28 15 West Godavari 1.35 1.30 16 Krishna 1.45 1.38 17 Guntur 1.38 1.50 18 Prakasam 1.15 1.23 19 Nellore 1.15 1.20 20 Cuddapah 1.18 1.15 21 Kurnool 1.23 1.25 22 Anathapur 1.48 1.20 23 Chittoor 2.20 1.90 24 Andhra Pradesh 1.42 1.48

Ministry of Tourism AC Nielsen ORG-MARG Government of India
Final Report For Andhra Pradesh – Annexure 4: Additional Tables 55
Table 2: Total Number of Visits to the State: The total numbers of visits by all visitors are given as below. Total number of visits was calculated by summing up total number of visits by leisure visitors and total number of non-leisure visitors (the number of non-leisure visits was calculated by taking the number of visit by non-leisure visitor as one per non-leisure visitor).
Total Domestic Visits Districts Jul’09 Aug’09 Sep’09 Oct’09 Nov’09 Dec’09 Jan’10 Feb’10 Mar’10 Apr’10 May’10 Jun’10 Total
Adilabad 12526 17475 21581 45413 50256 34954 51821 32295 25450 27259 25450 23581 368061 Nizamabad 106279 77192 95190 88642 108668 85665 91780 114247 93290 84807 81116 77926 1104802 Karimnagar 268675 33917 43567 119419 121128 95864 117341 124489 98438 98339 87712 72853 1281742 Medak 9179 16671 19365 28318 27894 24978 28031 48972 30965 31320 22736 20946 309375 Hyderabad 1855317 939653 896551 759079 835486 838706 1754130 1782971 2220877 2200121 2423224 2575154 19081269 Ranga Reddy 58537 202878 179431 308031 343051 291797 144294 207708 86308 83767 90655 86794 2083251 Mahaboobnagar 90635 63005 69451 28475 25348 20231 26075 22690 17268 15639 14277 11743 404837 Nalgonda 102846 88903 105631 88416 85120 47230 83883 86979 92606 97615 94661 108623 1082513 Warangal 354288 40750 49332 63438 59984 42855 60682 190522 97756 102792 114878 114452 1291729 Khammam 64153 27751 34417 25845 25506 21008 33436 53977 45473 44869 44830 43522 464787 Srikakulam 33998 95718 98780 79011 89188 58519 65443 65875 41116 36742 31418 23790 719598 Vizianagaram 87258 145210 99275 136461 137596 167363 215469 48101 57788 41032 35073 32172 1202798 Visakhapatnam 569007 511668 483613 783710 931099 628339 603656 550176 786135 752428 723239 663525 7986595 East Godavari 141861 276250 308296 240372 255112 274242 307333 280172 153849 367035 375531 360793 3340846 West Godavari 71685 186737 193075 154817 153784 205768 230419 147650 125845 290783 301696 241709 2303968 Krishna 263819 229569 208818 331056 271829 307047 282004 240228 231790 265100 290320 280565 3202145 Guntur 36826 58682 63269 204848 210471 228644 222866 139069 125436 107328 111370 110181 1618990 Prakasam 30768 15235 13638 25984 20106 22241 25002 20103 32753 32631 31490 25266 295217 Nellore 43952 36019 39225 86916 67033 99474 124249 97355 76144 79411 73851 72883 896512 Cuddapah 35292 59211 67962 200612 202402 186096 185673 57404 51180 33600 32294 35043 1146769 Kurnool 130172 83323 86407 114014 110554 135337 129995 74324 85328 67333 76004 79805 1172596 Anathapur 52575 223983 236049 232479 239531 320956 366947 207774 325211 312396 317170 316521 3151592 Chittoor 4636229 5571189 5310855 5175241 4140683 3706127 4427496 4182119 4116466 4675142 4682468 4516370 55140385 TOTAL 9055877 9000989 8723778 9320597 8511829 7843441 9578025 8775200 9017472 9847489 10081463 9894217 109650377

Ministry of Tourism AC Nielsen ORG-MARG Government of India
Final Report For Andhra Pradesh – Annexure 4: Additional Tables 56
Total Foreign Visits
Districts Jul’09 Aug’09 Sep’09 Oct’09 Nov’09 Dec’09 Jan’10 Feb’10 Mar’10 Apr’10 May’10 Jun’10 Total Adilabad 16 0 19 16 27 125 106 3 0 0 0 0 312 Nizamabad 57 29 121 0 0 242 22 25 14 0 0 0 510 Karimnagar 0 0 0 0 0 138 2 0 0 0 0 0 140 Medak 0 0 0 43 0 265 5 0 7 6 4 0 330 Hyderabad 61548 60498 64056 26256 30238 37015 117237 93015 51421 48697 46561 44134 680676 Ranga Reddy 0 0 882 0 0 806 2425 653 1609 203 348 251 7177 Mahaboobnagar 15 0 0 0 4 0 0 0 0 0 0 0 19 Nalgonda 0 0 64 175 145 777 107 25 12 6 9 6 1326 Warangal 386 117 161 0 0 1 111 70 25 12 7 0 890 Khammam 7 9 36 0 0 0 0 0 0 0 0 0 52 Srikakulam 54 59 75 0 0 93 2 73 30 26 0 0 412 Vizianagaram 46 21 0 14 19 103 50 35 7 6 1 0 302 Visakhapatnam 4162 4778 4332 5679 5968 5835 6098 3530 2739 1544 1719 1838 48222 East Godavari 245 879 433 571 599 778 128 70 38 20 34 11 3806 West Godavari 14 0 199 65 75 926 107 2 4 0 0 0 1392 Krishna 36 0 193 479 509 896 1279 89 65 18 13 8 3585 Guntur 96 72 20 18 30 103 59 58 52 4 7 16 535 Prakasam 0 0 9 11 39 40 15 0 0 0 0 0 114 Nellore 53 62 88 30 38 28 2 112 30 4 2 0 449 Cuddapah 0 0 15 40 32 0 0 40 21 3 0 0 151 Kurnool 13 0 34 10 12 164 380 31 20 5 1 0 670 Anathapur 0 225 357 650 705 813 1117 658 822 587 821 895 7650 Chittoor 7686 6641 3207 2525 5200 4514 7512 5299 3533 401 256 220 46994 TOTAL 74434 73390 74301 36582 43640 53662 136764 103788 60449 51542 49783 47379 805714

Ministry of Tourism AC Nielsen ORG-MARG Government of India
Final Report For Andhra Pradesh – Annexure 4: Additional Tables 57
Table 3: Ratio of Non-visitors to visitors: To discount local residents as being counted as Tourists and getting included in the Tourism statistics, during the Short Survey itself, questions were asked regarding their city of residence (if tourist/visitor belongs to the same deistrict as the destination) and frequency of visit to the destination. The proportions of tourists/visitors thus being discounted are given as below:
Average Ratio of Disqualification and Qualification
Districts Disqualified Qualified Total
Adilabad 0.33 0.67 1.00 Nizamabad 0.36 0.64 1.00 Karimnagar 0.26 0.74 1.00 Medak 0.28 0.72 1.00 Hyderabad 0.32 0.68 1.00 Ranga Reddy 0.33 0.67 1.00 Mahaboobnagar 0.26 0.74 1.00 Nalgonda 0.31 0.69 1.00 Warangal 0.30 0.70 1.00 Khammam 0.38 0.62 1.00 Srikakulam 0.31 0.69 1.00 Vizianagaram 0.32 0.68 1.00 Visakhapatnam 0.30 0.70 1.00 East Godavari 0.26 0.74 1.00 West Godavari 0.32 0.68 1.00 Krishna 0.29 0.71 1.00 Guntur 0.27 0.73 1.00 Prakasam 0.31 0.69 1.00 Nellore 0.31 0.69 1.00 Cuddapah 0.33 0.67 1.00 Kurnool 0.31 0.69 1.00 Anathapur 0.42 0.58 1.00 Chittoor 0.40 0.60 1.00

Ministry of Tourism AC Nielsen ORG-MARG Government of India
Final Report For Andhra Pradesh – Annexure 5: Supplementary Tables 58
ANNEXURE – 5 SUPPLEMENTARY TABLES
Table A5:1 - Percentage and estimated Number of Domestic Leisure Tourists / Visitors visited from other State in the month of July’09 Name of State Estimated Domestic Leisure Visitors Percentage AP (Same State) 2005103 71.26% Maharashtra 112774 4.00% Delhi 43906 1.56% Karnataka 126405 4.49% Kerala 29860 1.06% MP 18609 0.66% Tamil Nadu 166852 5.93% Chandigarh 1158 0.04% West Bengal 86009 3.05% UP 28933 1.02% Assam 1688 0.06% Bihar 18881 0.67% Gujarat 18443 0.65% Orissa 64065 2.27% Jharkhand 10547 0.37% Rajasthan 10277 0.36% Chhatisgarh 12649 0.44% Punjab 20106 0.71% Haryana 9585 0.34% Pondicherry 1183 0.04% HP 80 0.00% J&K 706 0.02% Manipur 2213 0.07% Meghalaya 4427 0.15% Mizoram 1032 0.03% Nagaland 252 0.00% Sikkim 4297 0.15% Tripura 1534 0.05% Uttaranchal 1831 0.06% Andaman 1884 0.06% Arunachal Pradesh 4809 0.17% Dadar & Nagar Haveli 1499 0.05% Daman & Diu 76 0.15% Goa 1951 0.06% TOTAL 2813627 100.00%

Ministry of Tourism AC Nielsen ORG-MARG Government of India
Final Report For Andhra Pradesh – Annexure 5: Supplementary Tables 59
Table A5:2 - Percentage and estimated Number of Domestic Leisure Tourists / Visitors visited from other State in the month of August’09 Name of State Estimated Domestic Leisure Visitors Percentage AP (Same State) 1997841 67.87% Maharashtra 125990 4.28% Delhi 55937 1.90% Karnataka 132251 4.49% Kerala 21241 0.72% MP 20469 0.70% Tamil Nadu 274569 9.33% Chandigarh 2212 0.08% West Bengal 89987 3.06% UP 30272 1.03% Assam 2767 0.09% Bihar 20755 0.71% Gujarat 18296 0.62% Orissa 67028 2.28% Jharkhand 12035 0.41% Rajasthan 9753 0.33% Chhatisgarh 13234 0.45% Punjab 20036 0.68% Haryana 9029 0.31% Pondicherry 1238 0.04% HP 184 0.01% J&K 639 0.02% Manipur 1316 0.04% Meghalaya 3632 0.12% Mizoram 1080 0.04% Nagaland 264 0.01% Sikkim 3496 0.12% Tripura 605 0.02% Uttaranchal 916 0.03% Andaman 971 0.03% Arunachal Pradesh 4031 0.14% Dadar & Nagar Haveli 568 0.02% Daman & Diu 80 0.00% Goa 1041 0.04% TOTAL 2943760 100.00%

Ministry of Tourism AC Nielsen ORG-MARG Government of India
Final Report For Andhra Pradesh – Annexure 5: Supplementary Tables 60
Table A5:3 - Percentage and estimated Number of Domestic Leisure Tourists / Visitors visited from other State in the month of September’09 Name of State Estimated Domestic Leisure Visitors Percentage AP (Same State) 2030800 71.19% Maharashtra 114332 4.01% Delhi 43512 1.53% Karnataka 129151 4.53% Kerala 29272 1.03% MP 17866 0.63% Tamil Nadu 168157 5.90% Chandigarh 2174 0.08% West Bengal 88197 3.09% UP 28333 0.99% Assam 2712 0.10% Bihar 21142 0.74% Gujarat 18697 0.66% Orissa 63950 2.24% Jharkhand 12693 0.44% Rajasthan 11419 0.40% Chhatisgarh 12824 0.45% Punjab 18384 0.64% Haryana 10718 0.38% Pondicherry 2199 0.08% HP 81 0.00% J&K 816 0.03% Manipur 2244 0.08% Meghalaya 4489 0.16% Mizoram 2047 0.07% Nagaland 455 0.02% Sikkim 3056 0.11% Tripura 1455 0.05% Uttaranchal 1956 0.07% Andaman 1910 0.07% Arunachal Pradesh 3775 0.13% Dadar & Nagar Haveli 1519 0.05% Daman & Diu 177 0.01% Goa 1978 0.07% TOTAL 2852493 100.00%

Ministry of Tourism AC Nielsen ORG-MARG Government of India
Final Report For Andhra Pradesh – Annexure 5: Supplementary Tables 61
Table A5:4 - Percentage and estimated Number of Domestic Leisure Tourists / Visitors visited from other State in the month of October’09 Name of State Estimated Domestic Leisure Visitors Percentage AP (Same State) 2808335 69.53% Maharashtra 171888 4.26% Delhi 73027 1.81% Karnataka 191455 4.74% Kerala 42864 1.06% MP 36713 0.91% Tamil Nadu 249517 6.18% Chandigarh 4662 0.12% West Bengal 133466 3.30% UP 51534 1.28% Assam 12424 0.31% Bihar 37104 0.92% Gujarat 16474 0.41% Orissa 81966 2.03% Jharkhand 14141 0.35% Rajasthan 13753 0.34% Chhatisgarh 17158 0.42% Punjab 27863 0.69% Haryana 14760 0.37% Pondicherry 1598 0.04% HP 215 0.01% J&K 1013 0.03% Manipur 4177 0.10% Meghalaya 5356 0.13% Mizoram 1382 0.03% Nagaland 462 0.01% Sikkim 5168 0.13% Tripura 3202 0.08% Uttaranchal 3628 0.09% Andaman 3704 0.09% Arunachal Pradesh 5903 0.15% Dadar & Nagar Haveli 1151 0.03% Daman & Diu 110 0.00% Goa 2801 0.07% TOTAL 4038975 100.00%

Ministry of Tourism AC Nielsen ORG-MARG Government of India
Final Report For Andhra Pradesh – Annexure 5: Supplementary Tables 62
Table A5:5 - Percentage and estimated Number of Domestic Leisure Tourists / Visitors visited from other State in the month of November’09 Name of State Estimated Domestic Leisure Visitors Percentage AP (Same State) 2564297 70.99% Maharashtra 154788 4.28% Delhi 66370 1.84% Karnataka 152288 4.22% Kerala 48336 1.34% MP 33891 0.94% Tamil Nadu 214217 5.93% Chandigarh 2487 0.07% West Bengal 109424 3.03% UP 36147 1.00% Assam 12168 0.34% Bihar 23241 0.64% Gujarat 13678 0.38% Orissa 72251 2.00% Jharkhand 13541 0.37% Rajasthan 15195 0.42% Chhatisgarh 14240 0.39% Punjab 23814 0.66% Haryana 11306 0.31% Pondicherry 1519 0.04% HP 1103 0.03% J&K 1106 0.03% Manipur 1842 0.05% Meghalaya 4684 0.13% Mizoram 1126 0.03% Nagaland 323 0.01% Sikkim 5517 0.15% Tripura 1970 0.05% Uttaranchal 1351 0.04% Andaman 2419 0.07% Arunachal Pradesh 5174 0.14% Dadar & Nagar Haveli 924 0.03% Daman & Diu 98 0.00% Goa 1505 0.04% TOTAL 3612339 100.00%

Ministry of Tourism AC Nielsen ORG-MARG Government of India
Final Report For Andhra Pradesh – Annexure 5: Supplementary Tables 63
Table A5:6 - Percentage and estimated Number of Domestic Leisure Tourists / Visitors visited from other State in the month of December ‘09 Name of State Estimated Domestic Leisure Visitors Percentage AP (Same State) 2352309 71.26% Maharashtra 132303 4.01% Delhi 51509 1.56% Karnataka 148293 4.49% Kerala 35030 1.06% MP 21831 0.66% Tamil Nadu 195745 5.93% Chandigarh 1359 0.04% West Bengal 100902 3.06% UP 33944 1.03% Assam 1981 0.06% Bihar 22151 0.67% Gujarat 21636 0.66% Orissa 75158 2.28% Jharkhand 12374 0.37% Rajasthan 12057 0.37% Chhatisgarh 14840 0.45% Punjab 23588 0.71% Haryana 11245 0.34% Pondicherry 1388 0.04% HP 94 0.00% J&K 828 0.03% Manipur 2597 0.08% Meghalaya 5194 0.16% Mizoram 1211 0.04% Nagaland 296 0.01% Sikkim 5041 0.15% Tripura 1800 0.05% Uttaranchal 2148 0.07% Andaman 2210 0.07% Arunachal Pradesh 5641 0.17% Dadar & Nagar Haveli 1758 0.05% Daman & Diu 90 0.00% Goa 2289 0.07% TOTAL 3300838 100.00%

Ministry of Tourism AC Nielsen ORG-MARG Government of India
Final Report For Andhra Pradesh – Annexure 5: Supplementary Tables 64
Table A5:7 - Percentage and estimated Number of Domestic Leisure Tourists / Visitors visited from other State in the month of January ‘10 Name of State Estimated Domestic Leisure Visitors Percentage AP (Same State) 2225863 70.95% Maharashtra 131753 4.20% Delhi 58959 1.88% Karnataka 130952 4.17% Kerala 34296 1.09% MP 21750 0.69% Tamil Nadu 185055 5.90% Chandigarh 2291 0.07% West Bengal 94907 3.02% UP 31263 1.00% Assam 2883 0.09% Bihar 20054 0.64% Gujarat 21565 0.69% Orissa 70438 2.25% Jharkhand 12761 0.41% Rajasthan 12460 0.40% Chhatisgarh 13105 0.42% Punjab 23420 0.75% Haryana 11688 0.37% Pondicherry 2319 0.07% HP 190 0.01% J&K 687 0.02% Manipur 2268 0.07% Meghalaya 5637 0.18% Mizoram 1651 0.05% Nagaland 481 0.02% Sikkim 4291 0.14% Tripura 1711 0.05% Uttaranchal 2242 0.07% Andaman 1201 0.04% Arunachal Pradesh 4362 0.14% Dadar & Nagar Haveli 2171 0.07% Daman & Diu 185 0.01% Goa 2576 0.08% TOTAL 3137437 100.00%

Ministry of Tourism AC Nielsen ORG-MARG Government of India
Final Report For Andhra Pradesh – Annexure 5: Supplementary Tables 65
Table A5:8 - Percentage and estimated Number of Domestic Leisure Tourists / Visitors visited from other State in the month of February ‘10 Name of State Estimated Domestic Leisure Visitors Percentage AP (Same State) 2009209 70.53% Maharashtra 124186 4.36% Delhi 43456 1.53% Karnataka 137988 4.84% Kerala 38234 1.34% MP 28842 1.01% Tamil Nadu 158941 5.58% Chandigarh 2173 0.08% West Bengal 85086 2.99% UP 28296 0.99% Assam 2710 0.10% Bihar 22118 0.78% Gujarat 21673 0.76% Orissa 60867 2.14% Jharkhand 11679 0.41% Rajasthan 10406 0.37% Chhatisgarh 11808 0.41% Punjab 22358 0.78% Haryana 8705 0.31% Pondicherry 1198 0.04% HP 581 0.02% J&K 1215 0.04% Manipur 1241 0.04% Meghalaya 3483 0.12% Mizoram 1045 0.04% Nagaland 255 0.01% Sikkim 3351 0.12% Tripura 554 0.02% Uttaranchal 854 0.03% Andaman 907 0.03% Arunachal Pradesh 3869 0.14% Dadar & Nagar Haveli 517 0.02% Daman & Diu 77 0.00% Goa 975 0.03% TOTAL 2848856 100.00%
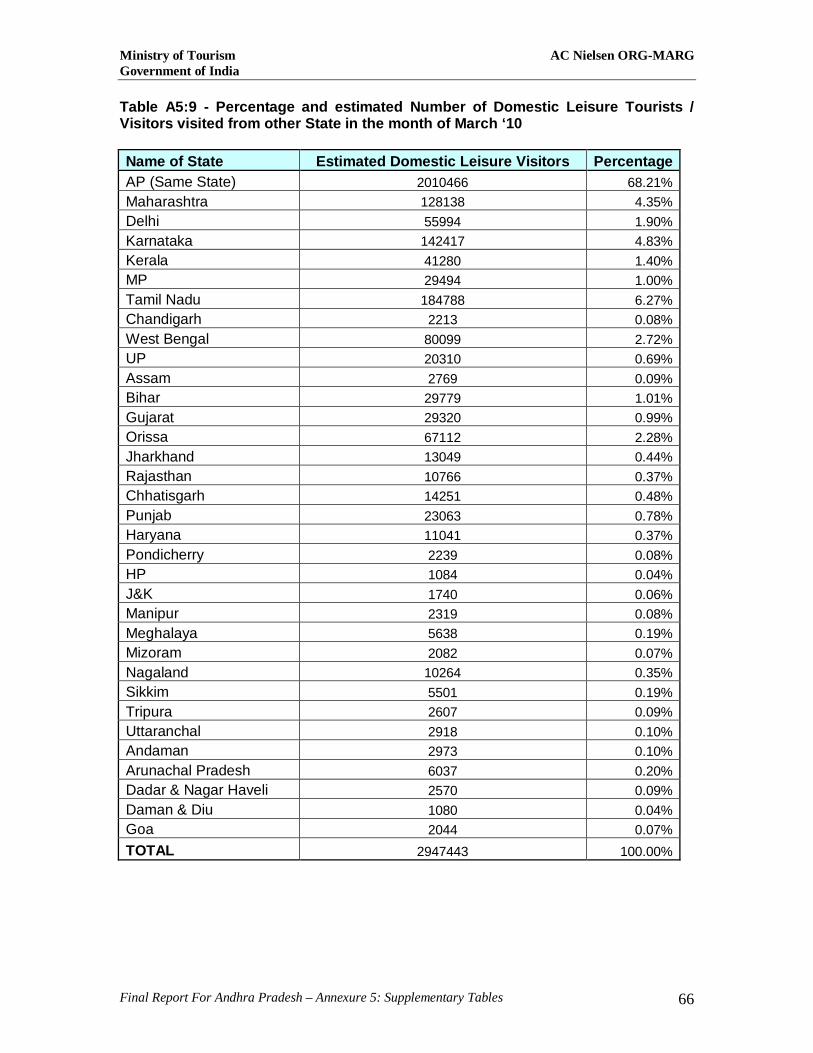
Ministry of Tourism AC Nielsen ORG-MARG Government of India
Final Report For Andhra Pradesh – Annexure 5: Supplementary Tables 66
Table A5:9 - Percentage and estimated Number of Domestic Leisure Tourists / Visitors visited from other State in the month of March ‘10 Name of State Estimated Domestic Leisure Visitors Percentage AP (Same State) 2010466 68.21% Maharashtra 128138 4.35% Delhi 55994 1.90% Karnataka 142417 4.83% Kerala 41280 1.40% MP 29494 1.00% Tamil Nadu 184788 6.27% Chandigarh 2213 0.08% West Bengal 80099 2.72% UP 20310 0.69% Assam 2769 0.09% Bihar 29779 1.01% Gujarat 29320 0.99% Orissa 67112 2.28% Jharkhand 13049 0.44% Rajasthan 10766 0.37% Chhatisgarh 14251 0.48% Punjab 23063 0.78% Haryana 11041 0.37% Pondicherry 2239 0.08% HP 1084 0.04% J&K 1740 0.06% Manipur 2319 0.08% Meghalaya 5638 0.19% Mizoram 2082 0.07% Nagaland 10264 0.35% Sikkim 5501 0.19% Tripura 2607 0.09% Uttaranchal 2918 0.10% Andaman 2973 0.10% Arunachal Pradesh 6037 0.20% Dadar & Nagar Haveli 2570 0.09% Daman & Diu 1080 0.04% Goa 2044 0.07% TOTAL 2947443 100.00%

Ministry of Tourism AC Nielsen ORG-MARG Government of India
Final Report For Andhra Pradesh – Annexure 5: Supplementary Tables 67
Table A5:10 - Percentage and estimated Number of Domestic Leisure Tourists / Visitors visited from other State in the month of April ‘10 Name of State Estimated Domestic Leisure Visitors Percentage AP (Same State) 2340050 70.93% Maharashtra 132232 4.01% Delhi 61481 1.86% Karnataka 147214 4.46% Kerala 36012 1.09% MP 22819 0.69% Tamil Nadu 194640 5.90% Chandigarh 2358 0.07% West Bengal 99848 3.03% UP 33925 1.03% Assam 2980 0.09% Bihar 21139 0.64% Gujarat 22625 0.69% Orissa 74118 2.25% Jharkhand 13367 0.41% Rajasthan 11050 0.33% Chhatisgarh 15832 0.48% Punjab 23575 0.71% Haryana 11239 0.34% Pondicherry 1387 0.04% HP 94 0.00% J&K 828 0.03% Manipur 2595 0.08% Meghalaya 5191 0.16% Mizoram 1211 0.04% Nagaland 295 0.01% Sikkim 5038 0.15% Tripura 1799 0.05% Uttaranchal 2147 0.07% Andaman 2209 0.07% Arunachal Pradesh 5638 0.17% Dadar & Nagar Haveli 1757 0.05% Daman & Diu 90 0.00% Goa 2288 0.07% TOTAL 3299071 100.00%

Ministry of Tourism AC Nielsen ORG-MARG Government of India
Final Report For Andhra Pradesh – Annexure 5: Supplementary Tables 68
Table A5:11 - Percentage and estimated Number of Domestic Leisure Tourists / Visitors visited from other State in the month of May ‘10 Name of State Estimated Domestic Leisure Visitors Percentage AP (Same State) 2380751 71.20% Maharashtra 131015 3.92% Delhi 53175 1.59% Karnataka 140212 4.19% Kerala 45484 1.36% MP 32114 0.96% Tamil Nadu 197278 5.90% Chandigarh 1376 0.04% West Bengal 101208 3.03% UP 33383 1.00% Assam 2006 0.06% Bihar 21438 0.64% Gujarat 20916 0.63% Orissa 75131 2.25% Jharkhand 12534 0.37% Rajasthan 12213 0.37% Chhatisgarh 15032 0.45% Punjab 22893 0.68% Haryana 10391 0.31% Pondicherry 1406 0.04% HP 1095 0.03% J&K 839 0.03% Manipur 2630 0.08% Meghalaya 5261 0.16% Mizoram 1227 0.04% Nagaland 299 0.01% Sikkim 5106 0.15% Tripura 1823 0.05% Uttaranchal 3176 0.09% Andaman 2239 0.07% Arunachal Pradesh 4764 0.14% Dadar & Nagar Haveli 2781 0.08% Daman & Diu 1 0.00% Goa 2358 0.07% TOTAL 3343555 100.00%

Ministry of Tourism AC Nielsen ORG-MARG Government of India
Final Report For Andhra Pradesh – Annexure 5: Supplementary Tables 69
Table A5:12 - Percentage and estimated Number of Domestic Leisure Tourists / Visitors visited from other State in the month of June ‘10 Name of State Estimated Domestic Leisure Visitors Percentage AP (Same State) 2314259 71.23% Maharashtra 131219 4.04% Delhi 51697 1.59% Karnataka 144958 4.46% Kerala 33479 1.03% MP 22487 0.69% Tamil Nadu 191662 5.90% Chandigarh 2337 0.07% West Bengal 98313 3.03% UP 34409 1.06% Assam 2950 0.09% Bihar 20802 0.64% Gujarat 20295 0.62% Orissa 74975 2.31% Jharkhand 11179 0.34% Rajasthan 12867 0.40% Chhatisgarh 15606 0.48% Punjab 21216 0.65% Haryana 10068 0.31% Pondicherry 2366 0.07% HP 93 0.00% J&K 815 0.03% Manipur 3556 0.11% Meghalaya 4112 0.13% Mizoram 2192 0.07% Nagaland 291 0.01% Sikkim 3962 0.12% Tripura 2772 0.09% Uttaranchal 2114 0.07% Andaman 3175 0.10% Arunachal Pradesh 3552 0.11% Dadar & Nagar Haveli 1730 0.05% Daman & Diu 88 0.00% Goa 3253 0.10% TOTAL 3248848 100.00%
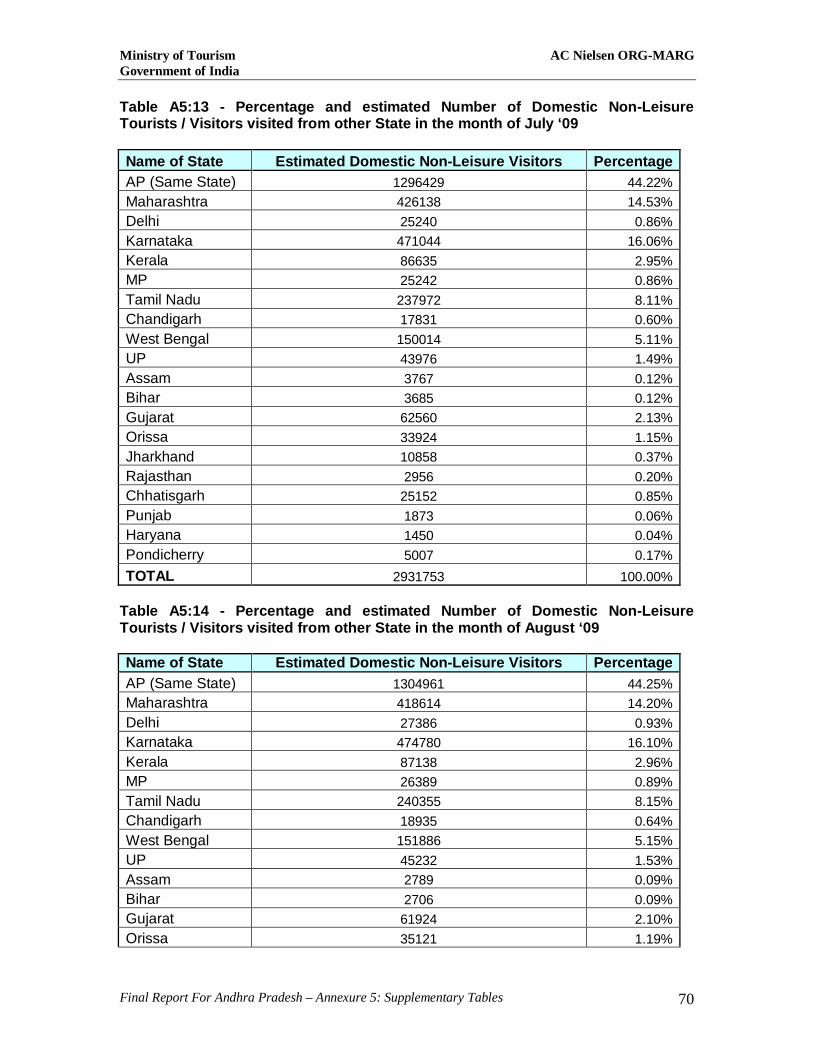
Ministry of Tourism AC Nielsen ORG-MARG Government of India
Final Report For Andhra Pradesh – Annexure 5: Supplementary Tables 70
Table A5:13 - Percentage and estimated Number of Domestic Non-Leisure Tourists / Visitors visited from other State in the month of July ‘09 Name of State Estimated Domestic Non-Leisure Visitors Percentage AP (Same State) 1296429 44.22% Maharashtra 426138 14.53% Delhi 25240 0.86% Karnataka 471044 16.06% Kerala 86635 2.95% MP 25242 0.86% Tamil Nadu 237972 8.11% Chandigarh 17831 0.60% West Bengal 150014 5.11% UP 43976 1.49% Assam 3767 0.12% Bihar 3685 0.12% Gujarat 62560 2.13% Orissa 33924 1.15% Jharkhand 10858 0.37% Rajasthan 2956 0.20% Chhatisgarh 25152 0.85% Punjab 1873 0.06% Haryana 1450 0.04% Pondicherry 5007 0.17% TOTAL 2931753 100.00%
Table A5:14 - Percentage and estimated Number of Domestic Non-Leisure Tourists / Visitors visited from other State in the month of August ‘09 Name of State Estimated Domestic Non-Leisure Visitors Percentage AP (Same State) 1304961 44.25% Maharashtra 418614 14.20% Delhi 27386 0.93% Karnataka 474780 16.10% Kerala 87138 2.96% MP 26389 0.89% Tamil Nadu 240355 8.15% Chandigarh 18935 0.64% West Bengal 151886 5.15% UP 45232 1.53% Assam 2789 0.09% Bihar 2706 0.09% Gujarat 61924 2.10% Orissa 35121 1.19%

Ministry of Tourism AC Nielsen ORG-MARG Government of India
Final Report For Andhra Pradesh – Annexure 5: Supplementary Tables 71
Jharkhand 11921 0.40% Rajasthan 3073 0.10% Chhatisgarh 25298 0.86% Punjab 2884 0.10% Haryana 1408 0.05% Pondicherry 5986 0.20% TOTAL 2948785 100.00%
Table A5:15 - Percentage and estimated Number of Domestic Non-Leisure Tourists / Visitors visited from other State in the month of September ‘09 Name of State Estimated Domestic Non-Leisure Visitors Percentage AP (Same State) 1265195 43.87% Maharashtra 420158 14.57% Delhi 25826 0.90% Karnataka 464328 16.10% Kerala 86216 2.99% MP 25829 0.90% Tamil Nadu 235075 8.15% Chandigarh 17539 0.61% West Bengal 147557 5.12% UP 43256 1.50% Assam 3705 0.13% Bihar 3624 0.13% Gujarat 62536 2.17% Orissa 33369 1.16% Jharkhand 11680 0.41% Rajasthan 3907 0.14% Chhatisgarh 25740 0.89% Punjab 2443 0.08% Haryana 1826 0.06% Pondicherry 3925 0.14% TOTAL 2883735 100.00%
Table A5:16 - Percentage and estimated Number of Domestic Non-Leisure Tourists / Visitors visited from other State in the month of October ‘09 Name of State Estimated Domestic Non-Leisure Visitors Percentage AP (Same State) 1538502 41.52% Maharashtra 538578 14.54% Delhi 41899 1.13% Karnataka 595332 16.07% Kerala 129494 3.49% MP 41903 1.13%

Ministry of Tourism AC Nielsen ORG-MARG Government of India
Final Report For Andhra Pradesh – Annexure 5: Supplementary Tables 72
Tamil Nadu 310763 8.39% Chandigarh 32536 0.88% West Bengal 189597 5.12% UP 65580 1.77% Assam 5761 0.16% Bihar 5657 0.15% Gujarat 89067 2.40% Orissa 52876 1.43% Jharkhand 14723 0.40% Rajasthan 4736 0.13% Chhatisgarh 33789 0.91% Punjab 3368 0.09% Haryana 2832 0.08% Pondicherry 8328 0.22% TOTAL 3705319 100.00%
Table A5:17 - Percentage and estimated Number of Domestic Non-Leisure Tourists / Visitors visited from other State in the month of November ‘09 Name of State Estimated Domestic Non-Leisure Visitors Percentage AP (Same State) 1505080 44.52% Maharashtra 501435 14.83% Delhi 39107 1.16% Karnataka 443221 13.11% Kerala 89910 2.66% MP 39110 1.16% Tamil Nadu 274437 8.12% Chandigarh 30564 0.90% West Bengal 183001 5.41% UP 60715 1.80% Assam 6344 0.19% Bihar 5249 0.16% Gujarat 82146 2.43% Orissa 49123 1.45% Jharkhand 17522 0.52% Rajasthan 5409 0.16% Chhatisgarh 34006 1.01% Punjab 4161 0.12% Haryana 3672 0.11% Pondicherry 6774 0.20% TOTAL 3380985 100.00%

Ministry of Tourism AC Nielsen ORG-MARG Government of India
Final Report For Andhra Pradesh – Annexure 5: Supplementary Tables 73
Table A5:18 - Percentage and estimated Number of Domestic Non-Leisure Tourists / Visitors visited from other State in the month of December ‘09 Name of State Estimated Domestic Non-Leisure Visitors Percentage AP (Same State) 1484771 47.41% Maharashtra 445176 14.22% Delhi 25959 0.83% Karnataka 403142 12.87% Kerala 82538 2.64% MP 25962 0.83% Tamil Nadu 244188 7.80% Chandigarh 29046 0.93% West Bengal 162237 5.18% UP 49973 1.60% Assam 7023 0.22% Bihar 5936 0.19% Gujarat 69823 2.23% Orissa 38236 1.22% Jharkhand 19598 0.63% Rajasthan 4157 0.13% Chhatisgarh 25866 0.83% Punjab 2001 0.06% Haryana 1048 0.03% Pondicherry 4848 0.15% TOTAL 3131531 100.00%
Table A5:19 - Percentage and estimated Number of Domestic Non-Leisure Tourists / Visitors visited from other State in the month of January ‘10 Name of State Estimated Domestic Non-Leisure Visitors Percentage AP (Same State) 1334759 44.22% Maharashtra 438737 14.54% Delhi 25986 0.86% Karnataka 484970 16.07% Kerala 89196 2.96% MP 25989 0.86% Tamil Nadu 245008 8.12% Chandigarh 18359 0.61% West Bengal 154449 5.12% UP 45276 1.50% Assam 3878 0.13% Bihar 3794 0.13% Gujarat 64410 2.13%

Ministry of Tourism AC Nielsen ORG-MARG Government of India
Final Report For Andhra Pradesh – Annexure 5: Supplementary Tables 74
Orissa 34927 1.16% Jharkhand 11179 0.37% Rajasthan 3043 0.10% Chhatisgarh 25896 0.86% Punjab 1929 0.06% Haryana 1492 0.05% Pondicherry 5155 0.17% TOTAL 3018432 100.00%
Table A5:20 - Percentage and estimated Number of Domestic Non-Leisure Tourists / Visitors visited from other State in the month of February ‘10 Name of State Estimated Domestic Non-Leisure Visitors Percentage AP (Same State) 1200014 43.25% Maharashtra 373321 13.45% Delhi 30888 1.11% Karnataka 413822 14.91% Kerala 91996 3.32% MP 33891 1.22% Tamil Nadu 265231 9.56% Chandigarh 19877 0.72% West Bengal 153982 5.55% UP 46622 1.68% Assam 4565 0.16% Bihar 4488 0.16% Gujarat 60911 2.20% Orissa 30108 1.09% Jharkhand 9276 0.33% Rajasthan 4797 0.17% Chhatisgarh 19805 0.71% Punjab 2773 0.10% Haryana 2372 0.09% Pondicherry 6039 0.22% TOTAL 2774778 100.00%

Ministry of Tourism AC Nielsen ORG-MARG Government of India
Final Report For Andhra Pradesh – Annexure 5: Supplementary Tables 75
Table A5:21 - Percentage and estimated Number of Domestic Non-Leisure Tourists / Visitors visited from other State in the month of March ‘10 Name of State Estimated Domestic Non-Leisure Visitors Percentage AP (Same State) 1187064 44.22% Maharashtra 389190 14.50% Delhi 24110 0.90% Karnataka 430307 16.03% Kerala 80326 2.99% MP 24113 0.90% Tamil Nadu 216897 8.08% Chandigarh 17327 0.65% West Bengal 136359 5.08% UP 41267 1.54% Assam 4449 0.17% Bihar 4374 0.16% Gujarat 56283 2.10% Orissa 30063 1.12% Jharkhand 8942 0.33% Rajasthan 3706 0.14% Chhatisgarh 21030 0.78% Punjab 1215 0.05% Haryana 1827 0.07% Pondicherry 5585 0.21% TOTAL 2684435 100.00%
Table A5:22 - Percentage and estimated Number of Domestic Non-Leisure Tourists / Visitors visited from other State in the month of April ‘10 Name of State Estimated Domestic Non-Leisure Visitors Percentage AP (Same State) 1205699 41.79% Maharashtra 429324 14.88% Delhi 34836 1.21% Karnataka 473512 16.41% Kerala 95249 3.30% MP 34839 1.21% Tamil Nadu 244167 8.46% Chandigarh 27546 0.95% West Bengal 137615 4.77% UP 44273 1.53% Assam 4706 0.16% Bihar 5626 0.20% Gujarat 62560 2.17%

Ministry of Tourism AC Nielsen ORG-MARG Government of India
Final Report For Andhra Pradesh – Annexure 5: Supplementary Tables 76
Orissa 36382 1.26% Jharkhand 11684 0.41% Rajasthan 3908 0.14% Chhatisgarh 22750 0.79% Punjab 2344 0.08% Haryana 1926 0.07% Pondicherry 5927 0.21% TOTAL 2884875 100.00%
Table A5:23 - Percentage and estimated Number of Domestic Non-Leisure Tourists / Visitors visited from other State in the month of May ‘10 Name of State Estimated Domestic Non-Leisure Visitors Percentage AP (Same State) 1243170 42.51% Maharashtra 435067 14.88% Delhi 35176 1.20% Karnataka 469859 16.07% Kerala 92417 3.16% MP 35179 1.20% Tamil Nadu 245374 8.39% Chandigarh 19787 0.68% West Bengal 149637 5.12% UP 45866 1.57% Assam 3757 0.13% Bihar 4676 0.16% Gujarat 60403 2.07% Orissa 33839 1.16% Jharkhand 11831 0.40% Rajasthan 2948 0.10% Chhatisgarh 24089 0.82% Punjab 2869 0.10% Haryana 2446 0.08% Pondicherry 5995 0.20% TOTAL 2924383 100.00%

Ministry of Tourism AC Nielsen ORG-MARG Government of India
Final Report For Andhra Pradesh – Annexure 5: Supplementary Tables 77
Table A5:24 - Percentage and estimated Number of Domestic Non-Leisure Tourists / Visitors visited from other State in the month of June ‘10 Name of State Estimated Domestic Non-Leisure Visitors Percentage AP (Same State) 1214111 42.81% Maharashtra 422228 14.89% Delhi 34416 1.21% Karnataka 445668 15.71% Kerala 93807 3.31% MP 34418 1.21% Tamil Nadu 240204 8.47% Chandigarh 18249 0.64% West Bengal 143117 5.05% UP 43541 1.54% Assam 4644 0.16% Bihar 4565 0.16% Gujarat 50518 1.78% Orissa 31817 1.12% Jharkhand 13503 0.48% Rajasthan 3859 0.14% Chhatisgarh 26331 0.93% Punjab 2812 0.10% Haryana 2402 0.08% Pondicherry 5844 0.21% TOTAL 2836055 100.00%

Ministry of Tourism AC Nielsen ORG-MARG Government of India
Final Report For Andhra Pradesh – Annexure 5: Supplementary Tables 78
Table A5:25 - Percentage and estimated Number of Foreign Leisure Tourists / Visitors visited from other Country in the month of July’09 County of Origin Estimated Domestic Leisure Visitors Percentage UK 2085 11.06% USA 2070 10.98% Canada 1777 9.43% Germany 1537 8.16% Europe 1943 10.31% Australia 1823 9.67% Sri Lanka 548 2.90% France 861 4.57% Japan 409 2.17% Malaysia 214 1.13% Singapore 491 2.60% Italy 241 1.28% Nepal 149 0.79% Netherlands 473 2.51% Korea 66 0.35% Israel 186 0.98% Pakistan 357 1.89% Bangladesh 535 2.84% UAE 1557 8.26% Spain 927 4.91% Switzerland 221 1.17% Saudi Arabia 6 0.03% Greece 1 0.02% Argentina 64 0.34% Belgium 48 0.25% Morocco 2 0.04% Cambodia 1 0.02% Maldives 1 0.02% Norway 79 0.41% Philippines 37 0.19% Denmark 19 0.14% Egypt 6 0.03% South Africa 9 0.04% Finland 96 0.51% Total 18841 100.00%
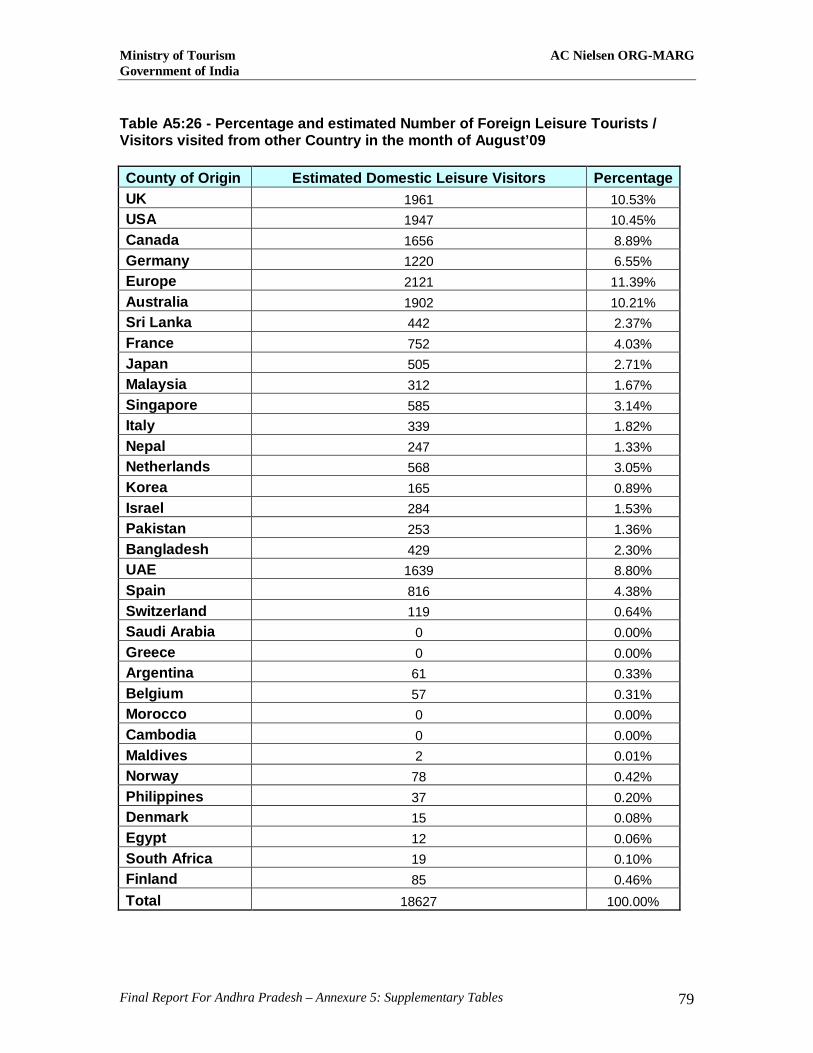
Ministry of Tourism AC Nielsen ORG-MARG Government of India
Final Report For Andhra Pradesh – Annexure 5: Supplementary Tables 79
Table A5:26 - Percentage and estimated Number of Foreign Leisure Tourists / Visitors visited from other Country in the month of August’09 County of Origin Estimated Domestic Leisure Visitors Percentage UK 1961 10.53% USA 1947 10.45% Canada 1656 8.89% Germany 1220 6.55% Europe 2121 11.39% Australia 1902 10.21% Sri Lanka 442 2.37% France 752 4.03% Japan 505 2.71% Malaysia 312 1.67% Singapore 585 3.14% Italy 339 1.82% Nepal 247 1.33% Netherlands 568 3.05% Korea 165 0.89% Israel 284 1.53% Pakistan 253 1.36% Bangladesh 429 2.30% UAE 1639 8.80% Spain 816 4.38% Switzerland 119 0.64% Saudi Arabia 0 0.00% Greece 0 0.00% Argentina 61 0.33% Belgium 57 0.31% Morocco 0 0.00% Cambodia 0 0.00% Maldives 2 0.01% Norway 78 0.42% Philippines 37 0.20% Denmark 15 0.08% Egypt 12 0.06% South Africa 19 0.10% Finland 85 0.46% Total 18627 100.00%

Ministry of Tourism AC Nielsen ORG-MARG Government of India
Final Report For Andhra Pradesh – Annexure 5: Supplementary Tables 80
Table A5:27 - Percentage and estimated Number of Foreign Leisure Tourists / Visitors visited from other Country in the month of September’09 County of Origin Estimated Domestic Leisure Visitors Percentage UK 1990 10.54% USA 2075 10.99% Canada 1681 8.90% Germany 1441 7.63% Europe 2048 10.84% Australia 1827 9.68% Sri Lanka 550 2.91% France 763 4.04% Japan 510 2.70% Malaysia 215 1.14% Singapore 492 2.61% Italy 342 1.81% Nepal 249 1.32% Netherlands 574 3.04% Korea 166 0.88% Israel 87 0.46% Pakistan 257 1.36% Bangladesh 436 2.31% UAE 1660 8.79% Spain 829 4.39% Switzerland 122 0.65% Saudi Arabia 106 0.56% Greece 15 0.08% Argentina 69 0.37% Belgium 59 0.31% Morocco 20 0.10% Cambodia 14 0.07% Maldives 10 0.05% Norway 89 0.47% Philippines 47 0.25% Denmark 29 0.15% Egypt 1 0.00% South Africa 14 0.07% Finland 96 0.51% Total 18885 100.00%

Ministry of Tourism AC Nielsen ORG-MARG Government of India
Final Report For Andhra Pradesh – Annexure 5: Supplementary Tables 81
Table A5:28 - Percentage and estimated Number of Foreign Leisure Tourists / Visitors visited from other Country in the month of October’09
County of Origin Estimated Domestic Leisure Visitors Percentage UK 2033 11.07% USA 1019 5.55% Canada 732 3.99% Germany 1599 8.70% Europe 2895 15.76% Australia 1878 10.22% Sri Lanka 635 3.45% France 940 5.12% Japan 499 2.72% Malaysia 309 1.68% Singapore 579 3.15% Italy 335 1.82% Nepal 245 1.34% Netherlands 562 3.06% Korea 7 0.04% Israel 286 1.56% Pakistan 248 1.35% Bangladesh 572 3.11% UAE 1718 9.35% Spain 804 4.37% Switzerland 116 0.63% Saudi Arabia 10 0.06% Greece 0 0.00% Argentina 53 0.29% Belgium 57 0.31% Morocco 1 0.00% Cambodia 3 0.01% Maldives 0 0.00% Norway 87 0.47% Philippines 26 0.14% Denmark 9 0.05% Egypt 16 0.09% South Africa 19 0.10% Finland 84 0.46% Total 18374 100.00%

Ministry of Tourism AC Nielsen ORG-MARG Government of India
Final Report For Andhra Pradesh – Annexure 5: Supplementary Tables 82
Table A5:29 - Percentage and estimated Number of Foreign Leisure Tourists / Visitors visited from other Country in the month of November’09 County of Origin Estimated Domestic Leisure Visitors Percentage UK 2812 12.39% USA 2694 11.87% Canada 1140 5.02% Germany 1952 8.60% Europe 2541 11.20% Australia 1597 7.03% Sri Lanka 561 2.47% France 1238 5.45% Japan 393 1.73% Malaysia 158 0.70% Singapore 491 2.16% Italy 491 2.16% Nepal 80 0.35% Netherlands 670 2.95% Korea 180 0.79% Israel 325 1.43% Pakistan 330 1.45% Bangladesh 545 2.40% UAE 1975 8.70% Spain 1416 6.24% Switzerland 367 1.62% Saudi Arabia 105 0.46% Greece 100 0.44% Argentina 78 0.35% Belgium 107 0.47% Morocco 11 0.05% Cambodia 1 0.00% Maldives 11 0.05% Norway 105 0.46% Philippines 45 0.20% Denmark 33 0.14% Egypt 61 0.27% South Africa 21 0.09% Finland 66 0.29% Total 22700 100.00%

Ministry of Tourism AC Nielsen ORG-MARG Government of India
Final Report For Andhra Pradesh – Annexure 5: Supplementary Tables 83
Table A5:30 - Percentage and estimated Number of Foreign Leisure Tourists / Visitors visited from other Country in the month of December ‘09 County of Origin Estimated Domestic Leisure Visitors Percentage UK 2987 11.07% USA 2966 10.99% Canada 2045 7.58% Germany 2002 7.42% Europe 2984 11.06% Australia 2712 10.05% Sri Lanka 885 3.28% France 1334 4.94% Japan 486 1.80% Malaysia 207 0.77% Singapore 603 2.23% Italy 546 2.02% Nepal 114 0.42% Netherlands 778 2.88% Korea 195 0.72% Israel 367 1.36% Pakistan 411 1.52% Bangladesh 667 2.47% UAE 2330 8.63% Spain 1427 5.29% Switzerland 417 1.55% Saudi Arabia 109 0.40% Greece 1 0.00% Argentina 0 0.00% Belgium 60 0.22% Morocco 3 0.01% Cambodia 1 0.00% Maldives 1 0.00% Norway 110 0.41% Philippines 57 0.21% Denmark 21 0.08% Egypt 14 0.05% South Africa 33 0.12% Finland 118 0.44% Total 26989 100.00%
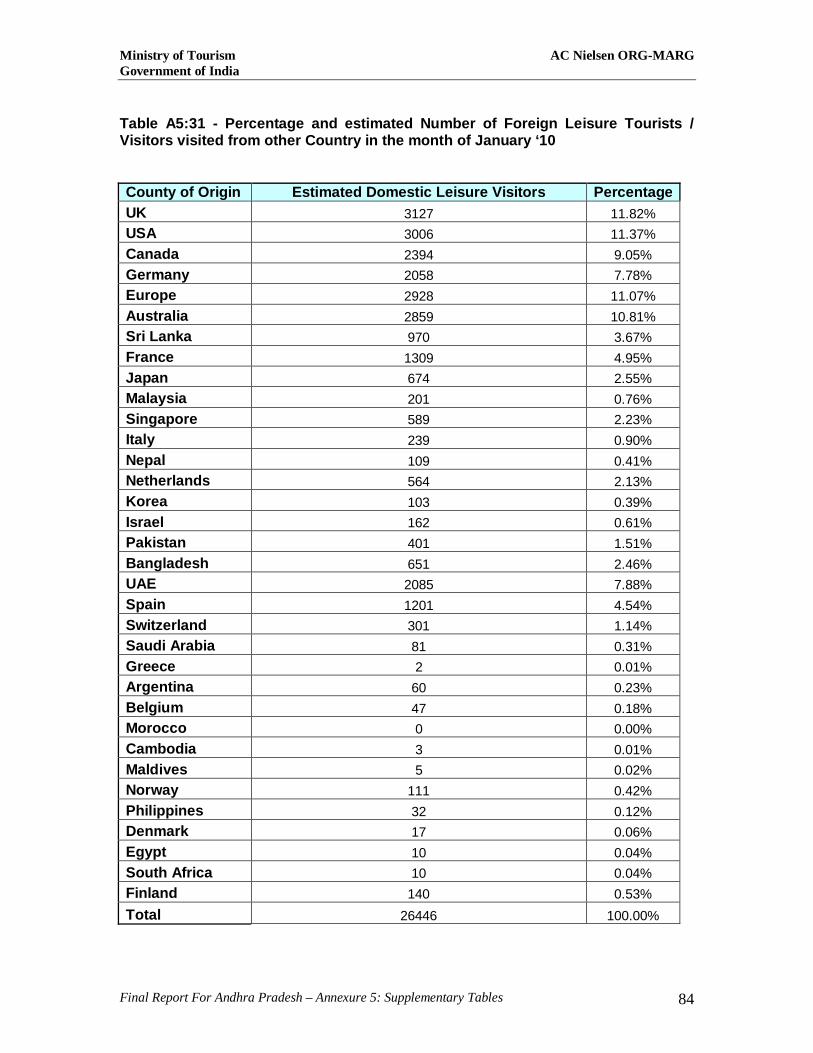
Ministry of Tourism AC Nielsen ORG-MARG Government of India
Final Report For Andhra Pradesh – Annexure 5: Supplementary Tables 84
Table A5:31 - Percentage and estimated Number of Foreign Leisure Tourists / Visitors visited from other Country in the month of January ‘10 County of Origin Estimated Domestic Leisure Visitors Percentage UK 3127 11.82% USA 3006 11.37% Canada 2394 9.05% Germany 2058 7.78% Europe 2928 11.07% Australia 2859 10.81% Sri Lanka 970 3.67% France 1309 4.95% Japan 674 2.55% Malaysia 201 0.76% Singapore 589 2.23% Italy 239 0.90% Nepal 109 0.41% Netherlands 564 2.13% Korea 103 0.39% Israel 162 0.61% Pakistan 401 1.51% Bangladesh 651 2.46% UAE 2085 7.88% Spain 1201 4.54% Switzerland 301 1.14% Saudi Arabia 81 0.31% Greece 2 0.01% Argentina 60 0.23% Belgium 47 0.18% Morocco 0 0.00% Cambodia 3 0.01% Maldives 5 0.02% Norway 111 0.42% Philippines 32 0.12% Denmark 17 0.06% Egypt 10 0.04% South Africa 10 0.04% Finland 140 0.53% Total 26446 100.00%

Ministry of Tourism AC Nielsen ORG-MARG Government of India
Final Report For Andhra Pradesh – Annexure 5: Supplementary Tables 85
Table A5:32 - Percentage and estimated Number of Foreign Leisure Tourists / Visitors visited from other Country in the month of February ‘10 County of Origin Estimated Domestic Leisure Visitors Percentage UK 2869 13.40% USA 2452 11.46% Canada 2119 9.90% Germany 1547 7.23% Europe 2008 9.38% Australia 1872 8.74% Sri Lanka 523 2.44% France 1079 5.04% Japan 365 1.70% Malaysia 343 1.60% Singapore 458 2.14% Italy 374 1.75% Nepal 69 0.32% Netherlands 438 2.04% Korea 175 0.82% Israel 312 1.46% Pakistan 305 1.43% Bangladesh 508 2.37% UAE 1869 8.73% Spain 1153 5.39% Switzerland 152 0.71% Saudi Arabia 0 0.00% Greece 4 0.02% Argentina 70 0.33% Belgium 51 0.24% Morocco 16 0.07% Cambodia 3 0.01% Maldives 3 0.02% Norway 80 0.37% Philippines 32 0.15% Denmark 32 0.15% Egypt 19 0.09% South Africa 20 0.09% Finland 89 0.42% Total 21408 100.00%

Ministry of Tourism AC Nielsen ORG-MARG Government of India
Final Report For Andhra Pradesh – Annexure 5: Supplementary Tables 86
Table A5:33 - Percentage and estimated Number of Foreign Leisure Tourists / Visitors visited from other Country in the month of March ‘10 County of Origin Estimated Domestic Leisure Visitors Percentage UK 1362 10.31% USA 1352 10.23% Canada 1346 10.19% Germany 1178 8.92% Europe 1463 11.07% Australia 1379 10.43% Sri Lanka 385 2.91% France 704 5.33% Japan 187 1.42% Malaysia 250 1.89% Singapore 244 1.85% Italy 269 2.04% Nepal 205 1.55% Netherlands 232 1.76% Korea 146 1.11% Israel 231 1.75% Pakistan 150 1.14% Bangladesh 275 2.08% UAE 992 7.51% Spain 550 4.16% Switzerland 55 0.42% Saudi Arabia 4 0.03% Greece 1 0.01% Argentina 45 0.34% Belgium 33 0.25% Morocco 1 0.01% Cambodia 0 0.00% Maldives 1 0.01% Norway 55 0.42% Philippines 26 0.20% Denmark 13 0.10% Egypt 4 0.03% South Africa 6 0.05% Finland 68 0.51% Total 13214 100.00%
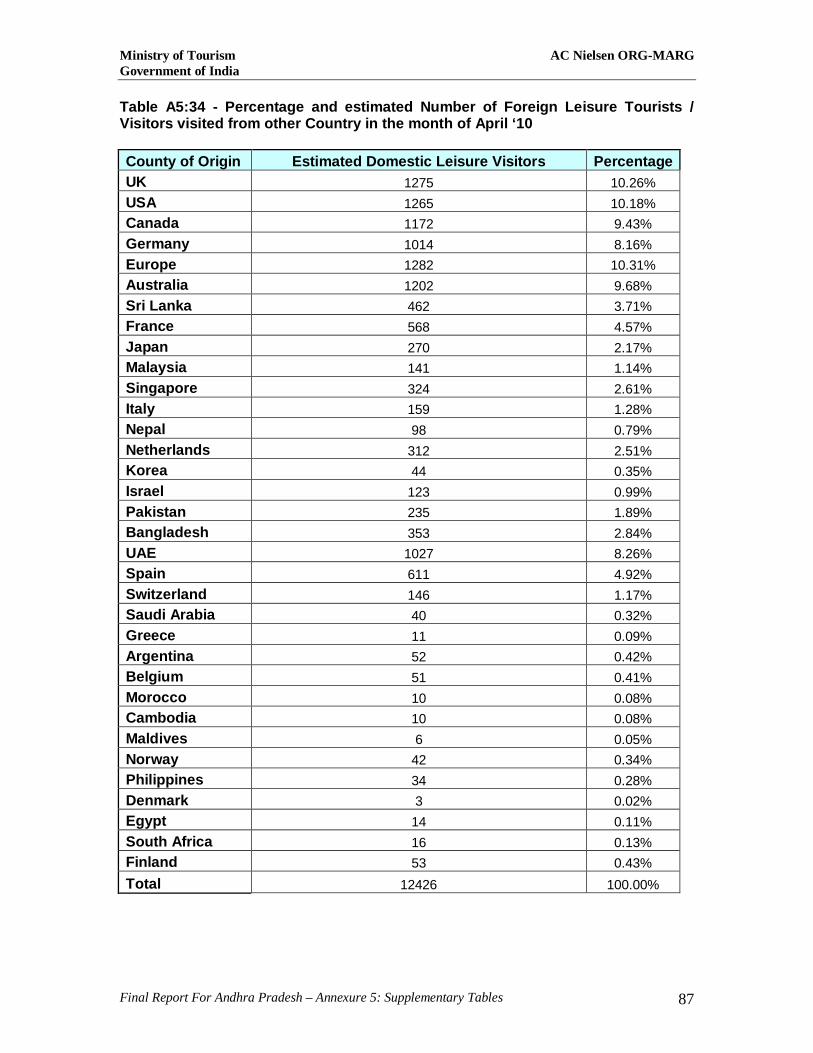
Ministry of Tourism AC Nielsen ORG-MARG Government of India
Final Report For Andhra Pradesh – Annexure 5: Supplementary Tables 87
Table A5:34 - Percentage and estimated Number of Foreign Leisure Tourists / Visitors visited from other Country in the month of April ‘10 County of Origin Estimated Domestic Leisure Visitors Percentage UK 1275 10.26% USA 1265 10.18% Canada 1172 9.43% Germany 1014 8.16% Europe 1282 10.31% Australia 1202 9.68% Sri Lanka 462 3.71% France 568 4.57% Japan 270 2.17% Malaysia 141 1.14% Singapore 324 2.61% Italy 159 1.28% Nepal 98 0.79% Netherlands 312 2.51% Korea 44 0.35% Israel 123 0.99% Pakistan 235 1.89% Bangladesh 353 2.84% UAE 1027 8.26% Spain 611 4.92% Switzerland 146 1.17% Saudi Arabia 40 0.32% Greece 11 0.09% Argentina 52 0.42% Belgium 51 0.41% Morocco 10 0.08% Cambodia 10 0.08% Maldives 6 0.05% Norway 42 0.34% Philippines 34 0.28% Denmark 3 0.02% Egypt 14 0.11% South Africa 16 0.13% Finland 53 0.43% Total 12426 100.00%

Ministry of Tourism AC Nielsen ORG-MARG Government of India
Final Report For Andhra Pradesh – Annexure 5: Supplementary Tables 88
Table A5:35 - Percentage and estimated Number of Foreign Leisure Tourists / Visitors visited from other Country in the month of May ‘10
County of Origin Estimated Domestic Leisure Visitors Percentage UK 1367 11.07% USA 1358 10.99% Canada 1065 8.62% Germany 1108 8.97% Europe 1174 9.50% Australia 1295 10.49% Sri Lanka 359 2.91% France 465 3.76% Japan 368 2.98% Malaysia 240 1.95% Singapore 222 1.80% Italy 58 0.47% Nepal 198 1.60% Netherlands 210 1.70% Korea 143 1.16% Israel 222 1.80% Pakistan 134 1.08% Bangladesh 451 3.65% UAE 921 7.45% Spain 508 4.11% Switzerland 245 1.98% Saudi Arabia 4 0.03% Greece 1 0.01% Argentina 42 0.34% Belgium 31 0.25% Morocco 1 0.01% Cambodia 0 0.00% Maldives 1 0.01% Norway 52 0.42% Philippines 24 0.20% Denmark 12 0.10% Egypt 4 0.03% South Africa 6 0.05% Finland 63 0.51% Total 12354 100.00%

Ministry of Tourism AC Nielsen ORG-MARG Government of India
Final Report For Andhra Pradesh – Annexure 5: Supplementary Tables 89
Table A5:36 - Percentage and estimated Number of Foreign Leisure Tourists / Visitors visited from other Country in the month of June ‘10
County of Origin Estimated Domestic Leisure Visitors Percentage UK 1417 11.91% USA 1208 10.15% Canada 1122 9.43% Germany 971 8.16% Europe 1228 10.31% Australia 1152 9.68% Sri Lanka 346 2.91% France 544 4.57% Japan 259 2.17% Malaysia 135 1.14% Singapore 310 2.61% Italy 152 1.28% Nepal 94 0.79% Netherlands 299 2.51% Korea 42 0.35% Israel 118 0.99% Pakistan 225 1.89% Bangladesh 338 2.84% UAE 983 8.26% Spain 585 4.92% Switzerland 140 1.17% Saudi Arabia 4 0.03% Greece 1 0.01% Argentina 41 0.34% Belgium 30 0.25% Morocco 1 0.01% Cambodia 0 0.00% Maldives 1 0.01% Norway 50 0.42% Philippines 23 0.20% Denmark 12 0.10% Egypt 4 0.03% South Africa 6 0.05% Finland 61 0.51% Total 11903 100.00%

Ministry of Tourism AC Nielsen ORG-MARG Government of India
Final Report For Andhra Pradesh – Annexure 5: Supplementary Tables 90
Table A5:37 - Percentage and estimated Number of Foreign Non-Leisure Tourists / Visitors visited from other Country in the month of July ‘09
County of Origin Estimated Domestic Non-Leisure Visitors Percentage UK 1051 9.79% USA 1015 9.45% Canada 865 8.05% Germany 898 8.36% Europe 1099 10.24% Australia 1004 9.35% Sri Lanka 503 4.68% France 531 4.94% Japan 262 2.43% Malaysia 126 1.17% Singapore 283 2.63% Italy 157 1.46% Nepal 99 0.92% Netherlands 122 1.13% Korea 54 0.49% Israel 145 1.35% Pakistan 277 2.58% Bangladesh 400 3.72% UAE 1282 11.94% Spain 208 1.93% Switzerland 44 0.41% Saudi Arabia 1 0.10% Argentina 61 0.57% Belgium 41 0.37% Norway 64 0.59% Philippines 35 0.32% Denmark 23 0.28% Egypt 2 0.01% South Africa 1 0.01% Finland 79 0.73% Total 10731 100.00%

Ministry of Tourism AC Nielsen ORG-MARG Government of India
Final Report For Andhra Pradesh – Annexure 5: Supplementary Tables 91
Table A5:38 - Percentage and estimated Number of Foreign Non-Leisure Tourists / Visitors visited from other Country in the month of August ‘09 County of Origin Estimated Domestic Non-Leisure Visitors Percentage UK 1157 10.75% USA 1118 10.38% Canada 768 7.13% Germany 801 7.44% Europe 1003 9.31% Australia 908 8.43% Sri Lanka 605 5.62% France 632 5.87% Japan 162 1.51% Malaysia 27 0.25% Singapore 384 3.57% Italy 258 2.39% Nepal 100 0.93% Netherlands 123 1.14% Korea 54 0.50% Israel 245 2.28% Pakistan 178 1.65% Bangladesh 401 3.73% UAE 1286 11.95% Spain 198 1.84% Switzerland 64 0.60% Saudi Arabia 11 0.10% Argentina 51 0.48% Belgium 31 0.29% Norway 51 0.47% Philippines 48 0.45% Denmark 13 0.12% Egypt 11 0.10% South Africa 2 0.02% Finland 76 0.70% Total 10766 100.00%

Ministry of Tourism AC Nielsen ORG-MARG Government of India
Final Report For Andhra Pradesh – Annexure 5: Supplementary Tables 92
Table A5:39 - Percentage and estimated Number of Foreign Non-Leisure Tourists / Visitors visited from other Country in the month of September ‘09
County of Origin Estimated Domestic Non-Leisure Visitors Percentage UK 1003 9.07% USA 1046 9.46% Canada 892 8.06% Germany 926 8.37% Europe 1203 10.87% Australia 1035 9.36% Sri Lanka 519 4.69% France 547 4.95% Japan 270 2.44% Malaysia 130 1.18% Singapore 292 2.64% Italy 162 1.47% Nepal 102 0.93% Netherlands 126 1.14% Korea 55 0.50% Israel 159 1.44% Pakistan 206 1.86% Bangladesh 412 3.73% UAE 1322 11.95% Spain 234 2.11% Switzerland 56 0.50% Saudi Arabia 11 0.10% Argentina 73 0.66% Belgium 42 0.38% Norway 76 0.68% Philippines 46 0.41% Denmark 24 0.22% Egypt 2 0.02% South Africa 1 0.01% Finland 91 0.82% Total 11064 100.00%

Ministry of Tourism AC Nielsen ORG-MARG Government of India
Final Report For Andhra Pradesh – Annexure 5: Supplementary Tables 93
Table A5:40 - Percentage and estimated Number of Foreign Non-Leisure Tourists / Visitors visited from other Country in the month of October ‘09 County of Origin Estimated Domestic Non-Leisure Visitors Percentage UK 1363 10.57% USA 1120 8.68% Canada 940 7.28% Germany 1080 8.37% Europe 1421 11.02% Australia 1107 8.58% Sri Lanka 705 5.46% France 538 4.17% Japan 214 1.66% Malaysia 252 1.95% Singapore 440 3.41% Italy 289 2.24% Nepal 219 1.70% Netherlands 247 1.91% Korea 94 0.73% Israel 104 0.81% Pakistan 233 1.81% Bangladesh 381 2.95% UAE 1441 11.17% Spain 229 1.78% Switzerland 63 0.49% Saudi Arabia 10 0.07% Argentina 80 0.62% Belgium 59 0.46% Norway 80 0.62% Philippines 50 0.39% Denmark 38 0.29% Egypt 8 0.06% South Africa 6 0.04% Finland 88 0.69% Total 12900 100.00%

Ministry of Tourism AC Nielsen ORG-MARG Government of India
Final Report For Andhra Pradesh – Annexure 5: Supplementary Tables 94
Table A5:41 - Percentage and estimated Number of Foreign Non-Leisure Tourists / Visitors visited from other Country in the month of November ‘09 County of Origin Estimated Domestic Non-Leisure Visitors Percentage UK 1552 10.47% USA 1502 10.13% Canada 1295 8.73% Germany 1341 9.04% Europe 1618 10.92% Australia 1488 10.03% Sri Lanka 595 4.02% France 633 4.27% Japan 261 1.76% Malaysia 275 1.85% Singapore 291 1.96% Italy 207 1.40% Nepal 107 0.72% Netherlands 109 0.73% Korea 64 0.43% Israel 110 0.74% Pakistan 333 2.24% Bangladesh 503 3.39% UAE 1872 12.62% Spain 237 1.60% Switzerland 41 0.28% Saudi Arabia 4 0.03% Argentina 65 0.44% Belgium 46 0.31% Norway 68 0.46% Philippines 38 0.26% Denmark 42 0.28% Egypt 12 0.08% South Africa 11 0.07% Finland 106 0.72% Total 14827 100.00%
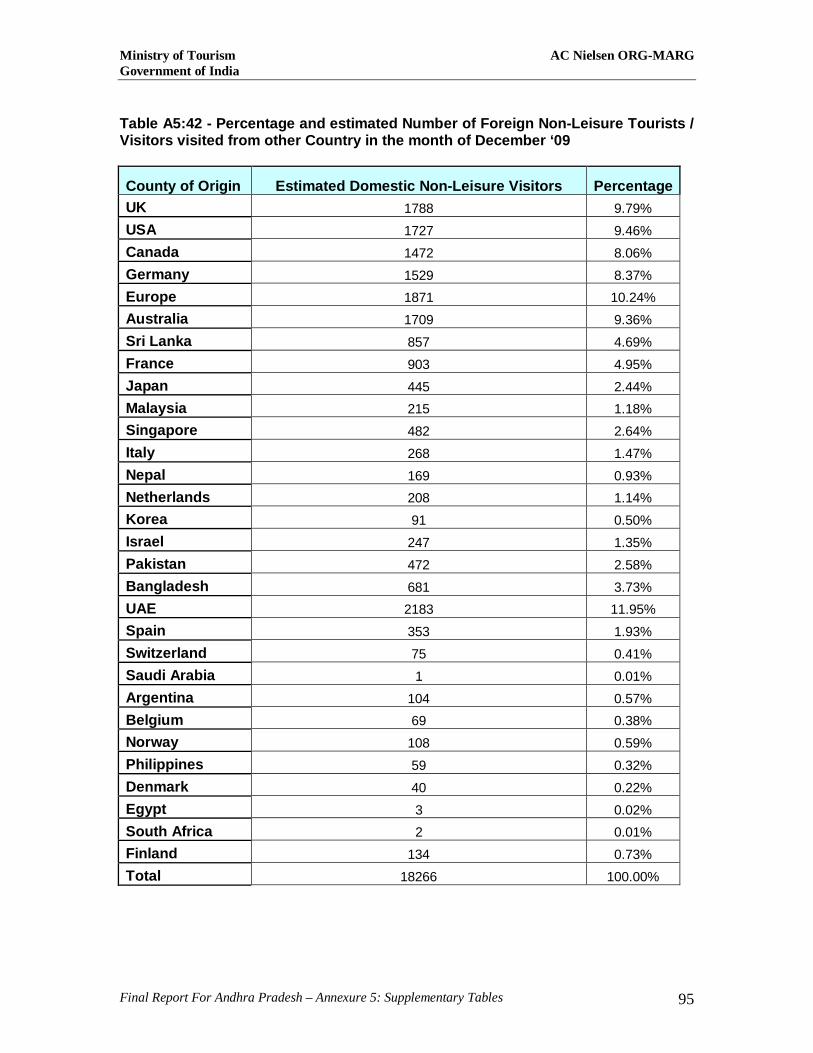
Ministry of Tourism AC Nielsen ORG-MARG Government of India
Final Report For Andhra Pradesh – Annexure 5: Supplementary Tables 95
Table A5:42 - Percentage and estimated Number of Foreign Non-Leisure Tourists / Visitors visited from other Country in the month of December ‘09
County of Origin Estimated Domestic Non-Leisure Visitors Percentage UK 1788 9.79% USA 1727 9.46% Canada 1472 8.06% Germany 1529 8.37% Europe 1871 10.24% Australia 1709 9.36% Sri Lanka 857 4.69% France 903 4.95% Japan 445 2.44% Malaysia 215 1.18% Singapore 482 2.64% Italy 268 1.47% Nepal 169 0.93% Netherlands 208 1.14% Korea 91 0.50% Israel 247 1.35% Pakistan 472 2.58% Bangladesh 681 3.73% UAE 2183 11.95% Spain 353 1.93% Switzerland 75 0.41% Saudi Arabia 1 0.01% Argentina 104 0.57% Belgium 69 0.38% Norway 108 0.59% Philippines 59 0.32% Denmark 40 0.22% Egypt 3 0.02% South Africa 2 0.01% Finland 134 0.73% Total 18266 100.00%

Ministry of Tourism AC Nielsen ORG-MARG Government of India
Final Report For Andhra Pradesh – Annexure 5: Supplementary Tables 96
Table A5:43 - Percentage and estimated Number of Foreign Non-Leisure Tourists / Visitors visited from other Country in the month of January ‘10 County of Origin Estimated Domestic Non-Leisure Visitors Percentage UK 2313 10.21% USA 2042 9.01% Canada 1726 7.62% Germany 1796 7.93% Europe 2220 9.80% Australia 2020 8.92% Sri Lanka 962 4.25% France 1220 5.39% Japan 652 2.88% Malaysia 367 1.62% Singapore 698 3.08% Italy 432 1.91% Nepal 260 1.15% Netherlands 308 1.36% Korea 123 0.54% Israel 296 1.31% Pakistan 535 2.36% Bangladesh 814 3.59% UAE 2607 11.51% Spain 458 2.02% Switzerland 134 0.59% Saudi Arabia 19 0.08% Argentina 131 0.58% Belgium 96 0.42% Norway 124 0.55% Philippines 83 0.37% Denmark 59 0.26% Egypt 1 0.00% South Africa 1 0.00% Finland 156 0.69% Total 22655 100.00%

Ministry of Tourism AC Nielsen ORG-MARG Government of India
Final Report For Andhra Pradesh – Annexure 5: Supplementary Tables 97
Table A5:44 - Percentage and estimated Number of Foreign Non-Leisure Tourists / Visitors visited from other Country in the month of February ‘10
County of Origin Estimated Domestic Non-Leisure Visitors Percentage UK 2112 10.28% USA 1843 8.97% Canada 1556 7.57% Germany 1619 7.88% Europe 2004 9.75% Australia 1823 8.87% Sri Lanka 864 4.20% France 1116 5.43% Japan 501 2.44% Malaysia 252 1.23% Singapore 572 2.78% Italy 351 1.71% Nepal 200 0.97% Netherlands 284 1.38% Korea 113 0.55% Israel 287 1.40% Pakistan 520 2.53% Bangladesh 776 3.78% UAE 2505 12.19% Spain 407 1.98% Switzerland 105 0.51% Saudi Arabia 10 0.05% Argentina 127 0.62% Belgium 88 0.43% Norway 222 1.08% Philippines 77 0.37% Denmark 35 0.17% Egypt 7 0.04% South Africa 10 0.05% Finland 160 0.78% Total 20546 100.00%

Ministry of Tourism AC Nielsen ORG-MARG Government of India
Final Report For Andhra Pradesh – Annexure 5: Supplementary Tables 98
Table A5:45 - Percentage and estimated Number of Foreign Non-Leisure Tourists / Visitors visited from other Country in the month of March ‘10
County of Origin Estimated Domestic Non-Leisure Visitors Percentage UK 1436 12.38% USA 1208 10.40% Canada 1035 8.92% Germany 971 8.37% Europe 1089 9.38% Australia 1086 9.36% Sri Lanka 524 4.52% France 554 4.77% Japan 233 2.01% Malaysia 127 1.09% Singapore 306 2.64% Italy 120 1.04% Nepal 107 0.93% Netherlands 102 0.88% Korea 48 0.41% Israel 137 1.18% Pakistan 300 2.58% Bangladesh 433 3.73% UAE 1267 10.91% Spain 204 1.76% Switzerland 47 0.40% Saudi Arabia 4 0.03% Argentina 56 0.48% Belgium 34 0.29% Norway 59 0.51% Philippines 28 0.24% Denmark 15 0.13% Egypt 1 0.01% South Africa 0 0.00% Finland 75 0.65% Total 11607 100.00%

Ministry of Tourism AC Nielsen ORG-MARG Government of India
Final Report For Andhra Pradesh – Annexure 5: Supplementary Tables 99
Table A5:46 - Percentage and estimated Number of Foreign Non-Leisure Tourists / Visitors visited from other Country in the month of April ‘10
County of Origin Estimated Domestic Non-Leisure Visitors Percentage UK 1006 12.22% USA 1159 14.07% Canada 864 10.49% Germany 659 8.00% Europe 843 10.24% Australia 671 8.14% Sri Lanka 306 3.72% France 417 5.07% Japan 201 2.44% Malaysia 107 1.30% Singapore 207 2.52% Italy 101 1.22% Nepal 66 0.80% Netherlands 84 1.02% Korea 31 0.38% Israel 101 1.23% Pakistan 203 2.46% Bangladesh 207 2.51% UAE 784 9.52% Spain 59 0.72% Switzerland 24 0.29% Saudi Arabia 0 0.01% Argentina 37 0.45% Belgium 11 0.14% Norway 29 0.35% Philippines 7 0.08% Denmark 8 0.10% Egypt 1 0.02% South Africa 1 0.01% Finland 40 0.49% Total 8234 100.00%
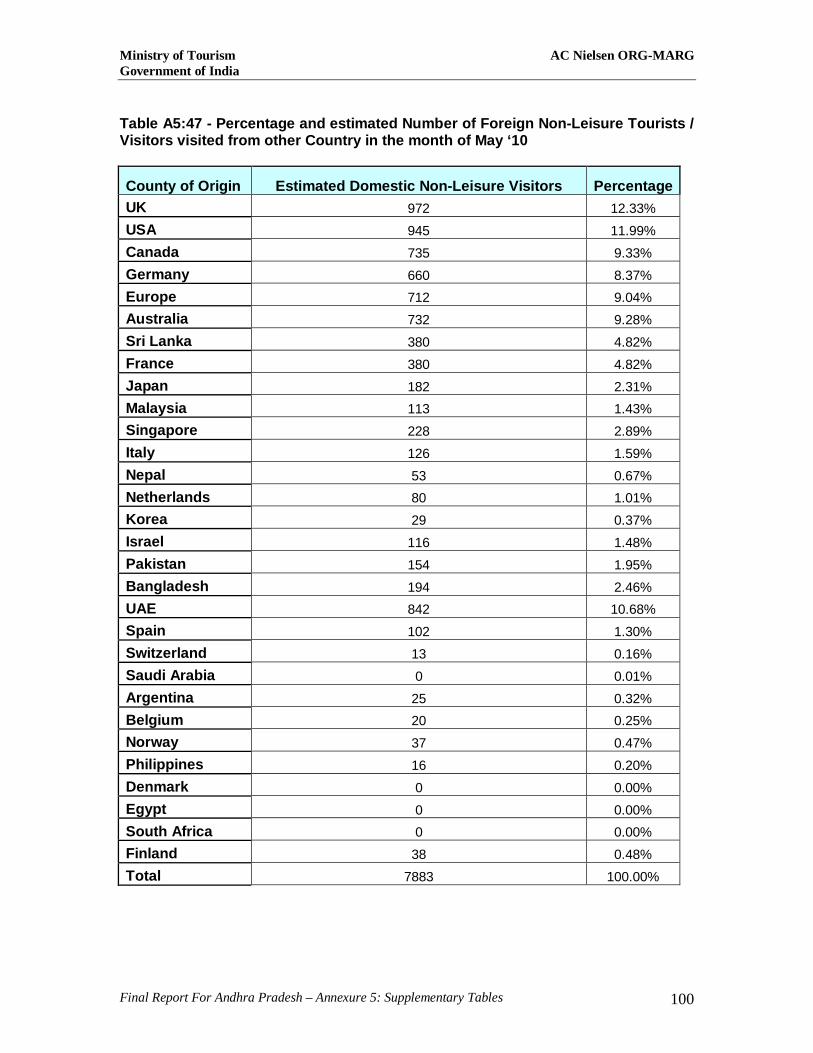
Ministry of Tourism AC Nielsen ORG-MARG Government of India
Final Report For Andhra Pradesh – Annexure 5: Supplementary Tables 100
Table A5:47 - Percentage and estimated Number of Foreign Non-Leisure Tourists / Visitors visited from other Country in the month of May ‘10
County of Origin Estimated Domestic Non-Leisure Visitors Percentage UK 972 12.33% USA 945 11.99% Canada 735 9.33% Germany 660 8.37% Europe 712 9.04% Australia 732 9.28% Sri Lanka 380 4.82% France 380 4.82% Japan 182 2.31% Malaysia 113 1.43% Singapore 228 2.89% Italy 126 1.59% Nepal 53 0.67% Netherlands 80 1.01% Korea 29 0.37% Israel 116 1.48% Pakistan 154 1.95% Bangladesh 194 2.46% UAE 842 10.68% Spain 102 1.30% Switzerland 13 0.16% Saudi Arabia 0 0.01% Argentina 25 0.32% Belgium 20 0.25% Norway 37 0.47% Philippines 16 0.20% Denmark 0 0.00% Egypt 0 0.00% South Africa 0 0.00% Finland 38 0.48% Total 7883 100.00%

Ministry of Tourism AC Nielsen ORG-MARG Government of India
Final Report For Andhra Pradesh – Annexure 5: Supplementary Tables 101
Table A5:48 - Percentage and estimated Number of Foreign Non-Leisure Tourists / Visitors visited from other Country in the month of June ‘10 County of Origin Estimated Domestic Non-Leisure Visitors Percentage UK 827 11.14% USA 802 10.80% Canada 698 9.41% Germany 611 8.23% Europe 670 9.03% Australia 695 9.36% Sri Lanka 368 4.96% France 377 5.08% Japan 191 2.57% Malaysia 97 1.31% Singapore 196 2.64% Italy 129 1.74% Nepal 69 0.93% Netherlands 95 1.27% Korea 37 0.50% Israel 110 1.49% Pakistan 182 2.45% Bangladesh 177 2.38% UAE 787 10.60% Spain 134 1.80% Switzerland 21 0.28% Saudi Arabia 10 0.14% Argentina 32 0.44% Belgium 28 0.38% Norway 24 0.32% Philippines 24 0.32% Denmark 6 0.08% Egypt 1 0.02% South Africa 1 0.01% Finland 24 0.33% Total 7424 100.00%