TOURISM: SUPERCHARGING AUSTRALIA’S … Supercharging Australia’s Future also looks at the...
31
TOURISM: SUPERCHARGING AUSTRALIA’S FUTURE In partnership with
-
Upload
duongquynh -
Category
Documents
-
view
220 -
download
1
Transcript of TOURISM: SUPERCHARGING AUSTRALIA’S … Supercharging Australia’s Future also looks at the...

TOURISM: SUPERCHARGING AUSTRALIA’S FUTURE
In partnership with

TTF – TOURISM: SUPERCHARGING AUSTRALIA’S FUTURE 2
ABOUT TTF
The Tourism & Transport Forum (TTF) is the peak industry group for the Australian tourism, transport, aviation and investment sectors. A national, member-funded CEO forum, TTF advocates the public policy interests of the leading corporations and institutions in these sectors.
TTF uses its experience and networks to influence public policy outcomes and business practices and to assist the delivery of major tourism, aviation and transport-related infrastructure projects.
With the slowing of the resources sector and the decline of many traditional manufacturing industries, the visitor economy has become the new hero industry for economic growth.
A key driver for our future prosperity is international tourism, powered largely by the Asia Pacific region, which now accounts for seven of our 10 top source markets.
ABOUT STAFFORD STRATEGY
Stafford Strategy (A Stafford & Associates Pty Limited) was established in 1991. It has offices in Sydney, Melbourne and Brisbane, Australia and a shared office facility in Wellington, New Zealand.
Stafford Strategy is committed to:• performing work of the highest quality;• being aware of the commercial,• environmental and social needs of its clients; and• ensuring that its work is robust, realistic and
adds value.
Stafford Strategy focuses on and specialises in economic development and tourism planning. It has expertise garnered by working for corporate and government clients over three decades.
It has experience in:• strategic advice and facilitation;• market demand studies;• data analyses and forecasting;• economic development feasibilities; • global benchmarking and modelling;• master planning; and • regional development strategies.
For further information, please contact:
Tourism & Transport Forum (TTF) Level 6, 7 Macquarie Place Sydney NSW 2000 T: +61 2 9240 2000 www.ttf.org.au For further information, please contact:
Stafford Strategy 3.02 46a Macleay Street Potts Point NSW 2011 T: +61 2 9331 6222 www.staffordstrategy.com.au
Cover images: Indigenous experiences, Western Australia – James Fisher/Tourism Australia | Ningaloo Reef, Exmouth, WA – Tourism Australia | Centre Place, Melbourne Laneways, VIC – Visit Victoria | Melbourne Museum, Melbourne, VIC – Visit Victoria | MONA FOMA, Hobart, TAS – MONA | Historic Gaol, Port Arthur, TAS – Port Arthur Historic Site Management Authority (PAHSMA) | Hot Air Ballooning, Barossa Valley, SA – South Australian Tourism Commission | Ashes at Adelaide Oval, Adelaide, SA – Adelaide Oval SMA | Challenger Bay Drift at Ribbon Reefs, Great Barrier Reef, QLD – Tourism Whitsundays | Q1 SkyPoint Climb, Gold Coast, QLD – Tourism Australia | Uluru Camel Tours – Tourism Australia | Mt Borradaile, Arnhemland, NT – Tourism Australia | Sculpture by the Sea, Bondi, NSW – Tourism Australia | Sydney – Tourism Australia | Australian War Memorial, Canberra – Tourism Australia | Floriade, Canberra, ACT – Floriade Australia

TTF – TOURISM: SUPERCHARGING AUSTRALIA’S FUTURE 1
CONTENTS
1. EXECUTIVE SUMMARY 2
1.1. INTRODUCTION 2
1.2. WHY TOURISM IS IMPORTANT 3
1.3. WHERE TOURISTS ARE GOING 6
1.4. HOW MUCH TOURISTS ARE BUYING 7
1.5. INVESTING IN TOURISM 8
1.6. SETTING AMBITIOUS TARGETS 9
2. WHY TOURISM IS IMPORTANT 10
2.1. OVERVIEW 10
2.2. TOURISM CREATES JOBS 10
2.3. TOURISM GROWS THE ECONOMY 14
2.4. TOURISM PAYS TAXES 16
3. WHERE TOURISTS ARE GOING 18
3.1. VISITATION 18
4. HOW MUCH TOURISTS ARE BUYING 20
4.1. OVERVIEW 20
4.2. ANALYSIS 22
5. INVESTING IN TOURISM 23
5.1. OVERVIEW 23
5.2. FORECASTS & TARGETS 25
6. SETTING AMBITIOUS TARGETS 26
6.1. VISITATION 26
6.2. VISITOR CONSUMPTION 27
7. APPENDIX 28
TTF – TOURISM: SUPERCHARGING AUSTRALIA’S FUTURE 2
1. EXECUTIVE SUMMARY
1.1. INTRODUCTION
The purpose of this paper is to highlight the overall impact the tourism industry has on our economy and how by increasing investment into tourism over the next 10 years, Australia will have a sustainable, high job-creating industry, not an industry that is subject to cyclical booms.
To analyse the impact, we have considered the current state of play, recent trends and forecasts as well as relationships with the Australian economy for the following key variables:
• Visitation;
• Tourism consumption;
• Tourism investment;
• Gross Domestic Product (GDP)/Gross State Product (GSP);
• Employment; and
• Taxes.
For each variable, we undertook an analysis of the current state of play, including for each individual state and territory, as well as an overview of recent trends, forecasts and any key linkages and relationships with the Australian economy.
Tourism is the future of the Australian economy, particularly in this post-resources boom period. Governments and commercial operators need to invest in tourism marketing, services and infrastructure to realise the potential jobs that could be created. This Report analyses the employment potential of the sector and has found that tourism is going to overtake other high profile industries, such as agriculture, to be one of the country’s biggest employers by 2022.
Tourism: Supercharging Australia’s Future also looks at the tourism industry in terms of the number of visitors, how much they are buying, which states are investing in tourism infrastructure and the impact that tourism has on our economy. It also compares the different states and territories to show how each jurisdiction is performing as well as identifying ambitious (yet achievable) future targets for the next ten years.
Some key take-outs from this Report include:
• Tourism visits are expected to grow 31% between 2016 and 2026 to 385 million visits.
• We should be setting more competitive goals in tourism - applying a stretch target of 1% will see visits increase by an additional 11%, or 41 million visitors, by 2026.
• For every $1 million in tourism consumption, seven jobs are created and over $750,000 is contributed in GDP.
• Tourism has the biggest impact in Tasmania, where 10 jobs are created for every $1 million in tourism spend.
• In 2015-16, net tax generated by the tourism industry totalled over $11 billion.

TTF – TOURISM: SUPERCHARGING AUSTRALIA’S FUTURE 3
EXECUTIVE SUMMARY (CONTINUED)
1.2. WHY TOURISM IS IMPORTANT
1.2.1. Tourism employment
Tourism is a critical economic driver for every state and territory. As other industry sectors start to wane, the value and importance of tourism continues to grow. One of the most significant and direct benefits from tourism is the number of jobs created.
As detailed in Table 1, total tourism-related employment – including direct and indirect employment – was 934,000 in 2015-16, comprising 62% in direct employment and 38% in indirect employment.1
• The largest states in terms of tourism-related employment is NSW (28%), followed by Queensland (24%) and Victoria (22%).2
• Within the tourism sector, the three largest industries that directly employ are the food and beverage industry (28%), followed by retail trade (18%) and accommodation (14%).3
• Tourism employment has grown over the past five years by over 10% (3% per annum), mostly by growth in indirect employment.4
• In addition to the analysis above, tourism employment is related to consumption and visitation as follows:
» A single job is created for every $140,000 in tourism consumption; and
» On average, there are around 315 visits for every job in tourism.
1.2.2. Comparisons with other industries
As outlined in Table 1, tourism-related employment (direct employment only), as a percentage of total employment (4.8%), is a larger employer than the agriculture (2.8%), mining (1.9%) and financial services (3.6%) industries. While it is less than the overall manufacturing industry (7.4%), in certain jurisdictions – such as NT and ACT – the tourism industry is greater.
TABLE 1: PERCENTAGE OF TOTAL EMPLOYMENT – COMPARISONS WITH OTHER INDUSTRIES (2015-16)5
Industry NSW VIC QLD SA WA TAS NT ACT Average
Tourism (direct) 4.3% 4.4% 5.8% 4.5% 5.3% 7.2% 6.7% 4.5% 4.8%
Agriculture, Forestry & Fishing 2.2% 3.3% 2.8% 4.6% 2.3% 5.6% 0.9% 0.6% 2.8%
Mining 0.8% 0.3% 2.2% 1.0% 8.2% 1.1% 5.2% 0.0% 1.9%
Manufacturing 6.9% 9.1% 6.9% 9.0% 6.5% 8.4% 2.9% 2.0% 7.4%
Financial and Insurance Services 5.1% 3.7% 2.5% 2.7% 2.1% 2.1% 1.0% 2.6% 3.6%
1. ‘Direct’ employment refers to employment directly related to tourism products or services (e.g. hotels, transport, etc); while ‘indirect’ employment is generated from increased activity in businesses that supply goods and services to the tourism sector (e.g. supply of beds to accommodation facilities); Tourism Research Australia, State Tourism Satellite Accounts, 2015-16 2. Ibid 3. Ibid 4. Ibid 5. Australian Bureau of Statistics, Industry Employment Figures, 2017

TTF – TOURISM: SUPERCHARGING AUSTRALIA’S FUTURE 4
However, when forecasting employment growth over the next five years to 2022, tourism-related direct employment is expected to be larger than these comparator industries. As outlined in Table 2, direct tourism employment is forecast to grow to 8% of total employment, which will make the tourism industry the largest employer compared to agriculture (2.3%), mining (1.8%), manufacturing (6.7%) and financial services (3.5%). This is the result of comparator industries expecting smaller increases in employment, or, in some cases, an overall decline.
TABLE 2: PERCENTAGE OF TOTAL EMPLOYMENT (FORECASTED) – COMPARISONS WITH OTHER INDUSTRIES (2022)6
Industry % of total employment
Tourism (direct) 7.7%
Agriculture, Forestry & Fishing 2.3%
Mining 1.8%
Manufacturing 6.7%
Financial and Insurance Services 3.5%
1.2.3. Who benefits from tourism
Every state and territory benefits from tourism by virtue of the employment generated, tourism expenditure (direct and indirect), tax and GDP contributions.
For every 1,000 visits, the tourism industry could be expected, on average, to generate:
• 3.2 tourism related jobs;
• Over $440,000 in tourism consumption;
• Around $38,000 in tax contributions; and
• $338,000 in GDP contributions.
TABLE 3: IMPACT OF 1,000 VISITS
NSW VIC QLD SA WA TAS NT ACT Average
Consumption $421,500 $397,000 $469,800 $399,800 $499,500 $429,900 $975,200 $542,400 $440,900
Taxes $37,300 $34,500 $39,700 $31,300 $39,800 $36,700 $66,700 $68,700 $37,800
GDP/GSP $336,100 $296,600 $368,800 $297,100 $362,000 $306,500 $708,500 $388,700 $337,600
Jobs created 2.9 2.9 3.5 3.0 3.5 4.4 5.3 3.4 3.2
1.2.4. Contribution to GDP/GSP
• In 2015-16, tourism generated GDP totalled almost $100 billion – comprising 53% ‘direct’ contribution to GDP and 47% ‘indirect’ contribution.7
• NSW was again the dominant state (30% of total GDP), followed by Queensland (24%) and Victoria (22%).8
• Over the past five years, total GDP has increased by around 23% (or 6% per annum), with relatively even growth in both direct GDP (25%) and indirect GDP (21%).9
EXECUTIVE SUMMARY (CONTINUED)
6. Department of Employment, Labour Market Industry Projections, 2017 7. ‘Direct’ contribution refers to GDP/GSP generated by industries that deal directly with tourists, including accommodation, transport, leisure industries, etc.; ‘Indirect’ contribution refers to the induced impacts, including any additional spending made by business within the tourism industry as an indirect consequence of tourism (e.g. marketing, increased capital investment, or purchasing supplies); Tourism Research Australia, State Tourism Satellite Accounts, 2015-16 8. Ibid 9. Ibid
TTF – TOURISM: SUPERCHARGING AUSTRALIA’S FUTURE 5
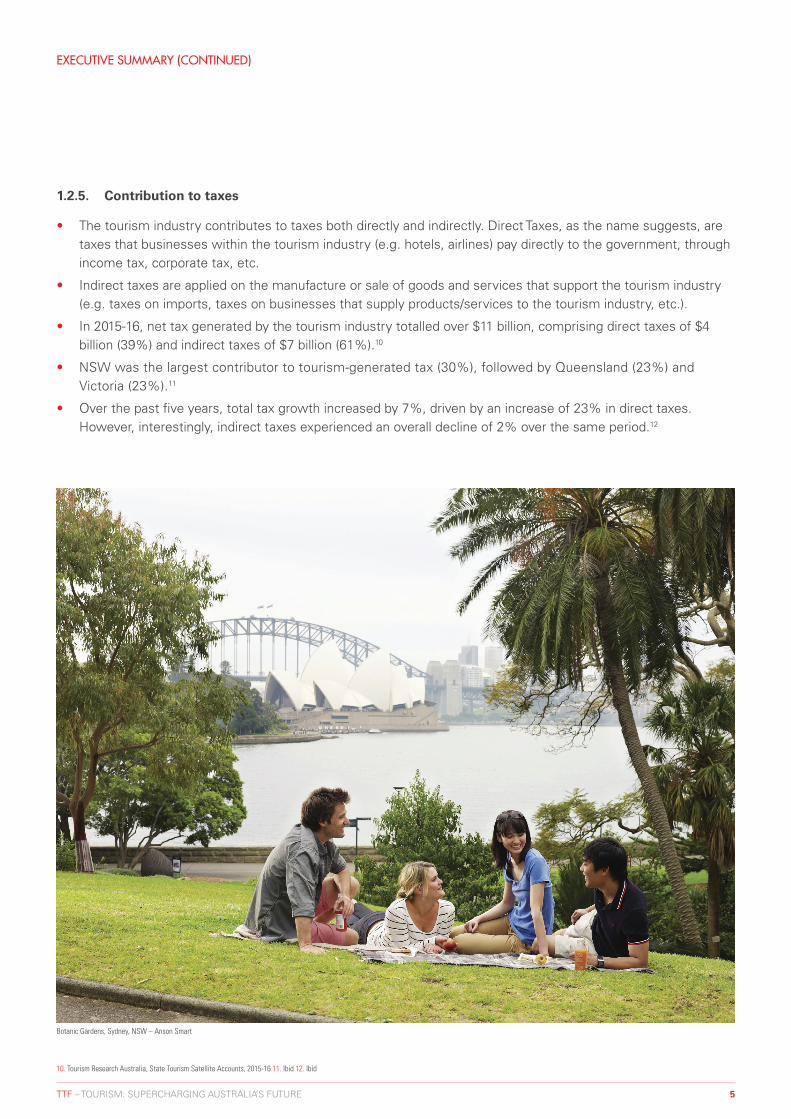
1.2.5. Contribution to taxes
• The tourism industry contributes to taxes both directly and indirectly. Direct Taxes, as the name suggests, are taxes that businesses within the tourism industry (e.g. hotels, airlines) pay directly to the government, through income tax, corporate tax, etc.
• Indirect taxes are applied on the manufacture or sale of goods and services that support the tourism industry (e.g. taxes on imports, taxes on businesses that supply products/services to the tourism industry, etc.).
• In 2015-16, net tax generated by the tourism industry totalled over $11 billion, comprising direct taxes of $4 billion (39%) and indirect taxes of $7 billion (61%).10
• NSW was the largest contributor to tourism-generated tax (30%), followed by Queensland (23%) and Victoria (23%).11
• Over the past five years, total tax growth increased by 7%, driven by an increase of 23% in direct taxes. However, interestingly, indirect taxes experienced an overall decline of 2% over the same period.12
EXECUTIVE SUMMARY (CONTINUED)
10. Tourism Research Australia, State Tourism Satellite Accounts, 2015-16 11. Ibid 12. Ibid
Botanic Gardens, Sydney, NSW – Anson Smart

TTF – TOURISM: SUPERCHARGING AUSTRALIA’S FUTURE 6
EXECUTIVE SUMMARY (CONTINUED)
1.3. WHERE TOURISTS ARE GOING
1.3.1. Visitation
Our analysis for visitation shows the following key findings:
• There were 295 million visits in 2016 that were made up of domestic daytrips (64%), domestic overnight visits (32%) and international visits (4%).13
• The most popular states in terms of total visits are NSW (31%), followed by Victoria (25%) and Queensland (22%).14
• Over the past five years, visitation to Australia has grown by around 14%, driven by increases in international (33%) and domestic overnight visits (22%); while the strongest growth was experienced by WA (45%) and NT (41%).15
• Based on published forecasted growth, total visitation to Australia is forecast to increase by 31% between 2016 to 2026, to 385 million visits. However, these forecasts (3.1% per annum) are more conservative than current trend data from the past five years (3.4% per annum).16
• Applying a stretch target at a rate of 1% over and above the published forecasted growth, sees visitation increase by an additional 11% or 41 million by 2026.
1.3.2. Destination Comparisons
Table 4 shows how Australia fares with some comparative countries – including the OECD average – in terms of direct tourism employment as a percentage of total employment; and direct tourism GDP as a percentage of total GDP. From this analysis, the key findings are:
• The OECD average is marginally greater than Australia’s tourism industry, in terms of employment and contribution to GDP. This means there is an opportunity to increase the impact of tourism in the Australian economy.
• In terms of contribution to GDP, Australia (3.2%) is stronger than the other comparator countries of Canada (1.9%) and the USA (2.7%).
• In terms of contribution to total employment, Australia’s tourism employment industry (4.8%) is stronger than all comparator countries, except for the UK.
• Overall, the Australian tourism industry is strong and stable, and compares favourably against comparator countries, however there is room to improve and increase the impact of tourism.
TABLE 4: INTERNATIONAL COMPARISONS17
Country % of total GDP % of total employment
Australia (2015-16) 3.2% 4.8%
Canada (2014) 1.9% 3.5%
USA (2016) 2.7% 3.6%
UK (2014) 3.7% 9.5%
NZ (2014) 4.0% 4.7%
OECD average (2014) 4.1% 5.9%
13. Tourism Research Australia, International Visitor Survey, 2017; Tourism Research Australia, National Visitor Survey, 2016) 14. Ibid 15. Ibid 16. Tourism Research Australia, Tourism Forecasts, 2017 17. OECD, Tourism Trends and Policies, 2016; http://stats.oecd.org/Index.aspx?ThemeTreeId=10&DatasetCode=tourism_rec_exp; UK Tourism Statistics 2016, World Travel and Tourism Council, Economic Impact 2017: United States, 2017

TTF – TOURISM: SUPERCHARGING AUSTRALIA’S FUTURE 7
1.4. HOW MUCH TOURISTS ARE BUYING
1.4.1. Tourism consumption
• Of the $130 billion in total tourism consumption in 2015-16, the majority is driven by domestic overnight visits (57%), followed by international visits (26%) and domestic day-trippers (16%). Overnight visits are higher yielding, generating greater levels of spend through accommodation, food, etc.18
• Total consumption is predominantly generated by NSW (29%), Queensland (23%) and Victoria (22%).
• Tourism consumption has been relatively strong over the past five years, growing by around 20%, or 5% per year,19 driven by overnight domestic and international visitation.
• Forecasting tourism consumption over the next 10 years, by applying the annual average growth rate from the previous five years, would see spend increase by around 57% (or $74 billion) to $204 billion.
• By applying stretch targets, with additional growth of 1% over and above the forecasts, the growth potential is an extra $20 billion (or 10%) by 2026.
FIGURE 1: CONSUMPTION FORECAST VS STRETCH TARGETS20
100
125
150
175
200
225
250
2025-262024-252023-242022-232021-222020-212019-202018-192017-182016-172015-16
$ (b
illio
n)
Stretch targetsTrend data
1.4.1.1. Impact of tourism consumption
For every $1 million in tourism consumption, the impact on the tourism economy includes:
• 7.2 additional employees;
• $86,000 in tax contribution; and
• Over $765,000 contribution to total GDP.
TABLE 5: IMPACT OF $1 MILLION IN TOURISM CONSUMPTION
NSW VIC QLD SA WA TAS NT ACT Average
Employees 6.9 7.2 7.5 7.5 7.1 10.2 5.4 6.3 7.2
Taxes $88,500 $87,000 $84,600 $78,300 $79,800 $85,300 $68,400 $126,700 $85,800
GDP/GSP $797,300 $747,100 $785,000 $743,300 $724,700 $712,900 $726,500 $716,500 $765,600
18. Tourism Research Australia, State Tourism Satellite Accounts, 2015-16 19. Ibid 20. Tourism Research Australia, Tourism Forecasts, 2017
EXECUTIVE SUMMARY (CONTINUED)

TTF – TOURISM: SUPERCHARGING AUSTRALIA’S FUTURE 8
EXECUTIVE SUMMARY (CONTINUED)
The following tables demonstrate how forecasted growth in tourism consumption, as well as the potential growth in achieving the stretch targets by 2025-26 (see Figure 1), could impact the contribution to taxes, tourism-related employment and GDP.
TABLE 6: IMPACT OF CONSUMPTION FORECASTS ON TOTAL TAX CONTRIBUTION
NSW VIC QLD SA WA TAS NT ACT Total
Current (2015-16) $3.4b $2.5b $2.5b $0.6b $1.2b $0.3b $0.2b $0.3b $11.1b
Forecast (2025-26) $5.1b $4.1b $3.3b $1.0b $2.8b $0.5b $0.4b $0.6b $17.8b
Target (2025-26) $5.7b $4.5b $3.6b $1.1b $3.0b $0.6b $0.5b $0.6b $19.6b
TABLE 7: IMPACT OF CONSUMPTION FORECASTS ON EMPLOYMENT
NSW VIC QLD SA WA TAS NT ACT Total
Current (2015-16) 261k 208k 225k 60k 109k 37k 17k 16k 934k
Forecast (2025-26) 398k 339k 289k 101k 245k 61k 34k 28k 1,464k
Target (2025-26) 438k 373k 318k 111k 267k 67k 38k 31k 1,611k
TABLE 8: IMPACT OF CONSUMPTION FORECASTS ON TOTAL GSP/GDP CONTRIBUTION
NSW VIC QLD SA WA TAS NT ACT Total
Current (2015-16) $30.4b $21.7b $23.6b $5.9b $11.2b $2.6b $2.3b $1.8b $99.5b
Forecast (2025-26) $46.4b $35.3b $30.3b $9.9b $25.1b $4.3b $4.6b $3.2b $159.0b
Target (2025-26) $50.9b $38.8b $33.3b $10.9b $27.4b $4.7b $5.0b $3.5b $174.5b
1.5. INVESTING IN TOURISM
• In 2015, the value of the tourism investment pipeline totalled $32 billion,21 driven by the accommodation sector (24% of total investment), the aviation sector (30%) and the arts & recreation sector (46%).22
• NSW is the most dominant jurisdiction in terms of investment, with 30% of the total, followed by investment into WA (22%), Queensland (19%) and Victoria (18%).23
• From 2012 to 2015, total investment increased by around 36% (around 12% per annum), driven by increases in the accommodation sector (36%), the aviation sector (30%) and the arts & recreation sector (52%). However, the NT experienced a decline in tourism-related investment over time (by 86%).24
21. Excludes investment that is unallocated (i.e. is not directed to a specific jurisdiction); Inclusive of projects that: have been committed to; are recently completed; are under construction; or are currently under consideration 22. Tourism Research Australia, Tourism Investment Monitor, 2016 23. Ibid 24. Ibid

TTF – TOURISM: SUPERCHARGING AUSTRALIA’S FUTURE 9
EXECUTIVE SUMMARY (CONTINUED)
1.6. SETTING AMBITIOUS TARGETS
1.6.1. Visitation
If governments and businesses invested in tourism, we could set more ambitious targets. Even a 1% increase, or ‘stretch target’, would have a massive impact on the economy, as shown in Figures 2 and 3.
FIGURE 2: 10-YEAR VISITATION FORECAST BY STATE/TERRITORY25
250
275
300
325
350
375
400
425
450
20262025202420232022202120202019201820172016
Stretch targets Current forecastsTrend data
Visi
tors
(mill
ion)
1.6.2. Consumption
FIGURE 3: 10-YEAR CONSUMPTION FORECAST BY STATE/TERRITORY26
100
125
150
175
200
225
250
2025-262024-252023-242022-232021-222020-212019-202018-192017-182016-172015-16
$ (b
illio
n)
Stretch targetsTrend data
25. Tourism Research Australia, Tourism Forecasts, 2017; Tourism Research Australia, Regional Forecast, 2016 26. Tourism Research Australia, State Tourism Satellite Accounts, 2015-16

TTF – TOURISM: SUPERCHARGING AUSTRALIA’S FUTURE 10
2. WHY TOURISM IS IMPORTANT
2.1. OVERVIEW
Tourism is one of the biggest employing industries in Australia. This, in turn, grows the economy, and pays its fair share in taxes. When governments and businesses invest in tourism infrastructure, hotel accommodation, aviation and arts and recreation, there is an increase in tourists and tourism consumption which inturn generates greater employment.
2.2. TOURISM CREATES JOBS
2.2.1. Overview
Tourism and tourism consumption positively benefits the economy through tourism-related employment, both direct and indirect. Direct employment refers to employment directly related to tourism products or services (e.g. hotels, transport, etc.); while indirect employment is generated from increased activity in businesses that supply goods and services to the tourism sector (e.g. supply of beds to accommodation facilities).
In 2015-16 a total of 934,000 jobs were generated in the tourism industry, comprising:
• 580,000 direct jobs (62% of total employment); and
• 354,000 indirect jobs (38%).
Across all jurisdictions, the number of direct jobs generated by tourism was greater than the level of indirect employment. Most employment was generated in NSW (28%), followed by Queensland (24%) and Victoria (22%).
FIGURE 4: TOTAL TOURISM-RELATED EMPLOYMENT BY STATE/TERRITORY (2015-16)27
0 25 50 75 100 125 150 175 200 225 250 275
Total
Direct
Indirect
NSW
QLD
VIC
WA
SA
TAS
NT
ACT
Jobs (000’s)
27. Tourism Research Australia, State Tourism Satellite Accounts, 2015-16

TTF – TOURISM: SUPERCHARGING AUSTRALIA’S FUTURE 11
FIGURE 5: PROPORTION OF TOTAL TOURISM-RELATED EMPLOYMENT BY STATE/TERRITORY (2015-16)28
ACT – 2%
NT – 2%
TAS – 4%
SA – 6%
WA – 12%
VIC – 22%
QLD – 24%
NSW – 28%
In terms of the most affected industries, by levels of direct employment, the largest industries include:
• The food and beverage industry (e.g. cafes, restaurants, etc.) (28%);
• Retail trade (18%); and
• Accommodation (14%)
Figure 6 also illustrates that, for each jurisdiction across Australia, the dominant employment industries are food and beverage, retail and accommodation.
FIGURE 6: EMPLOYMENT BY INDUSTRY (2015-16)29
0% 10% 20% 30% 40% 50% 60% 70% 80% 90% 100%
Rail transport
Clubs, pubs, taverns and bars
Cafes, restaurants and takeaway food services
Accommodation
Cultural services
Travel agency and tour operator services
Air, water and other transport
Road transport and transport equipment rental
Education and training Other
Retail trade
Other sports and recreation services
Casinos and other gambling services
ACT
NT
TAS
WA
SA
QLD
VIC
NSW
WHY TOURISM IS IMPORTANT (CONTINUED)
28. Ibid 29. Ibid

TTF – TOURISM: SUPERCHARGING AUSTRALIA’S FUTURE 12
In terms of growth in direct and indirect employment over the past five years, Australia has experienced employment growth of over 10% (around 3% per annum), driven by:
• Increases in direct employment by 6%; and
• Increases in indirect employment by 20%.
The indirect employment sector, comprising businesses that support the tourism industry, has been outperforming the direct employment sector.
In terms of employment growth by jurisdiction, the largest increases in tourism-related employment were experienced by WA (27%) and NT (19%); while there were smaller increases for Tasmania (which experienced a decline in direct employment growth) and Queensland (4.5% total growth).
FIGURE 7: EMPLOYMENT GROWTH, PAST FIVE YEARS30
-10%
-5%
0%
5%
10%
15%
20%
25%
30%
35%
40%
TotalACTNTTASWASAQLDVICNSW
Direct Indirect Total
+9.6%+10.7%
+4.5%
+12.4%
+27.1%
+8.5%
+18.9%
+10.9%
+10.8%
2.2.2. Comparisons with other industries
Tourism is a major contributor to employment across Australia. According to Table 9, tourism-related employment (direct employment only), as a percentage of total employment (4.8%), is a larger employer than the agriculture (2.8%), mining (1.9%) and financial services (3.6%) industries. While it is slightly less than the overall manufacturing industry (7.4%), in certain jurisdictions – such as NT and ACT – the tourism industry is greater.
TABLE 9: PERCENTAGE OF TOTAL EMPLOYMENT – COMPARISONS WITH OTHER INDUSTRIES (2015-16)31
Industry NSW VIC QLD SA WA TAS NT ACT Average
Tourism (direct) 4.3% 4.4% 5.8% 4.5% 5.3% 7.2% 6.7% 4.5% 4.8%
Agriculture, Forestry & Fishing 2.2% 3.3% 2.8% 4.6% 2.3% 5.6% 0.9% 0.6% 2.8%
Mining 0.8% 0.3% 2.2% 1.0% 8.2% 1.1% 5.2% 0.0% 1.9%
Manufacturing 6.9% 9.1% 6.9% 9.0% 6.5% 8.4% 2.9% 2.0% 7.4%
Financial and Insurance Services 5.1% 3.7% 2.5% 2.7% 2.1% 2.1% 1.0% 2.6% 3.6%
WHY TOURISM IS IMPORTANT (CONTINUED)
30. Ibid 31. Australian Bureau of Statistics, Industry Employment Figures, 2017

TTF – TOURISM: SUPERCHARGING AUSTRALIA’S FUTURE 13
However, when forecasting employment growth across these industries over the next five years, to 2022, tourism-related employment is expected to be larger than the comparator industries. As outlined in Table 10, direct tourism employment is forecast to grow to 8% of total employment, which will make the tourism industry the largest employer compared to agriculture (2.3%), mining (1.8%), manufacturing (6.7%) and financial services (3.5%). This is the result of comparator industries expecting a small increase in employment, or, in some cases, an overall decline.
TABLE 10: PERCENTAGE OF TOTAL EMPLOYMENT (FORECASTED) – COMPARISONS WITH OTHER INDUSTRIES (2022)32
Industry % of total employment
Tourism (direct) 7.7%
Agriculture, Forestry & Fishing 2.3%
Mining 1.8%
Manufacturing 6.7%
Financial and Insurance Services 3.5%
2.2.3. Contribution to employment
Tables 11 to 13 show the link between tourism consumption and tourism-related employment.
In terms of consumption, on average, a single tourism-related job is generated for every $139,000 that is spent by tourists. Tasmania appears to have the strongest linkage, with a single job generated from around $97,000 in spend; while NSW is less ‘efficient’, generating a job for every $146,000 in tourism consumption.
TABLE 11: CONSUMPTION LEVELS PER JOB (2015-16)
NSW VIC QLD SA WA TAS NT ACT Average
Consumption levels per job $145,935 $139,186 $133,282 $132,807 $141,608 $97,720 $183,953 $158,668 $139,026
Alternatively, Table 12 shows that, for every $1 million in tourism consumption, around 7.2 jobs are generated. Overall, consumption has the greatest effect on jobs in Tasmania (with 10.2 jobs generated per $1 million), while NT (5.4 jobs per $1 million) has the lowest link between tourism consumption and jobs.
TABLE 12: EMPLOYMENT GENERATED PER $1M IN TOURISM CONSUMPTION (2015-16)
NSW VIC QLD SA WA TAS NT ACT Average
Jobs per $1m in consumption 6.85 7.18 7.50 7.53 7.06 10.23 5.44 6.30 7.19
In addition, the table below shows that, on average, a single tourism-related job is generated for every 315 visits. This link is strongest in NT (one job per 189 visits), and weakest in Victoria (one job per 351 visits).
TABLE 13: VISITS PER JOB (2015-16)
NSW VIC QLD SA WA TAS NT ACT Average
Visits per job 346.2 350.6 283.7 332.2 283.5 227.3 188.6 292.5 315.3
WHY TOURISM IS IMPORTANT (CONTINUED)
32. Department of Employment, Labour Market Industry Projections, 2017

TTF – TOURISM: SUPERCHARGING AUSTRALIA’S FUTURE 14
2.3. TOURISM GROWS THE ECONOMY
2.3.1. Overview
This section analyses the impact of tourism (and tourism consumption) on national Gross Domestic Product (GDP), typified by each individual jurisdiction’s Gross State Product (GSP). The level of tourism generated GDP in 2015-16 totalled almost $100 billion – comprising 53% ‘direct’ contribution to GDP and 47% ‘indirect’ contribution.33
In addition, Figure 8 illustrates that the proportion of tourism-related GDP in each jurisdiction is again in line with visitation proportions (see Figure 15), with NSW being the dominant state (30% of total GDP), followed by Queensland (24%) and Victoria (22%). For each jurisdiction, however, the spread of indirect versus direct contributions are relatively even.
FIGURE 8: TOTAL GSP BY STATE/TERRITORY (2015-16)34
0 5 10 15 20 25 30 35
Tourism GDP
Direct
Indirect
NSW
QLD
VIC
WA
SA
TAS
NT
ACT
$ (billion)
FIGURE 9: PROPORTION OF GSP BY STATE/TERRITORY (2015-16)
ACT – 2%
NT – 2%
TAS – 3%
SA – 6%
WA – 11%
VIC – 22%
QLD – 24%
NSW – 30%
WHY TOURISM IS IMPORTANT (CONTINUED)
33. ‘Direct’ contribution refers to GDP/GSP generated by industries that deal directly with tourists, including accommodation, transport, leisure industries, etc.; ‘Indirect’ contribution refers to the induced impacts, including any additional spending made by business within the tourism industry as an indirect consequence of tourism (e.g. marketing, increased capital investment, or purchasing supplies). 34. Tourism Research Australia, State Tourism Satellite Accounts, 2015-16

TTF – TOURISM: SUPERCHARGING AUSTRALIA’S FUTURE 15
WHY TOURISM IS IMPORTANT (CONTINUED)
Figure 10 shows that, over the past five years, total GDP has increased by around 23% (or 6% per annum), with relatively even growth in both direct GDP (25%) and indirect GDP (21%). However, the largest growth in state/territory GSP was experienced by WA (41%) and NT (36%), with the larger states of NSW, Victoria and Queensland experiencing slower growth over the same period.
FIGURE 10: GSP GROWTH, PAST FIVE YEARS
0%
5%
10%
15%
20%
25%
30%
35%
40%
45%
TotalACTNTTASWASAQLDVICNSW
Direct Indirect Total
+21.9%+23.9%
+14.6%
+28.0%
+40.9%
+27.3%
+36.4%
+21.4% +23.1%
2.3.2. Contribution to GDP/GSP
Table 14 demonstrates the impact that tourism consumption has on the level of tourism GSP for each state/territory, as well as the total tourism GDP for Australia. For every tourist dollar spent in Australia, an average of $0.77 tourism GDP is generated nationally. While this is not a ‘one-for-one’ ratio, it still signifies a reasonably strong linkage between tourism consumption and its impact on tourism GDP.
Tourism has the biggest impact in NSW with $0.80 of GSP generated for every tourist dollar; while Tasmania ($0.71) has the lowest linkage.
TABLE 14: GDP/GSP GENERATED PER TOURIST DOLLAR (2015-16)
NSW VIC QLD SA WA TAS NT ACT Average
GDP per dollar spent $0.80 $0.75 $0.79 $0.74 $0.72 $0.71 $0.73 $0.72 $0.77

TTF – TOURISM: SUPERCHARGING AUSTRALIA’S FUTURE 16
2.4. TOURISM PAYS TAXES
2.4.1. Overview
This section details the level of direct and indirect taxes generated by the tourism industry. Direct taxes, as the name suggests, are taxes that businesses within the tourism industry (e.g. hotels, airlines) pay directly to the government, through income tax, corporate tax, etc. Indirect taxes are applied on the manufacture or sale of goods and services that support the tourism industry (e.g. taxes on imports, taxes on businesses that supply products and services to the tourism industry, etc.). The contribution of the tourism industry to taxes totalled over $11b, comprising:
• Direct taxes of $4 billion (39%); and
• Indirect taxes of $7 billion (61%).
FIGURE 11: TOTAL NET TAXES BY STATE/TERRITORY (2015-16)35
0.0 0.5 1.0 1.5 2.0 2.5 3.0 3.5
Total
Direct
Indirect
NSW
QLD
VIC
WA
SA
TAS
ACT
NT
$ (billion)
The chart above, as well as Figure 12, indicates that the largest states contribute the greatest level of tourism-related taxes, with NSW being the largest contributor (30%), followed by Queensland (23%) and Victoria (23%).
FIGURE 12: PROPORTION OF TOTAL TAXES BY STATE/TERRITORY (2015-16)36
NT – 2%
ACT – 3%
TAS – 3%
SA – 5%
WA – 11%
VIC – 23%
QLD – 23%
NSW – 30%
WHY TOURISM IS IMPORTANT (CONTINUED)
35. Tourism Research Australia, State Tourism Satellite Accounts, 2015-16 36. Ibid

TTF – TOURISM: SUPERCHARGING AUSTRALIA’S FUTURE 17
WHY TOURISM IS IMPORTANT (CONTINUED)
In terms of growth in taxes, over the past five years, total tax growth increased by 7%, driven by an increase of 23% in direct taxes. However, indirect taxes experienced an overall decline of 2% over the same period. This is reflected in the growth in tax contributions by each jurisdiction. While all states/territories experienced growth in direct taxes received, four states – NSW, Victoria, Queensland and South Australia experienced a decline in indirect taxes. This could perhaps be the result of a general decline in businesses supporting the tourism industry, including manufacturers and various service providers.
As a result, the largest growth in taxes was experienced by NT (40%) and WA (27%), while there was marginal growth in NSW (3%), Victoria (2%) and Queensland (2%).
FIGURE 13: TAXES GROWTH OVER PAST 5 YEARS37
-10%
-5%
0%
5%
10%
15%
20%
25%
30%
35%
40%
45%
TotalACTNTTASWASAQLDVICNSW
Direct Indirect Total
+3.3%+2.0%
+2.1%
+8.5%
+26.5%
+14.9%
+40.0%
+22.3%
+6.5%
2.4.2. Contribution to taxes
Table 15 and Table 16 demonstrate the impact that visitation and tourism consumption have on the total tax contribution.
Every visit to Australia generates, on average, $338 in taxes. Most states appear to be broadly in line with this average, except for NT, which appears to generate over double the average tax contribution ($709 per visit); while Victoria and South Australia generate the lowest level of tax contribution per visit.
TABLE 15: TAX GENERATED PER VISIT (2015-16)
NSW VIC QLD SA WA TAS NT ACT Average
Tax per visit $336.1 $296.6 $368.8 $297.1 $362.0 $306.5 $708.5 $388.7 $337.6
In addition, for every $1 million in tourism consumption, on average, around $86,000 in tax is generated across Australia. The largest amount of tax generated per $1 million in tourism consumption is in the ACT (with $127,000), while all other jurisdictions are broadly in line with the average.
TABLE 16: TAX GENERATED PER $1 MILLION IN TOURISM CONSUMPTION (2015-16)
NSW VIC QLD SA WA TAS NT ACT Average
Tax per dollar spent $88,500 $87,000 $84,600 $78,300 $79,800 $85,300 $68,400 $126,700 $85,800
37. Ibid

TTF – TOURISM: SUPERCHARGING AUSTRALIA’S FUTURE 18
3. WHERE TOURISTS ARE GOING
3.1. VISITATION
The growth in visitation levels in Australia is great news for the economy. This section details historic, current and forecast visitation levels both nation-wide and according to each state and territory.
Figure 14 and Figure 15 show the total visitation to each state and territory, as well as the proportions, for each visitor type – domestic day, domestic overnight and international overnight.
In 2016, Australia received approximately 295 million visits, comprising:
• 190 million domestic daytrips (64%);
• 94 million domestic overnight visits (32%); and
• 11 million international overnight visits (4%).38
NSW (with 90 million visits received or 31%) was the dominant state in terms of total visitation, followed by Victoria (73 million or 25%) and Queensland (64 million or 22%).
FIGURE 14: TOTAL VISITATION (2016)39
-10%
-5%
0%
5%
10%
15%
20%
25%
30%
35%
40%
45%
TotalACTNTTASWASAQLDVICNSW
Direct Indirect Total
+3.3%+2.0%
+2.1%
+8.5%
+26.5%
+14.9%
+40.0%
+22.3%
+6.5%
FIGURE 15: PROPORTION OF TOTAL VISITATION BY STATE/TERRITORY (2016)40
ACT – 1%
NT – 1%
TAS – 3%
SA – 7%
WA – 10%
QLD – 22%
VIC – 25%
NSW – 31%
38. Visitation refers to total number of trips, not unique visitors 39. Tourism Research Australia, International Visitor Survey, 2017; Tourism Research Australia, National Visitor Survey, 2016) 40. Ibid

TTF – TOURISM: SUPERCHARGING AUSTRALIA’S FUTURE 19
WHERE TOURISTS ARE GOING (CONTINUED)
There has been substantial growth in visitation levels over the past five years. From 2012 to 2016, total visitation across Australia increased by 14% (or just over 3% per annum), which was driven by:
• Increases in international visitation of 33%;
• Increases in domestic overnight visitation of 22%; and
• Increases in domestic day trips of 9%.
The largest increases in total visitation were in WA (45%), NT (41%) and ACT (28%) – although the two territories started from a lower base. However, the larger tourism states – NSW (10%), Victoria (12%) and Queensland (7%) – still experienced solid growth in absolute terms.
FIGURE 16: VISITATION GROWTH OVER PAST FIVE YEARS41
TotalACTNTTASWASAQLDVICNSW
Domestic daytrip
Domestic overnight
Domestic overnight
Total
0%
5%
10%
15%
20%
25%
30%
35%
40%
45%
50%
55%
60%
65%
+9.6%+12.1%
+7.2%
+13.8%
+44.5%
+20.0%
+40.8%
+28.0%
+13.7%
41. Ibid
Looking towards The Henry Jones Art Hotel, Hobart, TAS – Tourism Tasmania & Rob Burnett

TTF – TOURISM: SUPERCHARGING AUSTRALIA’S FUTURE 20
4. HOW MUCH TOURISTS ARE BUYING
4.1. OVERVIEW
Figure 17 illustrates the total level of tourism consumption (i.e. visitor spend) for 2015-16, including the level of spend in each state/territory. Total consumption across Australia totalled upwards of $130 billion for 2015-16, which was predominantly generated by domestic overnight visits (57%), followed by international overnight (26%) and domestic day trips (16%). This spread of contribution is to be expected, with overnight visitation being more ‘high-yielding’ compared to day trips.
In addition, Figure 17 and Figure 18 show that consumption is broadly in line with visitation (see Figure 15), with NSW being the dominant state (29% of consumption), followed by Queensland (23%) and Victoria (22%). The key difference being that although Victoria receives more visits than Queensland, it generates less visitor spend.
FIGURE 17: TOTAL TOURISM CONSUMPTION (2015-16)42
0 5 10 15 20 25 30 35 40
NSW
QLD
VIC
WA
SA
TAS
NT
ACT
$ (billion)
Total
Domestic daytrip
Domestic overnightInternational overnight
42. Ibid
Bathing Boxes, Mornington Beach, VIC – Mornington Peninsula Regional Tourism

TTF – TOURISM: SUPERCHARGING AUSTRALIA’S FUTURE 21
FIGURE 18: PROPORTION OF TOTAL TOURISM CONSUMPTION BY STATE/TERRITORY (2015-16)43
ACT – 2%
NT – 3%
TAS – 3%
SA – 6%
WA – 12%
VIC – 22%
QLD – 23%
NSW – 29%
There has been significant growth in tourism consumption over the past five years, coinciding with increased visitation. From 2012 to 2016, tourism consumption across Australia increased by 20% (around 5% per annum), which is greater than the annual increase in visitation. These increases were driven by the following:
• Increases in domestic day spend by 13%;
• Increases in domestic overnight spend by 18%; and
• Increases in international visitor spend by 30%;
The fastest growing segment in terms of spend is the international visitor market, which typically spends more on accommodation, retail, food and beverage, has a longer average length of stay and participates in more experiences and activities.
In terms of growth by jurisdiction, consumption by state and territory is broadly in line with visitor growth. The largest increases were experienced by WA (38%) and NT (31%), while the states with the highest levels of tourism consumption – NSW (18%), Victoria (21%) and Queensland (10%) – experienced a slower rate of growth.
FIGURE 19: TOTAL CONSUMPTION GROWTH, PAST FIVE YEARS44
TotalACTNTTASWASAQLDVICNSW0%
5%
10%
15%
20%
25%
30%
35%
40%
45%
50%
55%
60%Domestic daytrip
Domestic overnight
Domestic overnight
Total
+18.4%
+21.4%
+10.2%
+22.2%
+37.7%
+21.6%
+30.8%
+22.2% +19.7%
WHAT TOURISTS ARE BUYING (CONTINUED)
43. Ibid 44. Ibid

TTF – TOURISM: SUPERCHARGING AUSTRALIA’S FUTURE 22
4.2. ANALYSIS
Figure 20 illustrates the linkage between visitation and consumption, shown through the average spend per trip. A single trip by a visitor within Australia generates, on average, $441 in visitor spend. This is broken down by visitor type as follows:
• Average daytrip consumption of $112 per trip;
• Average domestic overnight consumption of $789 per trip; and
• Average international visitor consumption of $3,200 per trip.
As expected, international visitors generate the highest rate of spend, as they typically spend more on airfares and travel for longer periods, resulting in greater levels of consumption on accommodation, food and beverage, tourist activities, etc.
FIGURE 20: CONSUMPTION PER TRIP45
$0
$500
$1000
$1500
$2000
$2500
$3000
$3500
$4000
TotalACTNTTASWASAQLDVICNSW
Total Domestic daytrip Domestic overnight International overnight
$421.5$397.0 $469.8
$399.8
$499.5
$429.9
$975.2
$542.4
$440.9
WHAT TOURISTS ARE BUYING (CONTINUED)
43. Ibid 45. Ibid
Making Tracks – Tourism Australia

TTF – TOURISM: SUPERCHARGING AUSTRALIA’S FUTURE 23
5. INVESTING IN TOURISM
5.1. OVERVIEW
This section details the level of investment in Australia’s tourism sector, segmented by the following sectors:
• Commercial accommodation;
• Arts & recreation; and
• Aviation.
Figure 21 shows the value of large-scale projects in Australia’s tourism investment pipeline in 2015, inclusive of projects that: have been committed to; are recently completed; are under construction; or are currently under consideration. The value of the tourism investment pipeline totalled $32 billion, driven by:
• Investment of $8 billion in the accommodation sector (24%);
• Investment of $9 billion in the aviation sector (30%); and
• Investment of $15 billion in the arts & recreation sector (46%).
FIGURE 21: TOTAL TOURISM INVESTMENT (2015)46
0 1 2 3 4 5 6 7 8 9 10
NSW
WA
QLD
VIC
SA
ACT
TAS
NT
$ (billion)
Total
Arts & recreation
AviationAccommodation
NSW is the most dominant jurisdiction in terms of its proportion of the tourism investment pipeline, with 30% of the total (around $9 billion). This is followed by investment into WA (22%), Queensland (19%) and Victoria (18%). In these states, the total investment was primarily driven by funding in the arts & recreation industry.
46. Tourism Research Australia, Tourism Investment Monitor, 2016; Note: the data excludes the value of unallocated investment (e.g. has not been directed to a specific jurisdiction).

TTF – TOURISM: SUPERCHARGING AUSTRALIA’S FUTURE 24
FIGURE 22: PROPORTION OF TOTAL INVESTMENT BY STATE/TERRITORY (2015)47
NT – 0.5%
TAS – 1.6%
ACT – 2.5%
SA – 7.2%
VIC – 17.6%
QLD – 19%
WA – 22.1%
NSW – 29.5%
Finally, Figure 23 shows the trends in total tourism investment over the past four years (from 2012 to 2015). Over this period, total investment increased by around 36% (around 12% per annum), driven by increases in:
• The accommodation sector by 36%;
• The aviation sector by 30%; and
• The arts & recreation sector by 52%.
While all sectors experienced overall growth, investment in the arts & recreation sector has increased by a far higher rate.
However, the graph also demonstrates the differences in investment for each jurisdiction, summarised by the following:
• The Northern Territory experienced a decrease in overall investment by 86% over the past four years, due to no apparent significant investment in the aviation or art & cultural sectors over the past few years.
• Tasmania experienced substantial growth of over 300%, driven by investment in the accommodation and arts and recreation sectors.
• Only Victoria experienced significant growth in the aviation sector (over 200%).
• Only Victoria (-66%) and South Australia (-34%) experienced a decline in investment in the accommodation sector.
INVESTING IN TOURISM (CONTINUED)
47. Ibid
Angove Family Winemakers, McLaren Vale, SA – South Australian Tourism Commission

TTF – TOURISM: SUPERCHARGING AUSTRALIA’S FUTURE 25
FIGURE 23: INVESTMENT GROWTH BY STATE/TERRITORY, PAST FOUR YEARS48
-150%-100%-50%
0%50%
100%150%200%250%300%350%400%450%500%550%600%650%
TotalACTNTTASWASAQLDVICNSW
Arts & recreationAviationAccommodation
Total
+112.4%
+69.1%
+4.9%
+14.6%
+58.4%
+324.1%
+35.7% +35.6%
–86.4%
5.2. FORECASTS & TARGETS
No published data on tourism investment forecasts is available to offer trend analysis. However, what is evident in many parts of Australia is the lack of reinvestment especially in new commercial accommodation and the upgrading of existing commercial accommodation facilities, particularly in regional areas.
Furthermore, there is a lack of investment into new major visitor built attractions and experiences, and in some locations, a lack of investment into supporting infrastructure to encourage greater visitation to outdoor areas and natural attractions, which presents an opportunity for governments to explore opening up our national parks to tourists through conservation and eco-friendly accommodation and activities.
INVESTING IN TOURISM (CONTINUED)
48. Ibid
Tangalooma Island Resort, Moreton Island – Tourism Australia

TTF – TOURISM: SUPERCHARGING AUSTRALIA’S FUTURE 26
6. SETTING AMBITIOUS TARGETS
6.1. VISITATION
6.1.1. Forecasts & Targets
This section compares and contrasts 10-year forecasts in visitation levels – based on published forecast data – and ‘stretch targets’ that demonstrate what could be achieved if a target is set over and above the forecasted levels.
Table 17 details the updated forecasted growth in visitation, based on published industry data, from 2016 to 2026. Over the next 10 years, total visitation is expected to grow to 386 million across Australia, representing an increase of 91 million (31% total or 3.1% per annum). The forecast is driven by:
• Increases in international visitation by 54%;
• Increases in domestic overnight visitation by 24%; and
• Increases in domestic day trips by 33%.49
As set out in the table below, the forecasted growth is relatively evenly spread across each state/territory.
TABLE 17: 10-YEAR VISITATION FORECAST BY STATE/TERRITORY50
NSW VIC QLD SA WA TAS NT ACT Average
2016 90.4m 73.0m 63.9m 19.9m 30.8m 8.5m 3.3m 4.7m 294.6m
2026 118.4m 95.6m 83.7m 26.2m 40.4m 11.1m 4.3m 5.9m 385.5m
% Increase 30.9% 30.8% 30.9% 31.2% 31.2% 30.8% 30.6% 26.3% 30.8%
Figure 24 compares the published forecasts of 31% (or 3.1% per annum) against the following:
• Forecasts based on a current 5-year trend (3.4% per annum); and
• Stretch targets of 45% growth over ten years (4.5% per annum).51
From this analysis, published forecasts are shown to be more conservative than historic trends by some 27 million visits (or 7%); while the stretch targets are 41 million (or 11%) greater than the forecasts. However, these targets are only a total of 15 million visits (or 4%) greater than current trends – over 10 years – which means they are attainable.
FIGURE 24: 10-YEAR VISITATION FORECAST BY STATE/TERRITORY52
250
275
300
325
350
375
400
425
450
20262025202420232022202120202019201820172016
Stretch targets Current forecastsTrend data
Visi
tors
(mill
ion)
49. Note: domestic daytrips are forecasted to grow by an average annual rate of 2.9% over the next ten years; domestic visitor nights are forecast to grow by an annual average of 2.2% over the next 10 years, which was then divided by average length of stay (ALOS) to calculate the increase in visits; international visitor nights are forecast to grow by an annual average of 2.2% over the next 10 years, which was also divided by average length of stay (ALOS) to calculate the increase in visits. 50. Tourism Research Australia, Tourism Forecasts, 2017; Tourism Research Australia, Regional Forecast, 2016 51. Note: Stretch targets were calculated by increasing growth over and above published forecasted data by 1% per annum. 52. Ibid
TTF – TOURISM: SUPERCHARGING AUSTRALIA’S FUTURE 27
The remaining sections analyse the financial and economic impact of visitation on Australia, with respect to current trends and future forecasts. It also dissects the relationship between visitation and a variety of metrics relevant to the economy as well as the tourism industry, including spend, employment and gross domestic product (GDP).
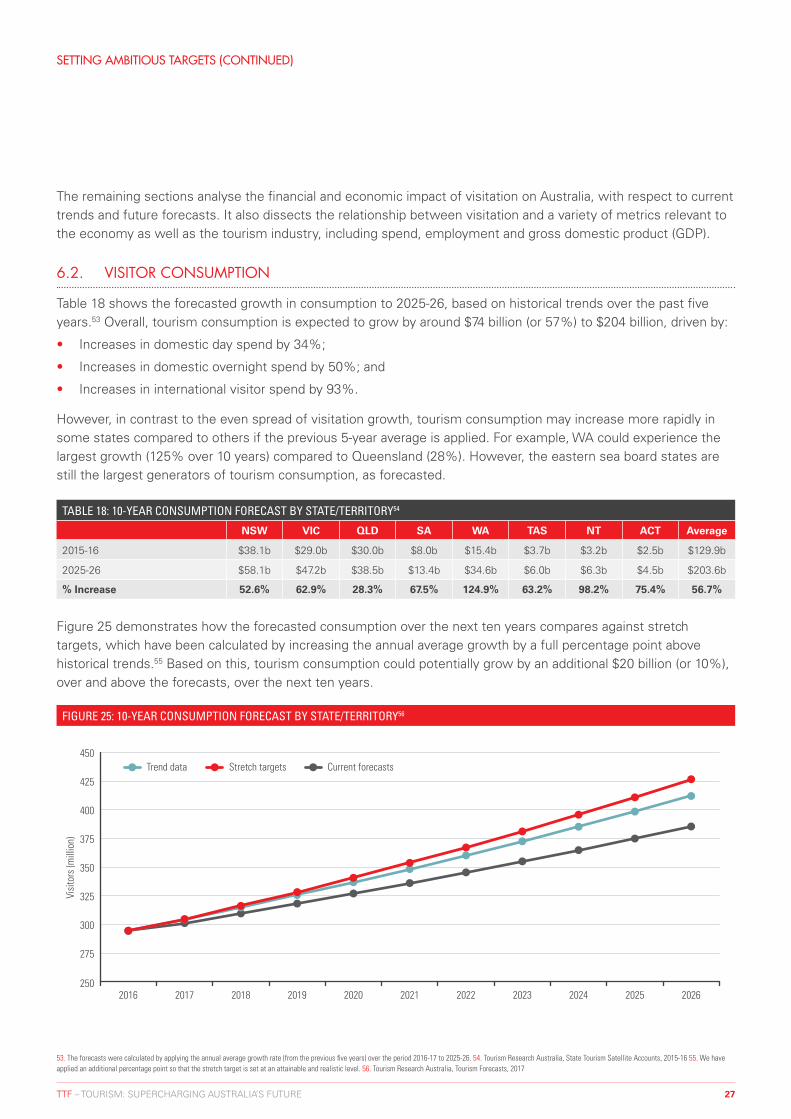
6.2. VISITOR CONSUMPTION
Table 18 shows the forecasted growth in consumption to 2025-26, based on historical trends over the past five years.53 Overall, tourism consumption is expected to grow by around $74 billion (or 57%) to $204 billion, driven by:
• Increases in domestic day spend by 34%;
• Increases in domestic overnight spend by 50%; and
• Increases in international visitor spend by 93%.
However, in contrast to the even spread of visitation growth, tourism consumption may increase more rapidly in some states compared to others if the previous 5-year average is applied. For example, WA could experience the largest growth (125% over 10 years) compared to Queensland (28%). However, the eastern sea board states are still the largest generators of tourism consumption, as forecasted.
TABLE 18: 10-YEAR CONSUMPTION FORECAST BY STATE/TERRITORY54
NSW VIC QLD SA WA TAS NT ACT Average
2015-16 $38.1b $29.0b $30.0b $8.0b $15.4b $3.7b $3.2b $2.5b $129.9b
2025-26 $58.1b $47.2b $38.5b $13.4b $34.6b $6.0b $6.3b $4.5b $203.6b
% Increase 52.6% 62.9% 28.3% 67.5% 124.9% 63.2% 98.2% 75.4% 56.7%
Figure 25 demonstrates how the forecasted consumption over the next ten years compares against stretch targets, which have been calculated by increasing the annual average growth by a full percentage point above historical trends.55 Based on this, tourism consumption could potentially grow by an additional $20 billion (or 10%), over and above the forecasts, over the next ten years.
FIGURE 25: 10-YEAR CONSUMPTION FORECAST BY STATE/TERRITORY56
250
275
300
325
350
375
400
425
450
20262025202420232022202120202019201820172016
Stretch targets Current forecastsTrend data
Visi
tors
(mill
ion)
SETTING AMBITIOUS TARGETS (CONTINUED)
53. The forecasts were calculated by applying the annual average growth rate (from the previous five years) over the period 2016-17 to 2025-26. 54. Tourism Research Australia, State Tourism Satellite Accounts, 2015-16 55. We have applied an additional percentage point so that the stretch target is set at an attainable and realistic level. 56. Tourism Research Australia, Tourism Forecasts, 2017

TTF – TOURISM: SUPERCHARGING AUSTRALIA’S FUTURE 28
7. APPENDIX
FIGURES Page
Figure 1: Consumption forecast vs stretch targets 7
Figure 2: 10-year visitation forecast by state/territory 9
Figure 3: 10-year consumption forecast by state/territory 9
Figure 4: Total tourism-related employment by state/territory (2015-16) 10
Figure 5: Proportion of total tourism-related employment by state/territory (2015-16) 11
Figure 6: Employment by industry (2015-16) 11
Figure 7: Employment growth, past five years 12
Figure 8: Total GSP by state/territory (2015-16) 14
Figure 9: Proportion of GSP by state/territory (2015-16) 14
Figure 10: GSP growth, past five years 15
Figure 11: Total net taxes by state/territory (2015-16) 16
Figure 12: Proportion of total taxes by state/territory (2015-16) 16
Figure 13: Taxes growth over past 5 years 17
Figure 14: Total visitation (2016) 18
Figure 15: Proportion of total visitation by State/Territory (2016) 18
Figure 16: Visitation growth over past five years 19
Figure 17: Total tourism consumption (2015-16) 20
Figure 18: Proportion of total tourism consumption by state/territory (2015-16) 21
Figure 19: Total consumption growth, past five years 21
Figure 20: Consumption per trip 22
Figure 21: Total tourism investment (2015) 23
Figure 22: Proportion of total investment by state/territory (2015) 24
Figure 23: Investment growth by state/territory, past four years 25
Figure 24: 10-year visitation forecast by state/territory 26
Figure 25: 10-year consumption forecast by state/territory 27
TABLES Page
Table 1: Percentage of total employment – comparisons with other industries (2015-16) 3
Table 2: Percentage of total employment (forecasted) – comparisons with other industries (2022) 4
Table 3: Impact of 1,000 visits 4
Table 4: International comparisons 6
Table 5: Impact of $1 million in tourism consumption 7
Table 6: Impact of consumption forecasts on total tax contribution 8
Table 7: Impact of consumption forecasts on employment 8
Table 8: Impact of consumption forecasts on total GSP/GDP contribution 8
Table 9: Percentage of total employment – comparisons with other industries (2015-16) 12
Table 10: Percentage of total employment (forecasted) – comparisons with other industries (2022) 13
Table 11: Consumption levels per job (2015-16) 13
Table 12: Employment generated per $1m in tourism consumption (2015-16) 13
Table 13: Visits per job (2015-16) 13
Table 14: GDP/GSP generated per tourist dollar (2015-16) 15
Table 15: Tax generated per visit (2015-16) 17
Table 16: Tax generated per $1 million in tourism consumption (2015-16) 17
Table 17: 10-year visitation forecast by state/territory 26
Table 18: 10-year consumption forecast by state/territory 27

TOURISM & TRANSPORT FORUM
LEVEL 6 7 MACQUARIE PLACE SYDNEY NSW 2000 T: +61 2 9240 2000www.ttf.org.au
© 2018