TOURISM PRODUCT DEVELOPMENT CO … PRODUCT DEVELOPMENT CO...Describe product development, ... cycle...
63
TOURISM PRODUCT DEVELOPMENT CO- ORDINATION Author: Bill Wright B.Com MBA Copyright 1994
Transcript of TOURISM PRODUCT DEVELOPMENT CO … PRODUCT DEVELOPMENT CO...Describe product development, ... cycle...

TOURISM PRODUCT DEVELOPMENT CO-
ORDINATION
Author: Bill Wright B.Com MBA
Copyright 1994

2
Outcomes On successful completion of this module, participants should be able to: 1. Describe product development, decision-making and information-gathering processes
relevant to the tourism industry. 2. Plan and co-ordinate an appropriate marketing information system. 3. Administer and co-ordinate a product development project from concept to decision
(prior to commercialisation). 4. Formulate basic project management techniques.
LEARNING OUTCOMES
Learning Outcome 1
Describe product development, decision-making and information-gathering processes
relevant to the tourism industry.
Assessment Criteria
1.1 Apply the following decision making processes to given tourism situations:
• needs analysis;
• situation analysis;
• distillation of key issues;
• definition of key problems and opportunities;
• definition and analysis of major alternatives;
• consultation and participation processes;
• selection and implementation.
1.2 Apply business/marketing planning methodologies to given tourism situations to identify key information needs, taking into account the following factors:
• macro environment;
• industry demand, supply and competitive conditions;
• organisational analysis or management audit;
• SWOT analysis;

3
• portfolio analysis;
• product life-cycle analysis and expectations;
• selected marketing strategies concerning segmentation and targeting, product positioning and differentiation, pricing, distribution and promotion;
• selected growth strategies concerning market penetration, new market development, new product development and diversification;
• need for new product development as highlighted by corporate gap analysis as a growth strategy;
• implementation proposals for new product development.
Content
1.1 Apply decision making processes to given tourism situations
• Areas for application
The decision making process is relevant to two areas
• the organisation
In activities associated with report-writing, planning and problem-solving.
• the consumer
In activities associated with the consumers behavioural processes of awareness, interest, evaluation, trial and adoption
• Decision making process
• Step 1 - Recognition
• Awareness
A problem is usually most felt and voiced by those affected as it impacts on their lives. Careful monitoring and research is therefore necessary to detect these concerns and maintain a high level of awareness. It is often said that problems are opportunities in disguise.
A problem is a deviation from standard. This presupposes that a desired state (standard, target or objective) exists and therefore the actual state is at variance with this. This is how we become aware of a problem.

4
• Needs analysis
The desired state in many cases relates to needs, eg consumer, stakeholder and/or organisational needs. Needs provide the rationale for objectives.
• Situation analysis
Conduct a situation appreciation to become familiar with the facts about the environment, context and variables related to the problem. What happened? When and how? Who was involved? Why did it happen?
• Distillation of key issues
The key conclusions from the preceding analyses can be stated as issues. Issue statements should be designed to help us understand the problem environment before we attempt problem definition.
• Step 2 - Definition
• Probe until the real problem is exposed. Look beyond symptoms for a cause. Question the evidence. Keep asking “why?”
• Attempt alternative definitions
• From the selected definition establish the objective(s), constraints and criteria for evaluating the alternatives and guiding the problem-solving process and the implementation.
• Step 3 - Alternatives
• Search
Define and evaluate each alternative using experience, historical records, competitive situations, etc.
• Consultation and participation
Encourage creativity using lateral thinking including brainstorming group sessions.
• Analyse
Make predictions about impacts, inputs and outcomes. Quantify as much as possible. Use the pre-determined criteria (referred to above) eg. Profitability, financial ratios, Return on investment.
• Step 4 - Selection and implementation

5
• Decide which alternative best meets the criteria. Question the analysis and supporting evidence.
• Allow for judgment, acceptable risk and personal experience, etc.
• Decide on the best approach and action plan for implementation including resource allocation (human, financial, physical) and performance standards for time, cost and quality.
• Class Exercise 1 (say 20 mins)
• You are a consumer interested in taking an adventure holiday and have heard from a friend recently that it is possible to hire a self-drive 4WD vehicle. Describe the decision-making approach you might follow? Is this approach always likely to be rational?
• You operate a 4WD escorted tour operation business and you are contemplating ways and means of improving access into remote areas. The thought immediately arises that a 6WD vehicle would be the answer. Describe the decision-making approach you might follow? Is this approach always likely to be rational?
1.2 Apply business/marketing planning methodologies to given tourism
situations
A business planning model is dealt with more fully in CMTR6 Business Plan Administration and SMTR6 Business Plan Management. Most marketing planning models follow similar steps and these have been dealt with to some extent in marketing modules. A synopsis of the relevant parts of these models for product development purposes now follows:-
• Macro Analysis
This involves a wide range of enquiry, detection of trends and key issues and statements of assumptions for planning purposes about
• Economy - major economic developments and trends that might impact the organisation.
• Society - major demographic and cultural developments and trends that pose opportunities or threats.
• Environment - outlook for cost, availability of resources and the need for protection in the physical environment.
• Technology - major changes in relevant product, service and process technology
• Unions - demand for improved wages and working conditions etc
• Industry Analysis

6
This also involves a wide range of enquiry, detection of trends and key issues and statements of assumptions for planning purposes. It includes demand , supply and competitive analysis.
• Demand analysis
• market size, growth and geographic distribution
• underlying determinants of demand, vulnerability to the business cycle and links with consumer needs and behaviour
• segmentation of the market data by location, product type etc
• analysis of long-term industry sales to reveal the shape of the underlying product life cycle (market saturation or penetration curves) and determination of which stage of the product life cycle we are at and analysis of product life cycles for comparable products
• study of comparable markets overseas and the market for substitute products
• Supply analysis
• unused capacity (vacancy) and capacity utilisation (eg room occupancy)
• availability and risks in supply of raw materials, labour and capital resources
• competitor analysis
• level of concentration and fragmentation and prospects for industry rationalisation
• locational analysis (proximity to markets and raw materials etc)
• Exit barriers and entry barriers (eg economies of scale, product differentiation, capital requirements, distribution access, government policy, probable retaliation)
• Bargaining power of suppliers etc
• Study comparable markets overseas
• Class Exercise 2 (say 30 mins)
• List 5 hypothetical key factors for success in the 5 star accommodation industry

7
• Choose a 5 star hotel in your own city and evaluate how well you think it satisfies these success criteria.
• Competitive analysis
• market share for own organisation and for key competitors
• analysis of market share movements in terms of key historical events in marketing mix strategy
• competitive trends are developing in numbers of competitors, technology, promotion, pricing etc?
• financial analysis and management capability assessment of key competitors
• differentiation between competitors
• product design comparison (features and benefits)
• comparable markets overseas
• Organisation Analysis
The aim of this analysis using a management audit approach is to evaluate management capability in the main functional performance areas with a view to determining strengths which can be protected, further developed and capitalised upon and weaknesses which can be overcome.
This means evaluating people and processes in the following areas:-
• Marketing Management
A well-researched and comprehensive marketing audit should be periodically completed covering
• Market demand, segmentation, market share trends and key marketing mix strategies influencing market growth and competitive positioning
• Consumer needs and attitudes to reputation, image, service quality, helpfulness and price.
• Competition
• Marketing planning effectiveness
• Products and services

8
Do we have any locational advantages and disadvantages? What is our relative product strength compared to competitors and substitute products? How well does our product relate to consumer needs? What opportunities are there for innovation? What strengths and weaknesses have been dominant in the organisation’s history (eg design features, quality, reliability, patent protection, branding etc)? How do existing customers, potential customers and distributors regard the organisation’s products and services? Can each product line stand on its own feet without support from other product lines?
• Pricing
Have prices and margins changed over the product life cycle? Are there any anomalies in our pricing compared to the competition and how do we justify price advantages and disadvantages? Do we use price promotion well?
• Promotion
• Distribution
• Production & Development
• Financial Management
• Human Resource Management
• Top Management
• SWOT Analysis
• SWOT means strengths, weaknesses, opportunities and strengths.
• a group “brainstormed” SWOT analysis is a good way to start a participative planning process.
• the conclusions from a SWOT analysis are used to help shape strategy ( particularly in Portfolio Analysis which will be dealt with later). The formulation of strategy requires matching an organisation’s strengths and weaknesses (particularly its distinctive competences) to the opportunities and threats (risks) in its environment.
• SWOT analysis can be applied to part of an organisation (eg product, product group, department, geographic area, function, business unit), the organisation as a whole, a competitor, an industry and in the case of tourism to a destination, precinct, town, region or country.
• Some organisations may have already identified the key factors for success for doing well in an industry and the key result areas for their
9
business. These can also be used as criteria for a more focussed SWOT analysis process (eg customer satisfaction, productivity, innovation etc)
• There are two ways to do a SWOT analysis. The SWOT approach - where the analysis is done under the SWOT headings and the integrated approach - where the analysis is carried out in a check-list fashion using the Situation Analysis headings and then concluding for each heading whether there is an opportunity, threat, strength or weakness
• Whichever approach we should develop a final summary statement of opportunities and threats (derived from Macro and Industry Analyses)
• The strengths and weaknesses component is an absolute and competitive assessment of strengths and weaknesses derived from the organisation analysis. They are sometimes referred to as competitive advantages and disadvantages. In this sense they are relative strengths and weaknesses as we seek answers to the question “ are we doing better or worse than our competitors?”
• The process is to ask “what do we need to do to do well?”, “have we got those things?” and “are we doing them better than the competition?”
• Often a rating system helps where points are allocated for the organisation and its key competitors. If key factors are identified, the rating system can be weighted and an overall score established.
• Strengths can be assessed in absolute terms (compared to consumer needs) or in relative terms (compared to competitors). They should describe areas of competitive advantage for defensive and offensive action.
• Weaknesses are areas of competitive disadvantage and are vulnerable to attack
• Class Exercise 3 (say 20 mins)
• Imagine you are the new chief executive of a city restaurant. Draw up an hypothetical list showing 2 opportunities, 2 threats, 2 strengths and 2 weaknesses that might relate to you expanding your business by buying the site next door.
• Strategy
Strategies are major courses of action that give significant leverage to the achievement of objectives. They precede structure.
The strategy process is sometimes described as looking first at what we might
do, then at what we can do, then at what we must do and lastly at what we
will do.

10
The value of the concept of strategy is that top management will focus appropriate time on the broad courses of action, the master-strokes, that will, because of their scope and leverage on objectives, capture the imagination of the management team and clarify the whole business and marketing planning process. Otherwise proposed actions of strategic importance will get lost in the myriad of plans, tasks and issues. There has to be a sense of priority.
• Gap closing strategies
• A gap is the difference between the objectives desired for future performance and the level that is likely to be reached if the existing momentum of the business is sustained without a major change in direction or resource allocation
• the gap to be filled can be revealed by plotting the contribution to profit that existing products make and comparing this with the targetted contribution objective. Note that each product is an overlay such that the curve above product C represents the combined contributions of products A,B and C.
Profit Contribution
Required Profit Target
Gap
Product C
Product C
Product A
Years
• Gap-closing refers to the art of re-defining strategy to find new ways of doing business to reach desired objectives by emphasising strategic thinking. The greater the gap, the greater the challenge for strategic management.
• Six alternative ways (growth strategies) to close the gap

11
• Improve current momentum by fine-tuning existing products , markets and processes
• Radical internal improvements eg re-structuring to achieve greater decentralisation, flatter organisational structures and greater commitment through contractual arrangements
• Improve market penetration with existing products into existing segments
• Develop new markets (ie entering new market segments)
• Develop new products
• Diversification
• The last four of these growth strategies are often described in table form as a “product/market matrix”, a “growth matrix” or a “growth grid”. Presentation of this grid can be a useful aid for stimulating discussion and providing a systematic framework for analysis because it forces management to consider all the possibilities and to get “outside the square” of traditional organisational thinking.
MARKET PRODUCT
PRESENT NEW
PRESENT
Market
Penetration
New Product Development
NEW
New Market Development
Diversification
• Market penetration strategies
New ways for existing products in existing segments. These strategies are less risky than new markets and new products and are attractive because they build on strength and experience.
• Stimulate industry demand
• Co-operative industry research and promotion, particularly in the initial stages of the product life cycle (market saturation or penetration curve)
• Market leadership initiatives to demonstrate new ways to stimulate customer usage of the product (these can also help win market share)

12
• Increase the unit size for purchase eg. increasing the size of the package for a product or a organising a package deal for a tourism product or incentives to increase length of stay
• Increase market awareness and the frequency of purchase through price incentives, free coupons, off-season pricing, customer loyalty clubs and promotions
• Reduce product life through planned obsolescence eg reduce product quality to encourage replacement purchase or in the case of tourism activities reduce continuous market offerings to less frequent events
• Find new uses for the product eg
• Eucalyptus oil use extended from massage to inhalation
• Extending the use of a TV monitor for computer games
• Extending passive museum displays of early farming implements into demonstartions at farm holiday locations and/or agricultural festivals
• Win market share from competing products, destinations, towns and regions by improving the marketing mix to support existing product
• Better communication, product positioning, brand identification, image and identity by clarifying role, uniqueness and product benefits
• More effective promotion (sales force, advertising, PR and promotions)
• Price reduction and volume incentives eg price advantages for regular users and families
• Improve profitability from existing customers
• Identify most profitable segments and concentrate resources on them
• More focussed promotion (eg more selective sales prospecting, more targeted advertising and direct mail) and distribution (eg targeted agents or wholesalers) to these segments
• Maximise contribution by trading volume for price increases
• Value adding involving adding product and/or service benefits where the incremental price provides a much higher margin eg existing product gross profit mark-up is 50% but we increase

13
the price by $20 where it only cost $10 to provide the new benefits resulting in 100% mark-up in incremental terms.
• Market development strategies
Involves new ways for existing products in new segments.
• Enter or open up new geographical segments
• Enter or open up other demographic, psychographic and behavioural segments by motions to non-users
• Finding new uses for new users eg promoting a farm for farm holidays
• Product development strategies
• Product enhancements
• “Facelifts” involving aesthetic changes to maintain product image and newness/freshness
• New features and activities to encourage re-purchase and repeat visitation from existing segments
• Extended new features to appeal to new segments eg extra facilities for children to tap the family market
• New products
• Fundamental upgrades to existing products eg a major overhaul of the function and aesthetics of an existing product involving new materials, new components, new packaging; a major renovation and re-building programme.
• Extension of the product line eg new products at the top end and bottom end of the product line to increase sales and protect existing products from competitive threats; land acquisition of adjoining sites for increased accommodation and/or activities
• Developing new product lines that complement the existing product line
• Major new products eg resort, theme park, tourist village
• Diversification strategies
To illustrate these strategies assume we are running a business as a tour bus operator.
• Vertical integration

14
• Forwards (towards the customer) - eg we could start up or buy a business such as a tour wholesaler, travel agency, restaurant, retail outlet or even a finance company to help faciltate sales
• Backwards (towards the supplier) - eg we could start up or buy a motor repair workshop, a bus body-building and assembly factory or a fuel distribution outlet.
• Horizontal integration - involves starting up similar businesses under different brand names or buying competitors eg taking over another bus operator
• Capitalising on existing strengths eg
• field strengths. For a business selling products through a strong distribution or sales-force network there is an opportunity to sell other different products using these strengths. Eg our bus operator might have strong contacts with tour wholesalers and decide to promote (for a commission) other tourism products through this network with package deals etc
• financial and/or management and/or locational strengths by starting up or buying a completely different business
• Product life cycle
• this topic is covered in depth in marketing modules and so will be dealt with only briefly here but more fully in “portfolio analysis” (which is underpinned by product life cycle analysis), and in Learning Outcome 2.
• the shape of a past and/or expected future industry demand curve for a product is of great concern to strategists because it relates to growth rates that might be expected for their own sales and the type of strategy to be used depending on “where we are on the growth curve”
• long-term demand curves take many shapes but there is a general pattern of growth implicit in all products that are not “oncers” or styles, fashions or fads. This is reflected in an “S” shaped curve marked by four distinct stages after a product has been developed and released in the market for the first time
• Introduction - slow growth as “experimenters” or “innovators” (probably in the range 2-5%) first try the product followed by “early adopters” (probably 10-15%)
• Growth - rapid acceptance by the “pragmatists” who wait until a product has proven acceptance. The first group of these are referred to as the “early majority” (probably 30-35%)

15
• Maturity - and then comes the second group called “late adopters” or the “late majority” (probably 40-30%). Market growth slows down as most potential buyers have bought the product.
• Decline - some of the “late majority” are buying with also some replacement or repeat demand but without innovation the product will die and sales and profit will decline. The “laggards” (18-15%) are holding back and some of these are “resisters” who reject the product will never be persuaded to buy.
• this “normal” pattern of growth brings two major challenges for strategists
• to find new products to replace those that are in the decline stage of the product life cycle. This challenge is discussed in the topic “new product development” in Learning Outcome 3
• to know how to manage products optimally in each stage. This challenge under the heading “life cycle strategies” is covered in marketing modules and strategies concerning price, promotion and distribution are not dealt with in this module.
• Class Exercise 4 (say 10 mins)
• Choose a popular nearby tourism region. What % of the adult population for the city you currently live in would have visited that region? What do think the % was 10 years ago?
• Portfolio analysis
• Portfolio analysis is an analytical and prioritising process for comparing a collection (portfolio) of different businesses and/or product groups and allocating resources between them according to their fit with markets and organisational capability in order to maximise future profit potential.
• It is a logical extension of SWOT analysis and could be completed in part at that stage of business planning, certainly as far as existing businesses are concerned.
• It is designed to avoid problems of an unbalanced portfolio such as poor profits, cash flow and growth through having too many losers ( a losing problem) on the one hand or management indigestion and cash flow pressure resulting from excessive growth through having too many winners (a winning problem) on the other.

16
• Boston Consulting Group Grid
Products, product groups or strategic business units are placed on a grid consisting of four categories…stars, cash cows, question marks and dogs.
Strategic business units (SBU’s) are areas of the organisation which can be grouped together according to a common strategic factor eg locational centres, customer groups or technology areas (inc product groups )
A grid is developed with growth rate on the vertical axis and relative
market share on the horizontal axis and shows Stars (high growth, high
share, need funds, best profit potential), Cash Cows (low growth, high
share, generate funds, already profitable), Question Marks (high growth, low share, need funds, discontinue if share can’t be increased)
and Dogs (low growth, low share, need funds, candidates for divesting).
Surplus operating funds from “cash cows” and divestment funds from “dogs” should be used to support the “question marks”.
Portfolio analysis assumes that products have a long-term growth curve (product life cycle). Products start off in the early stages as question marks, perhaps then enjoy faster growth as stars, become cash cows which must be milked the growth slows down and as market maturity is reached and then dogs as the market enters long-term decline
• McKinsey Product Portfolio Grid
Related to the SWOT Analysis because it looks at the external and the internal environments
Developed in association with General Electric and uses more market criteria than market growth including industry/market size and growth and factors concerning market quality, supply and competitive structure, industry profitability and other aspects of the external environment.
Uses more organisational capability criteria than market share including SBU or product group size and growth, relative market share and position, margins and profitability, manufacturing and technological position, strengths & weaknesses, image, pollution and human resource capability. It is important that the factors selected for analysis are of industry significance and could just as easily apply to any competitor. However, the scoring system is based on relative advantage.
The McKinsey grid analysis will suggest some generic strategies that
might be explored based on conclusions whether we should build, hold
or harvest.

17
• Synergy
Synergy occurs where, through a combination of business activities, the results are greater than the total would have been if each were pursued individually with separate organisations.
The concept is often expressed as “2 + 2 = 5” where the combined return is greater than the sum of the individual parts.
• After the generic strategies have been identified we must look for synergy between the selected strategies. The strengths in one area might help and therefore add weight to the case for another SBU or product group. n - more selective
• Competitive response analysis
The last step in portfolio analysis before we finally select our strategic priorities is, like in warfare or chess, to assess the likely competitor reactions to the chosen strategies.
Where the situation warrants, it may be helpful to conduct a portfolio analysis for each key competitor as a basis for considering moves and counter-moves
Role-playing may be beneficial where one player moves and then the other with both explaining their reactions to the others’ move and the rationale for their own moves.
• Implementation
• Implementation involves all areas of management and every manager must have the ability to get things done through other people. We have to get the right people in the the right place at the right time with the required skills and resources to do the job better than the competition.
• In summary, there are several key considerations for designing and managing implementation:-
• Consolidate the key steps from the strategic programmes and schedules
• Review the responsibility areas in terms of human resource availability
• Review how these responsibility allocations and work-loads match the existing organisation design and responsibility profile
• Ensure adequate physical and financial resources are available

18
• Define performance requirements for key organisational units and executives
• Determine personal motivation and incentive systems
• Analyse key inter-relationships and co-ordination procedures
• Ensure adequate participation of those responsible for detailed operational implementation
• Establish appropriate information systems to ensure timely and effective measurement of performance against standards so that corrective action can be taken when required
• Adopt relevant training programmes to ensure implementers have the desired level of knowledge and skills before-hand
• Ensure that all leaders understand and are committed to the implementation plan
• an action plan must be prepared and agreed. This is a written summary statement of who does what and when?
• finally a financial plan must be prepared covering costs, benefits and resource requirements. Resources (capital expenditure and human resource expenditure budget); Budgets (profit & loss - total and by division; cash flow; balance sheet; ratios and funds statements ; Summary costs and benefits
Learning Outcome 2
Plan and co-ordinate an appropriate marketing information system.
Assessment Criteria
2.1 Specify the gaps in consumer, market and competitor information focusing on
product development, taking into account the following factors;
• target customer profiles;
• market statistics (total and by segment);
• competitor information (brochures, pricing and distribution);
• features and benefits;
• value for money comparisons.
19
2.2 Plan and co-ordinate an on-going marketing information system for monitoring products, prices and consumer trends relevant to each existing and newly introduced product, taking into account the following factors:
• competitive positioning (matching target markets and product line positions);
• competitor brochures;
• launch and introduction of new products using predetermined performance standards and milestone objectives for time, cost and income;
• consumer, trade and competitor reaction.
Content
1. Planning and Co-ordinating a Marketing Information System
• what is a marketing information system?
• a systematic and objective approach to the development and maintenance of critical data concerning markets, consumers, intermediaries, competitors and other organisations and intermediaries (that might directly or indirectly impact the marketing process) and concerning organisational performance in accordance with marketing plans and budgets.
• the ability to collect, analyse, store and report this kind of information information is a key aspect of marketing planning and control.
• the heart of any marketing information system is quantitative and qualitative consumer and market research.
• a modern, appropriate and competitive system should include the following components
• segmentation and target market analysis
• market statistics
• competitor information
• features and benefits analysis
• value analysis
• product positioning analysis
• marketing plans and budgets
• segmentation and target market analysis

20
• the essence of marketing is to find customers (consumers), understand their needs and tailor the organisations offerings to match those needs, maximising customer satisfaction
• because customers are different we try to divide the market into meaningful groups. This process is called segmentation. Segments may be chosen on the basis of demographic, geographic, psychographic or behavioural attributes
• market segmentation is a strategy designed to allocate marketing resources to defined segments
• defining the segments is often a multi-step process, eg we might first divide the market up by origin (and focus on Japan), then that segment by location (and focus on Tokyo), then that segment by occupation and sex (and focus on female office ladies), then by age (and focus on 25-35 year olds).
• alternatively we might segment first on the basis of benefits sought eg a snack food market might be divided up into those primarily seeking nutrition benefits, taste benefits, social benefits and diet benefits. Sementation could then proceed to sub-divide and describe on the basis of demographic, geographic, psychographic and behavioural characteristics.
• part or all of a chosen segment is then chosen for targetting purposes. This is referred to as a target market. Whatever the basis for segmentation this target market must then be fully described in the above terms. eg the 25-35 office lady segment in Tokyo must be satisfactorily described in geographic, demographic, psychographic and behavioural terms. We need a full quantitative and qualitative description of this target market if we are to properly understand them and ensure that our marketing mix satisfies their needs as well as or better than the competition.
• we know we have an adequate target market profile when we can answer questions like
• who are our customers (or potential customers)?
• why do they buy?
• what communication objectives and process should we use to reach them?
• what is their decision-making process?
• it follows that our market information system must track this target group to detect changes, problems and opportunities and to monitor
satisfaction. In short we must know our customers.

21
• market statistics
• we must gather long-term history about the market and graph industry sales. Ideally the graph should start from when the first product in the industry was released because we are trying to measure product life cycle and to see where we are right now on the cycle. We should not be satisfied with just the last 5 years because 5 years of history is not long for trend analysis to be able to predict the next 5 years
• not all long-term sales curves are “S” shaped and even if they are, some might small or flat while others are large and tall indicating strong market penetration over a long period of time
• we must be able to explain the shape of the curve in terms of the underlying determinants of demand and major competitive events like innovation etc
• the next step is to project the market into the future for at least the next 5 years. Will the curve go up, down or sideways? What will the rate of growth be? This can be tried first of all using charting or mathematical techniques but whatever shape is decided it must be explained and justified with assumptions about the underlying determinants of demand.
• having done this exercise for the total market we then try it also by segment. It may well be that some segments are showing strong growth while others are dying. Thus there may be a collection of product life cycles underpinning the one for the total market.
• once we are clear about the shape and direction of the product life cycle and our current position on it we can design strategic responses for new product development and other elements of the marketing mix and corporate strategy
• market statistics can be gathered from government and/or industry sources. If the statistics are deficient then action should be taken at the government and/or industry levels to correct this situation. World best practice demands this standard of market intelligence not only to remain competitive but for survival.
• Class Exercise 5 (say 20 mins)
If you have a casino in your home city
• what % of the adult population do you think would have visited the casino at least once?
• what is the potential penetration level in 5 years time?
• draw an hypothetical product life cycle curve?

22
• would there be any value in studying similar growth curves for the casino industry overseas?
• competitor information
• the marketing information system must include surveillance of key competitor marketing mix strategies and financial performance
• this must include product brochures, actual product held for analysis
(or inspected), retail and wholesale price information (preferably
copies of price lists), promotion details (sales force deployment, advertising, promotion, public relations etc), details concerning
distribution (key wholesalers, retailers and agents) and financial reports (credit information, annual reports, newspaper reviews etc)
• this information must be supplemented with
• consumer research measuring consumer attitudes to competitive offerings (product, price, promotion and distribution)
• comparative strengths and weaknesses analysis with own marketing mix variables (preferably with a rating system approach)
• distributor research of attitudes concerning relative strengths and weaknesses, particularly in terms of perceptions about consumer needs and satisfaction.
• features and benefits analysis
• consumer research should reveal
• the strength of consumer acceptance and buying intentions of your own product and competitive product offerings
• prospective consumer reactions to prospective changes in product and other marketing mix variables
• an understanding of benefits in terms of stated needs and underlying psychological needs
• every feature should have an incremental benefit of greater value than the cost of putting it there
• value analysis
• competitive comparison should be systematic.Each feature offered, whether it be functional or aesthetic, must be assessed in terms of its reason for existence.
23
• each component part of the whole product has to be justified. What is it there for? What value (part of the overall price) might consumers place on this part?
• might there be a better way of providing value by decreasing the contribution some components make to the overall product and shifting the cost saved into other features? Value analysis is a technique that applies the decision-making process to the fundamentals of design.
• value for money comparisons.
• the golden rule is that if our product is the same we can’t charge a higher price than the competition unless we have other distinguishing strengths (eg distribution, promotion, image, reputation) to justify the price premium
• these other competitive advantages have to be perceived as such by the consumer and valued by them accordingly.
• Class Exercise 6 (say 20 mins)
Discuss the issues surrounding your last holiday of greater than 2 nights away.
• what alternative destinations did you consider?
• what alternative accommodation did you consider at that destination?
• what criteria did you use to select your accommodation?
• how many points out of 10 would you have given the accommodation provider before you left on the basis of your expectations about product, price, service, communication etc (and why)?
• how many points on the basis of experience after you returned home?
• product positioning analysis
Positioning involves a matching process between positions sought in the market place (target markets) and positions in the industry product line. It involves linking rationally thought out positions on the demand side (which is called “consumer positioning”) and on the supply side (which is called “competitive positioning”)
• competitive positioning
• the industry product line can be segmented in several ways
• by size categories
• by price categories
24
• by type of material (or functional approach) categories
• by feature categories
• by benefits (consumer need categories)
• the object of this sort of analysis is to determine our competitive position on the supply side to see if there is a prima facie case for changing our product line, by filling gaps and/or adding to the depth and width of our product line. The analysis should show areas where we are competitively strong or weak and areas of competitive opportunities or threats.
• one approach in competitive positioning is to use the “top-of-mind” position of an industry leader as a frame of reference for product development and comparative advertising eg “Jamaica...the Hawaii of the south”, “7-Up...the un-cola”, “Brand X....more space than Brand Y”
• sometimes in tourism we are constrained by the type of product we have and do not have a great deal of freedom to identify market gaps and design product to suit eg we might have a seaside location with a unique character that would be destroyed by a “Disneyland” or high-rise hotel product even if we believed the market potential was there for such products
• Class Exercise 7 (say 15 mins)
Think of the accommodation market for a particular area and name at least 2 brands each for 3 star, 4 star and 5 star accommodation. Are there any gaps in the market that you would recommend an investor to have a look at? Where do all-suites hotels fit?
• the final step in competitive positioning is to communicate product benefits to the target market by comparing them with the competition.
• consumer positioning
• we have already said that market segmentation and targetting seeks to conserve and optimise resource allocation by directing marketing effort to defined segments.
• products must be positioned to match defined target markets by communicating product benefits to meet the already identified needs of these target markets.
• consumer positioning associates the product with needs in a specific or general way

25
• specifically, by seeking to establish direct links between consumer benefits and product features
• or generally, by establishing an appealing image or setting that suggests that benefits sought will be matched by the features offered
• positioning helps build brand identity and “top-of-mind” positions in the consumers mind. These positions can be established on the basis of real benefits offered or by imagery and symbolism.
• consumer analysis of perceptions of brands or products can help define our current consumer position and desired future position. This is done by a process known as “perceptual mapping”. Consumers are asked in a research setting to rate products on the basis of benefits eg food products might be rated using the following scales... nutricious, natural, requires little preparation, good for snacks, economical, good to serve guests, good tasting, low calorie. Cluster analysis groups these responses and a map is then drawn to show brand positions in terms of benefit categories.
• sometimes two dimensional scaling using two selected attributes can help map positions eg
• in the map below we could place Queensland in segment 2 and perhaps South Australia in segment 3. South Australia would like to position itself in segment 1, a “boutique” segment to position itself competitively against the “mass-market” segment 1.
High differentiation
1 2
Low High
Volume 3 4 Volume
Low differentiation
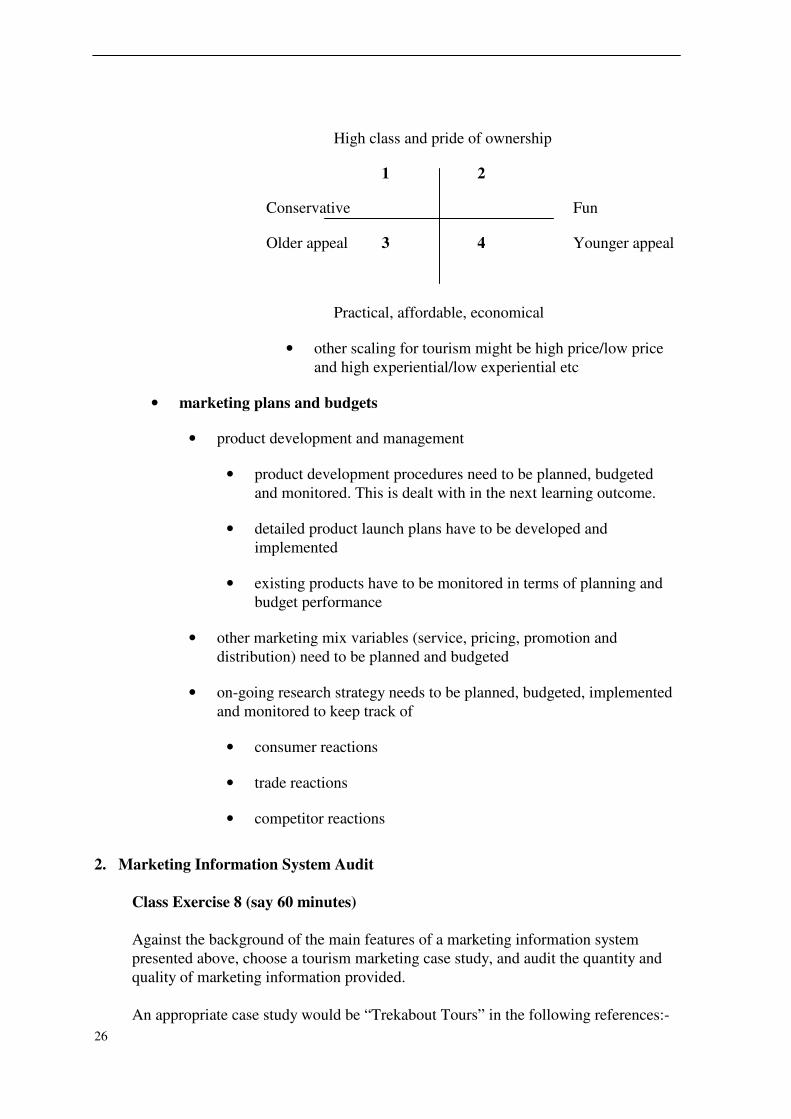
• in the map of the car market below we could place Mercedes and Rolls Royce in segment 1, BMW and Porsche in segment 2, Magna and Commodore in segment 3 and Torana and Honda in segment 4.
26
High class and pride of ownership
1 2
Conservative Fun
Older appeal 3 4 Younger appeal
Practical, affordable, economical
• other scaling for tourism might be high price/low price and high experiential/low experiential etc
• marketing plans and budgets
• product development and management
• product development procedures need to be planned, budgeted and monitored. This is dealt with in the next learning outcome.
• detailed product launch plans have to be developed and implemented
• existing products have to be monitored in terms of planning and budget performance
• other marketing mix variables (service, pricing, promotion and distribution) need to be planned and budgeted
• on-going research strategy needs to be planned, budgeted, implemented and monitored to keep track of
• consumer reactions
• trade reactions
• competitor reactions
2. Marketing Information System Audit
Class Exercise 8 (say 60 minutes)
Against the background of the main features of a marketing information system presented above, choose a tourism marketing case study, and audit the quantity and quality of marketing information provided. An appropriate case study would be “Trekabout Tours” in the following references:-

27
• Peter Graham, 1990, Insights into Australian Marketing, Prentice Hall, P 128
• Peter Graham Ed, 1988, Readings and Cases in Marketing, Prentice Hall, P 148 & 220
Each college will need to abide by copyright regulations for copying. An outline analysis is provided in Handout 1 “Trekabout Tours Case Analysis” which covers most of the headings referred to above but leaves plenty of scope for enhancement for learners applying a marketing information system audit approach.
3. Planning and Co-ordinating a Marketing Information System
Class Exercise 9 (say 30 minutes)
In reference to the case selected for the previous section learners should
• conceive a new product concept (for “Trekabout” this could be a new 6WD or an 8 seater plane for high priced air safaris)
• discuss how the marketing information system encompassing both the existing products and the new product might be planned, co-ordinated and monitored particularly in terms of
• competitive positioning (matching target markets and product line positions)
• ongoing competitor brochure collection and analysis
• to cater for the launch of the new product with predetermined performance standards and milestone objectives for time, cost and income
• to monitor consumer, trade and competitor reaction.
Learning Outcome 3
Administer and co-ordinate a product development project from concept to decision
(prior to commercialisation).
Assessment Criteria
3.1 Describe the organisation environment in relation to innovation and change,
taking into account the following factors:
• environment for creativity;
• attitudes to change;

28
• resistance to change.
3.2 Prepare a new product design brief including:
• product concept/image;
• consumer and competitor criteria;
• financial criteria;
• desired scope (face-lift or breakthrough?).
3.3 Apply appropriate strategies to generate and stimulate idea creation, including the following:
• creative groups and brainstorming;
• word search techniques (e.g. adapt, substitute, combine, etc.);
• matrix analysis;
• cross tab analysis.
3.4 Develop search strategies for new ideas, including:
• newspapers and trade magazines;
• customer and trade surveys;
• sales force surveys;
• competitor product shopping;
• trade shows and exhibitions;
• financial reports of competitors;
• overseas trip reviews;
• database enquiries.
3.5 Use suitable strategies to screen alternatives, including the following:
• compare with product brief;
• evaluate income, cost and funds projections;
• evaluate financial returns and risks;
• evaluate human resource management implications;
• matrix analysis (including scoring and rating).
Content

29
3.1 Organisation environment
• environment for creativity
• top management must develop and maintain an innovation culture in order to remain profitable and competitive.
• this requires a strategic thinking and planning outlook over the long-term and the provision of commitment, support, incentives and encouragement for change processes and innovators (change-agents)
• attitudes to change
• people in the organisation should believe and demonstrate healthy attitudes to change
• they should recognise that true long-term survival, security and improving benefits flow to the most creative, adaptible and flexible individuals and organisations
• resistance to change
• some people are natural pioneers and innovators, but most have to be encouraged and trained
• many people feel insecure about change particularly when it is forced on them by factors outside their control. The key word is control. We like to maintain a reasonable degree of control and therefore seek involvement in any steps to introduce change. If change is necessary we like to particiapate in the planning for
such change .
• factors likely to block change for new product development include
• poor consultation, participation and communication
• poor justification for change
• lack of commitment etc from top management
• unresolved threats to job responsibility, authority, autonomy, status, prestige, remuneration and security
• unrealistic and un-agreed increases in work load
• disruption of informal groups and team balance

30
3.2 New product design briefs
• The design process follows the problem-solving process in that we start off with an initial appreciation, then formulate the objectives (define the problem), then evaluate the alternative design approaches, choose the best design strategy and plan the necessary activities and resources, then implement and review performance.
• Too many products and projects either
• start off without a clear brief or
• at the other extreme start off with a pre-conceived design (sometimes copied) or a far too detailed specification both of which leave little or no room for design creativity
• The purpose of the design brief is to set broad parameters to guide the design process and to establish criteria for design evaluation. Product designers, architects, engineers and other professionals should not commence design without an agreed design brief. Furthermore, management should never accept a sketch design or detailed perspectives and site plans etc before the design brief is completed.
• Design briefs should be driven primarily by market and finance considerations and should include the following components:-
• Strategic guidelines eg
• is this a facelift or are we looking for innovation?
• is significant innovation desired?
• what quality and leadership standards might apply?
• do we have to use existing tooling? (unlikely for the service sectors of the tourism industry but possibly for manufacturing tourism products eg gifts and mementos)
• is there a concept brief?
• Operational guidelines eg
• expected sales release or opening date?
• estimated volume per annum? (this might influence the process technology and materials used)
• what assumptions should we make about market product life?

31
• is the volume associated with other products in the product line relevant?
• do we need a cost constraint eg it should cost no more than....?
• is service a critical factor?
• who is the product being designed for? What consumer research do we have about the target market (prospective users)?
• Functional guidelines eg
• what are the prime functions (features providing to user benefits) and secondary functions?
• what psychological needs are relevant?
• how important is it to “look good” versus “perform well”?
• Competitive guidelines eg
• who do we have to be “better than”?
• can we set competitively based quantified standards in prime functional performance areas?
• The design brief provides the objectives and background for the designer to follow. The designer then considers alternative concepts or design strategies, analysing each before they are discarded, and then presents the recommended design approach to management. The recommendation has to be justified and the designer should also be required to explain alternatives considered but rejected. This is to guard against shallow and/or non-creative design thinking.
• Management should assess the design against the criteria contained in the brief and complete a financial appraisal.
• Management must not be unduly swayed by high-powered professional presentations and concentrate on content more than style at this stage. They must remain objective and ensure that the design strategy provides the best fit to organisational and consumer requirements.
3.3 Idea generation
• Fortunately, unlike high intelligence, creativity is reasonably well spread throughout the population. It should be encouraged from an early age. If the fire of creativity is repeatedly quenched through non-encouragement and bureaucracy it eventually dies through lack of practice and frustration.

32
• Many organisations nowadays establish a conducive environment for creativity and a wide range of creativity enhancing activities.
• creative groups and brainstorming
• small groups trained in communication skills, group dynamics and team-building can be a formidable force for innovation
• these groups can be valuable strategic and operational “think-tanks”
• group-work encourages participation, motivation and need-satisfaction
• competition boils down very often to which organisation can foster the best team-work for innovation and implementation
• brainstorming focuses on the quantity of idea generation with a wide level of lateral thinking and without evaluation, ridicule or criticism. Some facilitation might be necessary to stimulate discussion with appropriate questions including the word search techniques set out below.
• word search techniques
Sometime just the mention of a key “action” word or verb will catalyse creative thinking and discussion by individuals and groups. Sometimes this is called product modification analysis. eg
• adapt - is there a parallel idea in nature or man-made?
• combine - can functions or attributes be combined?
• eliminate - is it really needed? What would happen if we removed it?
• magnify - should we make it bigger, longer, wider, deeper, thicker?
• modify - should we change its shape or the way it works?
• re-arrange - can we change the lay-out?
• reduce - should we make it smaller, shorter, narrower, shallower, thinner?
• reverse - should we try something backwards, upside-down or around the other way?
• substitute - what alternative materials or methods might be used?
• matrix analysis
• involves establishing a “spread-sheet” of products in the rows and associated variables as columns.

33
• there may be as little as one column or a multiple number of columns
• for example
• rows for product attributes and columns for market segment and leading competitor
• rows for competitive products and separate columns for market segment, packaging, price-level and distribution
• cross tab analysis
Questionnaires in market research are processed with a special computer research programme (or even on spread sheets) and the responses for selected questions can be categorised under different headings drawn from other questions.
For example, in a visitor survey one question might ask age (say 5 age categories) and another origin (say 5 origin categories). We can cross-tabulate responses to the age question with responses to the origin question. We might found out for instance how many over 55’s come from North America.
If we did a cross-tab analysis for a wide range of selected questions we might find surprising pockets indicating strength or weakness. This is a wonderful tool for new product development because it relates possibilities to target market niches.
3.4 Search strategies for new ideas
• The search process should be systematic with top management defining the terms of reference, the objectives and strategies.
• Sources to be tapped include
• newspapers and trade magazines
• customer quantitative and qualitative research (inc. surveys and interviews)
• trade surveys (distributors, laboratories)
• sales force surveys
• competitor surveys and product shopping
• trade shows and exhibitions
• academics and scientists etc
• financial reports of competitors
• overseas trip reviews

34
• computer databases including the Internet
3.5 Feasibility Analysis
• The new product development process usually involves 8 stages:-
• Idea Generation
• Preliminary Screening
• Design Brief
• Preliminary Business Analysis
• Development
• Final Business Analysis
• Market Testing
• Commercialisation
• There is a high failure rate of ideas through the process. For example, if hypothetically 40 ideas are conceived, 20 might deserve preliminary business analysis yet only 10 might survive this process, 5 might make it through the development process, 2 through final business analysis and testing and only 1 new product finally making it and being ready for commercialisation (a decay ratio of 97.5%) and even then the product might fail in the market-place (note that the failure rate of products released as a general rule is quite high, perhaps from 20% to 80%).
• the actual decay ratio might vary greatly between organisations.
• In this hypothetical situation, the point here is that if we want one new product for sales release we’d better set up an environment to create 40 worthwhile new ideas.
• Class Exercise 10 (say 15 mins)
Discuss the nature and causes of the high failure rate of resorts along the East Coast in the late 1980’s.
• Successful new product development is difficult to achieve due to
• shortage of ideas
• fragmented markets
• social and governmental constraints

35
• cost of the new product development process
• shortage of capital and finance
• shorter life spans due to rapid technological innovation and competitive reaction and “copying”
• the common reasons for failure are
• subjectivity
• market size is over-estimated
• poor design
• incorrect positioning
• poor launch and implementation
• over-priced
• cost of development higher than expected
• Idea Generation
• Discussed above
• Carried out by
• a design team after the design brief has been prepared in the case of major projects or major new products.
• by any employees as an exploratory exercise which may
• establish a prima facie case for the need for a design brief in the case of desired major development
• not lead to a design brief because the ideas are for minor products or improvements which can be dealt with using a simple product specification and approval process.
• Preliminary Screening
• this process might apply to design teams after a design brief in which case ideas are screened against the requirements of the design brief
• in other cases, such as for other employees generating and exploring ideas before the need for a design brief is realised (in the case of major development) and for minor works, a simple questioning procedure should be followed

36
• in these cases
• alternative ideas and concepts need to be screened loosely at first by asking such questions as
• assuming it worked, how big would the market be?
• what might incremental income be?
• what might incremental costs be?
• would it satisfy our pre-determined minimum return on investment?
• how great is the risk?
• we have to remember there is a high failure rate of ideas
• we have to avoid “drop-errors” (where good ideas are dismissed because of lack of vision)
• we have to avoid ”go-errors” (where poor ideas proceed to the next stage)
• sometimes the product concept can be tested in a verbal, symbolic or physical form with consumers and the trade
• screening is often assisted with a rating form (sometimes called an “evaluation matrix” or “rating profile”) which lists criteria in rows with a rating scale in columns
• the columns may be few (eg yes/no or yes/no/maybe) or many (eg a 10 point rating scale with defined positions for say the 1st, 5th and 10th levels)
• the rows may be few or many and might include the following criteria (note the use of functional headings)
• Top Management
• relationship to corporate mission
• leverage on objectives
• fit with strategy
• fit with business portfolio
• impact on and likely response of competitors

37
• Marketing
• clear target market opportunity?
• logical consumer positioning
• logical competitive positioning
• market growth and product life cycle rationale
• fit with existing products
• fit with sales force capability
• prospects for distribution effectiveness
• Operations
• supply of raw materials
• processing feasibility and work flow
• Finance
• clear income forecasts and rationale
• clear cost estimates and rationale
• level of profitability and probability
• level of risk
• Human Resources
• fit with organisational capability
• need for investment in selection and training
• often these rating forms can be refined to exclude non-critical criteria and to include weightings for each criterion so that a meaningful overall score can be determined
• Class Exercise 11 (say 20 mins)
• Select an hypothetical tourism product.
• Divide the class into functional groups.
• Have each group quickly

38
• devise 4 criteria for their function
• allocate weights to each criterion adding up to 1.00
• set up a 5 column rating scale with 1 = bad and 5 = excellent
• multiply the rating by the weight to equal a score for each criterion and a total score
• Finally, summarise the group results, allocating a weighting for each function and determine an overall score.
• Design Brief
• Used when significant development is anticipated.
• Discussed above
• Preliminary Business Analysis
• marketing assessment
• design assessment
• comparison with design brief
• may include matrix analysis (including scoring and rating).
• product life cycle assumptions
• size, structure and behaviour of the target market
• intended consumer and competitive positioning
• sales, market share and profit goals sought
• intended price, distribution strategy and marketing budget
• long-run profit goals and probable marketing mix strategy over time
• financial assessment
• evaluate income, cost and funds projections
• evaluate financial returns and risks
• Class Exercise 12 (15 mins)
39
Discuss the role, purpose and content of Handout 2 “Preliminary Development Proposal”
• human resource assessment
• Development
• for new products this stage covers project planning, detailed drawing, materials selection, materials specification and costing, process technology, methods engineering, tooling, prototype development and testing, competitive comparisons, definition of resource requirements and final costing
• for a building or property development projects this stage includes developed designs (from the sketch designs in response to the design brief), project planning, detailed drawing, materials selection, materials specification and costing, engineering and construction technology, methods engineering, model development and concept testing, competitive comparisons, definition of resource requirements and final costing
• Final Business Evaluation
• this follows the approach set for the preliminary business evaluation
• a final “evaluation matrix” or “rating profile” (see above) might also be completed at this stage, which includes scoring and weighting
• this stage assumes all the justification, quotations, agreements, costing, pricing etc has been put in place to such an extent that firm contracts and other arrangements will follow smoothly after approval to the final feasibility study is given, without any surprises.
• after approval all planning assumptions, income, costs, funds and time estimates etc should be locked into business plans, marketing plans and most importantly, budgets. The same figures used for approval must be used for performance evaluation. A common error is for projects to be approved with one set of figures and assumptions and different ones are used later on for planning and budgeting.
• Market Testing
• in some cases it is possible to test a restricted version of the product with the market before sales release involving exposure of the product for consumer and/or trade research eg
• with the first production run of a new product
• with a mocked-up motel unit off-site for an accommodation project before construction on site commences

40
• in other cases a test market sales release might be held to minimise risk, to resolve unanswered questions or perhaps just to fine-tune the major sales release eg
• a test market product release in one area or capital city
• release of Stage 1 of a development project, preferably with a contingency plan if things don’t go according to plan
• Commercialisation
• the last stage but still plenty of room for failure to occur through unforeseen events and consumer and trade responses below expectations
• the implementation plan for marketing and operations must be thorough
• the monitoring plan must detect variations to expectations in key pre-determined areas eg competitive responses
• the organisation must be prepared to cut its losses in the event of poor performance. There is an old saying the first loss is the cheapest loss. If you persevere in hope in spite of commercial realities the losses are usually far greater than those you would have had if you had the courage to get out when the first signs of failure started to show.
• often it is wise to have a contingency plan eg
• alternative use of all or part of the facilities
• a quick sale rather than a “distressed” sale
• sale of part of the project to a joint-venture partner who has strengths to overcome the imminent problems
• suspend and shelve the project until more favourable conditions occur
• if the product or project is going to plan then it has to be managed through the product life cycle stages remembering that
• in the introduction stage
• profits may be low or negative
• competitors few
• promotion should focus on developing market awareness
• in the growth stage

41
• sales will start to climb
• new competitors will probably enter
• prices should probably be maintained
• profit margins will peak
• growth should be sustained by manipulating marketing mix
• in the maturity stage
• this presents the greatest challenge for marketing
• marketing have to be prepared to
• pursue market modification (find new buyers for the product)
• pursue product modification (change product characteristics such as quality, features and style to attract new users and/or more usage)
• pursue marketing mix modification (altering one or more elements of the marketing mix)
• in the decline stage
• identify weak products
• determine marketing strategies ( abandon part or all of the market or devise continuation, concentration or harvesting strategies)
• drop or sell the product
Learning Outcome 4
Formulate basic project management techniques.
Assessment Criteria
4.1 Prepare a project plan for planning, monitoring and co-ordinating new products
during the commercialisation stage, and the production of associated brochures and promotional materials, including the following factors:
• specifications (planning for quality including attention to specifications, materials, performance standards and quality control procedures);

42
• schedule (planning for time using simple gantt and pert charts);
• budget (planning for costs and incomes);
• responsibilities (show how time, cost and quality parameters have been assigned within the organisation or contracted out);
• group dynamics skills.
4.2 Develop appropriate strategies to control and monitor project performance, give consideration to the following factors:
• schedule control;
• control point identification charts;
• project control charts;
• milestone charts;
• budget control charts;
• inspection;
• interim progress reviews;
• testing and auditing;
• taking corrective action;
• group dynamics skills;
• positive and negative feedback.
4.3 Develop appropriate negotiation strategies, taking into account the following factors:
• guidelines for effective negotiations;
• strategies for resolving differences.
4.4 Evaluate project performance.
Content
4.1 Prepare a project plan for commercialisation
• Tourism case study
• this section will be presented by referring to a tourism case study called “Estcourt House” (see Handout 3).

43
• the case study material includes a full financial feasibility analysis covering both the construction and operating stages of the project
• therefore two project plans may be devised and discussed (assuming that the developer is a different party to the operator)
• alternatively an overall plan may be developed for the whole project covering both stages assuming that the developer is also the operator
• specifications for quality
• materials
• after the design brief is prepared the designer will select materials that best suit the functional and aesthetic requirements of the brief.
• the designer will be familiar with the technical properties of these materials and, after the design is approved and detailed workings drawings prepared, will prepare detailed specifications regarding type, brand, dimensions, methods etc
• these detailed drawings and specifications describe in intricate detail the work to be done and will become embodied in contract documentation and/or other internal agreements.
• Class Exercise 13 (say 10 mins)
Who would be involved in the selection of materials and finishes in the Estcourt House case study? At what stage?
• performance standards
• the essential criteria or performance standards concern time, cost and quality
• usually penalty clauses apply to time delays and so it is important that all activities have estimated times and these are shown clearly in a project plan
• the project plan should also detail how the costs will be incurred for each activity and stage referred to in the project plan
• detailed quality standards will be prescribed in the drawings and specifications
• the designer is usually responsible to manage the phase known as “contract supervision”. This involves inspection of all work and to ensure that it accords with the contract documentation performance standards as to time, cost and quality.

44
• the designer is in a powerful position in that work must be approved before payment
• most contracts provide for conciliation and arbitration to deal with disputes about the interpretation of the detailed drawings, specifications and other contract documentation. Most disputes are settled reasonably quickly and very often the claims by those responsible for manufacture or construction are settled through approved variation documents.
• Class Exercise 14 (say 10 mins)
What cost standards have been built into the feasibility model for Estcourt House?
• quality control procedures
• materials are inspected as to quality at the source and on delivery and any materials not up to pre-determined standards should be returned and not accepted for payment
• labour processes should be continually monitored to ensure compliance with contract performance standards. This will often involve methods analysis and training as well as close supervision by experienced personnel. Regular work audits are essential.
• in-house or independent testing of materials and work-in-progress should be encouraged
• Class Exercise 15 (say 10 mins)
How would an architect monitor work quality during construction of the Estcourt House project?
• schedules
• GANTT charts
• a chart which lists activities in rows and portrays a time-line for each activity across columns representing time-periods
• a simple way of communicating the magnitude and sequence of work
• does not easily allow for optimisation of time and does not distinguish between critical and non-critical activities
• a critical activity is one which, if delayed, will directly add to the overall project time

45
• a non-critical activity is on e which, if delayed, will not add to the overall project time. This is because the activity which follows has a later start date than the completion date for the preceding activity ie there is a slack period between the completion date of one and the start date of the other
• Class Exercise 16 (say 30 mins)
• Distribute Handout 4 “Project Review”
• Discuss this handout in the context of product development for a country town.
• Discuss the usefulness of spread-sheets for simple Gantt charts.
• PERT
• A planning (P) evaluation (E) and review (R) technique (T) to help determine priorities within a programme and between programmes
• PERT analysis grew out of simple Gantt charting which showed
lines for each activity without connections. Instead PERT shows a plan systematically as a network of activity lines or steps to be carried out simultaneously to achieve programme objectives for time, cost and quality.
• It identifies the “critical path” which is the longest time path through the network and the most critical chain of activities to be managed. Other activities will therefore have some time slack if they are not included on the critical path
• The network defines events, activities, constraints and resource use
• Where the activities are familiar, time estimations are more certain and pre-determined standards based on prior experience can be used (eg building and construction)
• The technique for time estimation in conditions of uncertainty where pre-determined time standards for activities are not available is worth studying
• Optimistic (say 5 months)
• Realistic, most likely (say 7 months)
• Pessimistic (say 15 months)
46
• Allocate probability weights to each eg say a factor of 1 to optimistic and pessimistic and 4 to realistic (which is the same as saying .16 .16 and .66 respectively)
• The expected average (mean) time is 5 + (4 x 7) + 15 which is 48 months divided by 6 ( weights 1 + 4 + 1) equals 8 months
• The level of uncertainty is measured by standard deviation
• The maximum range of the probability distribution lies between the optimistic and pessimistic estimates which is 10 months.
• Divide this by the sum of the weights, 10 divided by 6 equals 1.67 months
• Compare this with the mean to measure the level of uncertainty, 1.67 compared to 8. This is useful for comparing with expected or tolerable levels of uncertainty. The higher the level of uncertainty the greater the need for management.
• The latest date for completion for the whole project or programme is determined and then, by working backwards along the critical path using the activity times (see above) the latest completion dates are determined for each event. Critical events have no slack because there expected and latest completion dates are the same. Other non-critical activities will have slack (that is, their expected date occurs before the latest completion date) and will need less management attention.
• PERT budgeted and actual costs are calculated for PERT activities by allocating appropriate cost codes
• Much of the value of PERT is in the initial planning stages and so it represents a valuable planning tool even without its significant control benefits
• budgets
• must be prepared for income and expenses , cash inflow and cash outflow and for funds required
• the budgets must match the time plan so that the exact monthly and/or yearly profit, cash and funds flows can be determined
• Class Exercise 17 (say 20 mins)

47
Discuss the budgeting process of linked financial statements used in the Estcourt House Case Study
• responsibilities
• each activity should be resourced in financial, physical and human resource terms
• action responsibilities must be clearly shown as to what, who and by when
• group dynamics skills
• project teams are a common occurrence in most product development projects
• these teams are multi-disciplinary and each team member is expected to have an appreciation of other team roles. In this sense the best teams are composed of “generalists” who are also specialists in their own area.
• nowadays team leaders and key members are expected to be well-versed in management, particularly in marketing, finance and human relations
• interpersonal communication, motivation and leadership skills are essential
• production of brochures and promotional materials
• a development project doesn’t stop with the physical aspects of manufacture or construction. Other matters of implementation require attention, particularly those of a business planning and marketing nature
• with the Estcourt House Case Study (Handout 3) provision was made for $500,000 of marketing expenditure including pre-opening costs (Sheet 10). Whilst this has not been detailed it would include the following items
• advertising and public relations
• opening functions
• brochures
• promotional materials and videos
• travelling costs to key buyers
• promotional discounts, prizes and give-aways
48
• sales incentives
• the marketing plan should include a budget a time-chart for all of these activities
• the planning and production of communication materials, including brochures, floor plans, promotional materials, price lists, direct mail etc is a large task and involves at least the following steps
• establishment of communication objectives
• preparing a communication brief which reflects the consumer and competitive content of the design brief
• development of appropriate strategies (using the problem-solving process)
• development of detailed content and media selection
• testing and approval
• Class Exercise 18 (say 15 mins)
Discuss what promotional strategy might be followed to promote the Estcourt House development as a conference centre, showing a realistic time-frame for these activities.
4.2 Strategies to control and monitor project performance
• schedule control and project control charts
• this simply refers to controlling the time aspects of a project with clear presentation of the comparison between expected and actual outcomes
• schedule control of multiple projects should be maintained
• the aim is to maximise end-user satisfaction and organisational performance against pre-determined objectives
• control points
• the schedules should show when major stages have been started and completed (eg functional stages)
• these stages can be defined around key events and/or functional stages
• charts showing control points may be referred to as control point identification charts or milestone charts
• budget control charts
49
• this kind of chart shows an ascending line for actual project expenditure and a corresponding line for budgeted expenditure
• the object is to show over-runs and under-runs which should be investigated
• evaluation procedures
• inspection is a most reliable appraisal method for trained personnel. In some cases it can save time compared to more elaborate information systems, whilst the opposite could be true in situations of great complexity and/or distance.
• interim progress reviews involve responsible personnel analysing and reporting on key variations to budgeted time, cost and quality.
• testing and auditing by in-house or independent personnel is advisable in some situations, particularly on critical elements and for finance approval
• evaluation also involves
• taking corrective action
• group dynamics skills
• providing positive and negative feedback
4.3 Negotiation Strategies
• guidelines for effective negotiations
• apply the problem-solving process to “the issue”
• define optimum and minimum positions
• analyse the other parties position in terms of your perception as to what their needs are and what problem-solving process they are following
• search for common-ground
• strategies for resolving differences
• this is sometimes referred to as “conflict resolution”
• there are three strategies for conflict resolution
• avoidance......due to lack of skill, emotional trauma or lack of responsibility. They usually result in low satisfaction and performance.

50
• defusion......this approach tries to delay to allow a cooling-off period. Delaying tactics include post-ponement, dealing with minor issues first (or only), avoidance of clarification. This strategy too usually results in sub-standard satisfaction and performance.
• confrontation
• power strategies..... use of physical force, money and punishment. The resulting “win-lose” outcome is often sub-optimal
• negotiation strategies....the quest for compromise and a “win-win” for all parties.
• some useful negotiating skills are
• Diagnosis
• this involves determining the nature of the conflict
• probe whether it is a real or value conflict. Are the issues real and tangible or are they based on matters of ideology and values.
• Initiation
• avoid attacking and demeaning
• confront the issue not the person (ie be objective rather than subjective). State the impact in tangible terms that the conflict is having on you. Say “I have a problem...... when this occurs....this happens”
• Listening
• understand how the other party perceives the situation
• look for “hidden agendas”
• listen to and understand the others point of view
• avoid argument-provoking replies, defensive behaviour and threats etc
• use reflective, active listening techniques....paraphrase, clarify.....lower your defences to encourage a similar response
• Problem-solving

51
• utilise the problem-solving process to bring about consensus
• clarify the problem. Define the tangible issues and where each party stands on the issues.
• brainstorm and evaluate alternatives
• decide together
• plan the implementation and evaluation process
4.4 Evaluate project performance
• measure variations in time, cost and quality
• assess financial reports
• provide feed-back to responsible parties
• review and problem-solve
• take corrective action
Assignment 1
Regional Portfolio Analysis 1500 words
Assignment 2
Gantt Chart - Estcourt House Case Study (see Handout 3)
52
ASSIGNMENT 1
REGIONAL PORTFOLIO ANALYSIS
REQUIRED
ou are a tourism consultant asked to make recommendations about tourism product for a particular region. Your report should focus on an analysis of key towns and their immediate environs, the key attractions within the towns’ catchment areas and culminating in the regional analysis.
Complete a report of not greater than 1500 words showing the activities involved in each stage of the analysis together with appropriate amplification for key activities.
OUTLINE POINTS FOR SOLUTION
The process for regional portfolio analysis involves micro-analysis at the town and sub-regional level culminating in macro-analysis at the regional level as follows:-
Town centre and environs analysis
Together with reliable town sources and using available statistics and/or estimates establish a clear picture of
• visitor arrival trends and prospects and visitor flows by traffic route
• visitor nodes and visitor centre patronage
• visitation levels and/or ranking for major attractions
• key concerns and proposals for strengthening the attraction asset base
• listing and ranking of other key assets under product group headings ( activities, accommodation, access and ancillary services)
• existing vision, desired future town character, tourism identity and image
• proposed and mooted development proposals under each product group heading and a preliminary visit to and assessment of key development sites
Key attractions analysis
This will include attractions within the town and within the town's "catchment area". Each key attraction will be visited and an assessment made of
• visitation characteristics (demographics, origin, destination, stop-overs, attitudes to information and experiences and suggestions for improvements).
• product, promotion and pricing strategies for key target markets

53
• carrying capacity and environmental management key issues
• development potential and indicative costing for future development of the attraction
• spin-off development potential for other product groups (including sizing and indicative costing)
• operator assessment of key concerns (including infrastructure, industry organisation and promotion, net-working, town and sub-regional identity and branding and the environment)
• life cycle analysis and strategies for accelerating market penetration
Regional Portfolio Analysis
This analysis will relate the town and sub-region analysis referred to above with key points from the market analysis and will include the following elements
• integrated SWOT analysis summary of key assets by product group
• sub-region identity and branding
• sub-region comparison and analysis of tourism hubs/centres, the quality of visitor nodes within each centre and the visitor flows and transport links between centres
• listing and concept screening of major development proposals already mooted (for each product group)
• analysis of product positioning and gaps (before and after mooted proposals)
• creative input to fill remaining gaps and strengthen existing positioning
• summary of infrastructure support requirements
• final portfolio listing including impacts on visitor arrivals, employment and the environment
• summary investment attraction strategy including funding requirements
54
ASSIGNMENT 2
ESTCOURT HOUSE CASE STUDY ANALYSIS
Refer to the case study notes in Handout 3, particularly the work sheets for the financial feasibility model.
1. Prepare a simple list of implementation activities under the following headings showing estimated times in weeks for each activity. This is purely hypothetical and real-life precision is not required.
• purchase and funding arrangements
• project team selection
• project planning and budgeting
• professional services (incl. developed design, detailed drawings, contract documentation, supervision)
• siteworks
• building construction
• fit-out
• launching the new development
• design and introduction of promotional materials
• ongoing marketing planning
2. Develop a simple GANTT Chart (similar to Handout 4 “Project Review)
3. Describe how this chart might be used in conjunction with ongoing financial reporting to monitor the development.

55
EXAMINATION
You have just been appointed as a Tourism Development Officer for a country town. The town is within two hours drive from a major capital city and is set in attractive rural/coastal surroundings.
There are two key attractions in the town and its immediate vicinity and there is a wide variety of other product suitable for a wide range of visitation needs.
You have been asked to make a presentation to full council in one month’s time outlining your approach to preparing a tourism development plan for the town. Council is particularly interested in the following aspects:
• A process to comprehensively review the current situation;
• An approach to review the current level of marketing information and to make recommendations about information gaps;
• Processes to develop creative new development concepts;
• Possible feasibility analysis procedures;
• A plan of attack showing how all these processes might be integrated and managed.
Prepare a report outline suitable for distribution to Council members and for the development of overhead transparencies for your presentation.
Your report may be in point form.
56
HANDOUT 1
TREKABOUT TOURS CASE ANALYSIS
The case study details for “Trekabout Tours” can be obtained from the following references:-
• Peter Graham, 1990, Insights into Australian Marketing, Prentice Hall, P 128
• Peter Graham Ed, 1988, Readings and Cases in Marketing, Prentice Hall, P 148 & 220
Each college will need to abide by copyright regulations for copying. The following case solution has been based on these sources.
1. Product Analysis
• From the customer survey four specific and useable product strengths were identified:
⇒ availability, quality and preparation of good, wholesome fresh food;
⇒ competence and experience of the principles in organising trips and handling the outback environment;
⇒ flexibility provided and high level of personal service;
⇒ high rating for “value for money”.
• Trekabout appears also to be the only company offering extended 4WD camping safaris directly out of Brisbane or the Gold Coast.
• These product strengths must be used for product differentiation purposes vis-a-vis the competition;
⇒ the market seems to have a clear idea of what an outback camping safari experience in a 4WD is going to be like (see para 2) and there is no need to try to alter perceptions;
⇒ there may be a need to build on product strengths and engage in more differentiation in advertising and promotion in order to develop a competitive edge.
• Product differentiation provides a basis on which a supplier can appeal to selective buying motives. The task is to define product/market scope ie. to competitively position the differentiated (unique) product in the right target market having in mind consumer needs, attitudes and decision-making behaviour for that market.
2. Consumer Analysis
Refer to the consumer decision-making process on page 7 of the case study. Does the consumer need help in making decisions (ie looking at needs, alternatives, etc.) about:
⇒ what kind of holiday?
⇒ what kind of outback holiday?
⇒ which operator?
In other words, to what extent are consumers aware, interested and desirous of outback safari holidays in general (this relates to primary demand, sometimes

57
called general demand) or aware, interested and favourably disposed towards a particular operator (this relates to secondary demand, sometimes called selective demand).
• Long-trip customers: 30 out of 37 long-trip customers surveyed claim to have made the decision or recognised the need without specific product promotion/input from operators. There seems to be no need to spend time/money on getting people to decide on an outback holiday or establishing in the potential consumer’s mind recognition of the outback Australian product. Consumers seem to be well informed on these matters and therefore the task is not to build awareness/desire for this kind of holiday. The main area for attention is “which operator?” or “why Trekabout?” The task therefore is to develop awareness and preference for Trekabout vis-a-vis the competition on the basis of Trekabout being a good (and hopefully the best) answer to their needs.
• Short-trip customers: The same cannot be said for these customers where only 29% planned such a trip without identifiable stimulus. In other words, most of these consumers need a “primary demand” stimulus ie to build awareness and interest in the outback experience, as well as a “secondary demand” stimulus ie to build awareness and preference for Trekabout on the basis of their product strengths.
3. Segmentation Analysis
Trekabout obviously can’t target the whole market with their limited resources. Segmentation aims at defining product/market scope ie to identify a portion of the total market that will find their product uniquely appealing. Demographic segmentation occurs to some extent:
• short-trips: 62% are women and children;
• long-trips: 56% are over 50 years. Obviously, it seems worth attempting to reach the over 50s market segment with some specific action.
4. Pricing Analysis
The high 4.5 rating for long-trip value for money suggests that with the right promotion the market would be prepared to pay a higher price for the product. Trekabout is in the lower end of the industry pricing structure and this helps support our conclusion that an increase is supportable.
5. Additional Information Requirements
So far we have tried to look at what is happening now ie a situation analysis based on the customer survey. This would not be our only source of information. We could do more consumer research, trade research and competitive marketing analysis. A good starting point is always the financial statements to try to track down an analysis of sales and the response of sales to changes in the marketing mix (price, product, promotion, etc.).
6. Marketing Plan & Budget In the end a marketing plan must be devised and which will be finally expressed in the form of a budget. The key components of the budget will be:
• Sales Revenue?
⇒ what target market(s)? Volume, price, etc.
⇒ what product development changes?
58
⇒ what sales targets by area, type, responsibility, etc.
• Costs?
⇒ budget for advertising, promotion, etc.
⇒ market research costs?
• Funding product development and other capital expenditure to launch the plan and the extra working capital required.
• Anticipated R.O.I. We must always relate the marketing plan to the budget. The plan will focus on objectives, strategy, the 4 P’s, and organisational responsibility for implementation. It will contain the analysis of needs and the major findings of the problem-solving approach followed. It will also contain an executive summary that strikes at the heart of the situation and leaves top management with a feeling of “Well that’s spot on … let’s go!”

59
HANDOUT 2
PRELIMINARY DEVELOPMENT PROPOSAL
1. PRODUCT GROUP:
2. PROJECT NAME/DESCRIPTION:
3. PRODUCT MANAGERS’ DESIGN BRIEF AS ACCEPTED BY PRODUCT DESIGNER: (If necessary attach details)
4. WAS THIS PROJECT IN THE BUSINESS PLAN? If so, page no.
5. HAS THE PRODUCT DESIGNER DEFINED THE PRIME FUNCTIONS?
6. HAS THE PRODUCT DESIGNER SURVEYED COMPETITOR MODELS?
7. ESTIMATED TIMETABLE:
Event
Completion Date
Human resource
requirement to
complete event
Elapsed time
between events
Preliminary Approval (for prototype
commencement)
Prototype acceptance
Final Approval (to start detailed
drawings & tooling)
Units in warehouse
Desired sales release
8. ARE RESOURCES ADEQUATE TO MEET DESIRED SALES RELEASE DATE?
9. PRELIMINARY UNIT COST ESTIMATES: Factory Variable $ Other Variable $ Total Variable $ Factory Fixed $ Other Fixed $ Total Fixed $ Total Factory $ Total Other $ Total Cost $
10. PRELIMINARY ESTIMATES - FUNDS EXPENDED: Development $…. (…. Person hours) Tooling $….. Other $….. Total $…..
11. PRELIMINARY FUND ESTIMATES: Working Funds (Stock + Debtors) $….. Fixed Assets $….. Total Funds $…..
12. PRELIMINARY UNIT PROFIT ESTIMATES Average Selling Price $….. Contribution $….. (…..% to V.C.) Net Profit $….. (………% to average selling price)
13. PRELIMINARY SALES ESTIMATES Year 1 Year 2 Year 3 Quantity Value
14. R.O.I. -
� Contribution to Working Funds ……………………………………… %
� Contribution To Total Funds………………………………………….. %
� Year 1 Net Profit to Total Funds ………………………………………%
� Pay Back No. of Months………………
15. PRODUCT MANAGER PRIORITY RATING: (ie state which one of your current development projects should immediately precede this one)

60
APPROVAL DATE
1. Product Designer
2. Product Manager
3. Profit Planning Manager
4. Engineering Manager

61
HANDOUT 3
ESTCOURT HOUSE CASE STUDY
Estcourt House is a glorious, century-old mansion, well known as one of Adelaide, South Australia’s most prominent, coastal landmarks. It is located only12 kilometres from the centre of Adelaide and is situated on 2.8 hectares of absolute beach front. The site provides superb full circle views across the sailing waters of St Vincent’s Gulf, sweeping back over the prestige lake-side suburb of West Lakes to the city of Adelaide with its colourful hills in the background. Developing the Estcourt House site requires tapping the tourism, business and leisure markets as well as the residential market. The design concept includes cluster groupings of 120 luxury hotel suites looking out across the sea front. Behind this, ample provision for 50 distinctive self-catering condominiums has been made. It is proposed that these condominiums be let for residential purposes until the main tourist component of the development is established as being viable. After this, it is proposed that the condominiums be converted to tourism use. The condominiums encircle a swimming pool, tennis courts and informal barbecue area. There is considerable heritage appeal in the existing Estcourt House building which would become the focal point for a coastal leisure retreat of unquestionable style and quality. The original two-storey seventeen room mansion would be restored to become the hub and main feature of the whole development. The magnificent entrance foyer and staircase will be restored to entice guests to a first floor restaurant with spectacular full circle views. It will also lend itself perfectly to the growing corporate and business meetings market. At the prestige end of this market exclusive boardroom function and convention facilities have been provided. The following summary comments can be made:
• A total investment of $39 million will be required prior to occupation;
• Occupancy rates for the hotel suites would commence at 55% and increase to 75% over the first five years;
• Room rates would commence at $160 per night for the suites;
• Weekly rentals for the condominiums would be $210 per week for the small units and $280 per week for the large units;
• Net profit before tax is estimated to be $908,000 in the first year, gradually increasing to $3.9 million in the third year, $6 million in the fifth year and $9.3 million in the tenth year;
• On the basis of this profitability, and with provision for capital gain over the ten years, an internal rate of return of 21% is anticipated.
A financial feasibility model has been prepared for the project for both the construction and operating stages.
This can be summarised as follows: SHEET 1 - GENERAL VARIABLES FOR FEASIBILITY MODEL
• 120 hotel suites, average floor area 40 sq. mt., $160 per night
• 50 townhouses/condominiums, average floor area 130 sq.mt
• variables for escalation, capitalisation, income tax, interest rate, depreciation, long term debt ratio, working capital requirement, land cost, rates and taxes, occupancy levels, developer’s margin and operating cost percentages.
SHEET 2 - DEVELOPMENT COST VARIABLES FOR FEASIBILITY MODEL
• Various activities are listed for siteworks and services for a total $5,065,000;
• $345,000 of this total has been apportioned to the Estcourt House mansion and $4,720,000 has been apportioned to other components;
• $2,360,000 has been apportioned to hotel suites and condominiums;
• The average cost per hotel suite is calculated as $39,337 and for condos, $25,443;
• The proportion of siteworks and services attributable to the Estcourt House mansion is calculated as $344,558;

62
• These totals have been summarised on Sheet 4. SHEET 3 - CONSTRUCTION COST FOR FEASIBILITY MODEL
• Details are provided for building costs, recreation facilities, sundry building costs, fit-out costs, escalation and consulting fees;
• These totals have been summarised on Sheet 4. SHEET 4 - DEVELOPMENT SUMMARY
• This shows how the total investment of $39,102,000 has been calculated;
• $26,558,000 has been provided for construction costs and additional amounts have been included for land cost, pre-opening marketing costs, interest during the development stage, a developer’s margin and sales commission for the completed development;
• These costings assume that the developer and the operator are different parties;
• The Estcourt House mansion component of this total investment has been estimated to be $2,506,913;
• The hotel suites are estimated to be worth $213,498 each and the condos on average $251,302 each.
SHEET 5 - ESCALATION SCHEDULE
• This worksheet simply allows for escalation of the estimated construction cost over the planning and construction period;
• Planning period will commence on January 1995 and be completed in June 1996 thus providing 18 months for detailed drawings, planning approval, environmental impact assessments, contract documentation and detailed business and marketing plans;
• The construction period is 15 months from July 1996 to October 1997. SHEET 6 - DEVELOPMENT CASH FLOW
• This worksheet establishes the cash outflow items for the developer, the bridging loan finance requirements month by month and the resulting interest calculations.
SHEET 7 - PROFIT AND LOSS STATEMENT - ACCOMMODATION REVENUE
• This worksheet has been prepared on the basis of the assumptions made on Sheet 1 and shows accommodation revenue rising from $4,322,000 in Year 1 to $8,969,000 in Year 10;
• Calculations for capacity, occupancy, unit rates and total revenue by type of product are shown
SHEET 8 - PROFIT AND LOSS STATEMENT SUMMARY
• This incorporates accommodation revenue from Sheet 7 and adds revenue for food, beverage and facilities, etc.;
• Costs for food and beverage, etc., are separately shown in order to calculate a gross profit;
• Various overhead expenses involved in operating the complex are also included;
• The net profit before tax for each year is also shown. SHEET 9 - TAX CALCULATIONS
• This is a worksheet showing how the tax has been calculated;
• Since this feasibility model is a sensitivity model the tax will automatically be recalculated with changes in the variables on the basis of various assumptions about tax rates and the impact of losses carried forward.
SHEET 10 - CASH FLOW ASSUMPTIONS
• This worksheet picks up the total investment referred to earlier of $39,352,000 and makes various assumptions about depreciation rates on the various types of capital investment;
• It also includes various assumptions about debt financing, inflation escalation, occupancy and capitalisation rate;

63
• The capitalisation rate is an assumed return on investment that an investor would be seeking on the assumption that the completed development was sold at the end of Year 10.
SHEET 11 - OPERATING CASH FLOW
• This shows the various items of cash inflow and outflow;
• It allows for tax, interest and repayments of loans;
• Notice that in the tenth year a sum of $75,445,000 has been allowed as a cash inflow item. This assumes that the whole complex is sold (or valued) on the basis of the 10% capitalisation rate earlier. It has been calculated in reference to the operating surplus (after tax) for the tenth year which is shown as 7545 which means $7,545,000. Thus, if the complex were purchased for $75,445,000 and the net profit after tax were sustained, then the investor would earn 10% after tax on his investment.
• The investor’s internal rate of return of 21% is a discounted cash flow rate having in mind the stream of earnings for Years 1 to 10 inclusive compared with the initial capital. This series of figures is shown on the second last line called “Investor’s Cash Flow”. In effect this is saying that when we allow for the time value of money, an investor investing $19,676,000 capital at the beginning of the project would earn, on average, 21% per annum on his investment. We have assumed here that this would be a capital gain to the operator which should be included.
SHEET 12 - CASH FLOW SUMMARY
• This worksheet simply summarises Sheet 11 and shows the main line items involved; SHEET 13 - BALANCE SHEET
• This shows how the figures for profit and loss and cash flow translate into traditional balance sheet format.
SHEET 14 - RATIOS
• This worksheet calculates some financial ratios on the basis of the figures provided in the balance sheet (Sheet 13).
SHEET 15 - FUNDS STATEMENT
• This worksheet shows the sources and uses of funds over the ten year period;
• It has been calculated by referring to the changes in balance sheet items from one year to the next.


![To Communicate Co-Creation or Not? Examining the Effects on … · innovation and new product development . 2.5 Co-Creation in NPD Stages . According to Hoyer et al. [13], co-creation](https://static.fdocuments.us/doc/165x107/5f0ff4a07e708231d446b872/to-communicate-co-creation-or-not-examining-the-effects-on-innovation-and-new-product.jpg)