Tough love: An In Depth Look at Retail Pricing Practices
33
i Tough Love: An In Depth Look at Retail Pricing Practices Benchmark 2013 Nikki Baird and Paula Rosenblum, Managing Partners April 2013 Sponsored by:
-
Upload
ikusmer-observatorio-del-comercio -
Category
Business
-
view
229 -
download
0
Transcript of Tough love: An In Depth Look at Retail Pricing Practices

i
Tough Love: An In Depth Look at Retail Pricing Practices
Benchmark 2013
Nikki Baird and Paula Rosenblum, Managing Partners
April 2013
Sponsored by:

i
Executive Summary
Retailers continue to escalate the number of price changes they send to stores and other channels. Their field human resource infrastructure groans under the sheer weight of the work effort involved in keeping signage and tags up to date, but pressured by perceived consumer price sensitivity and increased competitive pressures, these price changes continue.
This escalation continues despite a dearth of information about the potential impact of changes to price and even an analysis of the actual impact of tactical price changes. We found this stunning.
Key Findings
• While a majority of retailers continue to increase the number price changes they send to stores and other channels, those who underperform in year over year price changes are leading the charge, with fully 90% reporting at least some increase over the past three years. Sadly, only 15% report aggregate gross margin improvements for the critical holiday season.
• The business challenges driving these price changes come from customers, competitors and shareholders. Fifty-seven percent of respondents report increased consumer price sensitivity as a top-three business challenge, 41% report increased pricing aggressiveness from competitors, and 40% report the need to get a better return on inventory investment through pricing as top issues.
• It appears as though retailers have learned to live with “showrooming” and price transparency. They are less worried this year about damage to their zone pricing policies (21% this year vs. 34% last year), and a plurality (38%) believe their policies to manage prices across channels are effective. They’ve seen and survived showrooming, and with a few high profile exceptions, have opted to “be competitive” rather than price match (38% vs. 17%).
• Forty-two percent report the need for cleaner data as a top-three organizational barrier to more effective pricing practices. The same number cites resistance to change from stores as a top-three issue. A slightly smaller percentage (40%) believes they need better skill sets to improve execution. This is certainly credible, as a plurality report they can neither predict the impact of price changes they make, nor truly analyze the effectiveness of those price changes after the fact.
• The top technologies currently being evaluated include markdown forecasting and planning (24%), promotion optimization (23%), regular price optimization (20%), inventory management/availability as a price driver (23%), and price intelligence (18%). A significant number are exploring or budgeting for these same technologies.
BOOTstrap Recommendations
We recognize that we are unlikely to stop the seemingly endless barrage of promotional activity retailers engage in, but we strongly recommend improving measurement tools, both before and after the fact. That measurement should go beyond just the actual aggregate gross margin improvement or sales lift associated with price tweaking, but also include the cost to store operations and other personnel to execute those price changes. As in prior years, we hope to see retailers return to what we’ve called the “virtuous pricing cycle, “Plan-Execute-Measure.” This seems overtly simplistic, yet it’s what the data is calling for.

ii
Table of Contents Executive Summary ........................................................................................................................... i Research Overview ......................................................................................................................... 1
Strategy vs. Tactics, and Plans vs. Execution ............................................................................. 1 Retail Winners: Why Performance Matters .................................................................................. 2
We’re Making Good Time, but We Might Just be Lost ............................................................. 2 Methodology................................................................................................................................. 3 Survey Respondent Characteristics ............................................................................................ 3
Business Challenges ....................................................................................................................... 5 Pressure Comes from Consumers and Shareholders ................................................................. 5 Winners Seek Brand Protection, Laggards Look Over their Shoulders ...................................... 5
Opportunities ................................................................................................................................... 8 Margins, Sales, and the Economy ............................................................................................... 8 The Margin Story ......................................................................................................................... 9 Zone Pricing and Transparency - Friends at Last? ................................................................... 10 Channel Conflict and Mobile: Reining in Showrooming ............................................................. 11 The Promotions Conundrum ...................................................................................................... 12
Organizational Inhibitors ................................................................................................................ 14 If Price is our Lever, Why Can’t We Always Execute? .............................................................. 14 How Can We Get Past these Concerns? .................................................................................. 15 Operational Challenges Are Surprising ..................................................................................... 16 Bottom Line: A Wall of Confusion .............................................................................................. 17
Technology Enablers ..................................................................................................................... 18 The Customer Data Silver Bullet................................................................................................ 18 Customer Data - A Laggards' Tale ............................................................................................ 19 Making It All Happen .................................................................................................................. 20 Technology's Performance Gap ................................................................................................ 21 A Note About Hosted Solutions ................................................................................................. 23
BOOTstrap Recommendations ..................................................................................................... 24 Resisting Discounting's Siren Call ............................................................................................. 24 Measure the Impact of Price Changes ...................................................................................... 24 Corollary: Measure the Customer Impact of Conflicting Channel Prices................................... 25 Faster and More is Not Better - Measure the Cost to Stores .................................................... 25
Appendix A: RSR’s Research Methodology .................................................................................... a Appendix B: About Our Sponsors.................................................................................................... b Appendix C: About RSR Research .................................................................................................. d

iii
Figures
Figure 1: Chasing Low Price vs. Staying the Course ...................................................................... 1
Figure 2: We’re Moving Quickly, But to What Purpose? ................................................................. 2
Figure 3: Activity Continues to Escalate .......................................................................................... 3
Figure 4: Year over Year Pricing Challenges – A Focus on Inventory Investment ......................... 5
Figure 5: Winners Look Within, Laggards Look over Their Shoulders ............................................ 6
Figure 6: Surprising Differences in Concerns by Sub-vertical ......................................................... 6
Figure 7: Back to the Future: The Margin Opportunity .................................................................... 8
Figure 8: Margin as the Winners' Story ........................................................................................... 9
Figure 9: The More We Know, the Less We Care ......................................................................... 10
Figure 10: Showrooming Ain't What It Used To Be ....................................................................... 11
Figure 11: Promotions Should Be Getting Better .......................................................................... 13
Figure 12: What’s Preventing Us from Being More Effective? ...................................................... 14
Figure 13: …And What Can We Do About It? ............................................................................... 16
Figure 14: We’re Making Good Time, but We Might Well Be Lost ................................................ 17
Figure 15: The Customer Bump .................................................................................................... 18
Figure 16: Jumping On The Customer Bandwagon ...................................................................... 19
Figure 17: Alignment: Using What You Value Most ...................................................................... 20
Figure 18: Foundations Laid .......................................................................................................... 21
Figure 19: Following Winners' Lead .............................................................................................. 22
Figure 20: Adoption Catch-Up ....................................................................................................... 22

1
Research Overview
Strategy vs. Tactics, and Plans vs. Execution Why would RSR use the term “Tough Love” as part of the title of its seventh annual Pricing Benchmark? Because the data tells us that while some retailers have succeeded at high stakes promotion wars driven by the self-fulfilling prophecy of consumer price sensitivity, others are failing – sometimes spectacularly – even as the shopper becomes more and more accustomed to ever more dramatic and frequent promotions.
And here’s the real kicker: Those who over-perform on year-over-year comparable sales are far more likely to stay the course in their pricing strategy than their competitors. Their competitors continue to up the promotions ante, yet as we’ll see, they don’t get the sales or margin kick that they crave. We’ll explain the difference between Winners, Average Performers and laggards shortly, but in the meanwhile let’s take the following data point as an example: staying the course on pricing strategy vs. becoming more promotional (Figure 1)*.
Figure 1: Chasing Low Price vs. Staying the Course
Source: RSR Research, April 2013
(*Figures do not add up to 100%)
Of course, just deciding to avoid promotions doesn’t guarantee success. At least one high profile failure has shown that simply announcing an end to promotions without adequate explanation and preparation is doomed. But that’s not a strategy failure: it’s a series of tactical miscues.
Similarly, plans to execute a “high-low” pricing strategy, hallmarked by ever-increasing price changes, create operational issues in stores and other channels and confuse and frustrate consumers.
With that as backdrop, we’ll take a look at the state of the pricing union, based on responses from more than 100 retailers around the world. Some of what we say may be hard to hear, which is why we’ve called this report “Tough Love: An In-Depth Look at Retail Pricing Practices.” For many of us, it’s time to stop competing on other companies’ turf, and focus on finding our own niche. As we said last year, “No one wins in a race to the bottom.” That’s still true.
24%
32%
40%
9%
40%
15%
We have become more promotions driven Our strategy has not changed
How has Your Pricing Strategy Changed Over the Past Three (3) Years?*
Retail Winners Average Performers Laggards
2
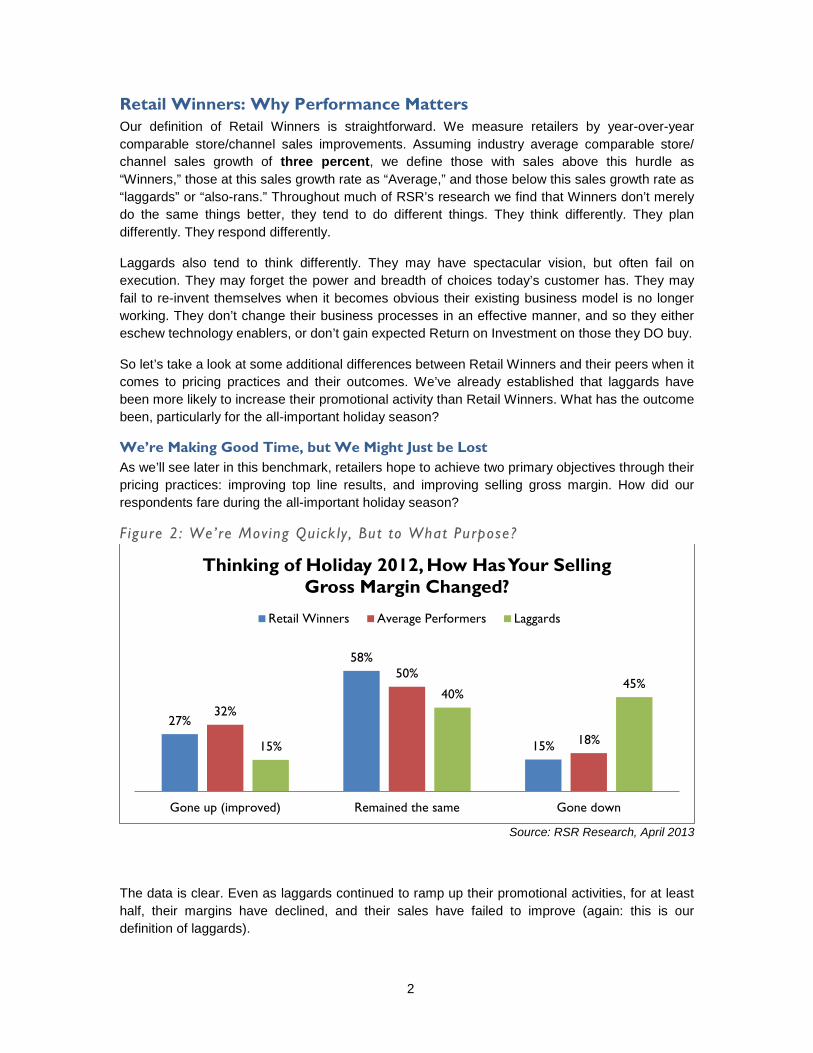
Retail Winners: Why Performance Matters Our definition of Retail Winners is straightforward. We measure retailers by year-over-year comparable store/channel sales improvements. Assuming industry average comparable store/ channel sales growth of three percent, we define those with sales above this hurdle as “Winners,” those at this sales growth rate as “Average,” and those below this sales growth rate as “laggards” or “also-rans.” Throughout much of RSR’s research we find that Winners don’t merely do the same things better, they tend to do different things. They think differently. They plan differently. They respond differently.
Laggards also tend to think differently. They may have spectacular vision, but often fail on execution. They may forget the power and breadth of choices today’s customer has. They may fail to re-invent themselves when it becomes obvious their existing business model is no longer working. They don’t change their business processes in an effective manner, and so they either eschew technology enablers, or don’t gain expected Return on Investment on those they DO buy.
So let’s take a look at some additional differences between Retail Winners and their peers when it comes to pricing practices and their outcomes. We’ve already established that laggards have been more likely to increase their promotional activity than Retail Winners. What has the outcome been, particularly for the all-important holiday season?
We’re Making Good Time, but We Might Just be Lost As we’ll see later in this benchmark, retailers hope to achieve two primary objectives through their pricing practices: improving top line results, and improving selling gross margin. How did our respondents fare during the all-important holiday season?
Figure 2: We’re Moving Quick ly , But to What Purpose?
Source: RSR Research, April 2013
The data is clear. Even as laggards continued to ramp up their promotional activities, for at least half, their margins have declined, and their sales have failed to improve (again: this is our definition of laggards).
27%
58%
15%
32%
50%
18% 15%
40% 45%
Gone up (improved) Remained the same Gone down
Thinking of Holiday 2012, How Has Your Selling Gross Margin Changed?
Retail Winners Average Performers Laggards
3
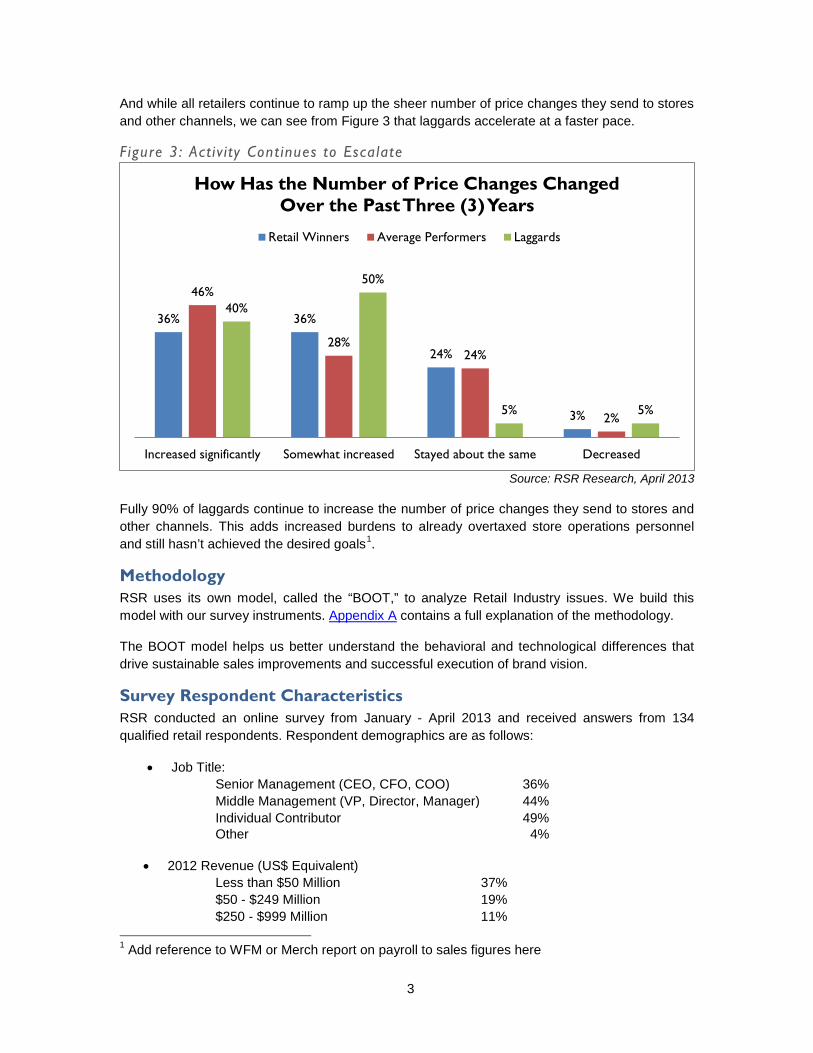
And while all retailers continue to ramp up the sheer number of price changes they send to stores and other channels, we can see from Figure 3 that laggards accelerate at a faster pace.
Figure 3: Activ i ty Cont inues to Escalate
Source: RSR Research, April 2013
Fully 90% of laggards continue to increase the number of price changes they send to stores and other channels. This adds increased burdens to already overtaxed store operations personnel and still hasn’t achieved the desired goals1.
Methodology RSR uses its own model, called the “BOOT,” to analyze Retail Industry issues. We build this model with our survey instruments. Appendix A contains a full explanation of the methodology.
The BOOT model helps us better understand the behavioral and technological differences that drive sustainable sales improvements and successful execution of brand vision.
Survey Respondent Characteristics RSR conducted an online survey from January - April 2013 and received answers from 134 qualified retail respondents. Respondent demographics are as follows:
• Job Title: Senior Management (CEO, CFO, COO) 36% Middle Management (VP, Director, Manager) 44% Individual Contributor 49% Other 4%
• 2012 Revenue (US$ Equivalent)
Less than $50 Million 37% $50 - $249 Million 19% $250 - $999 Million 11%
1 Add reference to WFM or Merch report on payroll to sales figures here
36% 36%
24%
3%
46%
28% 24%
2%
40%
50%
5% 5%
Increased significantly Somewhat increased Stayed about the same Decreased
How Has the Number of Price Changes Changed Over the Past Three (3) Years
Retail Winners Average Performers Laggards
4
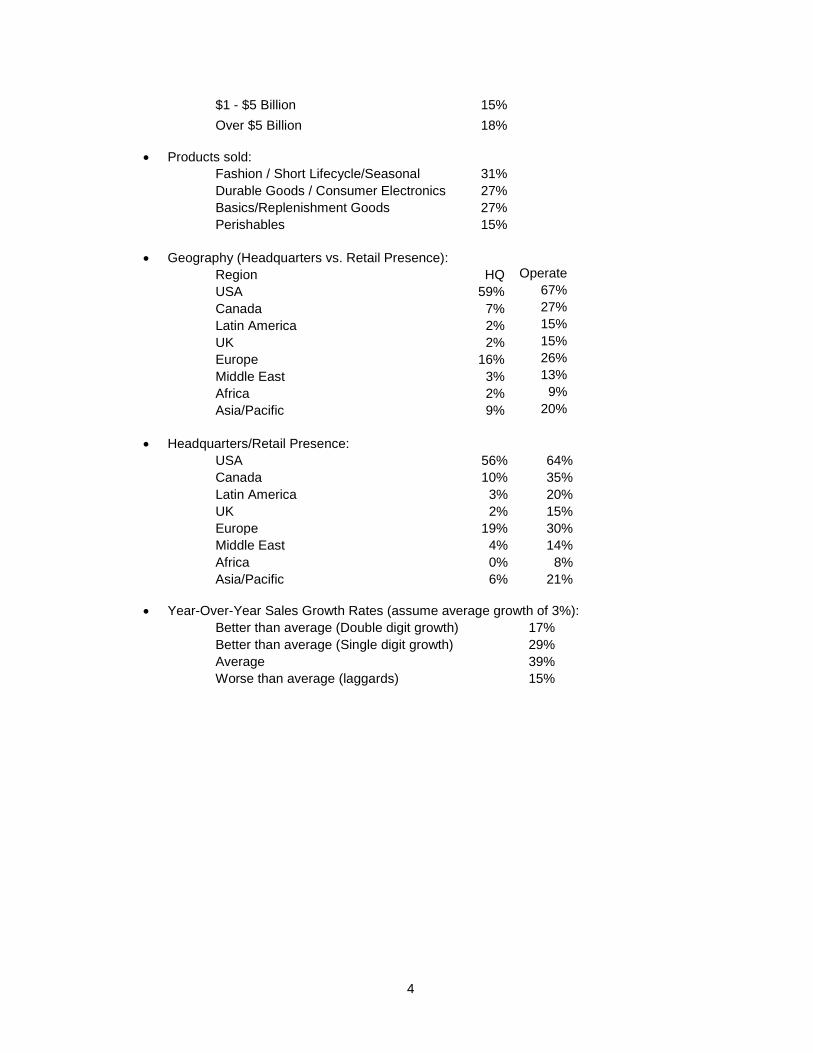
$1 - $5 Billion 15% Over $5 Billion 18%
• Products sold:
Fashion / Short Lifecycle/Seasonal 31% Durable Goods / Consumer Electronics 27% Basics/Replenishment Goods 27% Perishables 15%
• Geography (Headquarters vs. Retail Presence): Region HQ Operate USA 59% 67% Canada 7% 27% Latin America 2% 15% UK 2% 15% Europe 16% 26% Middle East 3% 13% Africa 2% 9% Asia/Pacific 9% 20%
• Headquarters/Retail Presence: USA 56% 64% Canada 10% 35% Latin America 3% 20% UK 2% 15% Europe 19% 30% Middle East 4% 14% Africa 0% 8% Asia/Pacific 6% 21%
• Year-Over-Year Sales Growth Rates (assume average growth of 3%):
Better than average (Double digit growth) 17% Better than average (Single digit growth) 29% Average 39% Worse than average (laggards) 15%

5
Business Challenges
Pressure Comes from Consumers and Shareholders Last year we expressed a certain befuddlement at retailers’ fears of consumer price sensitivity without a lot of statistical data to support it. This remains our point of view, and has been supported by numerous consumer surveys.2 Yet it remains the most frequently cited business challenge among our retail respondents (Figure 4), and retailers react accordingly.
Figure 4: Year over Year Pricing Chal lenges – A Focus on Inventory Investment
Source: RSR Research, April 2013
Having said that, we find retailers are almost equally concerned about satisfying shareholders. Adding an answer option that focused on return on inventory investment yielded strong results. Forty percent of respondents highlight this as a top-three concern, clearly trumping consumer price sensitivity, competitor pricing aggressiveness and price transparency. This concern is consistent across retailer performance levels, revenue or retail sub-vertical. Pricing is used as a lever to boost sales, gross margin and clearly, turn.
Other business challenges vary significantly depending on retailer performance, however.
Winners Seek Brand Protection, Laggards Look Over their Shoulders One key difference between Retail Winners and laggards is often found in their perceived business challenges. Winners tend to look within, while laggards tend to constantly scan the competitive landscape. The world of pricing is no exception (Figure 5). 2 Insert reference to Daymon study here
18%
9%
27%
22%
47%
42%
51%
67%
13%
21%
25%
25%
33%
34%
40%
41%
57%
Respond to segment blurring (competition comingfrom unexpected places)
Need to provide more localized pricing
Need to provide consistency in price acrosschannels
Increased promotional intensity of competitors
Increased price transparency – the impact of comparative price shopping
Need to protect our brand’s price image
Need to get better return on our inventoryinvestment through pricing
Increased pricing aggressiveness from competitors
Increased price sensitivity of consumers
Top Three (3) Strategic Pricing Business Challenges
2013 2012
N/A

6
Figure 5: Winners Look Within , Laggards Look over Their Shoulders
Source: RSR Research, April 2013
Winners are far more concerned about protecting their brands’ pricing image, whether they think of themselves as the “low-price” or “premium product” leader. Laggards, on the other hand, worry about competitor pricing aggressiveness and new competitors emerging in unexpected places. Dollar Stores’ growing investment in food and their increasingly direct competition to supermarkets and Mass Merchants clearly comes to mind in that regard. So does the Mass Merchant investment in Consumer Electronics, as both online and brick and mortar retailers challenge the category killers. Yet it’s interesting to look at the most significant differences across product sub-verticals (Figure 6).
Figure 6: Surpris ing Differences in Concerns by Sub-vert ical
Source: RSR Research, April 2013
28%
39%
56%
11%
17%
13%
39%
45%
29%
29%
6%
22%
25%
28%
47%
Respond to segment blurring (competition comingfrom unexpected places)
Increased price transparency – the impact of comparative price shopping
Increased pricing aggressiveness from competitors
Need to provide consistency in price acrosschannels
Need to protect our brand’s price image
Business Challenges - Differing by Performance
Retail Winners Average Performers Laggards
64%
44%
67%
53%
24%
56%
38% 40% 48%
24% 29%
40%
Fashion/Seasonal Basics/Replenishment Durable Goods &Consumer Electronics
Perishable goods
Top Three (3) Difference by Sub-vertical Increased price sensitivity of consumers Increased pricing aggressiveness from competitors
Need to protect our brand’s price image
7
One would think that those selling durable goods and Consumer Electronics would be most concerned about “The Amazon Effect.” Enough retailers have certainly highlighted this issue in their Quarterly financial reports. Yet, they are as concerned about consumer price sensitivity as retailers selling fashion merchandise, who are clearly threatened by fast fashion retailers like H&M, and Forever 21 on the one side, and Mass Merchants like Target on the other.
Given all this, it’s somewhat surprising that when asked about their position on commoditization and margin erosion, 55% report “We have to operate within an extremely price competitive environment” – far more than any other issue – including the impact of price transparency.
Within this context, let’s take a look at the opportunities retailers seek to leverage from their investments in price and supporting tools and processes.

8
Opportunities
Margins, Sales, and the Economy The top three opportunities for pricing to contribute to retailers' business success come from improving margins, improving top-line sales, and increasing market share in key categories. However, clearly margin beats all (Figure 7).
Figure 7: Back to the Future: The Marg in Opportunity
Source: RSR Research, April 2013
Year over year, "create more profitable promotions" has been on a relative decline as an opportunity since 2010. The opportunity peaked at 45% in 2011, down to 29% today. The conflicted relationship between retail pricing and promotions only grows more complicated - as we found in the business challenges section above, retailers feel strongly that they must operate in an extremely price sensitive environment, but even though they are sending more price changes to stores without knowing the impact of those changes, they somehow feel more and more confident about promotions overall.
The importance of a price competitive image as a pricing opportunity is also on the decline, from 41% in 2010 to 28% today. However, using price as part of creating a seamless cross-channel experience is growing in importance from 12% in 2010 to 26% today. This is still a relatively low number, placing it near the bottom of the list of opportunities. Winners put the most value on a seamless cross-channel experience - 28% vs. laggards' 18%.
Digging deeper into the details:
• Winners also place more value on price as an opportunity to better match demand to supply, with 38% of Winning respondents vs. 19% of average performers and 24% of laggards.
23%
25%
26%
26%
28%
29%
31%
39%
60%
Gain margin advantage through more dynamicpricing
Better matching of demand and product supply
Provide a more seamless cross-channelexperience to customers
Provide more localized offerings to customers
Create a more price competitive image for ourcustomers
Create more profitable promotions
Increase market share for key categories orproducts
Improve top-line sales
Improve margins
Top-3 Pricing Opportunities
9
• On the other hand, 35% of laggards value price as a way to present a more competitive image to customers vs. 22% of Winners.
• On the vertical front, Fashion retailers drive the interest in price's role in better matching supply and demand - not surprising, considering their overriding interest in managing sell-through. Grocers, also no surprise, are most interested in driving profitable promotions.
• The largest retailers are most interested in using price as part of their localization strategy, which is another theme - that retailers in this study seem to think they have a handle on the channel conflicts created by zone pricing. But while 56% of $5B+ retailers say they value localized pricing as an opportunity, only 38% say that price creates an opportunity within a seamless cross-channel experience.
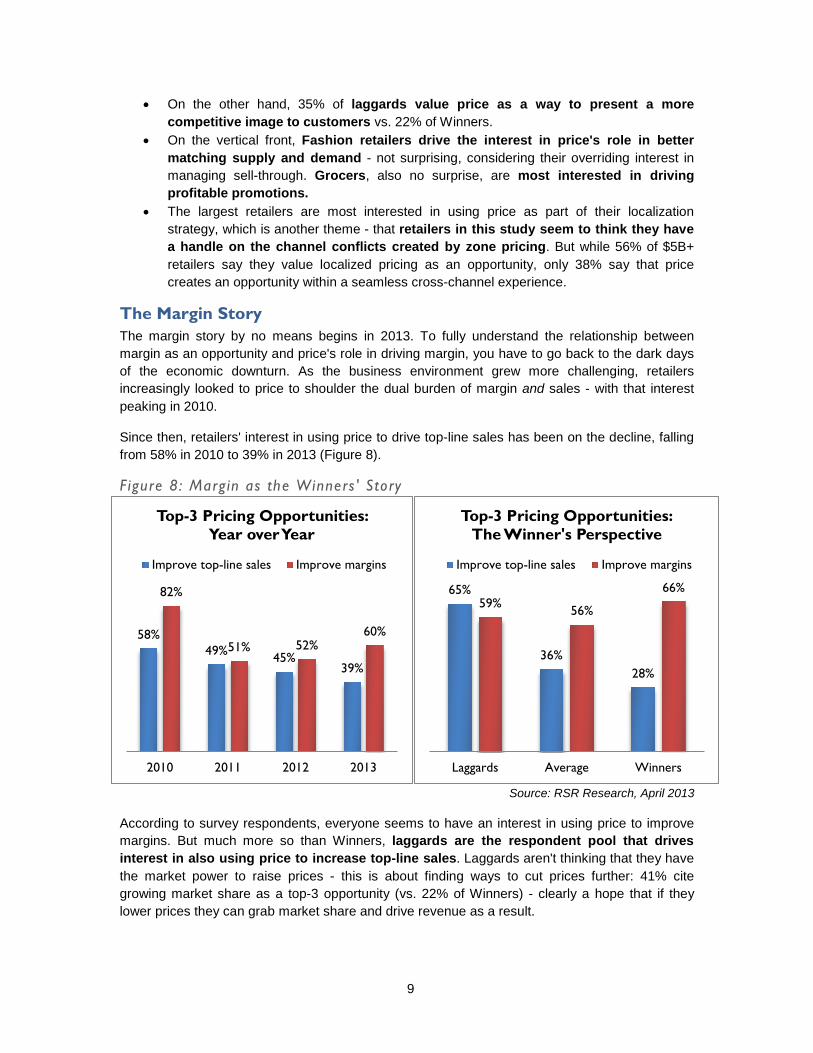
The Margin Story The margin story by no means begins in 2013. To fully understand the relationship between margin as an opportunity and price's role in driving margin, you have to go back to the dark days of the economic downturn. As the business environment grew more challenging, retailers increasingly looked to price to shoulder the dual burden of margin and sales - with that interest peaking in 2010.
Since then, retailers' interest in using price to drive top-line sales has been on the decline, falling from 58% in 2010 to 39% in 2013 (Figure 8).
Figure 8: Margin as the Winners ' Story
Source: RSR Research, April 2013
According to survey respondents, everyone seems to have an interest in using price to improve margins. But much more so than Winners, laggards are the respondent pool that drives interest in also using price to increase top-line sales. Laggards aren't thinking that they have the market power to raise prices - this is about finding ways to cut prices further: 41% cite growing market share as a top-3 opportunity (vs. 22% of Winners) - clearly a hope that if they lower prices they can grab market share and drive revenue as a result.
58% 49% 45%
39%
82%
51% 52% 60%
2010 2011 2012 2013
Top-3 Pricing Opportunities: Year over Year
Improve top-line sales Improve margins
65%
36% 28%
59% 56%
66%
Laggards Average Winners
Top-3 Pricing Opportunities: The Winner's Perspective
Improve top-line sales Improve margins

10
Additional trends related to margin:
• By vertical, everyone wants to improve margins, but top-line sales are a basics/replenishment story.
• The smallest retailers (<$50M) drive most of the interest in using price to improve top-line sales. The largest retailers are least interested in this opportunity. Only 31% of $5B+ retailers say improving margins is an opportunity.
As margin regains interest as an opportunity and interest in sales declines, one possible interpretation of this data is that retailers are on the cusp of turning around the extreme price sensitivity they have been engaged with since the downturn began. However, any retailer perception here is bound to be a self-fulfilling prophecy - part of the reason why it is so difficult to break a cycle of over-promoting. The more a retailer responds to a consumer as price sensitive, the more price sensitive that consumer becomes. However, break too soon from the pack - as JC Penney has learned - and consumers may not follow.
Zone Pricing and Transparency - Friends at Last? Last year, one of the most important findings in our research was that retailers increasingly felt pressure from price transparency - so much so that they were backing off of their zone pricing strategies simply as a way to combat channel (and zone) conflict.
RSR's conclusion was that zone pricing may well be dead on arrival - that geography or store segmentation alone will not be enough to convince customers that a retailer has a justification for a price difference. We maintain that when a retailer presents conflicting prices, whether driven by channel, geography, or store cluster, that retailer is killing its credibility with shoppers, much more so than most retailers may realize. But the retailer response - and thus their opinion about the opportunity that zone pricing can represent - has changed significantly (Figure 9).
Figure 9: The More We Know, the Less We Care
Source: RSR Research, April 2013
The more confident a retailer is in their ability to justify or explain multiple prices, the more confident they become in their zone pricing strategies. Retailers clearly feel that they can explain their prices to consumers in a way that does not hurt their credibility.
34%
20% 21%
38%
Zone pricing plans have been damaged byconsumer price transparency
We have effective policies in place to managedifferent prices and promotions across channels
and touch points
"Agree"
2012 2013
11
Additional perspectives:
• Winners and laggards play out the larger story on a smaller scale - 17% of Winners believe zone pricing has been damaged by transparency vs. 31% of laggards. Conversely, 47% of Winners believe they have effective price conflict policies vs. 13% of laggards.
• From a vertical perspective, fashion is the extreme of the figure above - 14% believe that zone pricing plans have been damaged by transparency, and 45% believe they have effective policies in place to manage price conflict across channels.
• Perishable goods retailers are most afraid of impact to their zone pricing strategies, mostly because they least agree that they have policies in place to manage conflicting prices.
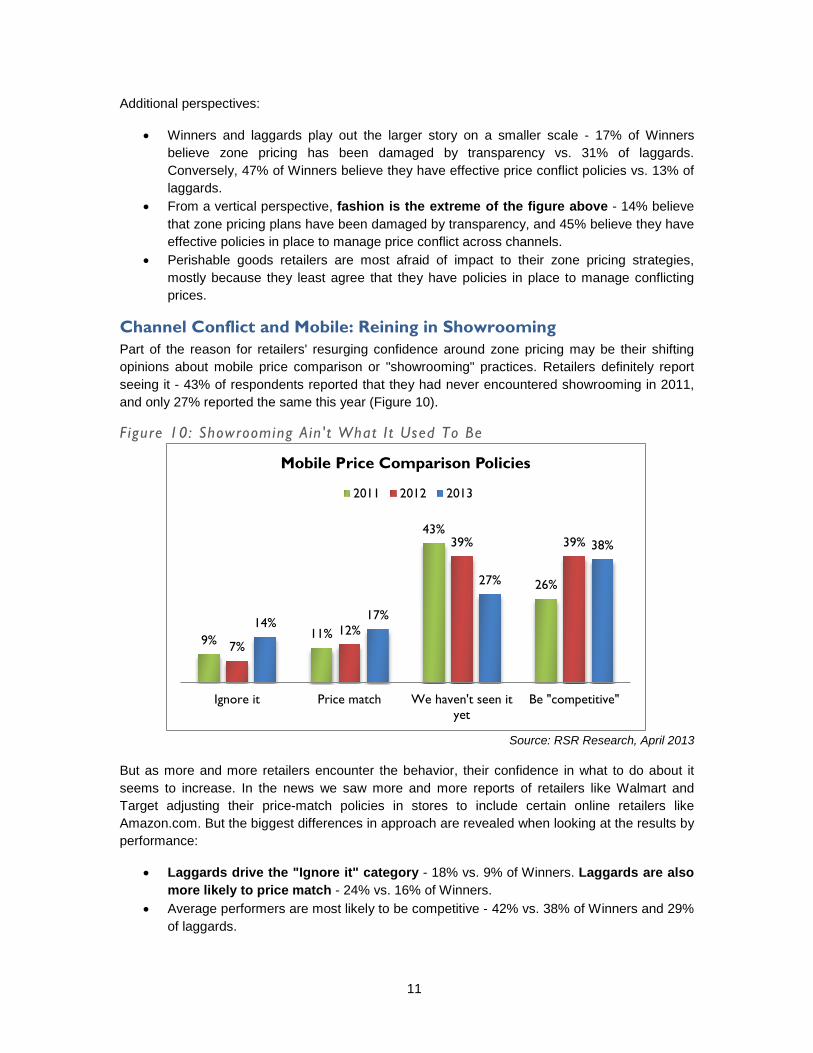
Channel Conflict and Mobile: Reining in Showrooming Part of the reason for retailers' resurging confidence around zone pricing may be their shifting opinions about mobile price comparison or "showrooming" practices. Retailers definitely report seeing it - 43% of respondents reported that they had never encountered showrooming in 2011, and only 27% reported the same this year (Figure 10).
Figure 10: Showrooming Ain' t What I t Used To Be
Source: RSR Research, April 2013
But as more and more retailers encounter the behavior, their confidence in what to do about it seems to increase. In the news we saw more and more reports of retailers like Walmart and Target adjusting their price-match policies in stores to include certain online retailers like Amazon.com. But the biggest differences in approach are revealed when looking at the results by performance:
• Laggards drive the "Ignore it" category - 18% vs. 9% of Winners. Laggards are also more likely to price match - 24% vs. 16% of Winners.
• Average performers are most likely to be competitive - 42% vs. 38% of Winners and 29% of laggards.
9% 11%
43%
26%
7% 12%
39% 39%
14% 17%
27%
38%
Ignore it Price match We haven't seen ityet
Be "competitive"
Mobile Price Comparison Policies
2011 2012 2013

12
• Winners are most likely to say they haven't seen any showrooming yet - 34% vs. 18% of average performers and 29% of laggards. The average performers appear to be getting squeezed - they are not necessarily positioning themselves against laggards as low price competitors, but they don't necessarily have the service or message elements that help them justify not price matching.
By revenue and vertical:
• The smallest retailers choose to ignore price comparisons - 24% ignore it vs. only 7% of largest retailers, and 10-13% among middle revenue bands.
• Middle revenue bands are most likely to respond by being competitive. - 56% of $50-249M and 50% of $250-999M retailers.
• Largest retailers are most conflicted - 33% say they aim to be competitive, but another 27% say they price match (highest among revenue bands). This does reflect the trend we saw in 2012 where the largest retailers adjusted their competitive position in stores to include price matching against online retailers.
• By vertical, perishable goods retailers are the least impacted by mobile price comparison, which, given the nascent online grocery business, is no surprise. And absolutely no durable goods retailers report that they ignore it, vs. 14-26% of peers - a reflection of the near-crisis state of some category-killing retailers as they get picked off on breadth of assortment online, and depth of assortment in small specialty.
Even from industry participants, we have heard many a tale of woe of a retailer-shopper relationship destroyed by channel conflicts and the retailer's subsequent failure to resolve that conflict in any rational (to the consumer) manner. Retailers seem to feel that their advertised policies around mobile price transparency are enough to avoid further damaging their credibility - or conversely, that the practice doesn't happen often enough that it's worth changing their whole price strategy over.
Will this conclusion hold? It depends in large part on consumer behavior - if continued price transparency takes a toll, or if the showrooming "freak out" of 2012 ultimately fades into insignificance.
The Promotions Conundrum While retailers have expressed a lot of ambivalence about their promotions capabilities in the past, in 2013 their confidence has grown, particularly around the level of granularity of their promotions, where 15% agreed they achieve the appropriate level of granularity in 2012 vs. 30% in 2013 (Figure 11).

13
Figure 11: Promot ions Should Be Gett ing Better
Source: RSR Research, April 2013
Overall, respondents express the most confidence in being able to react to competitors, rather than customers. And despite their confidence in their promotions capabilities holding steady or improving, as we’ll see later in this document, clear examples of places where retailers expressed issues specifically around managing and measuring promotions.
Promotions, like margins, is also a Winners' story:
• 43% of Winners feel confident in their promotional effectiveness vs. 25% of laggards. And 47% of Winners have a process in place to coordinate promotions across internal organizations vs. 20% of laggards.
• 50% of Winners vs. 38% of laggards are confident that they can respond quickly to competitors' price changes.
• Winners and average performers are 3 times more confident in their ability to target promotions (32-38% vs. 13% of laggards)
The biggest challenge with promotions is breaking corporate myths. Retailers think they are good at promotions because mass promotions have worked so well in the past, and because you can see the lift after a promotion runs. But in today's fragmented marketing world, where "mass" becomes more and more difficult to achieve, and the retail industry is growing less and less dependent on store traffic over time, the idea of what a promotion is and what it's supposed to accomplish is ultimately going to have to change.
There is absolutely no way a retailer can say they are doing promotions well if they can't coordinate promotions across multiple organizations or channels, and especially if they have no way to measure the impact of promotion decisions. And in terms of customer centricity, promotions is the first point in the business where the rubber meets the road - where the desire to be more customer centric should theoretically manifest itself in some kind of execution. From this research, retailers clearly aren't there yet.
30%
45%
34%
34%
51%
38%
39%
46%
20%
17%
26%
20%
My company currently targets our promotions at theappropriate level of granularity
We have the ability to respond quickly to competitors'price changes
We have processes in place to manage promotionalplanning across the various organizations within our
company (marketing, category mgr/buyer, forecaster)
My company feels confident that our promotions areeffective overall (improving margin, growing basket,
driving traffic, etc)
Promotions Opportunity
Agree Neutral Disagree

14
Organizational Inhibitors
If Price is our Lever, Why Can’t We Always Execute? We’ve already established that the number of price changes continue to escalate across the board, but most sharply among those who under-perform. As we intimated earlier in this document, this has had profound internal impact.
In aggregate, much like last year, the need to get clean data on past prices, competitor prices and customer purchase data is a serious constraint. Stores and other channels are becoming more resistant to “change” and the skill sets to actually do this right are lacking (Figure 12).
Figure 12: What ’s Preventing Us from Being More Effect ive?
Source: RSR Research, April 2013
When we look at the details, though, we see significant differences in opinion:
Impressions based on Performance:
• Not surprisingly (given their relatively higher number of price changes) laggards meet primary resistance from within. Sixty-nine percent of laggards report resistance to change from stores as a top-three organizational inhibitor, vs. 41% of Winners. Similarly, even the merchants are resistant, with 44% of Laggards reporting this as a top-three concern vs. 31% of Winners.
• For their parts, Winners are most concerned about skill sets and lack of coordination with marketing (45% apiece).
• Average performers are most concerned about their lack of clean price, competitor and purchase data (47%).
29%
31%
31%
34%
34%
40%
42%
42%
The possibility of negative customer reaction tochanges in our pricing strategy
Resistance to change from Merchandising
We can’t execute at the level of granularity that pricing solutions provide
Lack of coordination with Marketing
Channel organizational structure makes it difficultto coordinate pricing strategies across channels
Lack of the right skill sets
Resistance to change from Stores or otherchannels
Lack of clean price, competitor and purchase data
Top Three (3) Organizational Barriers Impacting Ability to Implement More Effective Pricing
Practices

15
Impressions based on Sub-vertical:
• Retailers selling Fashion/Seasonal merchandise most frequently report lack of coordination with marketing (50%) and possibility of negative customer reaction to changes (41%) as top-three inhibitors.
• Retailers selling basics/replenishable items are challenged by both lack of clean price, competitor and purchase data and difficult channel organizational structures (42% each).
• Retailers selling durable goods and/or Consumer Electronics overwhelmingly cite a lack of clean price, competitor and purchase data (67%). They also frequently cite lack of skill sets (43%).
• Finally, retailers selling perishables cite three primary internal challenges: executing at a granular level (62%), a lack of skill sets (also 62%), and resistance to change from stores (54%) in their top-three internal issues.
Impressions based on Retailer Size:
• The smallest retailers (<$50 million in annual revenue) quite surprisingly pick resistance to change from stores or other channels far more frequently than any other issue (59%). One would expect these independents to have more control over their store personnel than that.
• Lower mid-market retailers ($51-$249 million in annual revenue) are most concerned about lack of clean price, competitor and purchase data (60%), and the possibility of negative customer reaction (47%) most frequently.
• Higher mid-market retailers ($250 million - $1billion in annual revenue) overwhelmingly cite resistance to change from stores (67%), followed by the lack of skill sets and ability to execute at a granular level (44% apiece).
• Lower tier 1 retailers ($1-$5 billion) are a bit more evenly split: 53% citing skill set issues, and 47% citing both lack of clean data and execution issues as their main top-three concerns.
• The largest tier 1 retailers (annual sales > $5 billion) are relatively evenly split on their top three concerns, with lack of coordination with marketing and channel organizational structures (43% apiece) narrowly edging out other concerns.
How Can We Get Past these Concerns? On one level, there is also not a lot of unanimity among respondents about ways to overcome the organizational inhibitors they face, but there is one item that is consistently on the top of everyone's list: the need for improved technology integration tools. This is a bit counter-intuitive, given that the internal barriers they perceive are all about culture and execution. We can only tie this to their professed inability to execute at the granular level their systems could provide, but it still surprising.
Figure 13 shows how this issue has grown just since last year. Clearly, as we said last year, “Pricing is no longer an island.”

16
Figure 13: …And What Can We Do About I t?
Source: RSR Research, April 2013
Operational Challenges Are Surprising No discussion of organizational inhibitors would be complete without at least mentioning operational challenges in setting prices, and here as well, we found ourselves stunningly surprised.
How can it be that we continue to increase the number of price changes we send, we rely on pricing to manage our margin and top lines, and yet almost half of us report we can neither forecast what impact potential pricing decisions will have, nor can we measure the actual impact those decisions have? Strange as this may sound, this is clearly the state our retail respondents report (Figure 14).
15%
21%
26%
33%
23%
28%
41%
44%
33%
14%
19%
24%
28%
32%
35%
42%
44%
51%
Best practices for managing channel conflict of prices
Line of business leaders to help change our business processes
Pilot programs in specific stores or regions
Better communication and education of resistant parties ororganizations
Better training to improve pricing skill sets
Tailor a technology solution to my business process and needs
Business process analysis for pricing process improvement
Build up progressively more sophisticated pricing capabilitiesover time
Improved integration technology tools
Top Three (3) Ways you Believe you can Overcome these Barriers
2013 2012

17
Figure 14: We’re Making Good Time, but We Might Well Be Lost
Source: RSR Research, April 2013
Bottom Line: A Wall of Confusion The net of all this data comes down to several short bullet points:
• Our problems are organizational, but we perceive our solutions as technical • We continue tweaking and changing prices while flying blind • We’re not quite sure how to use the tools and techniques we have at our disposal • And finally, we may not have the data we need to actually change the outcomes we’ve
described above
Within that context, let’s take a look at how Technology enablers can, have, and will help solve this difficult situation.
15%
17%
19%
20%
24%
27%
35%
37%
45%
48%
Keeping up with promotional deals btwn buyers &manufacturers
Keeping up with pricing and packaging changes bymanufacturers
Managing promotions across channels
Inability to effectively manage all pricing rules and/orunderstand impact of rule violations
Coordinating with marketing on promotions and offers
Getting access to robust competitive price data
Making sure that stores change prices accurately andtimely
Maintaining visibility into promotional profitability
Measuring the impact of executed pricing decisions
Forecasting the impact of potential pricing decisions
Top Three (3) Operation Challenges in Setting Prices

18
Technology Enablers
The Customer Data Silver Bullet In terms of data elements valuable to a pricing capability, there have been some big shifts over the last year. Clean demand at a store level, competitors' prices, and clean promotion history remain at the top of the list, but almost everything based on customer in some way jumped significantly (Figure 15).
Figure 15: The Customer Bump
Source: RSR Research, April 2013
Customer purchase history shot to the top 5 on the list, moving from 37% of respondents who rated it as very valuable in 2012, to 54% in 2013. Even customer sentiment gathered from social media benefited - improving from 17% in 2012 to 25% this year.
Is it a coincidence that in the organizational inhibitors section we identified clean data as one of the top organizational barriers? We think no. Customer data is typically much "dirtier" than product data, and notoriously difficult to clean. With this rising importance of all data customer-related, it's no surprise that retailers also feel the need for stronger tools and skill sets related to getting and keeping this data clean. Conflicting prices may break trust, but personalization run
13%
27%
35%
44%
49%
29%
32%
28%
38%
26%
49%
37%
25%
37%
38%
38%
39%
40%
46%
49%
54%
55%
60%
62%
Customer sentiment gathered from social media
Regional or store demographics
Planned inventory levels
Clean demand at an aggregate level
Current inventory levels
Customer demographics
Customer segmentation
Market basket data
Customer purchase history
Clean promotions history (mechanisms,placement, media, dates, etc.)
Competitors’ prices
Clean demand at a store level
Pricing Data Elements: Value vs. Use
Very valuable Major role

19
amok, or even out of context or outside the bounds of what a customer expects from you will destroy trust.3
Additional details by revenue:
• Mid-size retailers show the most interest in market basket data - 75% vs. mid-40%'s for peers. (Note, in our 2012 merchandising benchmark, no mid-sized retailers reported actually using market basket analysis at all)
• The smallest retailers show the most interest in customer demographics - 57% vs. 33% of the largest retailers. This is unusual because the largest retailers usually track with the smallest when it comes to anything that helps build a sense of customer intimacy.
• Mid-size to large retailers ($250-999M and $1-5B) have the most interest in customer segmentation. For mid-size retailers it may very well be the case that the customer base has grown to the point where it's worth segmenting as a management and targeting tool.
• The smallest retailers are most interested in competitors prices - 71% vs. low 50%'s for peers. This is interesting because the smallest retailers weren't the ones most interested in building a competitive price image - they cede that territory to the largest retailers (31% of <$50M saw a price competitive image as an opportunity vs. 44% of >$5B)
Customer Data - A Laggards' Tale Laggards jumped on the customer data element as part of pricing whole-hog this year, placing disproportionately more value emphasis on nearly every customer data element we asked about (Figure 16).
Figure 16: Jumping On The Customer Bandwagon
Source: RSR Research, April 2013
Laggards drive most of the interest across the board around customer data. Historically it has been Winners who have expressed the most interest in using customer data elements as part of their pricing capability. That has changed. Laggards consistently rated customer purchase
3 The most recent example involves Target and a pregnant teen: http://www.forbes.com/sites/kashmirhill/2012/02/16/how-target-figured-out-a-teen-girl-was-pregnant-before-her-father-did/
41%
56%
59%
63%
65%
81%
22%
23%
27%
33%
46%
48%
16%
38%
39%
48%
56%
65%
Customer sentiment gathered from socialmedia
Regional or store demographics
Customer demographics
Customer segmentation
Customer purchase history
Clean demand at a store level
Customer Data Elements in Pricing - "Very Valuable"
Retail Winners Average Performers Laggards

20
history, demographics, segmentation, even social media sentiment as highly valuable, in some cases doubling down over Winners. The biggest difference came from customer social media sentiment, where laggards outstrip Winners' interest in this data element by more than 2 to 1. Winners appear to be more cautious in embracing some of these data elements.
It seems that customer data has become the new magic bullet for laggards. The only catch - as we'll see below - is that Winners are actually using this data to make pricing decisions. Laggards are not. This becomes clear when we look at the deltas between "very valuable" and "plays a major role" (Figure 17).
Figure 17: Al ignment: Using What You Value Most
Source: RSR Research, April 2013
Winning retailers do a much better job of matching data elements' expected value to their current use - their biggest gap in customer data elements is a 23% difference between the number of Winners who value clean demand at a store level and the number who say it currently plays a major role in their pricing strategy. For laggards, no data element has less than a 29% gap - a clear difference between intentions and execution.
Making It All Happen When it comes to actually translating intentions into execution, customer and product data warehouses top the list in terms of adoption (Figure 18). These are important foundational elements - the repositories of all of the data elements that retailers say they value and occasionally use, noted above.
0% -1% -4%
-17%
-10%
-23% -29%
-38%
-29% -29% -35%
-50%
Customersentiment
gathered fromsocial media
Regional orstore
demographicsCustomer
demographicsCustomer
segmentationCustomer
purchase historyClean demandat a store level
Gaps Between Value & Use of Data Elements (a negative number indicates higher value than use)
Winners Laggards
21
Figure 18: Foundations Laid
Source: RSR Research, April 2013
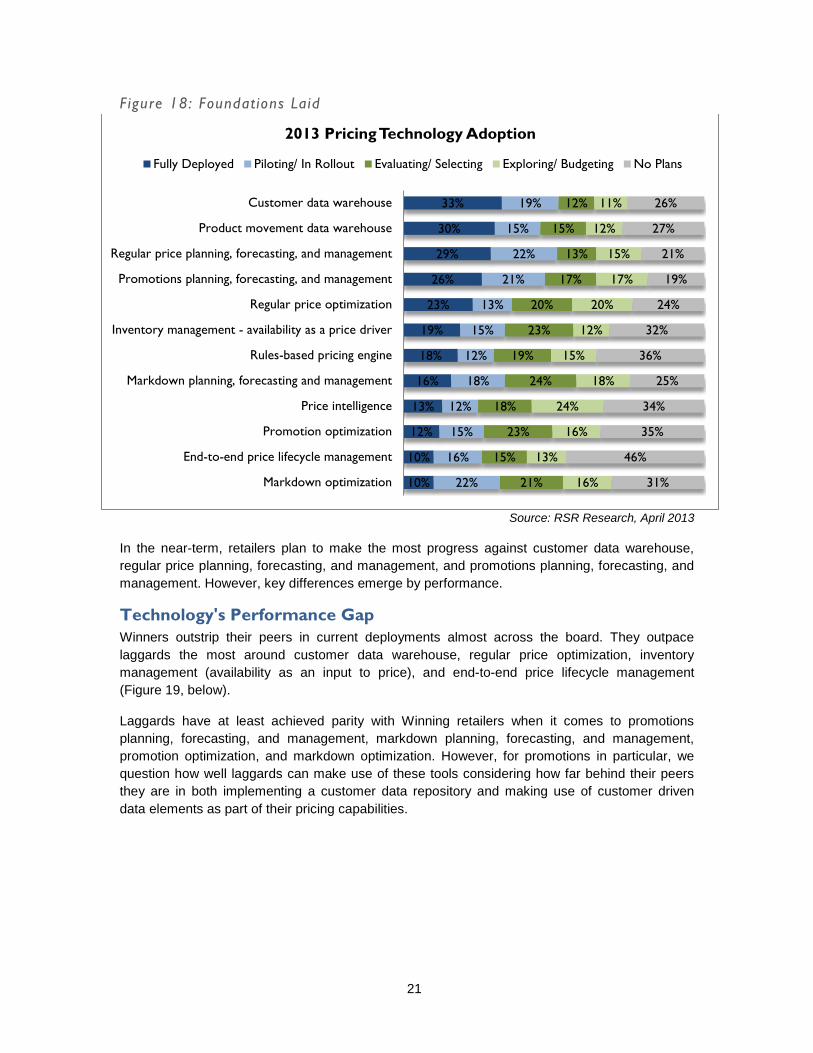
In the near-term, retailers plan to make the most progress against customer data warehouse, regular price planning, forecasting, and management, and promotions planning, forecasting, and management. However, key differences emerge by performance.
Technology's Performance Gap Winners outstrip their peers in current deployments almost across the board. They outpace laggards the most around customer data warehouse, regular price optimization, inventory management (availability as an input to price), and end-to-end price lifecycle management (Figure 19, below).
Laggards have at least achieved parity with Winning retailers when it comes to promotions planning, forecasting, and management, markdown planning, forecasting, and management, promotion optimization, and markdown optimization. However, for promotions in particular, we question how well laggards can make use of these tools considering how far behind their peers they are in both implementing a customer data repository and making use of customer driven data elements as part of their pricing capabilities.
10%
10%
12%
13%
16%
18%
19%
23%
26%
29%
30%
33%
22%
16%
15%
12%
18%
12%
15%
13%
21%
22%
15%
19%
21%
15%
23%
18%
24%
19%
23%
20%
17%
13%
15%
12%
16%
13%
16%
24%
18%
15%
12%
20%
17%
15%
12%
11%
31%
46%
35%
34%
25%
36%
32%
24%
19%
21%
27%
26%
Markdown optimization
End-to-end price lifecycle management
Promotion optimization
Price intelligence
Markdown planning, forecasting and management
Rules-based pricing engine
Inventory management - availability as a price driver
Regular price optimization
Promotions planning, forecasting, and management
Regular price planning, forecasting, and management
Product movement data warehouse
Customer data warehouse
2013 Pricing Technology Adoption
Fully Deployed Piloting/ In Rollout Evaluating/ Selecting Exploring/ Budgeting No Plans

22
Figure 19: Fol lowing Winners' Lead
Source: RSR Research, April 2013
When it comes to adoption plans, the near term picture looks set to shift in the next 12-18 months. Winners have the most aggressive plans when it comes to markdowns - both planning and optimization - and promotion optimization. Laggards, on the other hand, are focused on - no surprise - customer data warehouse, alongside several capabilities that will improve the product side of their pricing capabilities (Figure 20).
Figure 20: Adoption Catch-Up
Source: RSR Research, April 2013
7% 13% 13%
0% 6%
25% 6% 6%
13% 19%
25% 25%
7% 11% 11%
15% 16%
22% 22%
26% 27%
32% 36%
42%
Markdown optimizationPromotion optimization
Markdown planning, forecasting and managementEnd-to-end price lifecycle management
Price intelligencePromotions planning, forecasting, and management
Inventory management - availability as a price driverRegular price optimizationRules-based pricing engine
Regular price planning, forecasting, and managementProduct movement data warehouse
Customer data warehouse
Solutions "Fully Deployed"
Winners Laggards
25%
50%
25%
25%
19%
31%
31%
31%
13%
25%
20%
31%
4%
8%
8%
8%
11%
12%
15%
15%
19%
22%
30%
33%
End-to-end price lifecycle management
Rules-based pricing engine
Customer data warehouse
Price intelligence
Regular price planning, forecasting, and…
Product movement data warehouse
Regular price optimization
Inventory management - availability as a price…
Promotions planning, forecasting, and…
Promotion optimization
Markdown optimization
Markdown planning, forecasting and management
Solutions "Evaluating/Selecting"
Winners Laggards
23
A Note About Hosted Solutions One of the peculiarities of pricing has been its early focus on hosted solutions. Call it what you will, all of the terms apply: Software-as-a-Service, On Demand, Hosted, Cloud-Based. In terms of overall industry interest in such solutions, pricing has long been a leading indicator. How did it fare in this year's survey?
Currently, 38% of respondents are neutral about it, and only slightly more are positive than negative. Winners are the most opinionated, splitting roughly 1/3-1/3-1/3 between positive, neutral, and negative. Average performers are most positive. Given all of the recent attention and buzz that cloud-based solutions have generated, and pricing solutions' early entry into this kind of solution architecture, it's clear that hosted solutions do not necessarily provide perceived benefits to retailers one way or another. Unfortunately, this may have more to do with the conservative nature of retail IT departments than anything related to the solution architecture itself.

24
BOOTstrap Recommendations
Resisting Discounting's Siren Call Pricing is both one of the most strategic and also tactical retail demand levers. The right price strategy is a critical part of a retailer's brand promise to customers. The appropriately targeted and focused price change can save sagging sales or move distressed inventory. It can, as retailers rightly identify in this research, drive sales or improve margin - or both.
But pricing, just like every other aspect of retail, is being fundamentally transformed by omni-channel retailing. It is lives at the intersection of customer and product. We've already seen customer behavior change radically thanks to digital channels and ubiquitous smartphones. And in 2012, there was near panic in the streets over how consumers were using those smartphones to cut retailers' carefully constructed pricing strategies to shreds.
While overall the same process that has driven pricing in the past drives pricing today, the details have changed significantly. Retailers still set corporate objectives, plan their price strategy, execute it, and measure results (theoretically - as we saw above, these ideals do not always translate into practice). But it doesn't help that all of this change - showrooming, price transparency, more targeted promotions across more digital channels - occurred in an economic downturn. This has led to consumer price sensitivity that retailers cannot seem to leave behind. At a time when retailers should be transforming their pricing strategies and practices for the omni-channel age, they are caught in a downward spiral of deeper and deeper discounts.
We're never going to persuade retailers to abandon the siren call of cutting prices to stimulate sales - we're not even going to try. What we hope retailers will consider, instead, are some key ways they can turn pricing into a strategic advantage, whether a luxury retailer or a deep discounter, whether caught in the throes of showrooming or safe and sound in a brand that just can't be copied.
What needs to happen to make pricing a fully contributing strategic solution for retailers? The theme is MEASURE:
Measure the Impact of Price Changes Yes, this requires data - clean data - and it requires discipline. But having a specific problem to solve often creates focus that helps an entire company understand what's important, and identifies critical gaps that need to be filled. Bad data is better than no data, if it gets you closer to good data in the end. And there is so much more data available out there than there used to be. Records of promotion histories and campaigns, detailed digital measurements of responses, complete transparency into competitors' prices and availability.
The virtuous pricing cycle of “plan - execute – measure” falls apart if you ignore any point in the circle. And retailers have been ignoring Measure. If you can't measure, how can you plan to correct for the last cycle's mistakes? How do you know if you executed the way you needed? Measurement should be a priority, even if it isn't clean or easy - sometimes the journey is just as valuable as the destination.

25
Corollary: Measure the Customer Impact of Conflicting Channel Prices This year a surprising number of respondents reported that they believed they had overcome their zone pricing challenges. But given the lack of measurement that occurs around the impact - current or future - of pricing decisions, forgive us if we're skeptical.
Retailers need to make 100% sure that their zone or channel pricing strategies are not damaging their credibility with consumers. This isn't about watching sales, or listening for anecdotal tales about angry customers from store staff. This is about measuring reliably how often mobile price comparisons are happening in your stores (a question practically designed for video analytics), testing specific response policies, and following up to explicitly understand how customers perceive your response to them.
Our take, from listening to retailers and listening to shoppers, is that retailers don't fully understand how much they damage their customers' trust when pricing conflicts are not handled smoothly. Or even how often a customer walks away, or abandons her cart without telling the retailer anything about why.
Retailers seem to believe that having a policy is all they need to reassure customers about different prices across zones or channels. But we've already seen that especially when it comes to change, consumers need a LOT of communication. Be specific. Be repetitive. Make them sick of your message - then you'll know that it's been received.
Faster and More is Not Better - Measure the Cost to Stores Stores are already set back on their heels by the impact of digital channels. Many retailers are struggling to define the strategic role of stores, let alone how prices in stores should be handled. Digital channels, because of the ease with which price changes can be made, move at a much different speed than stores.
But while changing a price on the website is virtually free, changing a price across hundreds of stores can cost an enormous amount - not just in labor and signage, but in selling opportunity costs. Trying to prod stores into moving as fast as online by inundating them with price changes is an exercise in store confusion and customer disillusionment (refer back to the corollary above). As you build your measurement strategy, include a look at the impact of price changes on stores. Are they able to effectively implement all the price changes you intend? What's their capacity before things fall apart? How much does a store price change cost? Really cost - in labor, in supplies, and most importantly in the opportunity cost of a sales associate who isn't selling. Does that sales lift pay off when stores have to bear the brunt of execution?
So we can see that the corollary to the virtuous pricing cycle (plan-execute-measure) also applies to those perceived as most recalcitrant to pricing practices, the in-store workforce. Plan the labor required to execute expected price changes, execute on those changes, and finally measure the effectiveness of that execution. As we said earlier in this benchmark, it’s not enough to measure whether or not we’re “making good time.” We also need to know that we’re headed in the right direction.

a
Appendix A: RSR’s Research Methodology
The “BOOT” methodology is designed to reveal and prioritize the following:
• Business Challenges – Retailers of all shapes and sizes face significant external challenges. These issues provide a business context for the subject being discussed and drive decision-making across the enterprise.
• Opportunities – Every challenge brings with it a set of opportunities, or ways to change and overcome that challenge. The ways retailers turn business challenges into opportunities often define the difference between Winners and “also-rans.” Within the BOOT, we can also identify opportunities missed – and describe leading edge models we believe drive success.
• Organizational Inhibitors – Even as enterprises find opportunities to overcome their external challenges, they may find internal organizational inhibitors that keep them from executing on their vision. Opportunities can be found to overcome these inhibitors as well. Winning Retailers understand their organizational inhibitors and find creative, effective ways to overcome them.
• Technology Enablers – If a company can overcome its organizational inhibitors it can use technology as an enabler to take advantage of the opportunities it identifies. Retail Winners are most adept at judiciously and effectively using these enablers, often far earlier than their peers.
A graphical depiction of the BOOT follows:

b
Appendix B: About Our Sponsors
360pi, a global leader in retail price intelligence, delivers online competitive monitoring solutions that give retailers complete visibility into their competitors' prices. Top retailers use 360pi’s industry-leading match and accuracy rates – made possible by its proprietary artificial intelligence and cloud-based, big data capabilities – to enhance their pricing strategies and enable margin and revenue increases of up to 80%. For more information, please visit: www.360pi.com
Revionics delivers the industry’s most powerful End-to-End Merchandise Optimization solution, enabling retailers of all sizes to execute a fact-based omni-channel merchandising strategy utilizing the most comprehensive set of shopper demand signals to enhance financial performance with improved customer satisfaction. Revionics’ solutions leverage advanced predictive analytics and demand-based science to ensure retailers have the right product, price, promotion, placement and space allocation for optimal results across all touch points in the omni-channel shopping episode – online, in-store, social and mobile. Revionics has been recognized as a 2012 Deloitte Technology Fast 500™ company and has more retail locations under optimization management than any other vendor. Visit us at www.revionics.com.
With SAS’s 35 years of advanced analytics and industry expertise, retailers choose SAS to improve business results with solutions for merchandise planning, size optimization, localized assortment optimization, space planning and optimization, price optimization, cross-channel campaign management, customer insight, social media analytics, and advanced forecasting across the enterprise. Retailers turn to SAS because SAS drives better results.
Used at more than 55,000 sites in 131 countries, including 90 of the top 100 companies on the 2011 Fortune Global 500® list, SAS is proud to give our customers THE POWER TO KNOW® For further information, visit http://www.sas.com/retail/.

c

d
Appendix C: About RSR Research
Retail Systems Research (“RSR”) is the only research company run by retailers for the retail industry. RSR provides insight into business and technology challenges facing the extended retail industry, providing thought leadership and advice on navigating these challenges for specific companies and the industry at large. We do this by:
• Identifying information that helps retailers and their trading partners to build more efficient and profitable businesses;
• Identifying industry issues that solutions providers must address to be relevant in the extended retail industry;
• Providing insight and analysis about a broad spectrum of issues and trends in the Extended Retail Industry.
Copyright© 2013 by Retail Systems Research LLC • All rights reserved.
No part of the contents of this document may be reproduced or transmitted in any form or by any means without the permission of the publisher. Contact [email protected] for more information.
for more information.