Touching moments
36
From on-panel to off-panel, a touchy subject Observations and thoughts on the business of touch and touchless interfaces for displays and consumer devices for Hendy Consulting clients and friends — February 2014
-
Upload
ian-hendy -
Category
Technology
-
view
115 -
download
0
Transcript of Touching moments
From on-panel to off-panel, a touchy subject
Observations and thoughts on the business of touch and touchless interfaces for displays and consumer devices for Hendy Consulting clients and friends — February 2014
Agenda
! Market review for touch
! Our implications and conclusions
! Positioning touch within total UI
1
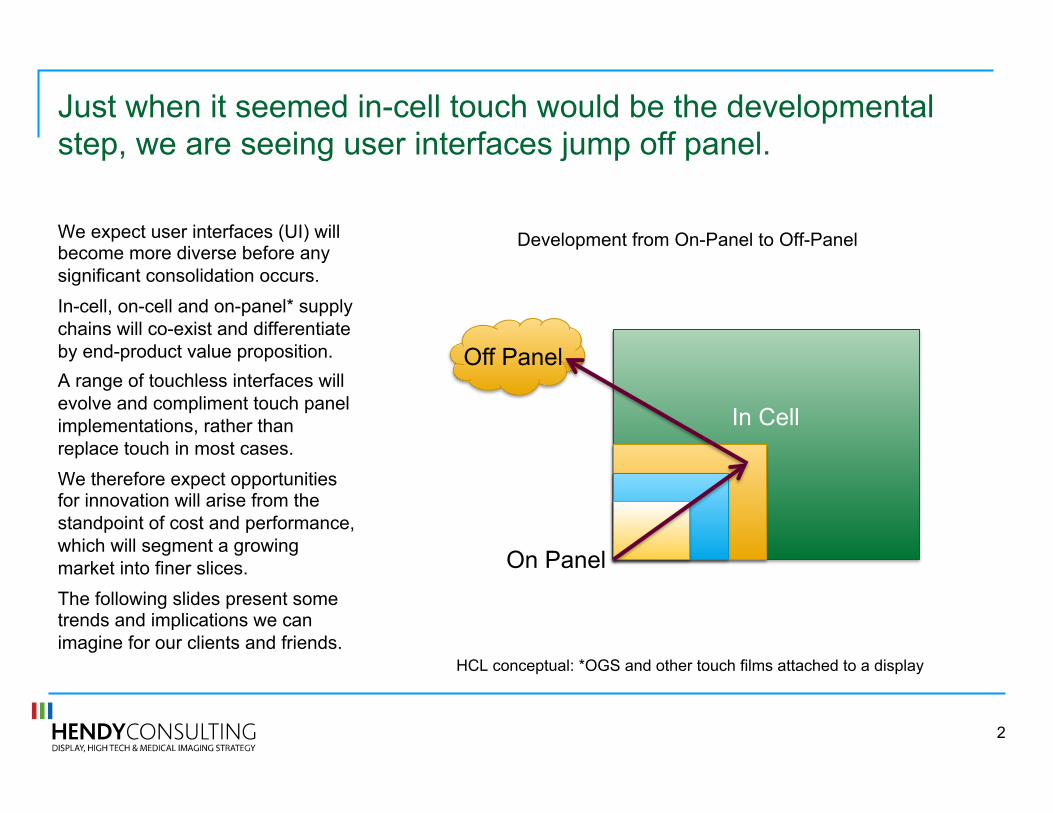
Just when it seemed in-cell touch would be the developmental step, we are seeing user interfaces jump off panel.
We expect user interfaces (UI) will become more diverse before any significant consolidation occurs. In-cell, on-cell and on-panel* supply chains will co-exist and differentiate by end-product value proposition. A range of touchless interfaces will evolve and compliment touch panel implementations, rather than replace touch in most cases. We therefore expect opportunities for innovation will arise from the standpoint of cost and performance, which will segment a growing market into finer slices. The following slides present some trends and implications we can imagine for our clients and friends.
HCL conceptual: *OGS and other touch films attached to a display
Development from On-Panel to Off-Panel
Off Panel
On Panel
In Cell
2
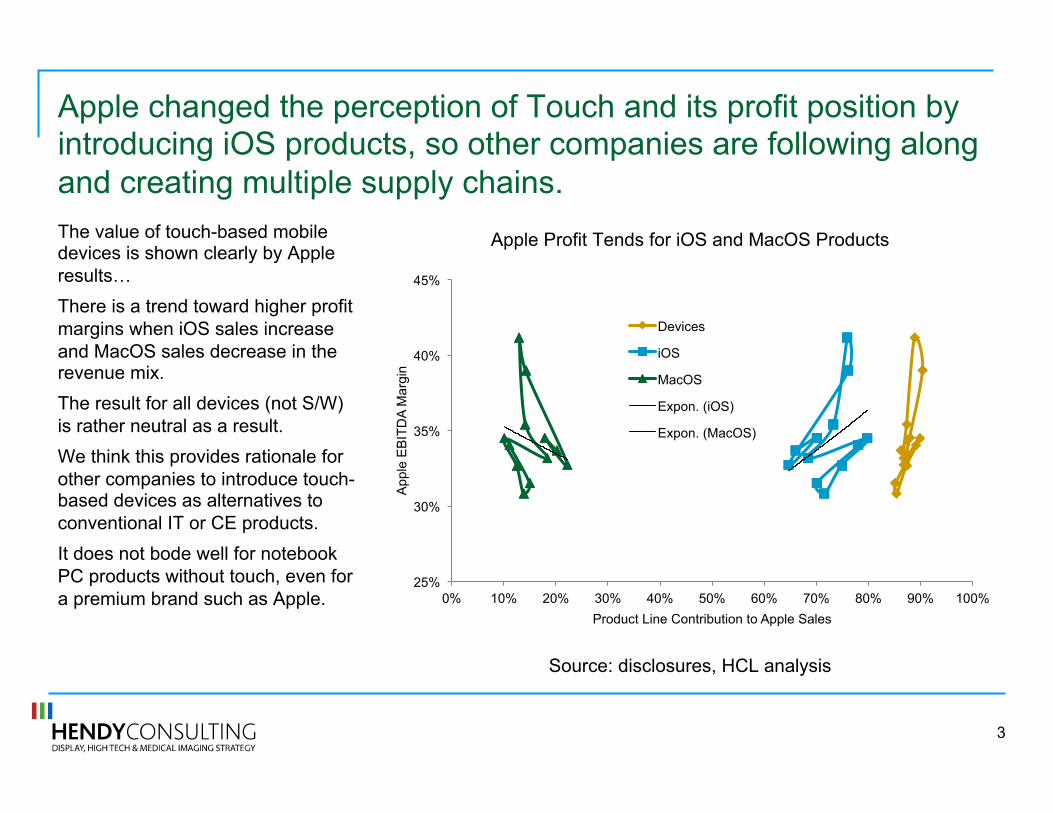
Apple changed the perception of Touch and its profit position by introducing iOS products, so other companies are following along and creating multiple supply chains. The value of touch-based mobile devices is shown clearly by Apple results! There is a trend toward higher profit margins when iOS sales increase and MacOS sales decrease in the revenue mix. The result for all devices (not S/W) is rather neutral as a result. We think this provides rationale for other companies to introduce touch-based devices as alternatives to conventional IT or CE products. It does not bode well for notebook PC products without touch, even for a premium brand such as Apple.
Source: disclosures, HCL analysis
Apple Profit Tends for iOS and MacOS Products
25%
30%
35%
40%
45%
0% 10% 20% 30% 40% 50% 60% 70% 80% 90% 100%
App
le E
BIT
DA
Mar
gin
Product Line Contribution to Apple Sales
Devices
iOS
MacOS
Expon. (iOS)
Expon. (MacOS)
3
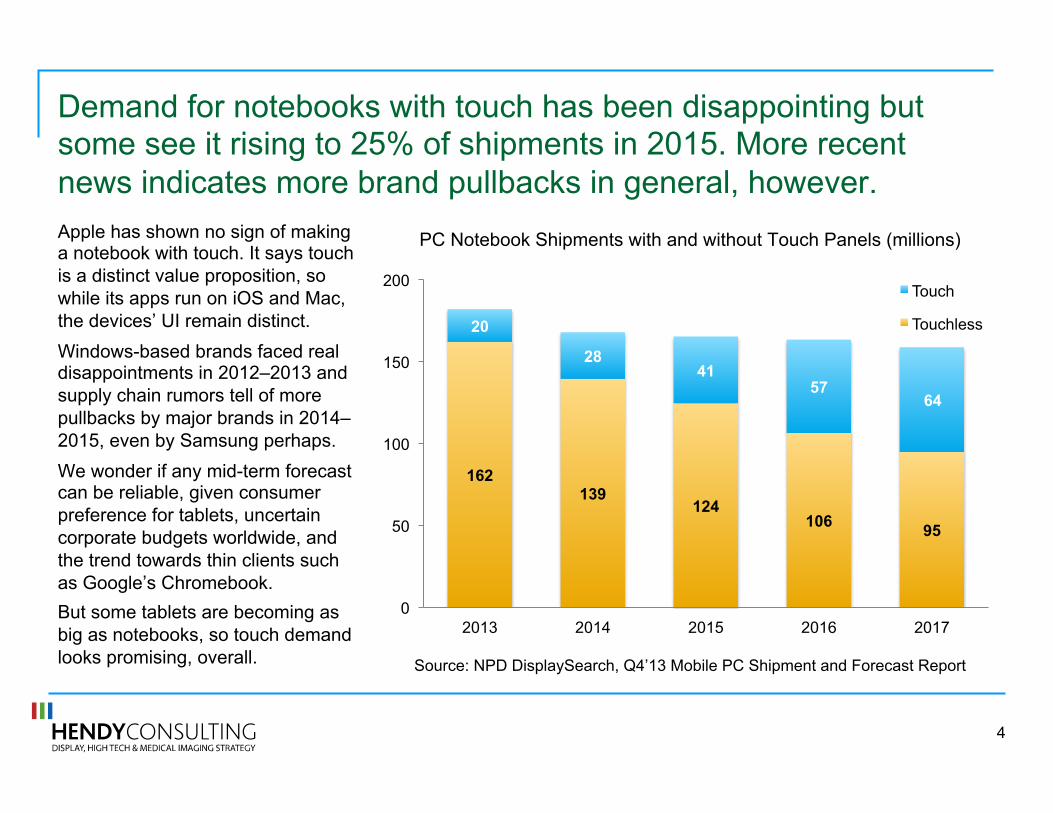
Demand for notebooks with touch has been disappointing but some see it rising to 25% of shipments in 2015. More recent news indicates more brand pullbacks in general, however. Apple has shown no sign of making a notebook with touch. It says touch is a distinct value proposition, so while its apps run on iOS and Mac, the devices’ UI remain distinct. Windows-based brands faced real disappointments in 2012–2013 and supply chain rumors tell of more pullbacks by major brands in 2014–2015, even by Samsung perhaps. We wonder if any mid-term forecast can be reliable, given consumer preference for tablets, uncertain corporate budgets worldwide, and the trend towards thin clients such as Google’s Chromebook. But some tablets are becoming as big as notebooks, so touch demand looks promising, overall. Source: NPD DisplaySearch, Q4’13 Mobile PC Shipment and Forecast Report
PC Notebook Shipments with and without Touch Panels (millions)
162 139
124 106 95
20
28 41
57 64
0
50
100
150
200
2013 2014 2015 2016 2017
Touch
Touchless
4
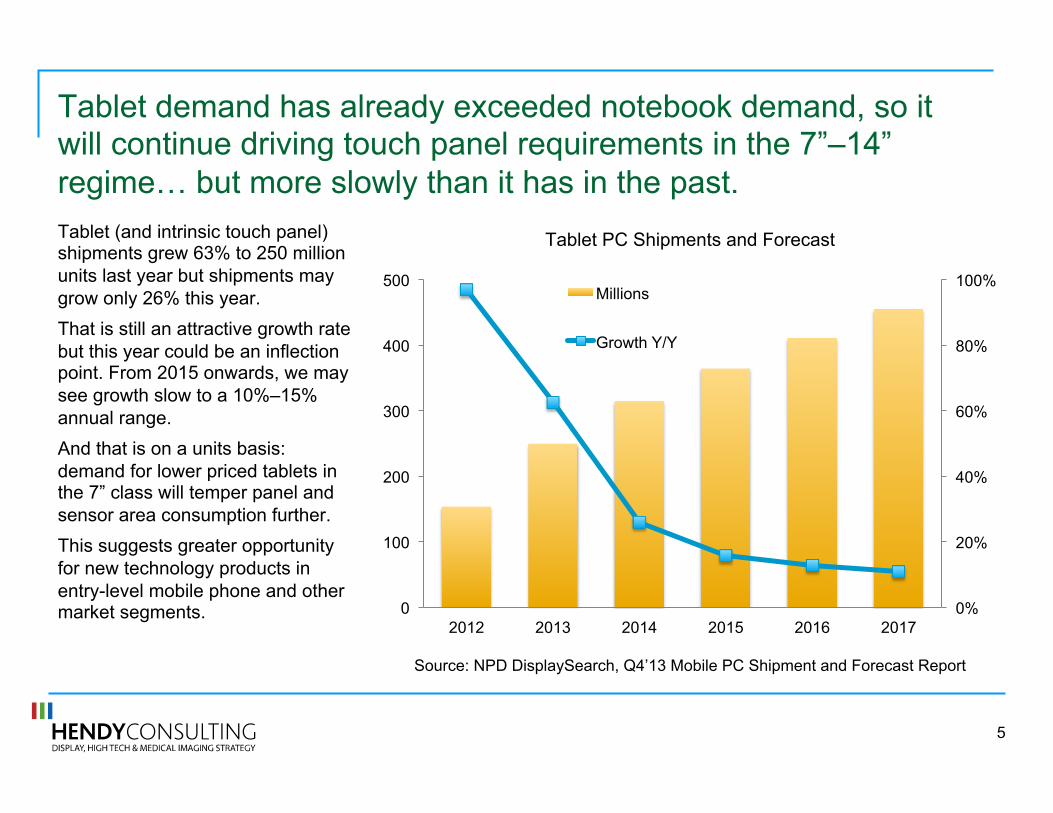
Tablet demand has already exceeded notebook demand, so it will continue driving touch panel requirements in the 7”–14” regime! but more slowly than it has in the past. Tablet (and intrinsic touch panel) shipments grew 63% to 250 million units last year but shipments may grow only 26% this year. That is still an attractive growth rate but this year could be an inflection point. From 2015 onwards, we may see growth slow to a 10%–15% annual range. And that is on a units basis: demand for lower priced tablets in the 7” class will temper panel and sensor area consumption further. This suggests greater opportunity for new technology products in entry-level mobile phone and other market segments.
Source: NPD DisplaySearch, Q4’13 Mobile PC Shipment and Forecast Report
Tablet PC Shipments and Forecast
0%
20%
40%
60%
80%
100%
0
100
200
300
400
500
2012 2013 2014 2015 2016 2017
Millions
Growth Y/Y
5
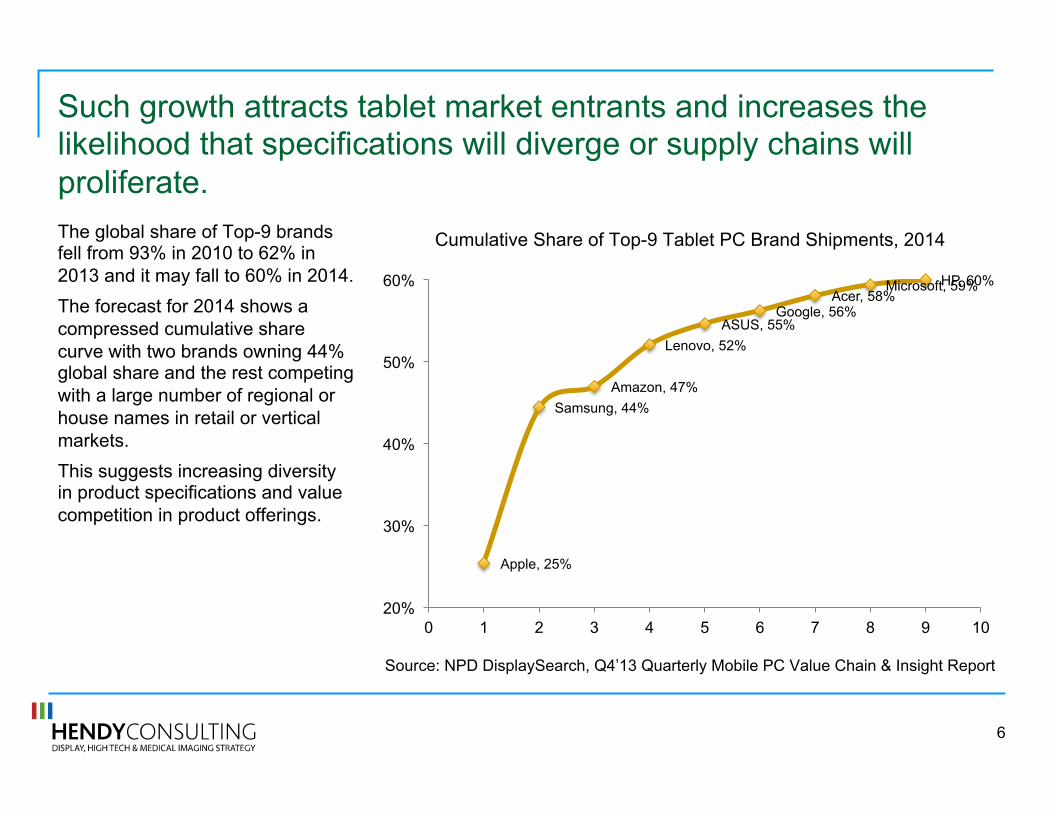
Such growth attracts tablet market entrants and increases the likelihood that specifications will diverge or supply chains will proliferate. The global share of Top-9 brands fell from 93% in 2010 to 62% in 2013 and it may fall to 60% in 2014. The forecast for 2014 shows a compressed cumulative share curve with two brands owning 44% global share and the rest competing with a large number of regional or house names in retail or vertical markets. This suggests increasing diversity in product specifications and value competition in product offerings.
Source: NPD DisplaySearch, Q4’13 Quarterly Mobile PC Value Chain & Insight Report
Cumulative Share of Top-9 Tablet PC Brand Shipments, 2014
Apple, 25%
Samsung, 44% Amazon, 47%
Lenovo, 52% ASUS, 55%
Google, 56% Acer, 58%
Microsoft, 59% HP, 60%
20%
30%
40%
50%
60%
0 1 2 3 4 5 6 7 8 9 10
6
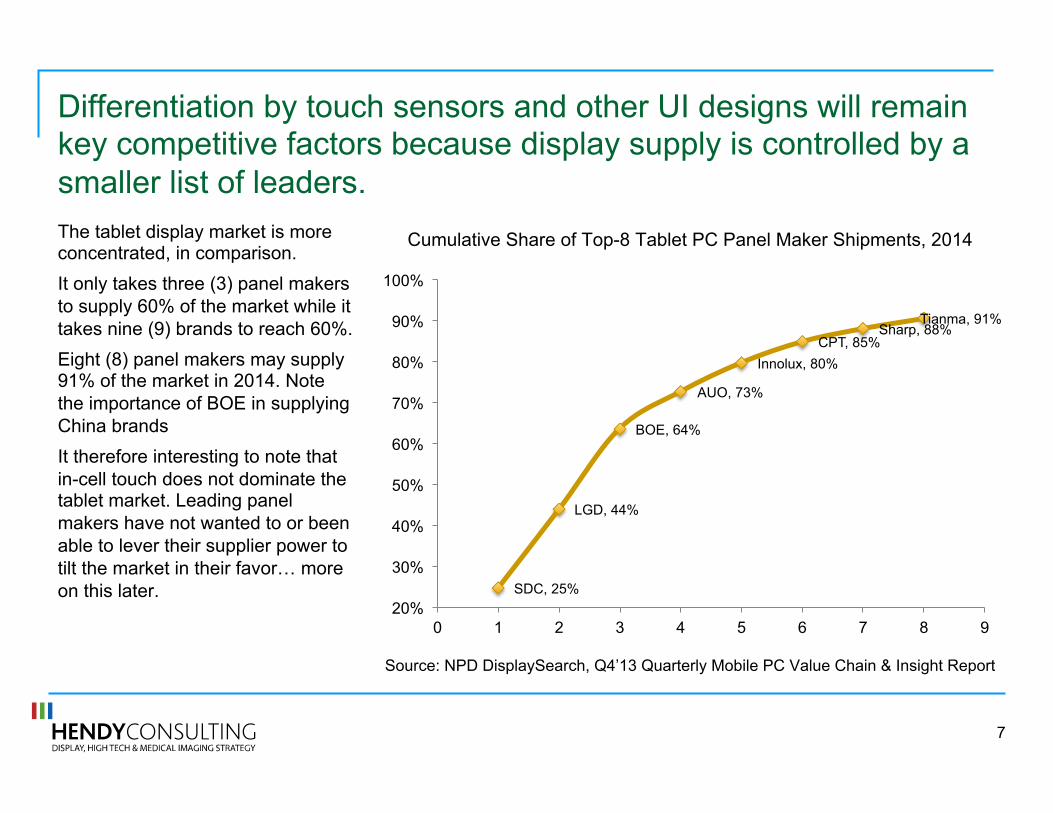
Differentiation by touch sensors and other UI designs will remain key competitive factors because display supply is controlled by a smaller list of leaders. The tablet display market is more concentrated, in comparison. It only takes three (3) panel makers to supply 60% of the market while it takes nine (9) brands to reach 60%. Eight (8) panel makers may supply 91% of the market in 2014. Note the importance of BOE in supplying China brands It therefore interesting to note that in-cell touch does not dominate the tablet market. Leading panel makers have not wanted to or been able to lever their supplier power to tilt the market in their favor! more on this later.
Source: NPD DisplaySearch, Q4’13 Quarterly Mobile PC Value Chain & Insight Report
Cumulative Share of Top-8 Tablet PC Panel Maker Shipments, 2014
SDC, 25%
LGD, 44%
BOE, 64%
AUO, 73%
Innolux, 80% CPT, 85%
Sharp, 88% Tianma, 91%
20%
30%
40%
50%
60%
70%
80%
90%
100%
0 1 2 3 4 5 6 7 8 9
7
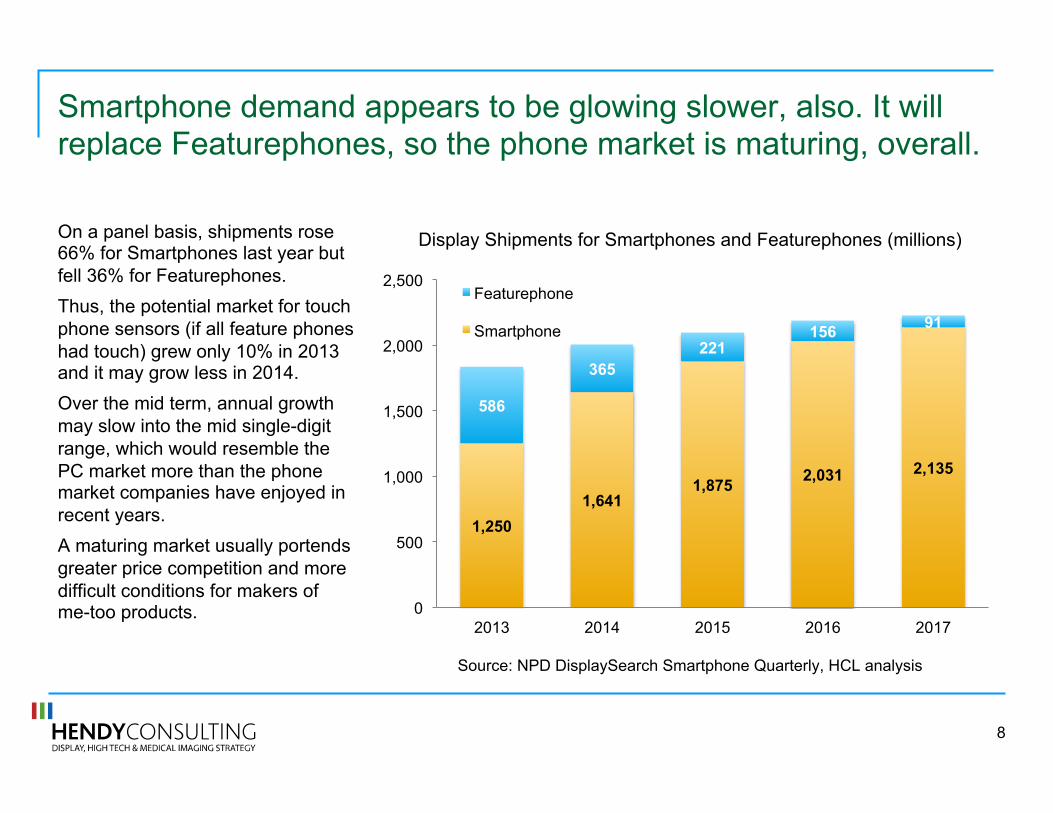
Smartphone demand appears to be glowing slower, also. It will replace Featurephones, so the phone market is maturing, overall.
On a panel basis, shipments rose 66% for Smartphones last year but fell 36% for Featurephones. Thus, the potential market for touch phone sensors (if all feature phones had touch) grew only 10% in 2013 and it may grow less in 2014. Over the mid term, annual growth may slow into the mid single-digit range, which would resemble the PC market more than the phone market companies have enjoyed in recent years. A maturing market usually portends greater price competition and more difficult conditions for makers of me-too products.
Source: NPD DisplaySearch Smartphone Quarterly, HCL analysis
Display Shipments for Smartphones and Featurephones (millions)
1,250 1,641
1,875 2,031 2,135
586
365 221
156 91
0
500
1,000
1,500
2,000
2,500
2013 2014 2015 2016 2017
Featurephone
Smartphone
8
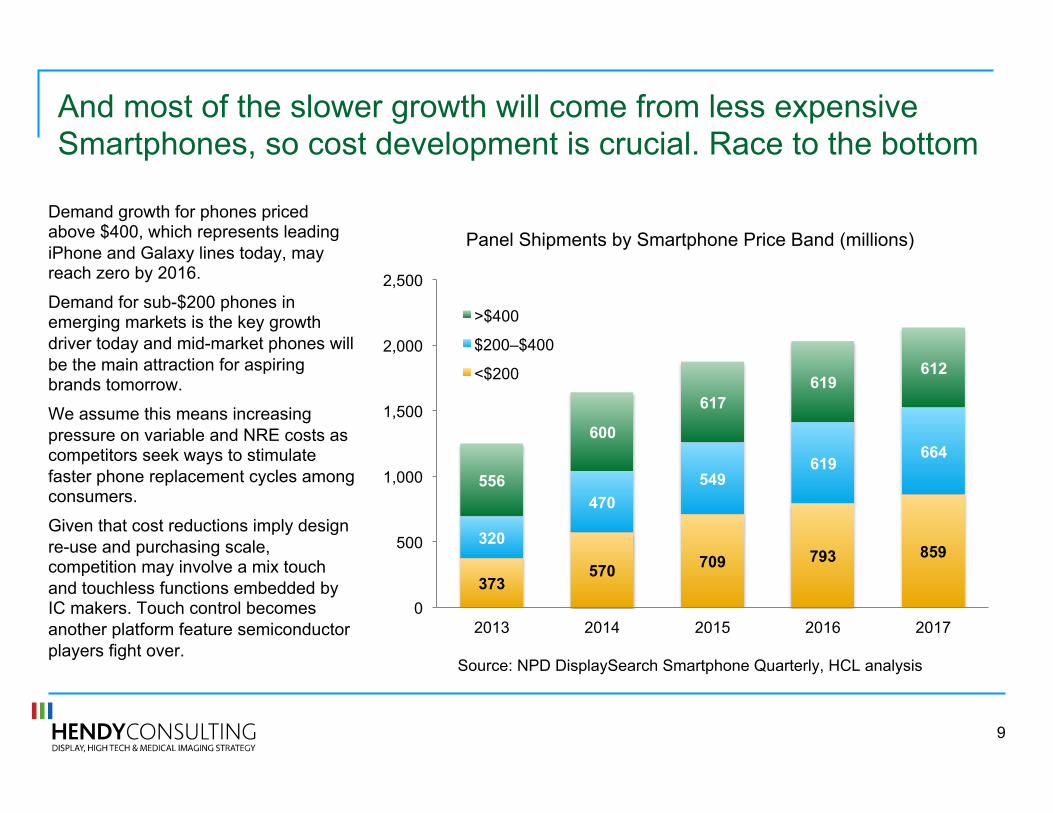
And most of the slower growth will come from less expensive Smartphones, so cost development is crucial. Race to the bottom
Demand growth for phones priced above $400, which represents leading iPhone and Galaxy lines today, may reach zero by 2016.
Demand for sub-$200 phones in emerging markets is the key growth driver today and mid-market phones will be the main attraction for aspiring brands tomorrow.
We assume this means increasing pressure on variable and NRE costs as competitors seek ways to stimulate faster phone replacement cycles among consumers.
Given that cost reductions imply design re-use and purchasing scale, competition may involve a mix touch and touchless functions embedded by IC makers. Touch control becomes another platform feature semiconductor players fight over.
Source: NPD DisplaySearch Smartphone Quarterly, HCL analysis
Panel Shipments by Smartphone Price Band (millions)
373 570 709 793 859
320
470 549
619 664
556
600
617 619
612
0
500
1,000
1,500
2,000
2,500
2013 2014 2015 2016 2017
>$400
$200–$400
<$200
9
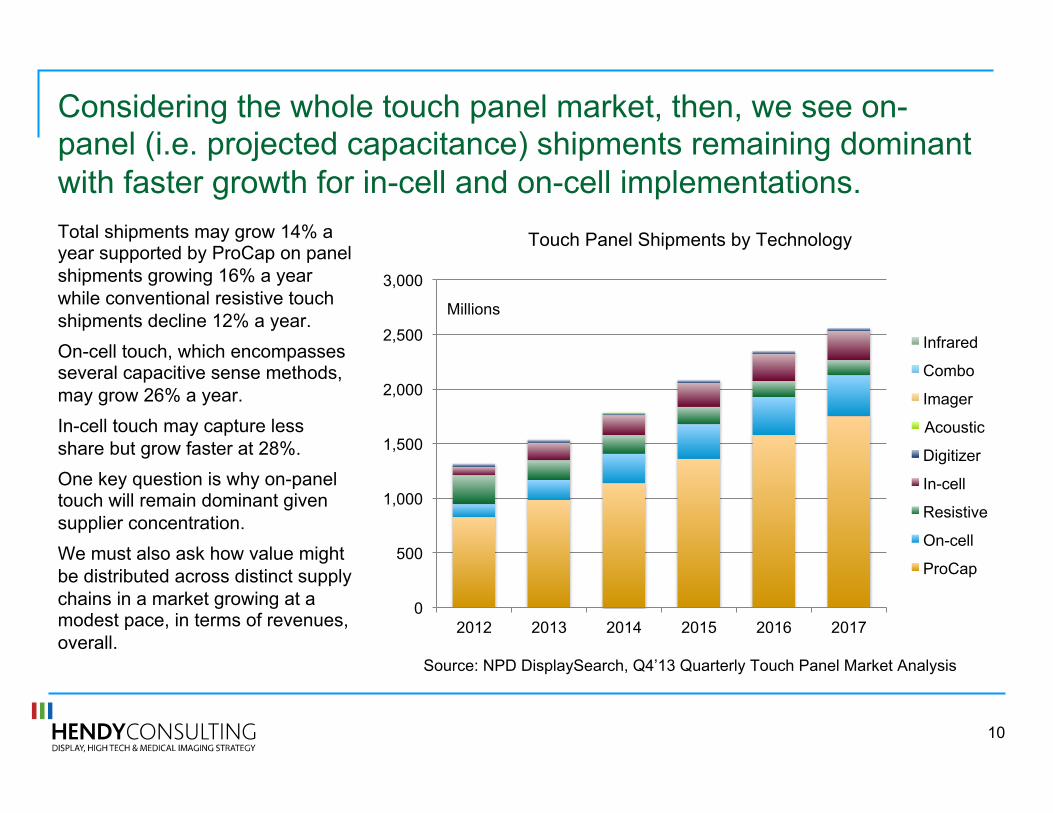
Considering the whole touch panel market, then, we see on-panel (i.e. projected capacitance) shipments remaining dominant with faster growth for in-cell and on-cell implementations. Total shipments may grow 14% a year supported by ProCap on panel shipments growing 16% a year while conventional resistive touch shipments decline 12% a year. On-cell touch, which encompasses several capacitive sense methods, may grow 26% a year. In-cell touch may capture less share but grow faster at 28%. One key question is why on-panel touch will remain dominant given supplier concentration. We must also ask how value might be distributed across distinct supply chains in a market growing at a modest pace, in terms of revenues, overall.
Source: NPD DisplaySearch, Q4’13 Quarterly Touch Panel Market Analysis
Touch Panel Shipments by Technology
0
500
1,000
1,500
2,000
2,500
3,000
2012 2013 2014 2015 2016 2017
Infrared
Combo
Imager
Acoustic
Digitizer
In-cell
Resistive
On-cell
ProCap
Millions
10
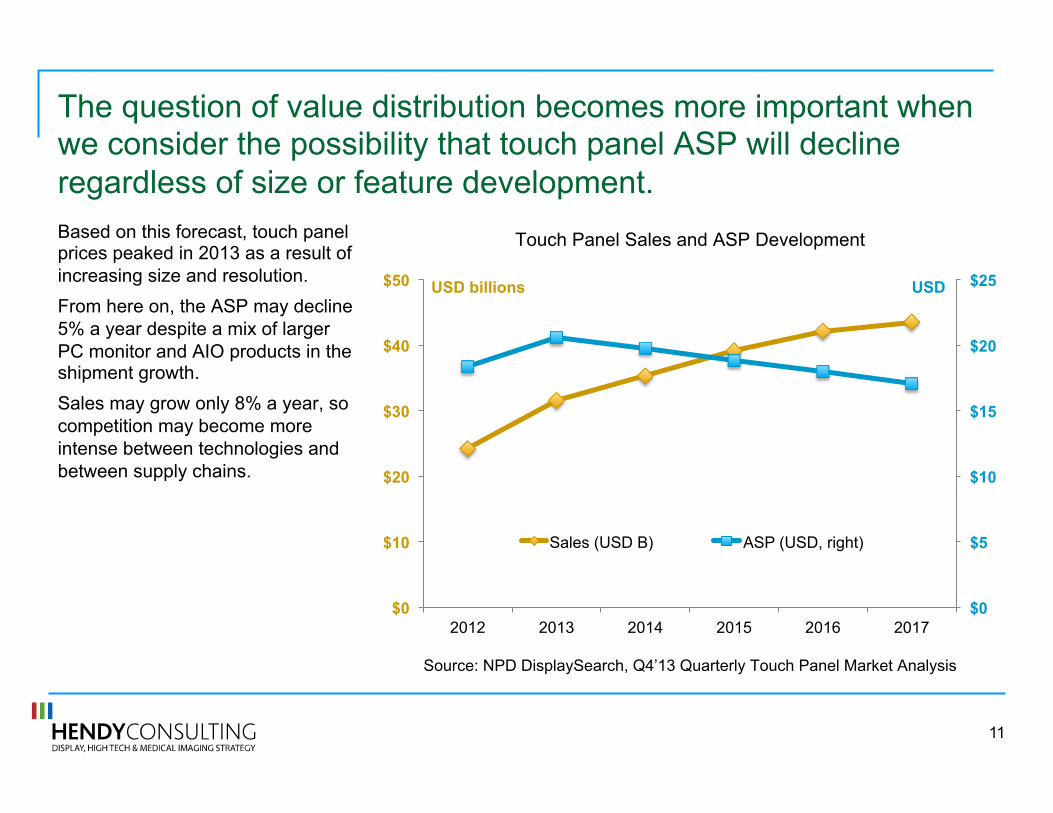
The question of value distribution becomes more important when we consider the possibility that touch panel ASP will decline regardless of size or feature development. Based on this forecast, touch panel prices peaked in 2013 as a result of increasing size and resolution. From here on, the ASP may decline 5% a year despite a mix of larger PC monitor and AIO products in the shipment growth. Sales may grow only 8% a year, so competition may become more intense between technologies and between supply chains.
Source: NPD DisplaySearch, Q4’13 Quarterly Touch Panel Market Analysis
Touch Panel Sales and ASP Development
$0
$5
$10
$15
$20
$25
$0
$10
$20
$30
$40
$50
2012 2013 2014 2015 2016 2017
Sales (USD B) ASP (USD, right)
USD billions USD
11
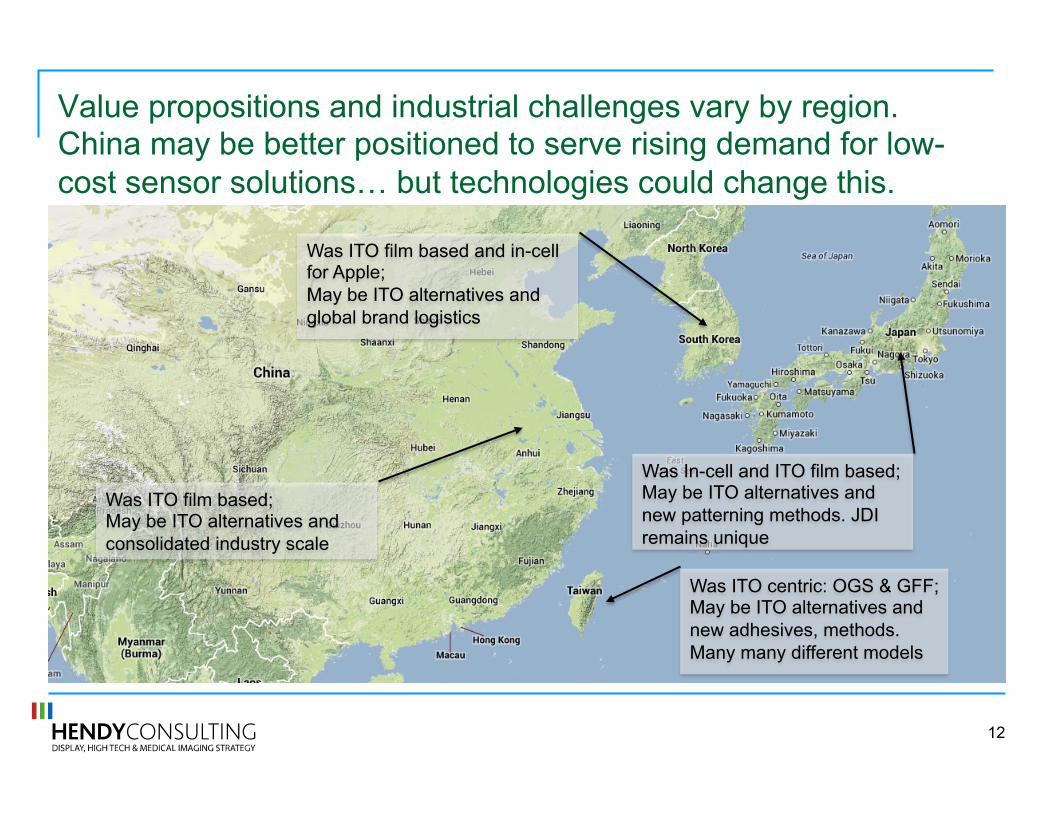
Value propositions and industrial challenges vary by region. China may be better positioned to serve rising demand for low-cost sensor solutions! but technologies could change this.
Was ITO centric: OGS & GFF; May be ITO alternatives and new adhesives, methods. Many many different models
Was In-cell and ITO film based; May be ITO alternatives and new patterning methods. JDI remains unique
Was ITO film based; May be ITO alternatives and consolidated industry scale
Was ITO film based and in-cell for Apple; May be ITO alternatives and global brand logistics
12
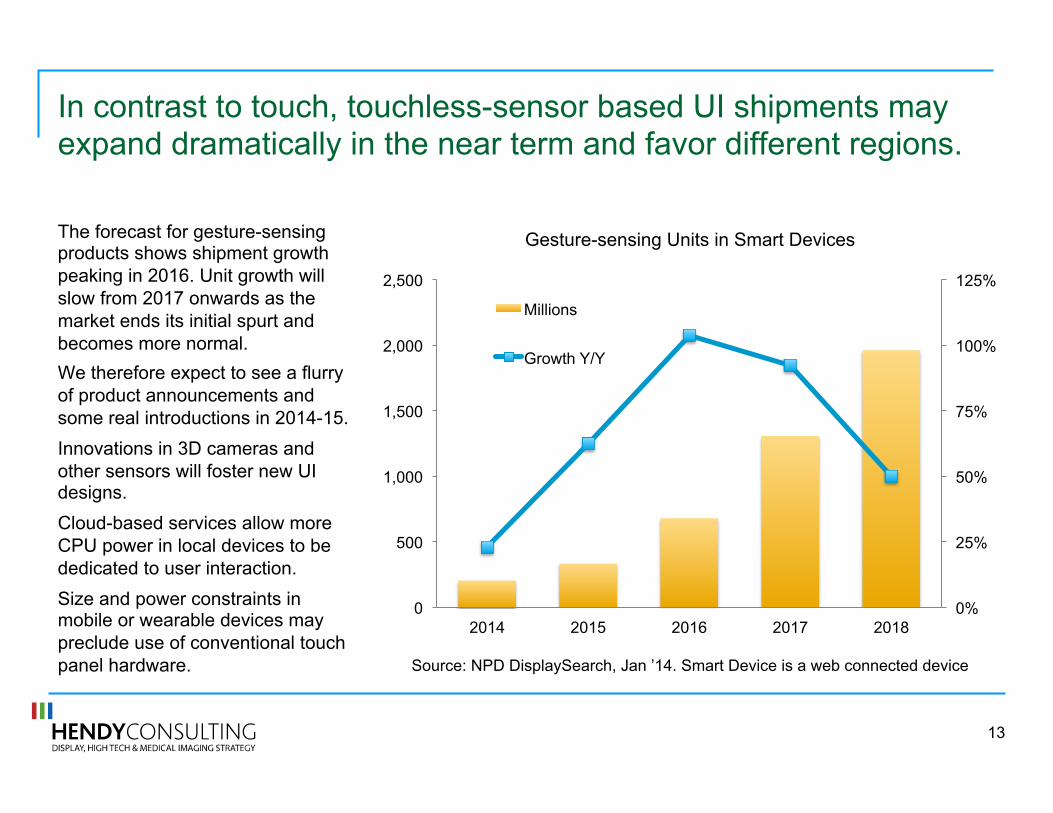
In contrast to touch, touchless-sensor based UI shipments may expand dramatically in the near term and favor different regions.
The forecast for gesture-sensing products shows shipment growth peaking in 2016. Unit growth will slow from 2017 onwards as the market ends its initial spurt and becomes more normal. We therefore expect to see a flurry of product announcements and some real introductions in 2014-15. Innovations in 3D cameras and other sensors will foster new UI designs. Cloud-based services allow more CPU power in local devices to be dedicated to user interaction. Size and power constraints in mobile or wearable devices may preclude use of conventional touch panel hardware. Source: NPD DisplaySearch, Jan ’14. Smart Device is a web connected device
Gesture-sensing Units in Smart Devices
0%
25%
50%
75%
100%
125%
0
500
1,000
1,500
2,000
2,500
2014 2015 2016 2017 2018
Millions
Growth Y/Y
13
Agenda
! Market review for touch
! Our implications and conclusions
! Positioning touch within total UI
14
Given such forecasts and observations, we come to the following conclusions that we explore next:
! Display makers may surrender more value to touch integrators and to OEM/ODM. In-cell smaller than previously considered.
! Touch-enabled notebooks may not become a major market. ! Scare tactics aside, there is no reason to assume display or sensor makers cannot get the ITO
they need to produce more panels. ! Display makers and some touch makers will stay with ITO through this decade. ! Diversity will rule the day: lots of cooks will be stirring the pot making an alphabet soup of TPS
acronyms as each strives to find a crowd-pleasing recipe they can sell. ! Diversity may lead to two substrate designs capturing share even though one substrate designs
such as GF" use less material. ! But diversity might not apply to controller chips: functional integration may lead to
commoditization or de facto standardization. Qualcomm and Intel with platforms will battle Cyprus and Synaptics who have touch controllers.
! Known Unknowns (e.g. for flex touch and hover sensing) appear however as new features and higher performance arise.
! And touchless interfaces may be the next big thing!
15
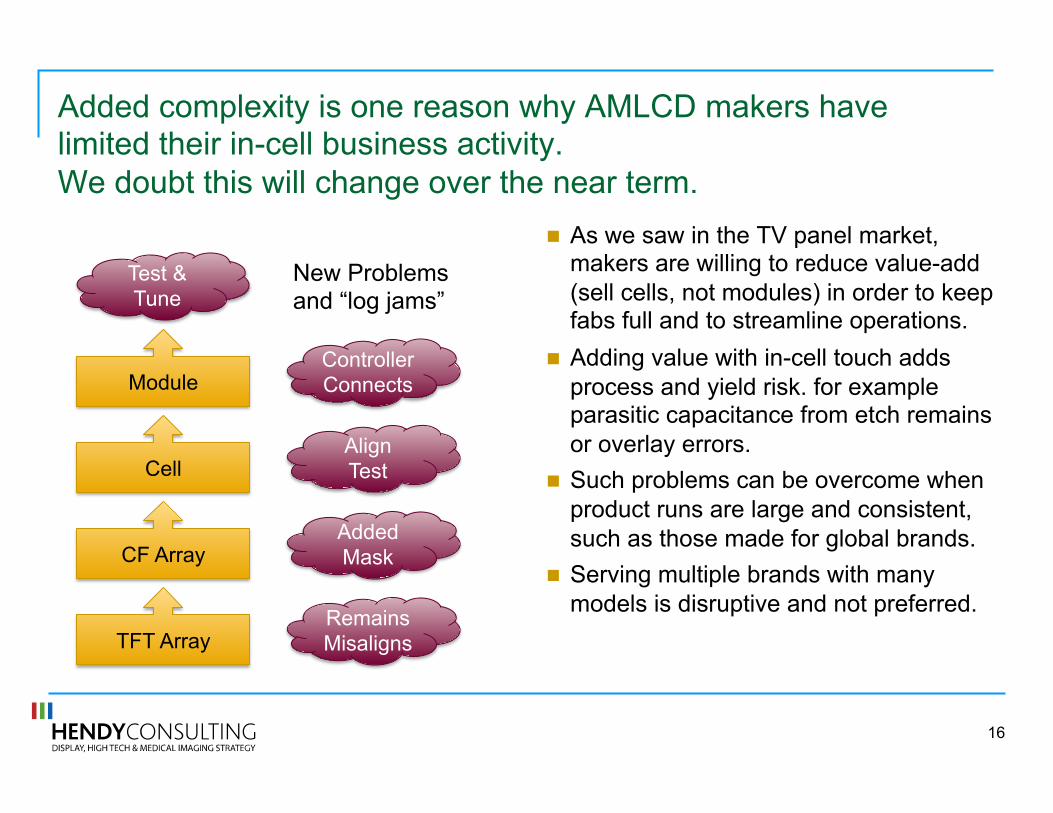
Added complexity is one reason why AMLCD makers have limited their in-cell business activity. We doubt this will change over the near term.
! As we saw in the TV panel market, makers are willing to reduce value-add (sell cells, not modules) in order to keep fabs full and to streamline operations.
! Adding value with in-cell touch adds process and yield risk. for example parasitic capacitance from etch remains or overlay errors.
! Such problems can be overcome when product runs are large and consistent, such as those made for global brands.
! Serving multiple brands with many models is disruptive and not preferred.
TFT Array
CF Array
Remains Misaligns
Added Mask
Cell
Module
Align Test
Controller Connects
Test & Tune
New Problems and “log jams”
16
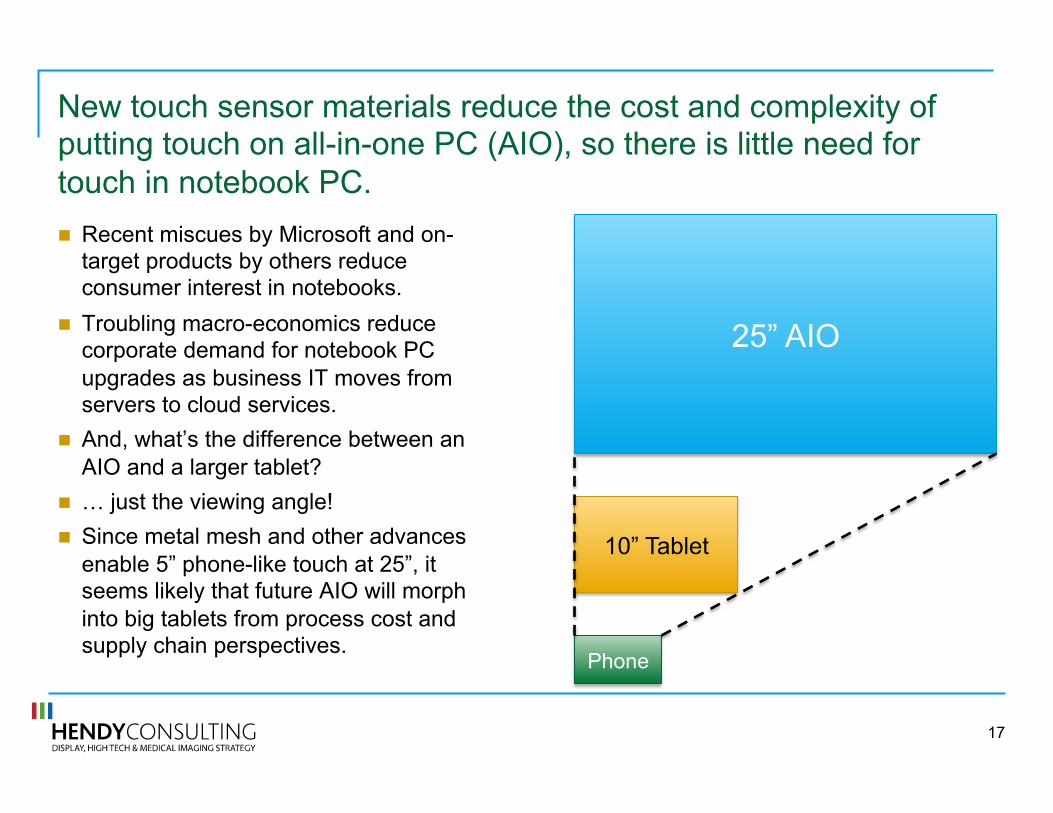
New touch sensor materials reduce the cost and complexity of putting touch on all-in-one PC (AIO), so there is little need for touch in notebook PC. ! Recent miscues by Microsoft and on-
target products by others reduce consumer interest in notebooks.
! Troubling macro-economics reduce corporate demand for notebook PC upgrades as business IT moves from servers to cloud services.
! And, what’s the difference between an AIO and a larger tablet?
! ! just the viewing angle! ! Since metal mesh and other advances
enable 5” phone-like touch at 25”, it seems likely that future AIO will morph into big tablets from process cost and supply chain perspectives.
Phone
10” Tablet
25” AIO
17
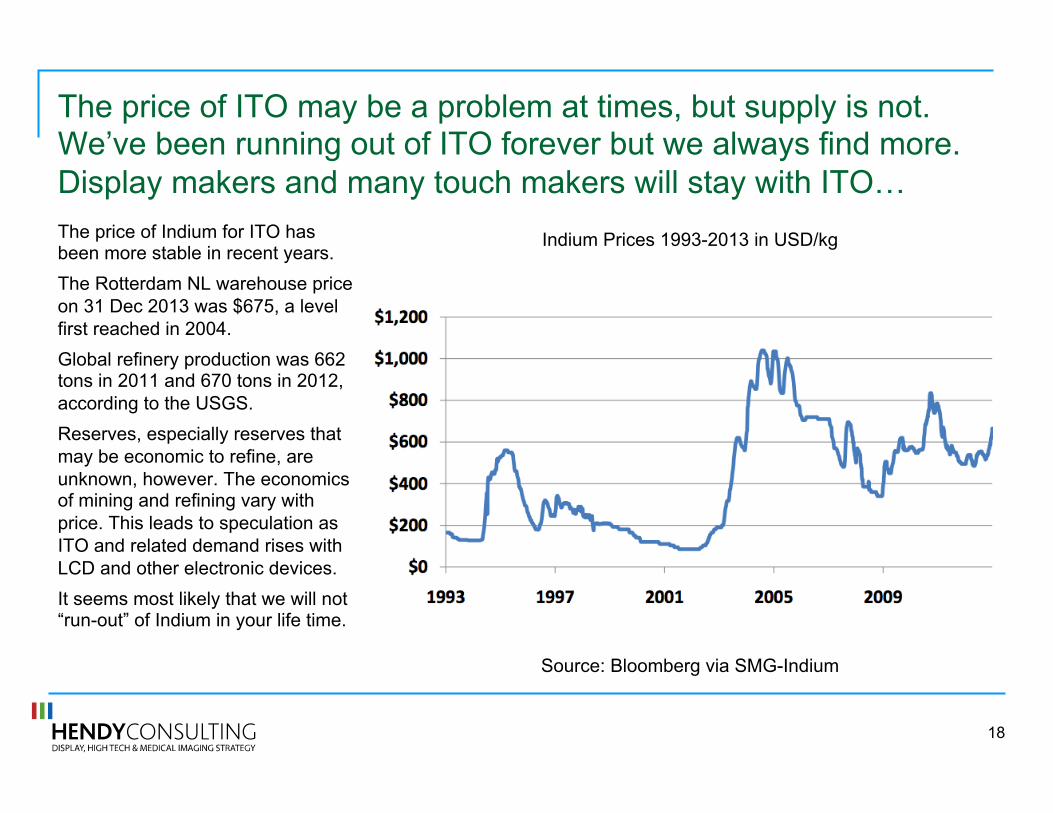
The price of ITO may be a problem at times, but supply is not. We’ve been running out of ITO forever but we always find more. Display makers and many touch makers will stay with ITO! The price of Indium for ITO has been more stable in recent years. The Rotterdam NL warehouse price on 31 Dec 2013 was $675, a level first reached in 2004. Global refinery production was 662 tons in 2011 and 670 tons in 2012, according to the USGS. Reserves, especially reserves that may be economic to refine, are unknown, however. The economics of mining and refining vary with price. This leads to speculation as ITO and related demand rises with LCD and other electronic devices. It seems most likely that we will not “run-out” of Indium in your life time.
Source: Bloomberg via SMG-Indium
Indium Prices 1993-2013 in USD/kg
18
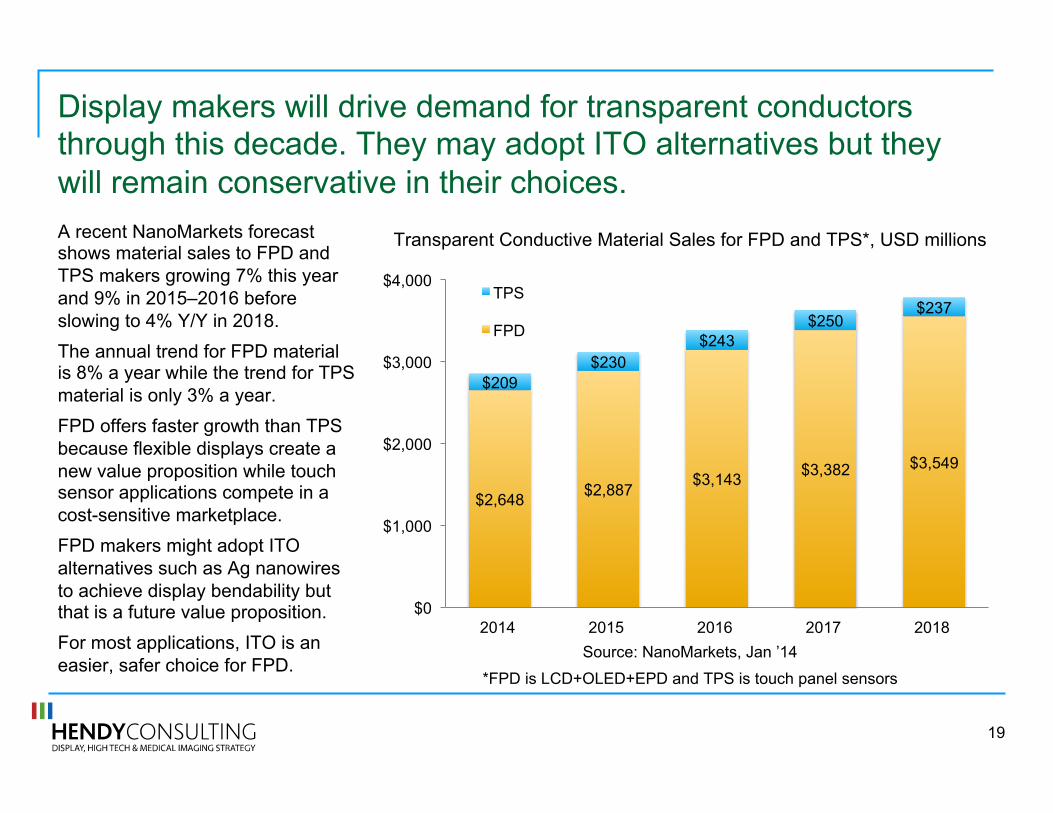
Display makers will drive demand for transparent conductors through this decade. They may adopt ITO alternatives but they will remain conservative in their choices. A recent NanoMarkets forecast shows material sales to FPD and TPS makers growing 7% this year and 9% in 2015–2016 before slowing to 4% Y/Y in 2018. The annual trend for FPD material is 8% a year while the trend for TPS material is only 3% a year. FPD offers faster growth than TPS because flexible displays create a new value proposition while touch sensor applications compete in a cost-sensitive marketplace. FPD makers might adopt ITO alternatives such as Ag nanowires to achieve display bendability but that is a future value proposition. For most applications, ITO is an easier, safer choice for FPD.
Source: NanoMarkets, Jan ’14
*FPD is LCD+OLED+EPD and TPS is touch panel sensors
Transparent Conductive Material Sales for FPD and TPS*, USD millions
$2,648 $2,887 $3,143 $3,382 $3,549
$209 $230
$243 $250
$237
$0
$1,000
$2,000
$3,000
$4,000
2014 2015 2016 2017 2018
TPS
FPD
19
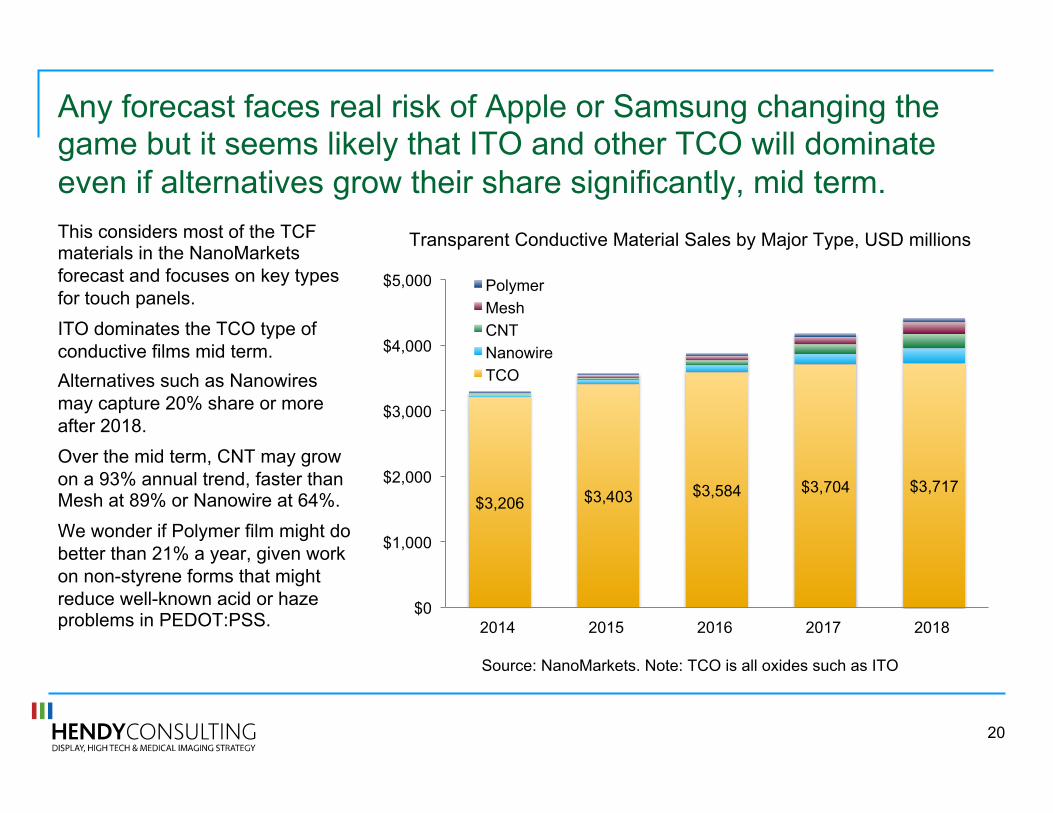
Any forecast faces real risk of Apple or Samsung changing the game but it seems likely that ITO and other TCO will dominate even if alternatives grow their share significantly, mid term. This considers most of the TCF materials in the NanoMarkets forecast and focuses on key types for touch panels. ITO dominates the TCO type of conductive films mid term. Alternatives such as Nanowires may capture 20% share or more after 2018. Over the mid term, CNT may grow on a 93% annual trend, faster than Mesh at 89% or Nanowire at 64%. We wonder if Polymer film might do better than 21% a year, given work on non-styrene forms that might reduce well-known acid or haze problems in PEDOT:PSS.
Source: NanoMarkets. Note: TCO is all oxides such as ITO
Transparent Conductive Material Sales by Major Type, USD millions
$3,206 $3,403 $3,584 $3,704 $3,717
$0
$1,000
$2,000
$3,000
$4,000
$5,000
2014 2015 2016 2017 2018
Polymer Mesh CNT Nanowire TCO
20
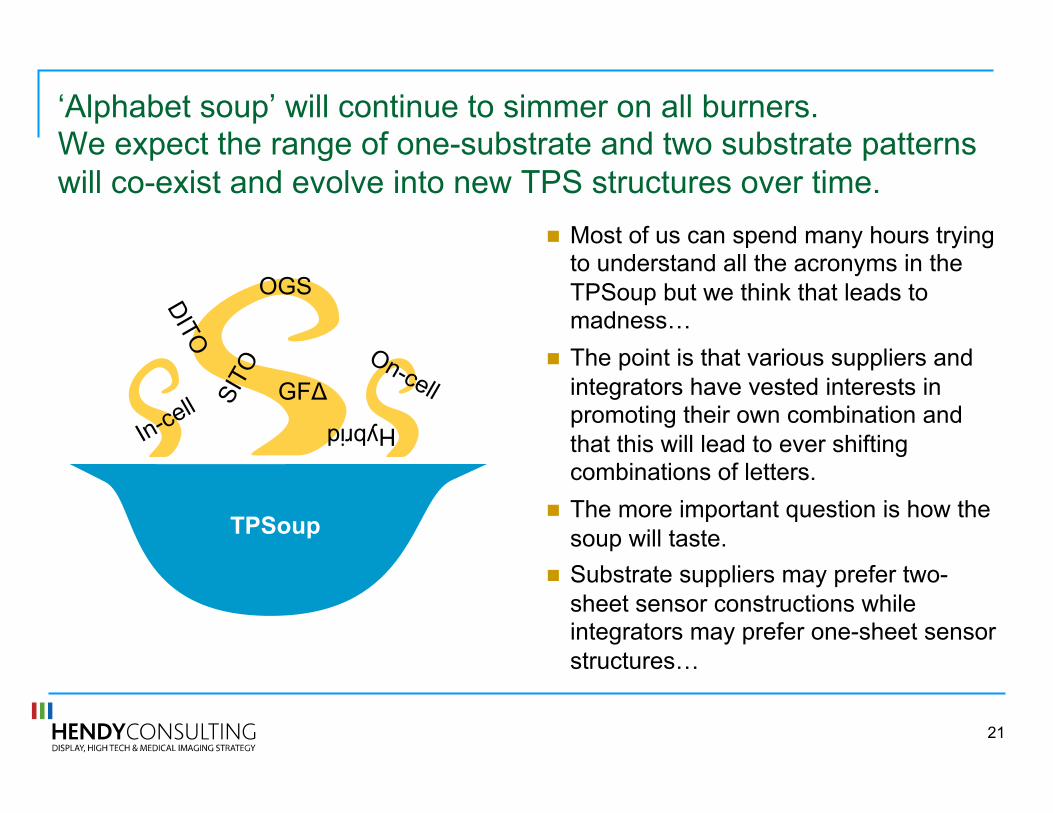
‘Alphabet soup’ will continue to simmer on all burners. We expect the range of one-substrate and two substrate patterns will co-exist and evolve into new TPS structures over time.
! Most of us can spend many hours trying to understand all the acronyms in the TPSoup but we think that leads to madness!
! The point is that various suppliers and integrators have vested interests in promoting their own combination and that this will lead to ever shifting combinations of letters.
! The more important question is how the soup will taste.
! Substrate suppliers may prefer two-sheet sensor constructions while integrators may prefer one-sheet sensor structures!
OGS
GF" Hybrid
TPSoup
21
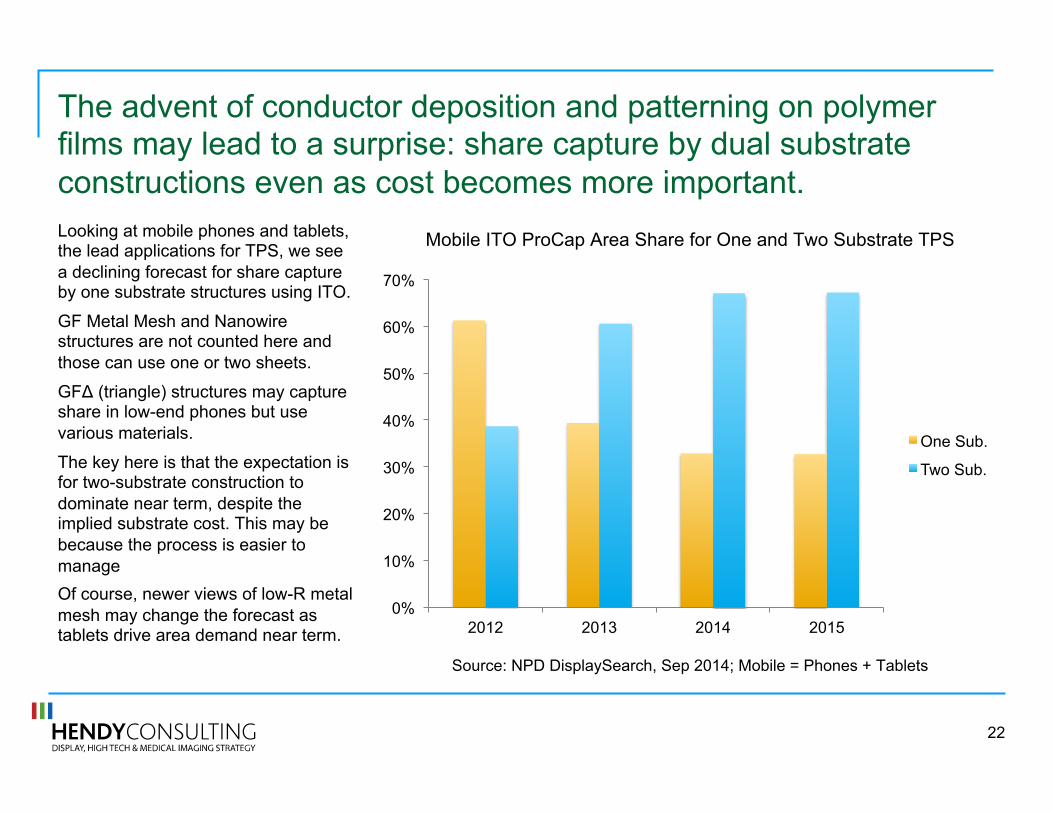
The advent of conductor deposition and patterning on polymer films may lead to a surprise: share capture by dual substrate constructions even as cost becomes more important. Looking at mobile phones and tablets, the lead applications for TPS, we see a declining forecast for share capture by one substrate structures using ITO.
GF Metal Mesh and Nanowire structures are not counted here and those can use one or two sheets.
GF" (triangle) structures may capture share in low-end phones but use various materials.
The key here is that the expectation is for two-substrate construction to dominate near term, despite the implied substrate cost. This may be because the process is easier to manage Of course, newer views of low-R metal mesh may change the forecast as tablets drive area demand near term.
Source: NPD DisplaySearch, Sep 2014; Mobile = Phones + Tablets
Mobile ITO ProCap Area Share for One and Two Substrate TPS
0%
10%
20%
30%
40%
50%
60%
70%
2012 2013 2014 2015
One Sub.
Two Sub.
22
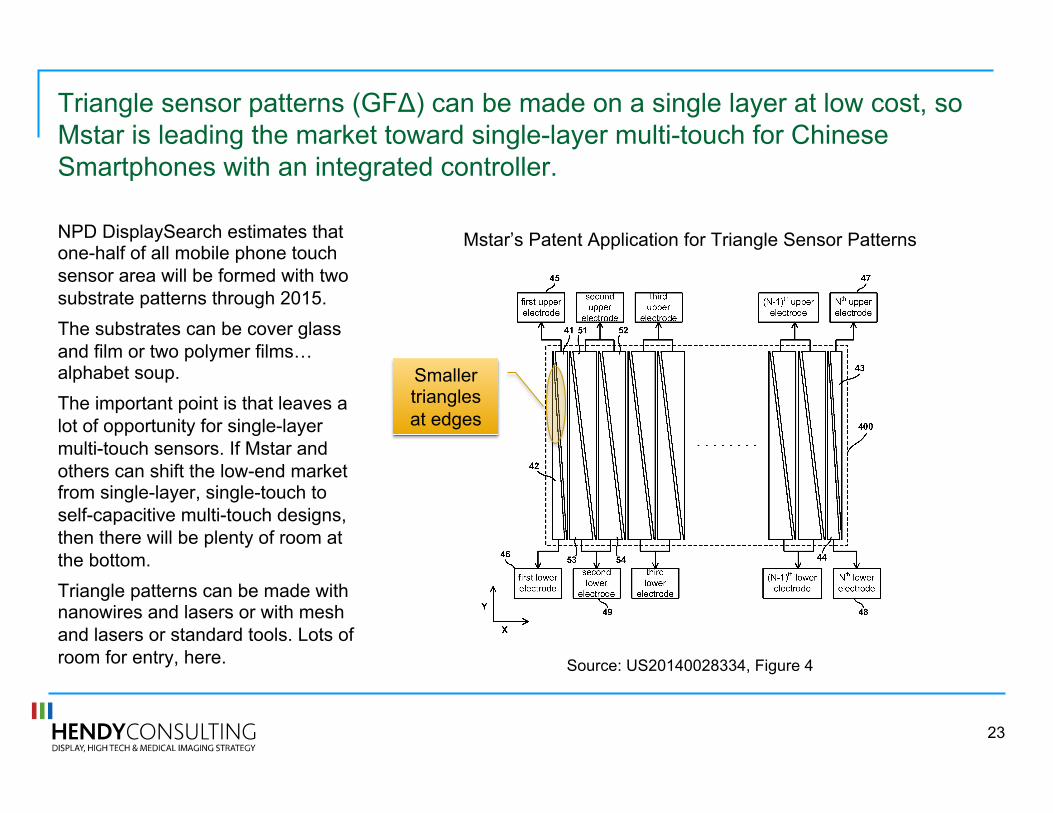
Triangle sensor patterns (GF") can be made on a single layer at low cost, so Mstar is leading the market toward single-layer multi-touch for Chinese Smartphones with an integrated controller.
NPD DisplaySearch estimates that one-half of all mobile phone touch sensor area will be formed with two substrate patterns through 2015. The substrates can be cover glass and film or two polymer films! alphabet soup. The important point is that leaves a lot of opportunity for single-layer multi-touch sensors. If Mstar and others can shift the low-end market from single-layer, single-touch to self-capacitive multi-touch designs, then there will be plenty of room at the bottom. Triangle patterns can be made with nanowires and lasers or with mesh and lasers or standard tools. Lots of room for entry, here. Source: US20140028334, Figure 4
Mstar’s Patent Application for Triangle Sensor Patterns
Smaller triangles at edges
23
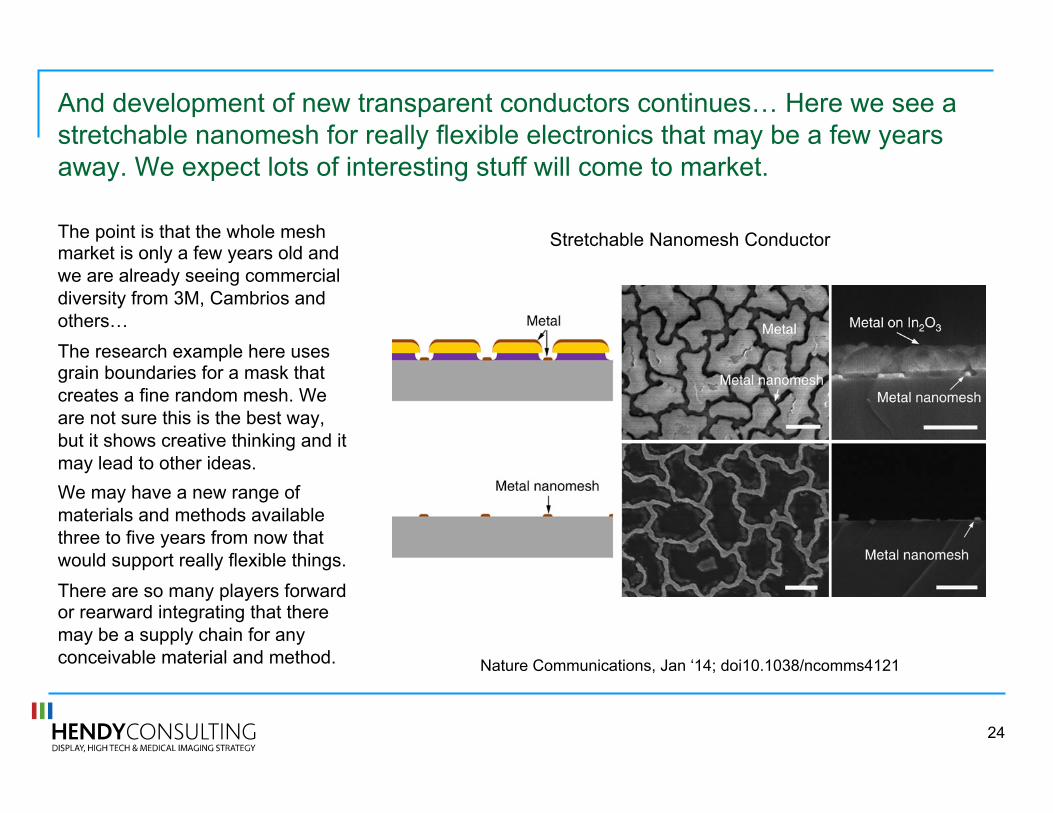
And development of new transparent conductors continues! Here we see a stretchable nanomesh for really flexible electronics that may be a few years away. We expect lots of interesting stuff will come to market.
The point is that the whole mesh market is only a few years old and we are already seeing commercial diversity from 3M, Cambrios and others! The research example here uses grain boundaries for a mask that creates a fine random mesh. We are not sure this is the best way, but it shows creative thinking and it may lead to other ideas. We may have a new range of materials and methods available three to five years from now that would support really flexible things. There are so many players forward or rearward integrating that there may be a supply chain for any conceivable material and method. Nature Communications, Jan ‘14; doi10.1038/ncomms4121
Stretchable Nanomesh Conductor
24
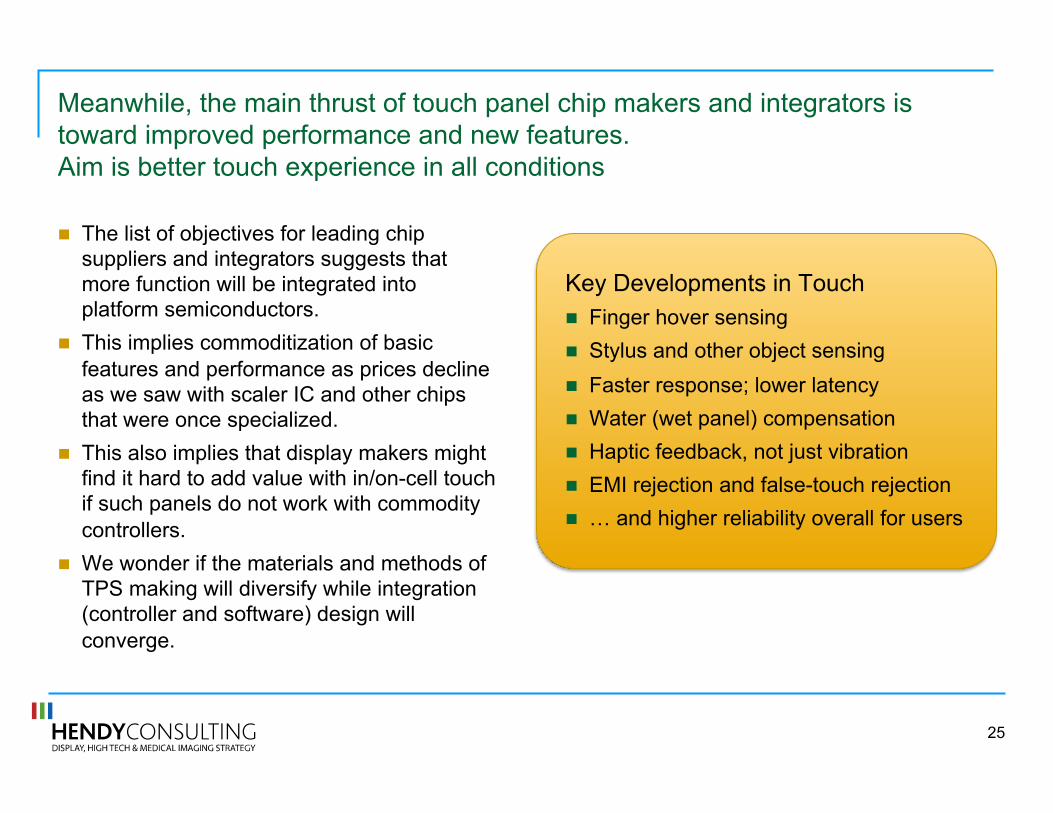
Meanwhile, the main thrust of touch panel chip makers and integrators is toward improved performance and new features. Aim is better touch experience in all conditions
! The list of objectives for leading chip suppliers and integrators suggests that more function will be integrated into platform semiconductors.
! This implies commoditization of basic features and performance as prices decline as we saw with scaler IC and other chips that were once specialized.
! This also implies that display makers might find it hard to add value with in/on-cell touch if such panels do not work with commodity controllers.
! We wonder if the materials and methods of TPS making will diversify while integration (controller and software) design will converge.
Key Developments in Touch ! Finger hover sensing ! Stylus and other object sensing ! Faster response; lower latency ! Water (wet panel) compensation ! Haptic feedback, not just vibration ! EMI rejection and false-touch rejection ! ! and higher reliability overall for users
25
The road to new touch features runs through uncharted territory however, so we wonder about two known unknowns.
Flexible TPS? ! In our mind, the problem of sensing and
rejecting the right signals on a curved or bendy surface is similar to the problem of compensating for EMI, temperature, humidity and such.
! If so, meeting consumer expectations of touch on a flexible display might be quite difficult.
! We have seen little mention of potential solutions beyond an Atmel-Canatu 3D curved surface demonstrator.
! We consider this a known unknown.
Hover Sensing IP? ! Our reading on the subject of hover sensing
suggests that these involve measuring self and mutual capacitance.
! It looks like Cypress owns key IP on this method (US patent 8358142).
! If so, we wonder how Cypress will act once hover features come to market.
! Will others find ways around the IP? ! We consider this a known unknown.
26
But we think off-panel interfaces will become more important in flexible electronics. They may combine with touch sensors to enable new value propositions in the next three years. Touchless Interface Technologies ! 3D or time-of-flight imagers on front of
mobile devices or monitors – Eye tracking – Emotion sensing (e.g. facial flush
response) ! Long-range (say up to 6 inches or more)
capacitive sensors from Fogale and others ! Bluetooth-linked muscle sensors or other
force/position sensors ! IR imagers such as Leap ! Multi-axis sensors for heart rate, sweat
(blood chemistry) and such ! ! in combination with conventional touch
interfaces create more value
Recent News of Note ! Sony buys Renesas fab to handle new
demand for CMOS imagers from Apple ! Infineon and pmdtechnologies join forces in
3D imagers ! Camera makers thrashing about in search of
defensible market segments ! FLIR Systems introduces a low-cost IR
imager core ! Leap improves IR sensing software ! Intel talks up integrated imaging IC at CES!
and many other introductions by other companies, large and small
27
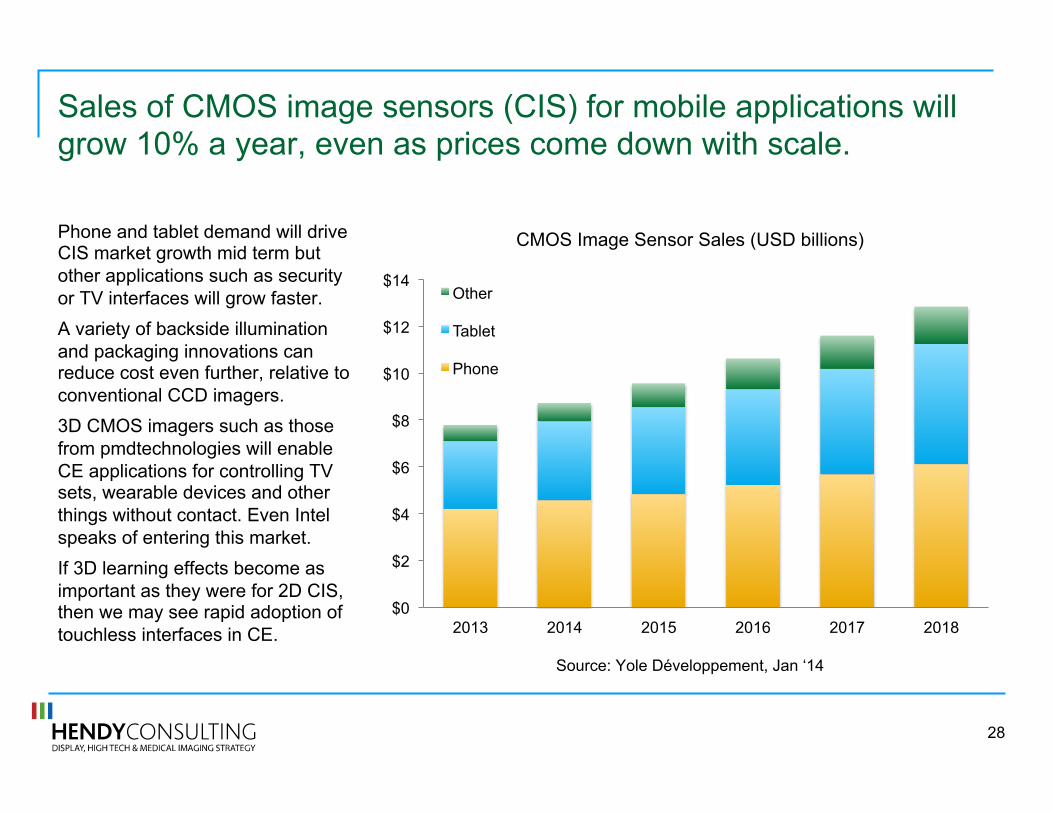
Sales of CMOS image sensors (CIS) for mobile applications will grow 10% a year, even as prices come down with scale.
Phone and tablet demand will drive CIS market growth mid term but other applications such as security or TV interfaces will grow faster. A variety of backside illumination and packaging innovations can reduce cost even further, relative to conventional CCD imagers. 3D CMOS imagers such as those from pmdtechnologies will enable CE applications for controlling TV sets, wearable devices and other things without contact. Even Intel speaks of entering this market. If 3D learning effects become as important as they were for 2D CIS, then we may see rapid adoption of touchless interfaces in CE.
Source: Yole Développement, Jan ‘14
CMOS Image Sensor Sales (USD billions)
$0
$2
$4
$6
$8
$10
$12
$14
2013 2014 2015 2016 2017 2018
Other
Tablet
Phone
28
Recap our conclusions from our market analysis:
! Display makers may surrender more value to touch integrators and to OEM/ODM. In-cell smaller than previously considered.
! Touch-enabled notebooks may not become a major market. ! Scare tactics aside, there is no reason to assume display or sensor makers cannot get the ITO
they need to produce more panels. ! Display makers and some touch makers will stay with ITO through this decade. ! Diversity will rule the day: lots of cooks will be stirring the pot making an alphabet soup of TPS
acronyms as each strives to find a crowd-pleasing recipe they can sell. ! Diversity may lead to two substrate designs capturing share even though one substrate designs
such as GF" use less material. ! But diversity might not apply to controller chips: functional integration may lead to
commoditization or de facto standardization. Qualcomm and Intel with platforms will battle Cyprus and Synaptics who have touch controllers.
! Known Unknowns (e.g. for flex touch and hover sensing) appear however as new features and higher performance arise.
! And touchless interfaces may be the next big thing!
29
Agenda
! Market review for touch
! Our implications and conclusions
! Positioning touch within total UI
30
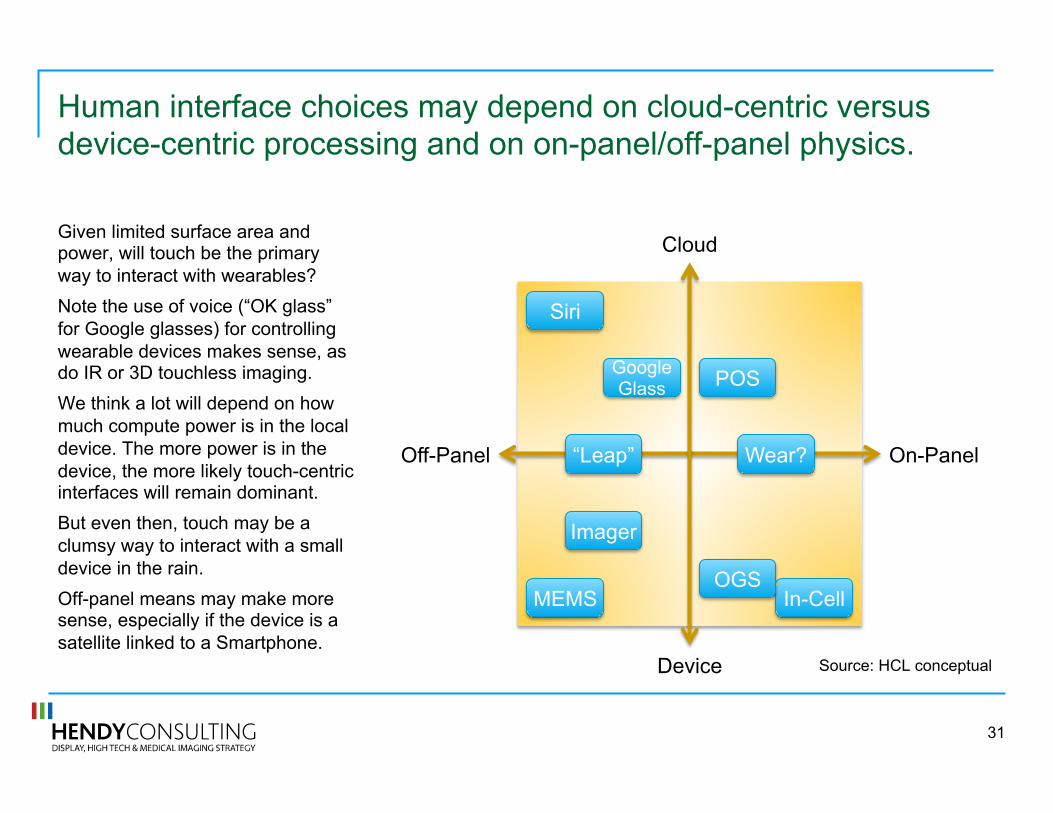
Human interface choices may depend on cloud-centric versus device-centric processing and on on-panel/off-panel physics.
Given limited surface area and power, will touch be the primary way to interact with wearables? Note the use of voice (“OK glass” for Google glasses) for controlling wearable devices makes sense, as do IR or 3D touchless imaging. We think a lot will depend on how much compute power is in the local device. The more power is in the device, the more likely touch-centric interfaces will remain dominant. But even then, touch may be a clumsy way to interact with a small device in the rain. Off-panel means may make more sense, especially if the device is a satellite linked to a Smartphone.
Cloud
Device
Off-Panel On-Panel
In-Cell OGS
MEMS
Wear? “Leap”
Imager
GoogleGlass
Siri
Source: HCL conceptual
POS
31
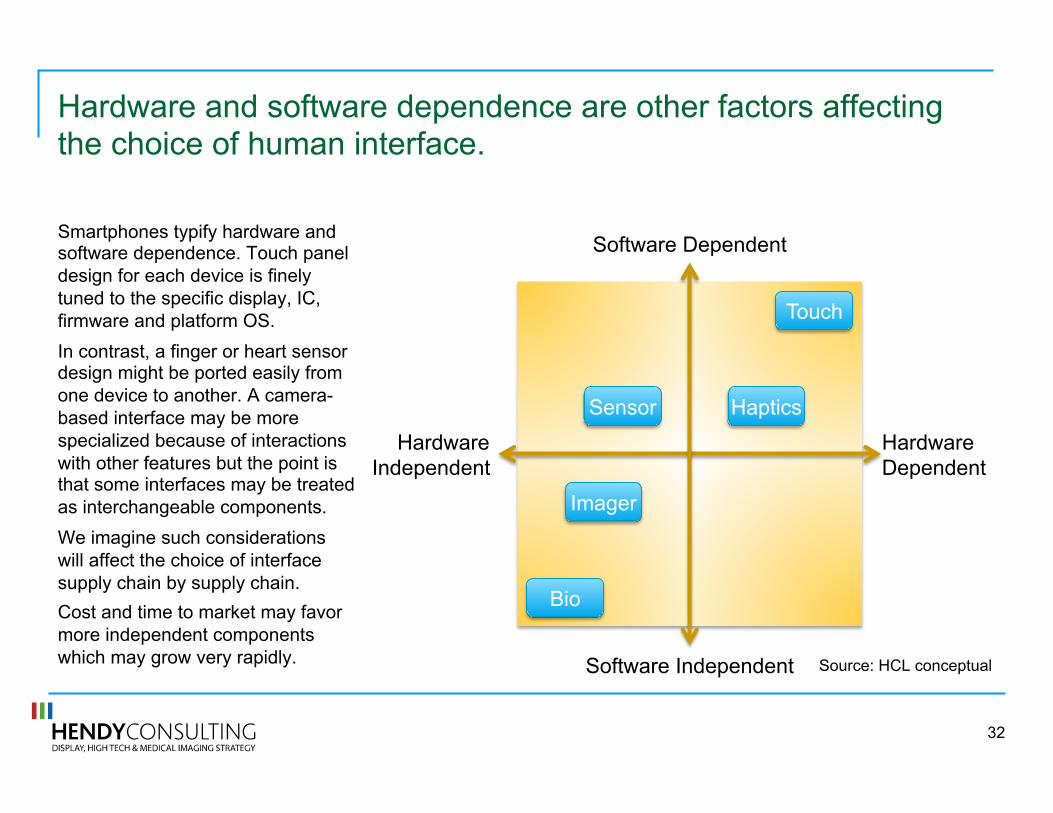
Hardware and software dependence are other factors affecting the choice of human interface.
Smartphones typify hardware and software dependence. Touch panel design for each device is finely tuned to the specific display, IC, firmware and platform OS. In contrast, a finger or heart sensor design might be ported easily from one device to another. A camera-based interface may be more specialized because of interactions with other features but the point is that some interfaces may be treated as interchangeable components. We imagine such considerations will affect the choice of interface supply chain by supply chain. Cost and time to market may favor more independent components which may grow very rapidly.
Software Dependent
Software Independent
Hardware Independent
Hardware Dependent
Bio
Haptics Sensor
Imager
Source: HCL conceptual
Touch
32
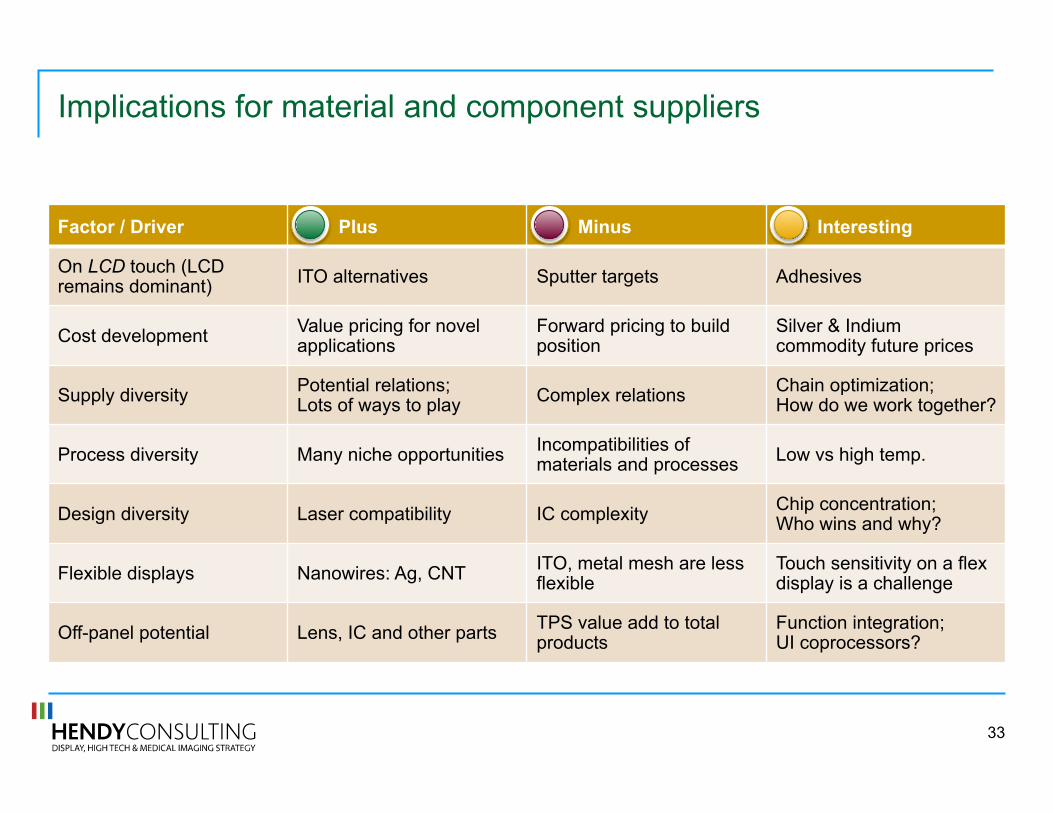
Implications for material and component suppliers
Factor / Driver Plus Minus Interesting
On LCD touch (LCD remains dominant) ITO alternatives Sputter targets Adhesives
Cost development Value pricing for novel applications
Forward pricing to build position
Silver & Indium commodity future prices
Supply diversity Potential relations; Lots of ways to play Complex relations Chain optimization;
How do we work together?
Process diversity Many niche opportunities Incompatibilities of materials and processes Low vs high temp.
Design diversity Laser compatibility IC complexity Chip concentration; Who wins and why?
Flexible displays Nanowires: Ag, CNT ITO, metal mesh are less flexible
Touch sensitivity on a flex display is a challenge
Off-panel potential Lens, IC and other parts TPS value add to total products
Function integration; UI coprocessors?
33
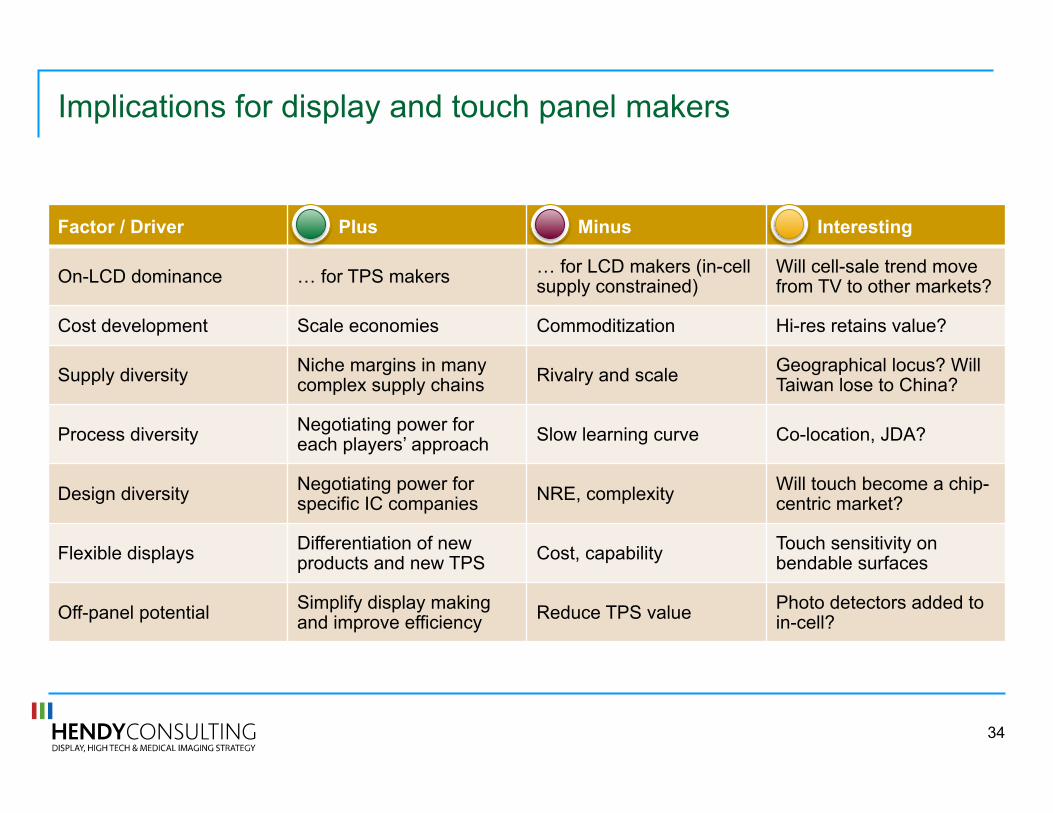
Implications for display and touch panel makers
Factor / Driver Plus Minus Interesting
On-LCD dominance ! for TPS makers ! for LCD makers (in-cell supply constrained)
Will cell-sale trend move from TV to other markets?
Cost development Scale economies Commoditization Hi-res retains value?
Supply diversity Niche margins in many complex supply chains Rivalry and scale Geographical locus? Will
Taiwan lose to China?
Process diversity Negotiating power for each players’ approach Slow learning curve Co-location, JDA?
Design diversity Negotiating power for specific IC companies NRE, complexity Will touch become a chip-
centric market?
Flexible displays Differentiation of new products and new TPS Cost, capability Touch sensitivity on
bendable surfaces
Off-panel potential Simplify display making and improve efficiency Reduce TPS value Photo detectors added to
in-cell?
34
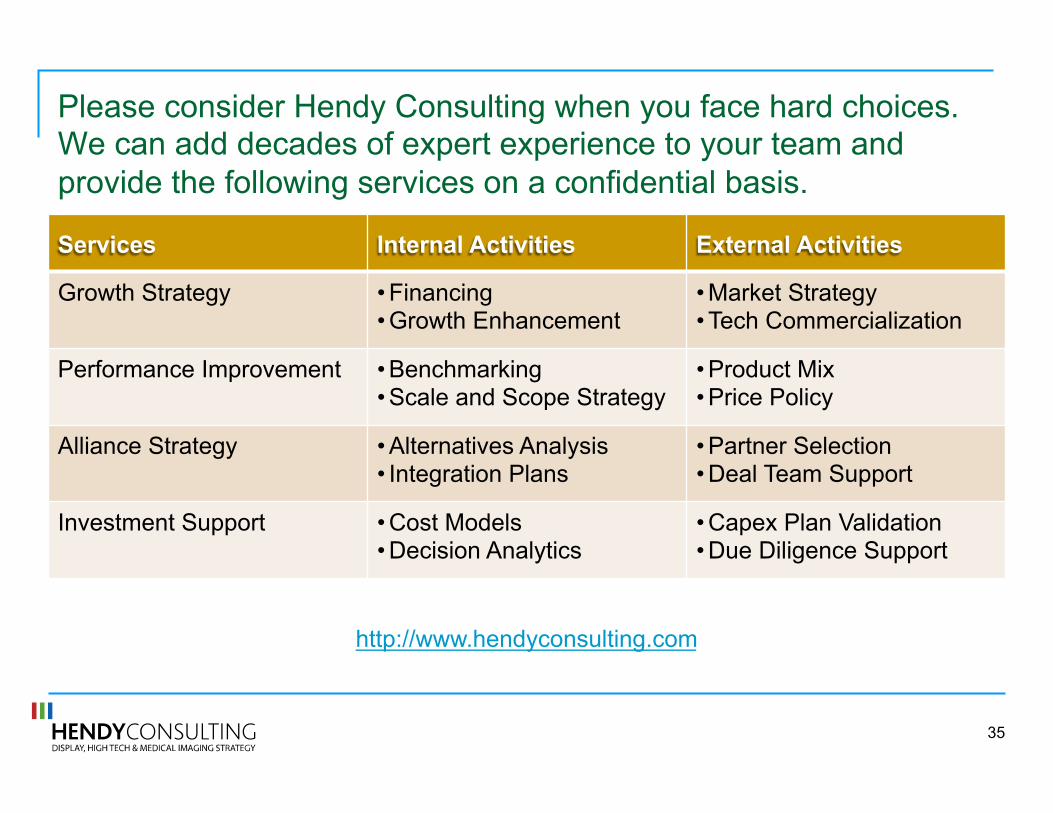
Please consider Hendy Consulting when you face hard choices. We can add decades of expert experience to your team and provide the following services on a confidential basis.
Services Internal Activities External Activities
Growth Strategy • Financing • Growth Enhancement
• Market Strategy • Tech Commercialization
Performance Improvement • Benchmarking • Scale and Scope Strategy
• Product Mix • Price Policy
Alliance Strategy • Alternatives Analysis • Integration Plans
• Partner Selection • Deal Team Support
Investment Support • Cost Models • Decision Analytics
• Capex Plan Validation • Due Diligence Support
http://www.hendyconsulting.com
35


![N.C. Nurse Aide I Curriculum · Your 5 Moments for Hand Hygiene [WHO] 1.Before touching a resident 2. Before clean/aseptic procedure 3.After body fluid exposure risk 4. After touching](https://static.fdocuments.us/doc/165x107/5fa9495e2d53cc38c4079a45/nc-nurse-aide-i-your-5-moments-for-hand-hygiene-who-1before-touching-a-resident.jpg)