
TOTVS S.A.ri.totvs.com.br/ptb/2123/TOTVS - 1 ITR 2015_ENG.pdf · (A free translation of the...
62
(A free translation of the original in Portuguese) TOTVS S.A. Quarterly information (ITR) at March 31, 2015 and report on review of quarterly information
Transcript of TOTVS S.A.ri.totvs.com.br/ptb/2123/TOTVS - 1 ITR 2015_ENG.pdf · (A free translation of the...

(A free translation of the original in Portuguese)
TOTVS S.A. Quarterly information (ITR) at March 31, 2015 and report on review of quarterly information
(A free translation of the original in Portuguese)
] Quarterly information (ITR) - 3/31/2015 - TOTVS S.A. Version: 1
Contents
Company information
Capital composition 1 Dividends 2 Parent company financial statements
Balance sheet - assets 3 Balance sheet - liabilities and equity 4 Statement of income 6 Statement of comprehensive income 7 Statement of cash flow - indirect method 8 Statement of changes in equity 1/1/2015 to 3/31/2015 9 1/1/2014 to 3/31/2014 10 Statement of value added 11
Consolidated financial statements
Balance sheet - assets 12 Balance sheet - liabilities and equity 13 Statement of income 15 Statement of comprehensive income 16 Statement of cash flow - indirect method 17 Statement of changes in equity 1/1/2015 to 3/31/2015 18 1/1/2014 to 3/31/2014 19 Statement of value added 20 Comments on performance 21
Notes 29 Opinions and statements Report on review of interim quarterly financial information 59
(A free translation of the original in Portuguese)
1
Quarterly information (ITR) - 3/31/2015 - TOTVS S.A. Version: 1
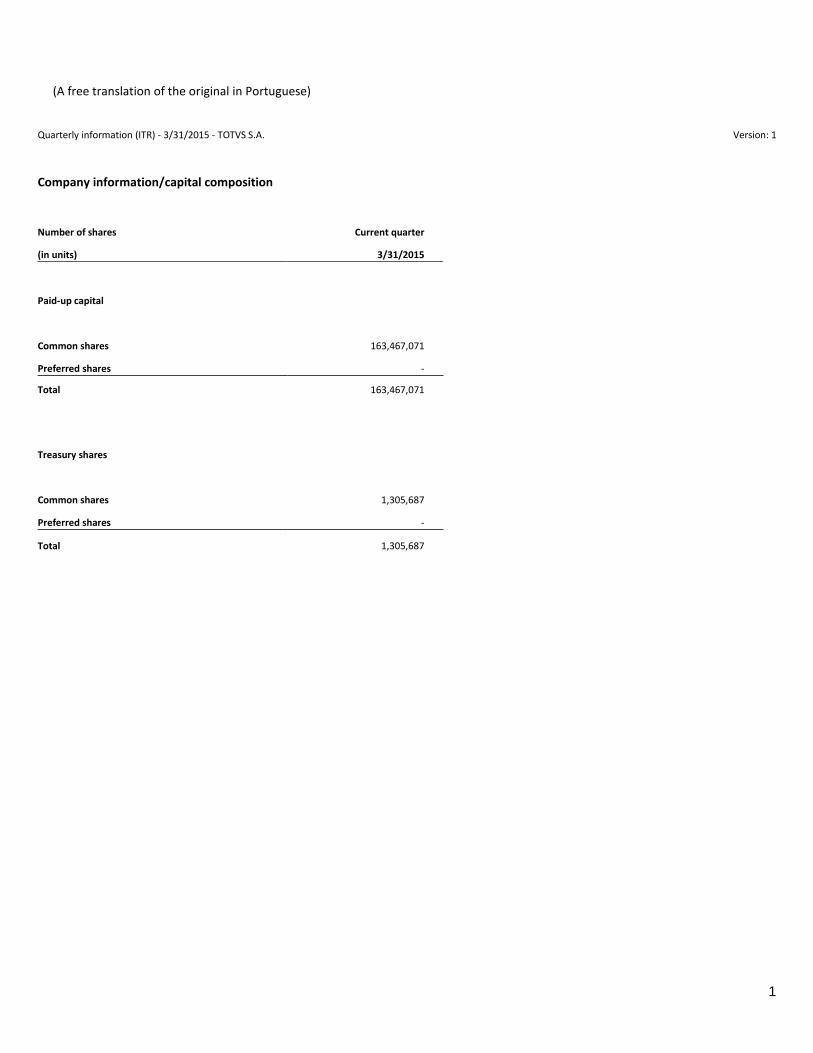
Company information/capital composition
Number of shares Current quarter
(in units) 3/31/2015
Paid-up capital
Common shares 163,467,071
Preferred shares -
Total 163,467,071 Treasury shares
Common shares 1,305,687
Preferred shares -
Total 1,305,687
(A free translation of the original in Portuguese)
2
Quarterly information (ITR) - 3/31/2015 - TOTVS S.A. Version: 1
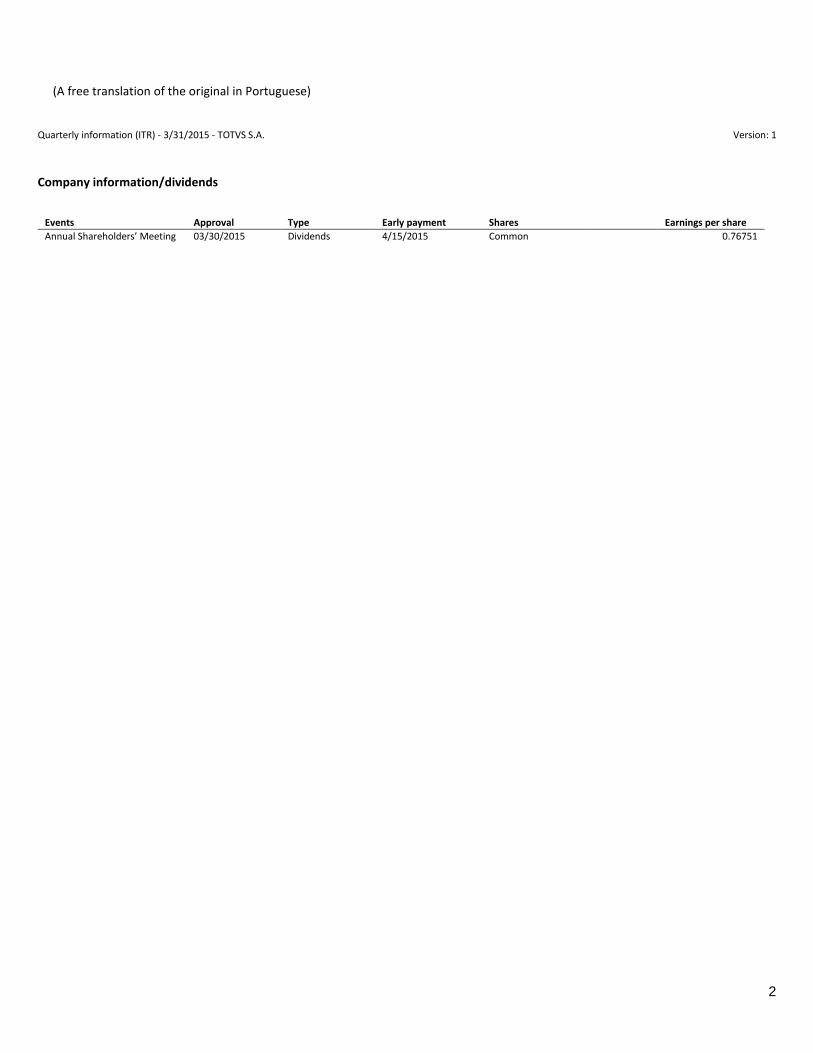
Company information/dividends
Events Approval Type Early payment Shares Earnings per share
Annual Shareholders’ Meeting 03/30/2015 Dividends 4/15/2015 Common 0.76751
(A free translation of the original in Portuguese)
3
Quarterly information (ITR) - 3/31/2015 - TOTVS S.A. Version: 1
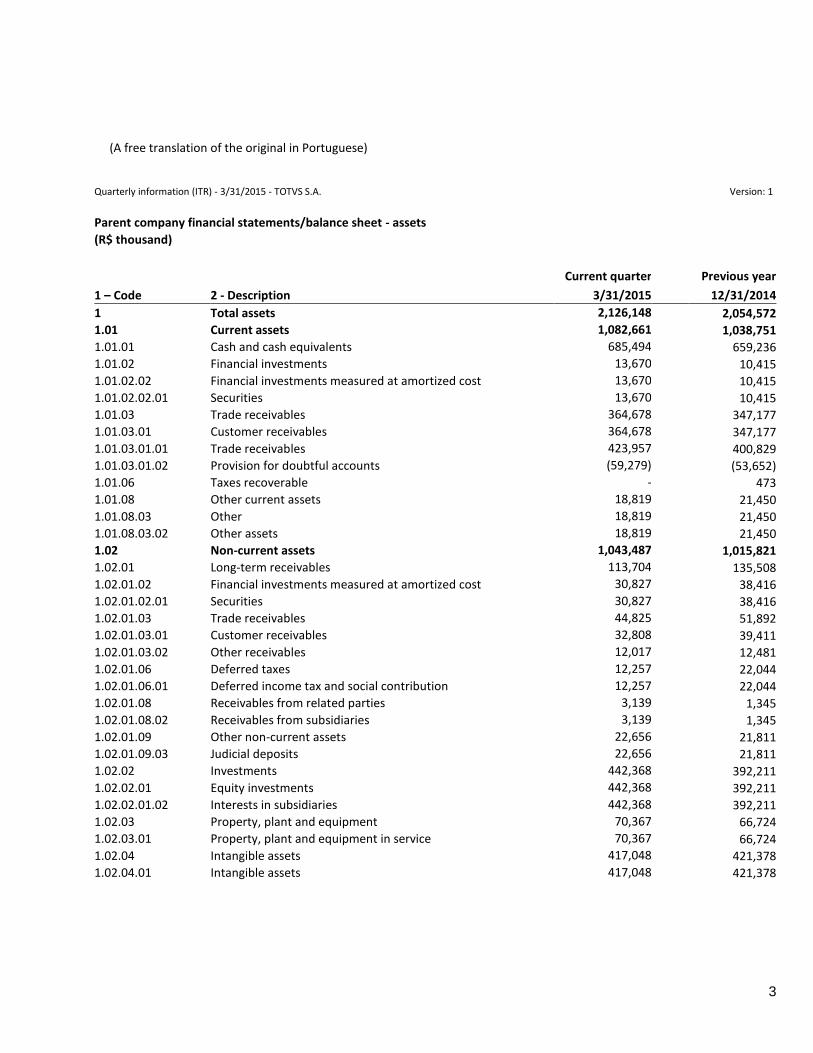
Parent company financial statements/balance sheet - assets
(R$ thousand)
Current quarter Previous year
1 – Code 2 - Description 3/31/2015 12/31/2014
1 Total assets 2,126,148 2,054,572
1.01 Current assets 1,082,661 1,038,751
1.01.01 Cash and cash equivalents 685,494 659,236
1.01.02 Financial investments 13,670 10,415
1.01.02.02 Financial investments measured at amortized cost 13,670 10,415
1.01.02.02.01 Securities 13,670 10,415
1.01.03 Trade receivables 364,678 347,177
1.01.03.01 Customer receivables 364,678 347,177
1.01.03.01.01 Trade receivables 423,957 400,829
1.01.03.01.02 Provision for doubtful accounts (59,279) (53,652)
1.01.06 Taxes recoverable - 473
1.01.08 Other current assets 18,819 21,450
1.01.08.03 Other 18,819 21,450
1.01.08.03.02 Other assets 18,819 21,450
1.02 Non-current assets 1,043,487 1,015,821
1.02.01 Long-term receivables 113,704 135,508
1.02.01.02 Financial investments measured at amortized cost 30,827 38,416
1.02.01.02.01 Securities 30,827 38,416
1.02.01.03 Trade receivables 44,825 51,892
1.02.01.03.01 Customer receivables 32,808 39,411
1.02.01.03.02 Other receivables 12,017 12,481
1.02.01.06 Deferred taxes 12,257 22,044
1.02.01.06.01 Deferred income tax and social contribution 12,257 22,044
1.02.01.08 Receivables from related parties 3,139 1,345
1.02.01.08.02 Receivables from subsidiaries 3,139 1,345
1.02.01.09 Other non-current assets 22,656 21,811
1.02.01.09.03 Judicial deposits 22,656 21,811
1.02.02 Investments 442,368 392,211
1.02.02.01 Equity investments 442,368 392,211
1.02.02.01.02 Interests in subsidiaries 442,368 392,211
1.02.03 Property, plant and equipment 70,367 66,724
1.02.03.01 Property, plant and equipment in service 70,367 66,724
1.02.04 Intangible assets 417,048 421,378
1.02.04.01 Intangible assets 417,048 421,378
(A free translation of the original in Portuguese)
4
Quarterly information (ITR) - 3/31/2015 - TOTVS S.A. Version: 1
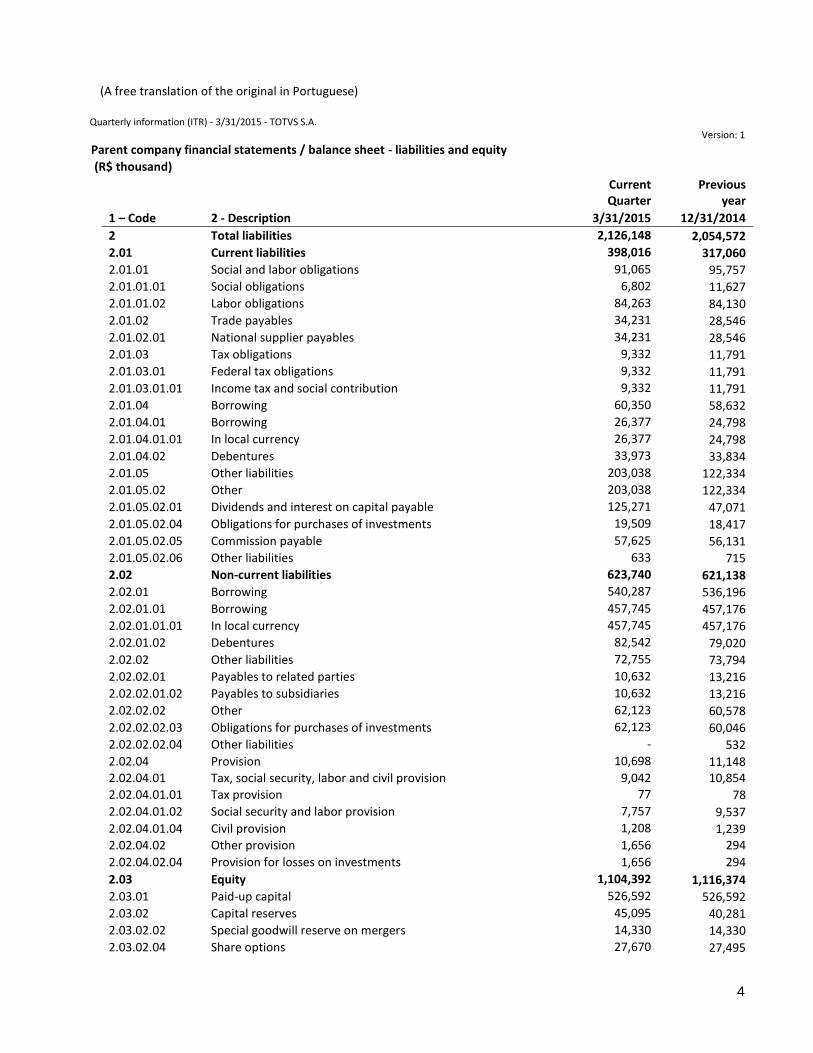
Parent company financial statements / balance sheet - liabilities and equity
(R$ thousand)
Current Quarter
Previous
year
1 – Code 2 - Description 3/31/2015 12/31/2014
2 Total liabilities 2,126,148 2,054,572
2.01 Current liabilities 398,016 317,060
2.01.01 Social and labor obligations 91,065 95,757
2.01.01.01 Social obligations 6,802 11,627
2.01.01.02 Labor obligations 84,263 84,130
2.01.02 Trade payables 34,231 28,546
2.01.02.01 National supplier payables 34,231 28,546
2.01.03 Tax obligations 9,332 11,791
2.01.03.01 Federal tax obligations 9,332 11,791
2.01.03.01.01 Income tax and social contribution 9,332 11,791
2.01.04 Borrowing 60,350 58,632
2.01.04.01 Borrowing 26,377 24,798
2.01.04.01.01 In local currency 26,377 24,798
2.01.04.02 Debentures 33,973 33,834
2.01.05 Other liabilities 203,038 122,334
2.01.05.02 Other 203,038 122,334
2.01.05.02.01 Dividends and interest on capital payable 125,271 47,071
2.01.05.02.04 Obligations for purchases of investments 19,509 18,417
2.01.05.02.05 Commission payable 57,625 56,131
2.01.05.02.06 Other liabilities 633 715
2.02 Non-current liabilities 623,740 621,138
2.02.01 Borrowing 540,287 536,196
2.02.01.01 Borrowing 457,745 457,176
2.02.01.01.01 In local currency 457,745 457,176
2.02.01.02 Debentures 82,542 79,020
2.02.02 Other liabilities 72,755 73,794
2.02.02.01 Payables to related parties 10,632 13,216
2.02.02.01.02 Payables to subsidiaries 10,632 13,216
2.02.02.02 Other 62,123 60,578
2.02.02.02.03 Obligations for purchases of investments 62,123 60,046
2.02.02.02.04 Other liabilities - 532
2.02.04 Provision 10,698 11,148 2.02.04.01 Tax, social security, labor and civil provision 9,042 10,854
2.02.04.01.01 Tax provision 77 78
2.02.04.01.02 Social security and labor provision 7,757 9,537
2.02.04.01.04 Civil provision 1,208 1,239 2.02.04.02 Other provision 1,656 294
2.02.04.02.04 Provision for losses on investments 1,656 294
2.03 Equity 1,104,392 1,116,374
2.03.01 Paid-up capital 526,592 526,592
2.03.02 Capital reserves 45,095 40,281
2.03.02.02 Special goodwill reserve on mergers 14,330 14,330
2.03.02.04 Share options 27,670 27,495
(A free translation of the original in Portuguese)
5
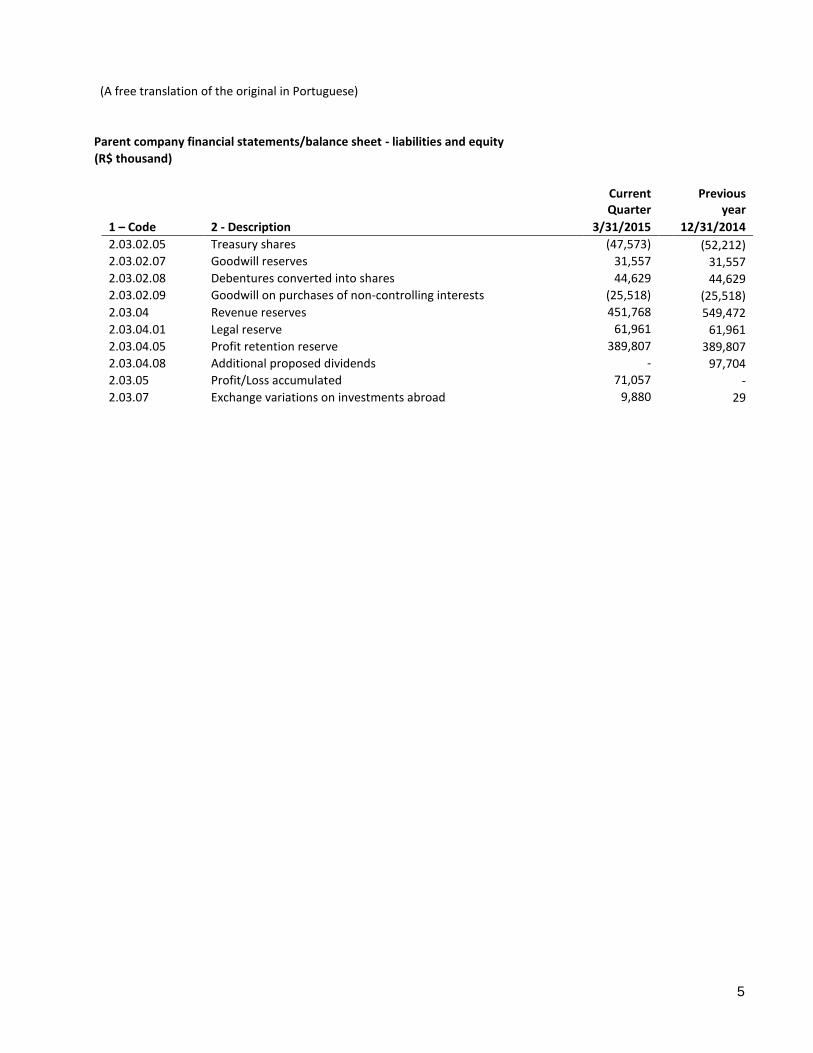
Parent company financial statements/balance sheet - liabilities and equity
(R$ thousand)
Current Quarter
Previous
year
1 – Code 2 - Description 3/31/2015 12/31/2014
2.03.02.05 Treasury shares (47,573) (52,212) 2.03.02.07 Goodwill reserves 31,557 31,557 2.03.02.08 Debentures converted into shares 44,629 44,629 2.03.02.09 Goodwill on purchases of non-controlling interests (25,518) (25,518)
2.03.04 Revenue reserves 451,768 549,472
2.03.04.01 Legal reserve 61,961 61,961
2.03.04.05 Profit retention reserve 389,807 389,807
2.03.04.08 Additional proposed dividends - 97,704
2.03.05 Profit/Loss accumulated 71,057 -
2.03.07 Exchange variations on investments abroad 9,880 29
(A free translation of the original in Portuguese)
6
Quarterly information (ITR) - 3/31/2015 - TOTVS S.A. Version: 1
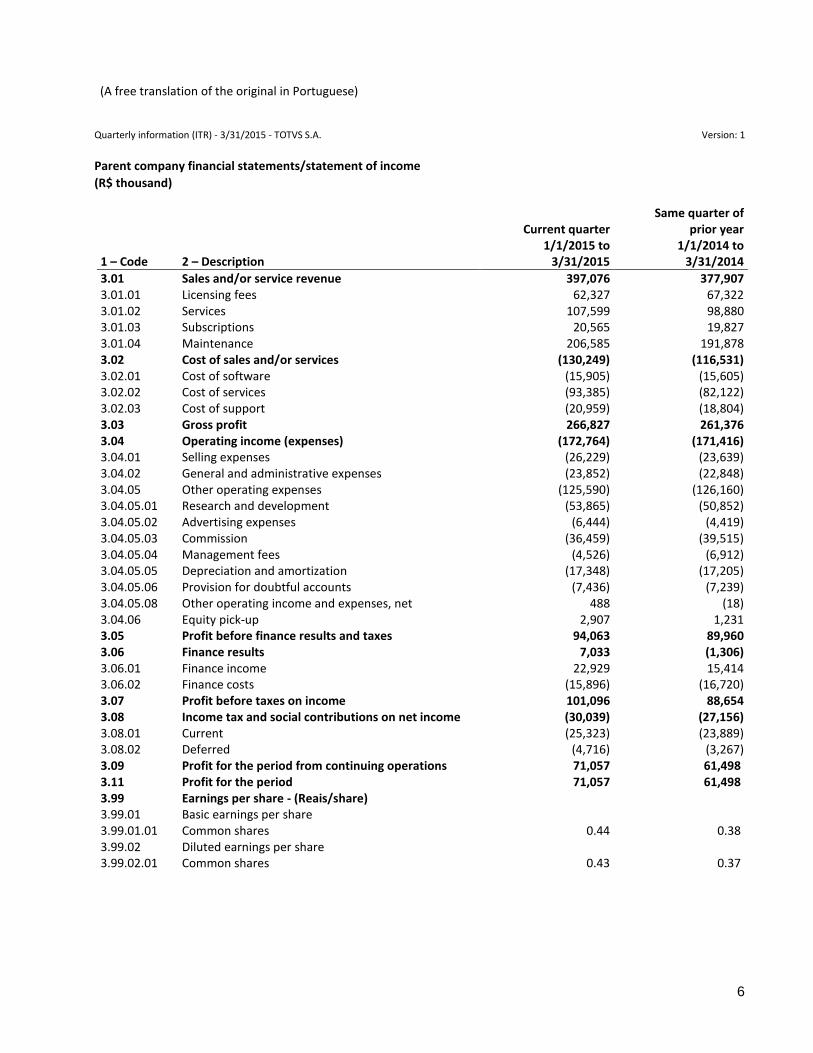
Parent company financial statements/statement of income
(R$ thousand)
1 – Code 2 – Description
Current quarter 1/1/2015 to
3/31/2015
Same quarter of prior year
1/1/2014 to 3/31/2014
3.01 Sales and/or service revenue 397,076 377,907 3.01.01 Licensing fees 62,327 67,322 3.01.02 Services 107,599 98,880 3.01.03 Subscriptions 20,565 19,827 3.01.04 Maintenance 206,585 191,878 3.02 Cost of sales and/or services (130,249) (116,531) 3.02.01 Cost of software (15,905) (15,605) 3.02.02 Cost of services (93,385) (82,122) 3.02.03 Cost of support (20,959) (18,804) 3.03 Gross profit 266,827 261,376 3.04 Operating income (expenses) (172,764) (171,416) 3.04.01 Selling expenses (26,229) (23,639) 3.04.02 General and administrative expenses (23,852) (22,848) 3.04.05 Other operating expenses (125,590) (126,160) 3.04.05.01 Research and development (53,865) (50,852) 3.04.05.02 Advertising expenses (6,444) (4,419) 3.04.05.03 Commission (36,459) (39,515) 3.04.05.04 Management fees (4,526) (6,912) 3.04.05.05 Depreciation and amortization (17,348) (17,205) 3.04.05.06 Provision for doubtful accounts (7,436) (7,239) 3.04.05.08 Other operating income and expenses, net 488 (18) 3.04.06 Equity pick-up 2,907 1,231 3.05 Profit before finance results and taxes 94,063 89,960 3.06 Finance results 7,033 (1,306) 3.06.01 Finance income 22,929 15,414 3.06.02 Finance costs (15,896) (16,720) 3.07 Profit before taxes on income 101,096 88,654 3.08 Income tax and social contributions on net income (30,039) (27,156) 3.08.01 Current (25,323) (23,889) 3.08.02 Deferred (4,716) (3,267) 3.09 Profit for the period from continuing operations 71,057 61,498 3.11 Profit for the period 71,057 61,498 3.99 Earnings per share - (Reais/share) 3.99.01 Basic earnings per share 3.99.01.01 Common shares 0.44 0.38 3.99.02 Diluted earnings per share 3.99.02.01 Common shares 0.43 0.37
(A free translation of the original in Portuguese)
7
Quarterly information (ITR) - 3/31/2015 - TOTVS S.A. Version: 1
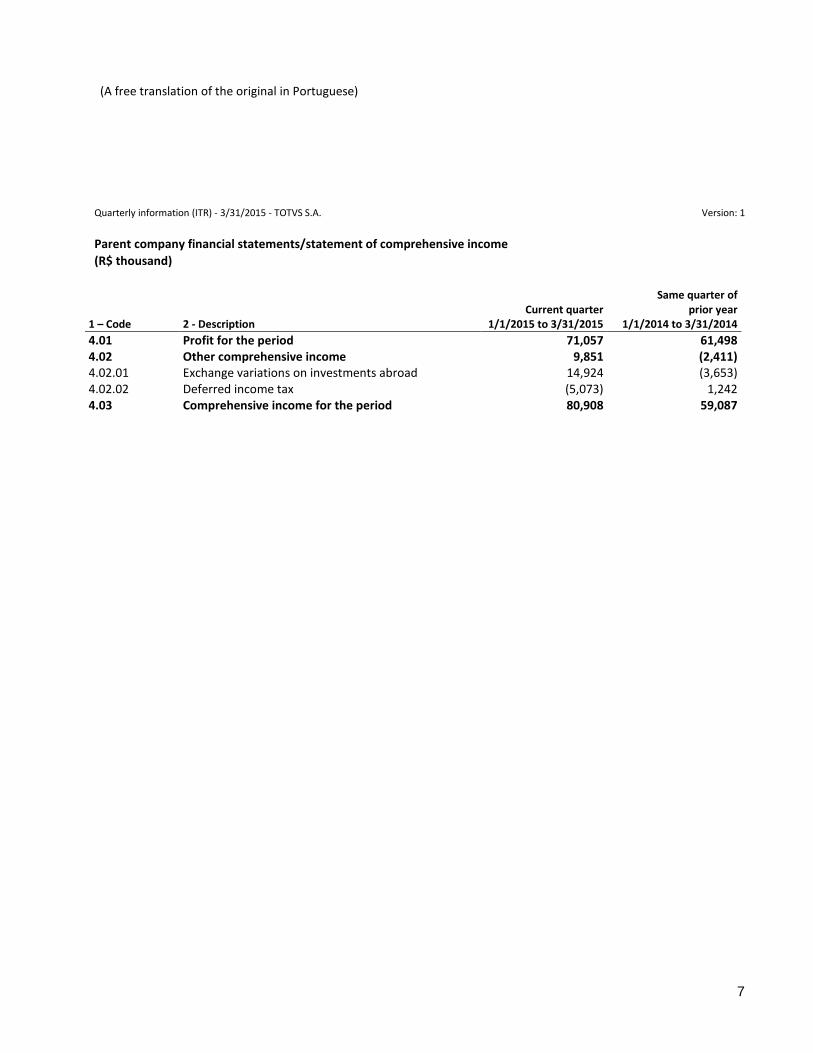
Parent company financial statements/statement of comprehensive income
(R$ thousand)
1 – Code 2 - Description Current quarter
1/1/2015 to 3/31/2015
Same quarter of prior year
1/1/2014 to 3/31/2014
4.01 Profit for the period 71,057 61,498 4.02 Other comprehensive income 9,851 (2,411) 4.02.01 Exchange variations on investments abroad 14,924 (3,653) 4.02.02 Deferred income tax (5,073) 1,242 4.03 Comprehensive income for the period 80,908 59,087
(A free translation of the original in Portuguese)
8
Quarterly information (ITR) - 3/31/2015 - TOTVS S.A. Version: 1
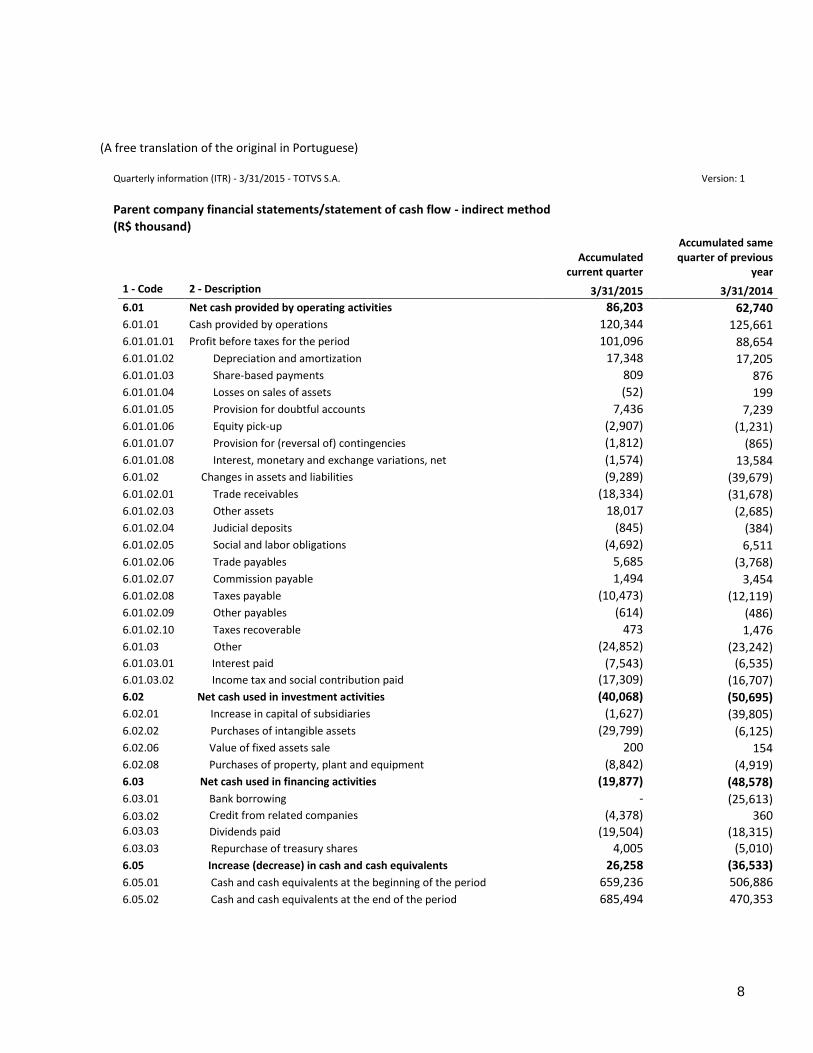
Parent company financial statements/statement of cash flow - indirect method
(R$ thousand)
Accumulated current quarter
Accumulated same quarter of previous
year
1 - Code 2 - Description 3/31/2015 3/31/2014
6.01 Net cash provided by operating activities 86,203 62,740 6.01.01 Cash provided by operations 120,344 125,661 6.01.01.01 Profit before taxes for the period 101,096 88,654 6.01.01.02 Depreciation and amortization 17,348 17,205 6.01.01.03 Share-based payments 809 876 6.01.01.04 Losses on sales of assets (52) 199 6.01.01.05 Provision for doubtful accounts 7,436 7,239 6.01.01.06 Equity pick-up (2,907) (1,231) 6.01.01.07 Provision for (reversal of) contingencies (1,812) (865) 6.01.01.08 Interest, monetary and exchange variations, net (1,574) 13,584 6.01.02 Changes in assets and liabilities (9,289) (39,679) 6.01.02.01 Trade receivables (18,334) (31,678) 6.01.02.03 Other assets 18,017 (2,685) 6.01.02.04 Judicial deposits (845) (384) 6.01.02.05 Social and labor obligations (4,692) 6,511 6.01.02.06 Trade payables 5,685 (3,768) 6.01.02.07 Commission payable 1,494 3,454 6.01.02.08 Taxes payable (10,473) (12,119) 6.01.02.09 Other payables (614) (486) 6.01.02.10 Taxes recoverable 473 1,476 6.01.03 Other (24,852) (23,242) 6.01.03.01 Interest paid (7,543) (6,535) 6.01.03.02 Income tax and social contribution paid (17,309) (16,707) 6.02 Net cash used in investment activities (40,068) (50,695) 6.02.01 Increase in capital of subsidiaries (1,627) (39,805) 6.02.02 Purchases of intangible assets (29,799) (6,125) 6.02.06 Value of fixed assets sale 200 154 6.02.08 Purchases of property, plant and equipment (8,842) (4,919) 6.03 Net cash used in financing activities (19,877) (48,578) 6.03.01 Bank borrowing - (25,613)
6.03.02 6.03.03
Credit from related companies (4,378) 360 Dividends paid (19,504) (18,315)
6.03.03 Repurchase of treasury shares 4,005 (5,010)
6.05 Increase (decrease) in cash and cash equivalents 26,258 (36,533)
6.05.01 Cash and cash equivalents at the beginning of the period 659,236 506,886
6.05.02 Cash and cash equivalents at the end of the period 685,494 470,353
(A free translation of the original in Portuguese)
9
Quarterly information (ITR) - 3/31/2015 - TOTVS S.A. Version: 1
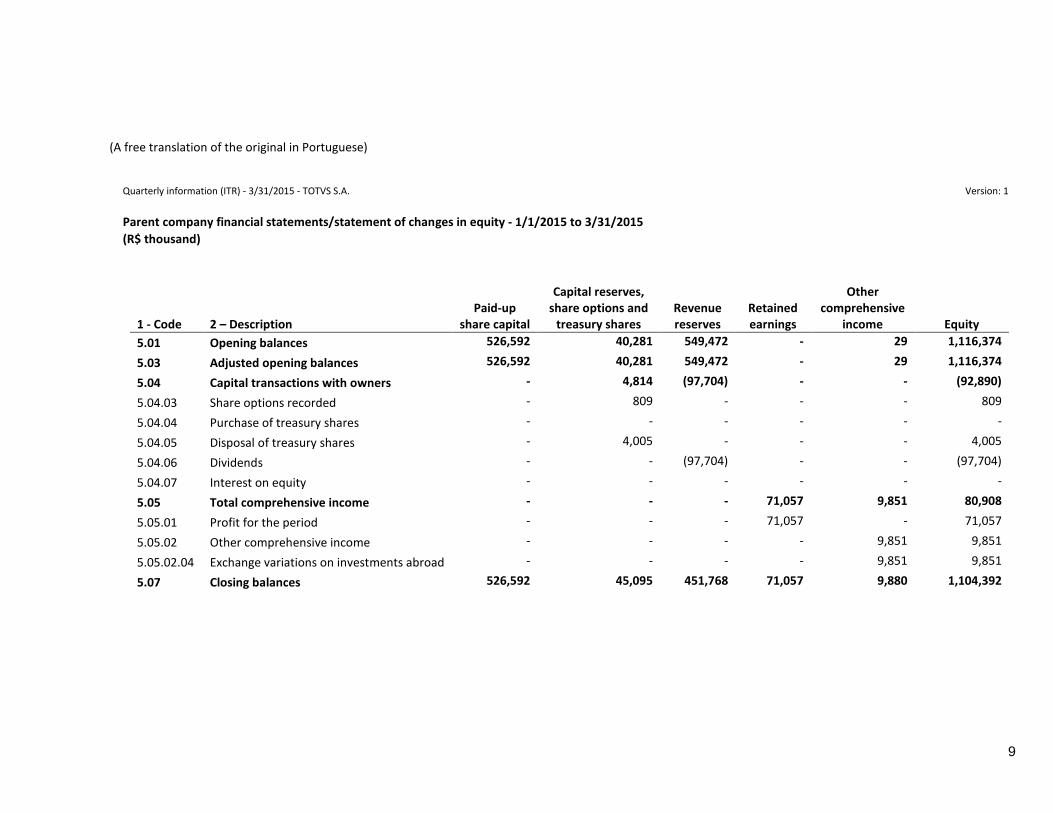
Parent company financial statements/statement of changes in equity - 1/1/2015 to 3/31/2015
(R$ thousand)
1 - Code 2 – Description Paid-up
share capital
Capital reserves, share options and
treasury shares Revenue reserves
Retained earnings
Other comprehensive
income Equity
5.01 Opening balances 526,592 40,281 549,472 - 29 1,116,374
5.03 Adjusted opening balances 526,592 40,281 549,472 - 29 1,116,374
5.04 Capital transactions with owners - 4,814 (97,704) - - (92,890)
5.04.03 Share options recorded - 809 - - - 809
5.04.04 Purchase of treasury shares - - - - - -
5.04.05 Disposal of treasury shares - 4,005 - - - 4,005
5.04.06 Dividends - - (97,704) - - (97,704)
5.04.07 Interest on equity - - - - - -
5.05 Total comprehensive income - - - 71,057 9,851 80,908
5.05.01 Profit for the period - - - 71,057 - 71,057
5.05.02 Other comprehensive income - - - - 9,851 9,851
5.05.02.04 Exchange variations on investments abroad - - - - 9,851 9,851
5.07 Closing balances 526,592 45,095 451,768 71,057 9,880 1,104,392
(A free translation of the original in Portuguese)
10
Quarterly information (ITR) - 3/31/2015 - TOTVS S.A. Version: 1
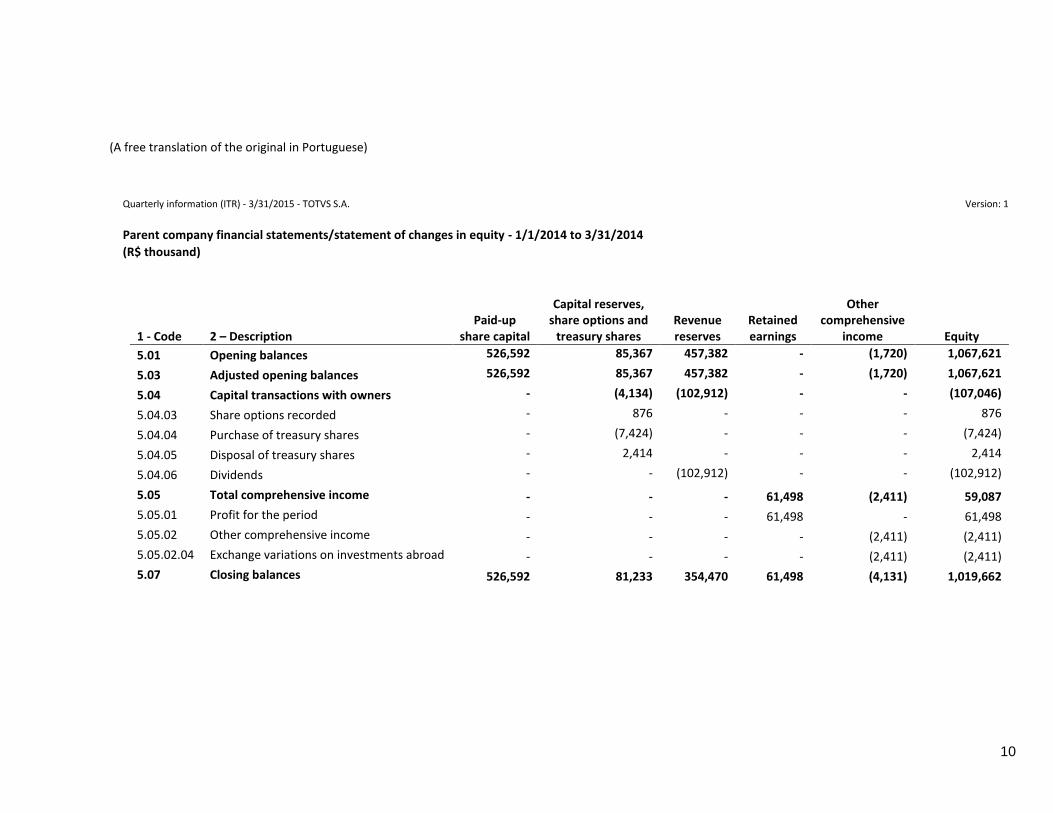
Parent company financial statements/statement of changes in equity - 1/1/2014 to 3/31/2014
(R$ thousand)
1 - Code 2 – Description Paid-up
share capital
Capital reserves, share options and
treasury shares Revenue reserves
Retained earnings
Other comprehensive
income Equity
5.01 Opening balances 526,592 85,367 457,382 - (1,720) 1,067,621
5.03 Adjusted opening balances 526,592 85,367 457,382 - (1,720) 1,067,621
5.04 Capital transactions with owners - (4,134) (102,912) - - (107,046)
5.04.03 Share options recorded - 876 - - - 876
5.04.04 Purchase of treasury shares - (7,424) - - - (7,424)
5.04.05 Disposal of treasury shares - 2,414 - - - 2,414
5.04.06 Dividends - - (102,912) - - (102,912)
5.05 Total comprehensive income - - - 61,498 (2,411) 59,087
5.05.01 Profit for the period - - - 61,498 - 61,498
5.05.02 Other comprehensive income - - - - (2,411) (2,411)
5.05.02.04 Exchange variations on investments abroad - - - - (2,411) (2,411)
5.07 Closing balances 526,592 81,233 354,470 61,498 (4,131) 1,019,662

(A free translation of the original in Portuguese)
11
Quarterly information (ITR) - 3/31/2015 - TOTVS S.A. Version: 1
Parent company financial statements/statement of value added
(R$ thousand)
Accumulated
current quarter
3/31/2015
Accumulated same quarter of
previous year 3/31/2014 1 – Code 2 - Description
er
Accumulated same quarter
of previous year
7.01 Revenue 426,198 405,004
7.01.01 Sale of goods and services 433,146 412,263
7.01.02 Other expenses 488 (20)
7.01.04 Provision for (reversal of) doubtful accounts (7,436) (7,239)
7.02 Inputs acquired from third parties (127,702) (115,868)
7.02.01 Cost of sales and services (15,905) (14,206)
7.02.02 Materials, energy, outsourced services and other (111,797) (101,662)
7.03 Gross value added 298,496 289,136
7.04 Retentions (17,348) (17,205)
7.04.01 Depreciation, amortization and depletion (17,348) (17,205)
7.05 Net value added generated 281,148 271,931
7.06 Value added received through transfers 25,836 16,645
7.06.01 Equity in the results of subsidiaries 2,907 1,231
7.06.02 Finance income 22,929 15,414
7.07 Total value added to distribute 306,984 288,576
7.08 Distribution of value added 306,984 288,576
7.08.01 Personnel 140,879 135,596
7.08.01.01 Direct remuneration 114,345 113,524 7.08.01.02 Benefits 16,944 13,053
7.08.01.03 Government Severance Indemnity Fund for Employees (FGTS) 9,590 9,019
7.08.02 Taxes and contributions 73,454 68,554
7.08.02.01 Federal 63,300 58,808
7.08.02.02 State 2 60
7.08.02.03 Municipal 10,152 9,686
7.08.03 Remuneration of third party capital 21,594 22,928
7.08.03.01 Interest 15,896 16,720
7.08.03.02 Rent 5,698 6,208
7.08.04 Remuneration of own capital 71,057 61,498
7.08.04.03 Profits reinvested 71,057 61,498
(A free translation of the original in Portuguese)
12
Quarterly information (ITR) - 3/31/2015 - TOTVS S.A. Version: 1
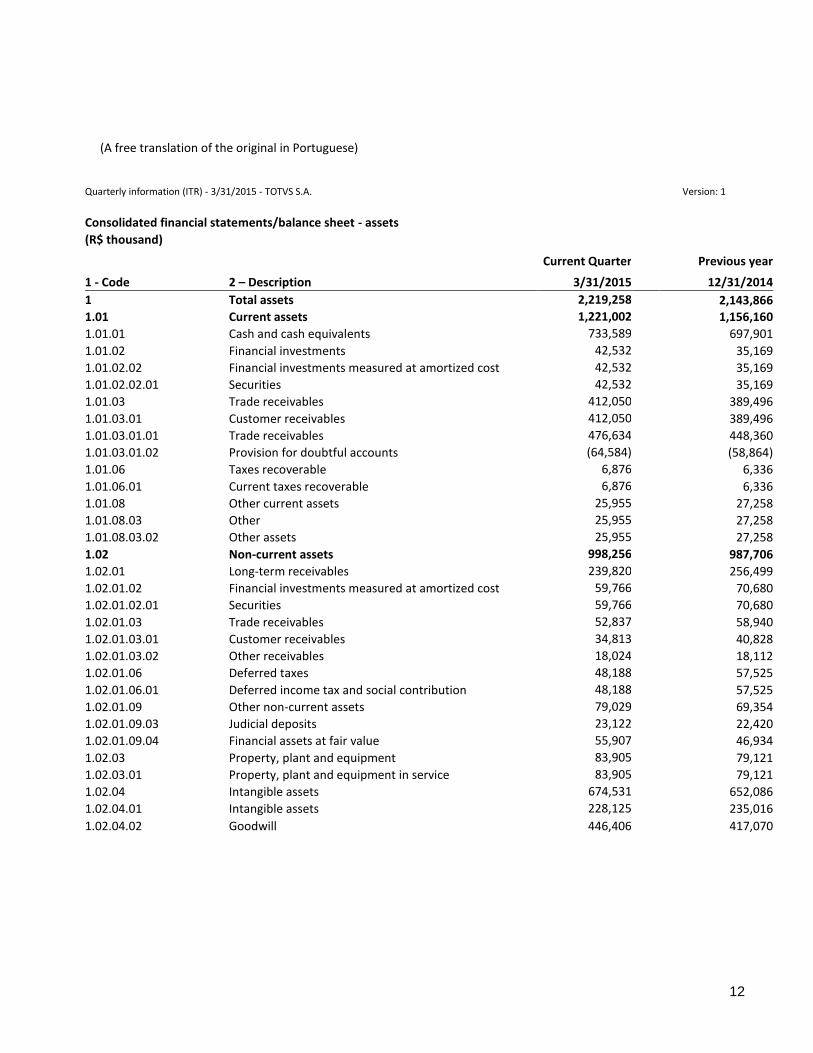
Consolidated financial statements/balance sheet - assets
(R$ thousand)
Current Quarter Previous year
1 - Code 2 – Description 3/31/2015 12/31/2014
1 Total assets 2,219,258 2,143,866
1.01 Current assets 1,221,002 1,156,160
1.01.01 Cash and cash equivalents 733,589 697,901
1.01.02 Financial investments 42,532 35,169
1.01.02.02 Financial investments measured at amortized cost 42,532 35,169
1.01.02.02.01 Securities 42,532 35,169
1.01.03 Trade receivables 412,050 389,496
1.01.03.01 Customer receivables 412,050 389,496
1.01.03.01.01 Trade receivables 476,634 448,360
1.01.03.01.02 Provision for doubtful accounts (64,584) (58,864)
1.01.06 Taxes recoverable 6,876 6,336
1.01.06.01 Current taxes recoverable 6,876 6,336
1.01.08 Other current assets 25,955 27,258
1.01.08.03 Other 25,955 27,258
1.01.08.03.02 Other assets 25,955 27,258
1.02 Non-current assets 998,256 987,706
1.02.01 Long-term receivables 239,820 256,499
1.02.01.02 Financial investments measured at amortized cost 59,766 70,680
1.02.01.02.01 Securities 59,766 70,680
1.02.01.03 Trade receivables 52,837 58,940
1.02.01.03.01 Customer receivables 34,813 40,828
1.02.01.03.02 Other receivables 18,024 18,112
1.02.01.06 Deferred taxes 48,188 57,525
1.02.01.06.01 Deferred income tax and social contribution 48,188 57,525
1.02.01.09 Other non-current assets 79,029 69,354
1.02.01.09.03 Judicial deposits 23,122 22,420
1.02.01.09.04 Financial assets at fair value 55,907 46,934
1.02.03 Property, plant and equipment 83,905 79,121
1.02.03.01 Property, plant and equipment in service 83,905 79,121
1.02.04 Intangible assets 674,531 652,086
1.02.04.01 Intangible assets 228,125 235,016
1.02.04.02 Goodwill 446,406 417,070
(A free translation of the original in Portuguese)
13
Quarterly information (ITR) - 3/31/2015 - TOTVS S.A. Version: 1
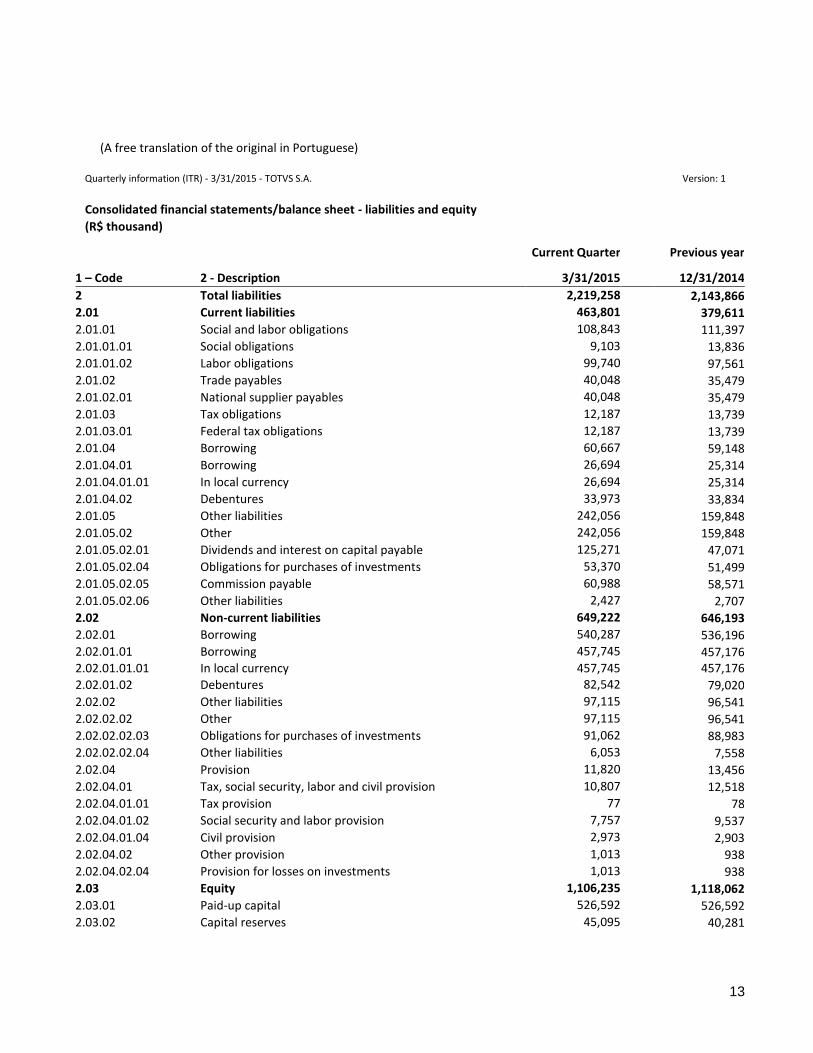
Consolidated financial statements/balance sheet - liabilities and equity
(R$ thousand)
Current Quarter Previous year
1 – Code 2 - Description 3/31/2015 12/31/2014
2 Total liabilities 2,219,258 2,143,866 2.01 Current liabilities 463,801 379,611
2.01.01 Social and labor obligations 108,843 111,397
2.01.01.01 Social obligations 9,103 13,836
2.01.01.02 Labor obligations 99,740 97,561 2.01.02 Trade payables 40,048 35,479
2.01.02.01 National supplier payables 40,048 35,479
2.01.03 Tax obligations 12,187 13,739
2.01.03.01 Federal tax obligations 12,187 13,739 2.01.04 Borrowing 60,667 59,148
2.01.04.01 Borrowing 26,694 25,314
2.01.04.01.01 In local currency 26,694 25,314
2.01.04.02 Debentures 33,973 33,834 2.01.05 Other liabilities 242,056 159,848
2.01.05.02 Other 242,056 159,848
2.01.05.02.01 Dividends and interest on capital payable 125,271 47,071
2.01.05.02.04 Obligations for purchases of investments 53,370 51,499 2.01.05.02.05 Commission payable 60,988 58,571
2.01.05.02.06 Other liabilities 2,427 2,707
2.02 Non-current liabilities 649,222 646,193
2.02.01 Borrowing 540,287 536,196 2.02.01.01 Borrowing 457,745 457,176 2.02.01.01.01 In local currency 457,745 457,176
2.02.01.02 Debentures 82,542 79,020
2.02.02 Other liabilities 97,115 96,541
2.02.02.02 Other 97,115 96,541
2.02.02.02.03 Obligations for purchases of investments 91,062 88,983
2.02.02.02.04 Other liabilities 6,053 7,558
2.02.04 Provision 11,820 13,456
2.02.04.01 Tax, social security, labor and civil provision 10,807 12,518
2.02.04.01.01 Tax provision 77 78
2.02.04.01.02 Social security and labor provision 7,757 9,537
2.02.04.01.04 Civil provision 2,973 2,903
2.02.04.02 Other provision 1,013 938
2.02.04.02.04 Provision for losses on investments 1,013 938
2.03 Equity 1,106,235 1,118,062
2.03.01 Paid-up capital 526,592 526,592
2.03.02 Capital reserves 45,095 40,281
(A free translation of the original in Portuguese)
14
Quarterly information (ITR) - 3/31/2015 - TOTVS S.A.
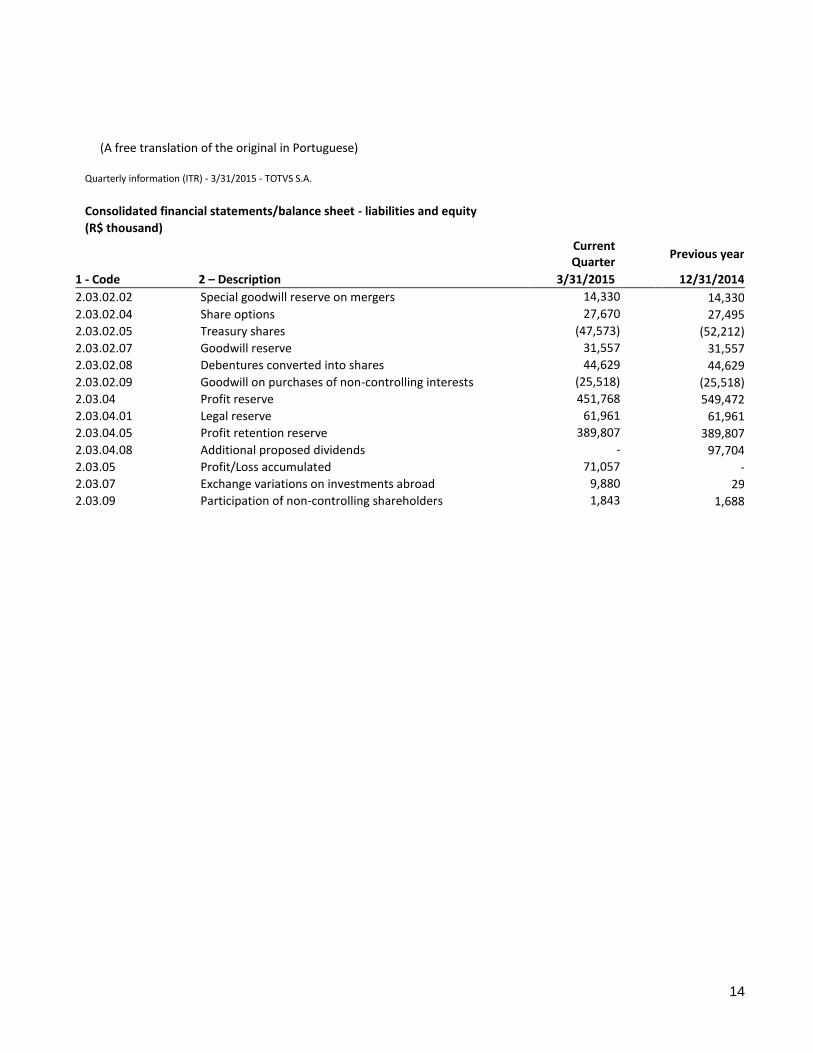
Consolidated financial statements/balance sheet - liabilities and equity
(R$ thousand)
Current Quarter
Previous year
1 - Code 2 – Description 3/31/2015 12/31/2014
2.03.02.02 Special goodwill reserve on mergers 14,330 14,330
2.03.02.04 Share options 27,670 27,495
2.03.02.05 Treasury shares (47,573) (52,212)
2.03.02.07 Goodwill reserve 31,557 31,557
2.03.02.08 Debentures converted into shares 44,629 44,629
2.03.02.09 Goodwill on purchases of non-controlling interests (25,518) (25,518)
2.03.04 Profit reserve 451,768 549,472
2.03.04.01 Legal reserve 61,961 61,961
2.03.04.05 Profit retention reserve 389,807 389,807
2.03.04.08 Additional proposed dividends - 97,704
2.03.05 Profit/Loss accumulated 71,057 -
2.03.07 Exchange variations on investments abroad 9,880 29
2.03.09 Participation of non-controlling shareholders 1,843 1,688
(A free translation of the original in Portuguese)
15
Quarterly information (ITR) - 3/31/2015 - TOTVS S.A. Version: 1
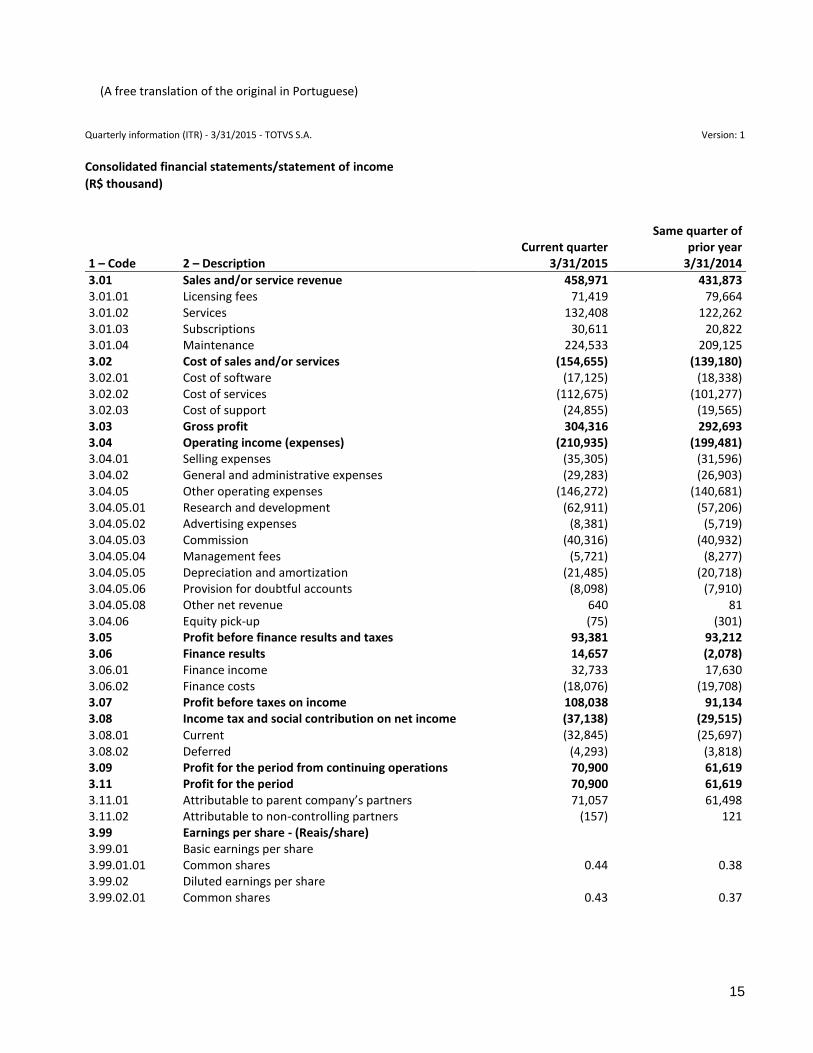
Consolidated financial statements/statement of income
(R$ thousand)
1 – Code 2 – Description Current quarter
3/31/2015
Same quarter of prior year
3/31/2014
3.01 Sales and/or service revenue 458,971 431,873 3.01.01 Licensing fees 71,419 79,664 3.01.02 Services 132,408 122,262 3.01.03 Subscriptions 30,611 20,822 3.01.04 Maintenance 224,533 209,125 3.02 Cost of sales and/or services (154,655) (139,180) 3.02.01 Cost of software (17,125) (18,338) 3.02.02 Cost of services (112,675) (101,277) 3.02.03 Cost of support (24,855) (19,565) 3.03 Gross profit 304,316 292,693 3.04 Operating income (expenses) (210,935) (199,481) 3.04.01 Selling expenses (35,305) (31,596) 3.04.02 General and administrative expenses (29,283) (26,903) 3.04.05 Other operating expenses (146,272) (140,681) 3.04.05.01 Research and development (62,911) (57,206) 3.04.05.02 Advertising expenses (8,381) (5,719) 3.04.05.03 Commission (40,316) (40,932) 3.04.05.04 Management fees (5,721) (8,277) 3.04.05.05 Depreciation and amortization (21,485) (20,718) 3.04.05.06 Provision for doubtful accounts (8,098) (7,910) 3.04.05.08 Other net revenue 640 81 3.04.06 Equity pick-up (75) (301) 3.05 Profit before finance results and taxes 93,381 93,212 3.06 Finance results 14,657 (2,078) 3.06.01 Finance income 32,733 17,630 3.06.02 Finance costs (18,076) (19,708) 3.07 Profit before taxes on income 108,038 91,134 3.08 Income tax and social contribution on net income (37,138) (29,515)
3.08.01 Current (32,845) (25,697) 3.08.02 Deferred (4,293) (3,818) 3.09 Profit for the period from continuing operations 70,900 61,619 3.11 Profit for the period 70,900 61,619 3.11.01 Attributable to parent company’s partners 71,057 61,498 3.11.02 Attributable to non-controlling partners (157) 121 3.99 Earnings per share - (Reais/share) 3.99.01 Basic earnings per share 3.99.01.01 Common shares 0.44 0.38 3.99.02 Diluted earnings per share 3.99.02.01 Common shares 0.43 0.37

(A free translation of the original in Portuguese)
16
Quarterly information (ITR) - 3/31/2015 - TOTVS S.A. Version: 1
Consolidated financial statements/statement of comprehensive income
(R$ thousand)
1 – Code 2 – Description
Current quarter
3/31/2015
Same quarter of prior year
3/31/2014
4.01 Profit for the period 70,900 61,619
4.02 Other comprehensive income 9,851 (2,411)
4.02.01 Exchange variations on investments abroad 14,924 (3,653) 4.02.02 Deferred income tax (5,073) 1,242
4.03 Comprehensive income for the period 80,751 59,208
4.03.01 Attributable to the parent company's partners 80,908 59,087
4.03.02 Attributable to non-controlling partners (157) 121
(A free translation of the original in Portuguese)
17
Quarterly information (ITR) - 3/31/2015 - TOTVS S.A. Version: 1
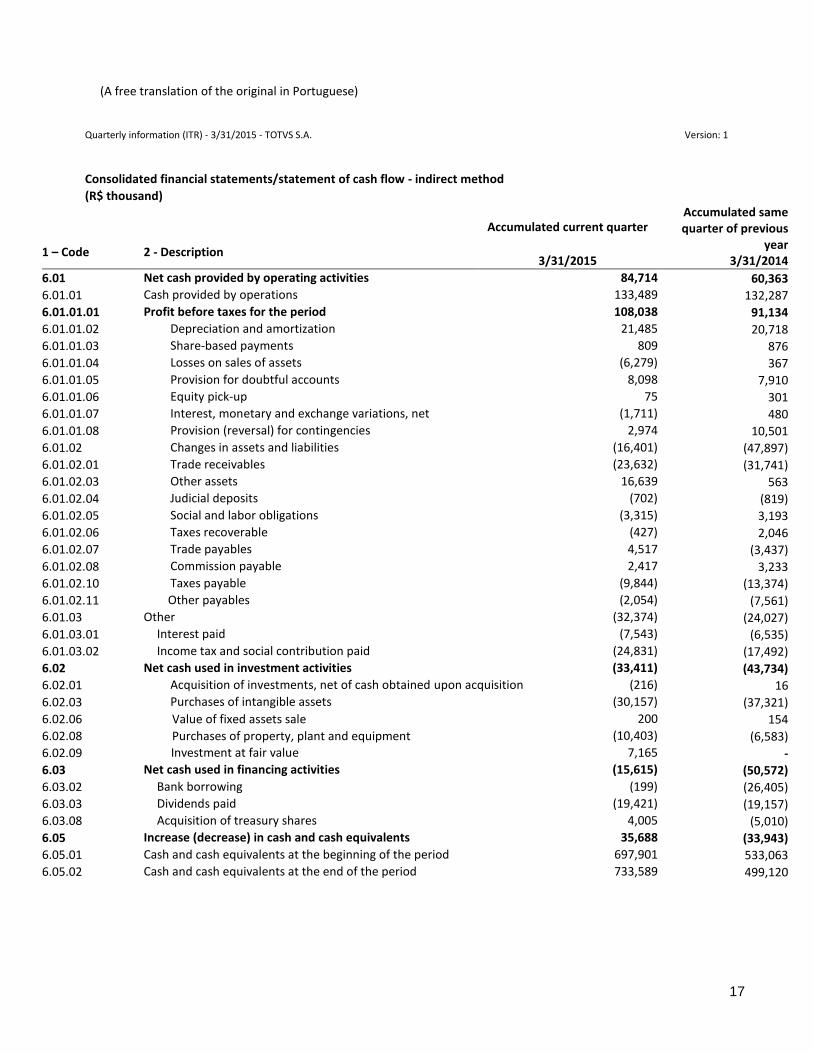
Consolidated financial statements/statement of cash flow - indirect method
(R$ thousand)
Accumulated current quarter
Accumulated same quarter of previous
year 3/31/2014
1 – Code 2 - Description 3/31/2015
6.01 Net cash provided by operating activities 84,714 60,363
6.01.01 Cash provided by operations 133,489 132,287
6.01.01.01 Profit before taxes for the period 108,038 91,134
6.01.01.02 Depreciation and amortization 21,485 20,718 6.01.01.03 Share-based payments 809 876
6.01.01.04 Losses on sales of assets (6,279) 367
6.01.01.05 Provision for doubtful accounts 8,098 7,910
6.01.01.06 Equity pick-up 75 301 6.01.01.07 Interest, monetary and exchange variations, net (1,711) 480
6.01.01.08 Provision (reversal) for contingencies 2,974 10,501
6.01.02 Changes in assets and liabilities (16,401) (47,897)
6.01.02.01 Trade receivables (23,632) (31,741) 6.01.02.03 Other assets 16,639 563
6.01.02.04 Judicial deposits (702) (819)
6.01.02.05 Social and labor obligations (3,315) 3,193
6.01.02.06 Taxes recoverable (427) 2,046 6.01.02.07 Trade payables 4,517 (3,437)
6.01.02.08 Commission payable 2,417 3,233
6.01.02.10 Taxes payable (9,844) (13,374)
6.01.02.11 Other payables (2,054) (7,561) 6.01.03 Other (32,374) (24,027)
6.01.03.01 Interest paid (7,543) (6,535)
6.01.03.02 Income tax and social contribution paid (24,831) (17,492)
6.02 Net cash used in investment activities (33,411) (43,734) 6.02.01 Acquisition of investments, net of cash obtained upon acquisition (216) 16
6.02.03 Purchases of intangible assets (30,157) (37,321)
6.02.06 Value of fixed assets sale 200 154
6.02.08 Purchases of property, plant and equipment (10,403) (6,583) 6.02.09 Investment at fair value 7,165 -
6.03 Net cash used in financing activities (15,615) (50,572)
6.03.02 Bank borrowing (199) (26,405)
6.03.03 Dividends paid (19,421) (19,157) 6.03.08 Acquisition of treasury shares 4,005 (5,010)
6.05 Increase (decrease) in cash and cash equivalents 35,688 (33,943)
6.05.01 Cash and cash equivalents at the beginning of the period 697,901 533,063
6.05.02 Cash and cash equivalents at the end of the period 733,589 499,120
(A free translation of the original in Portuguese)
18
Quarterly information (ITR) - 3/31/2015 - TOTVS S.A. Version: 1
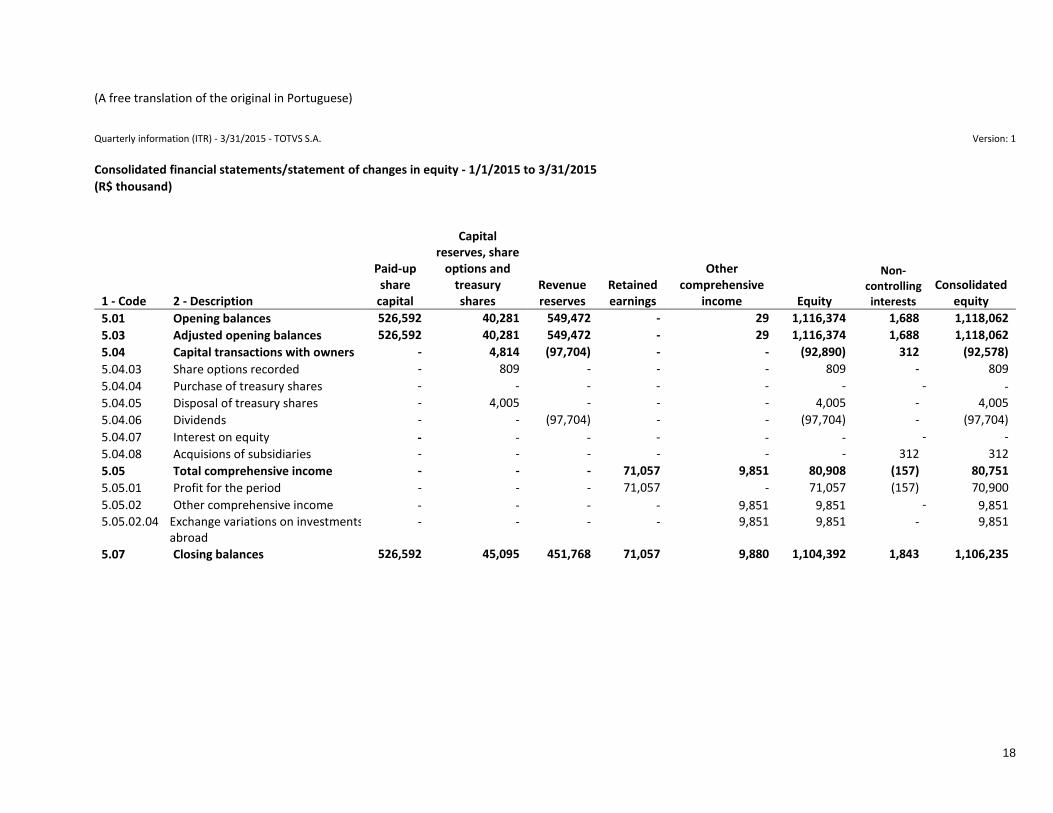
Consolidated financial statements/statement of changes in equity - 1/1/2015 to 3/31/2015
(R$ thousand)
1 - Code 2 - Description
Paid-up share
capital
Capital reserves, share
options and treasury shares
Revenue reserves
Retained earnings
Other comprehensive
income Equity
Non-controlling interests
Consolidated equity
5.01 Opening balances 526,592 40,281 549,472 - 29 1,116,374 1,688 1,118,062
5.03 Adjusted opening balances 526,592 40,281 549,472 - 29 1,116,374 1,688 1,118,062
5.04 Capital transactions with owners - 4,814 (97,704) - - (92,890) 312 (92,578)
5.04.03 Share options recorded - 809 - - - 809 - 809
5.04.04 Purchase of treasury shares - - - - - - - -
5.04.05 Disposal of treasury shares - 4,005 - - - 4,005 - 4,005
5.04.06 Dividends - - (97,704) - - (97,704) - (97,704)
5.04.07 Interest on equity - - - - - - - -
5.04.08 Acquisions of subsidiaries - - - - - - 312 312
5.05 Total comprehensive income - - - 71,057 9,851 80,908 (157) 80,751
5.05.01 Profit for the period - - - 71,057 - 71,057 (157) 70,900
5.05.02 Other comprehensive income - - - - 9,851 9,851 - 9,851 5.05.02.04 Exchange variations on investments
abroad - - - - 9,851 9,851 - 9,851
5.07 Closing balances 526,592 45,095 451,768 71,057 9,880 1,104,392 1,843 1,106,235
(A free translation of the original in Portuguese)
19
Quarterly information (ITR) - 3/31/2015 - TOTVS S.A. Version: 1
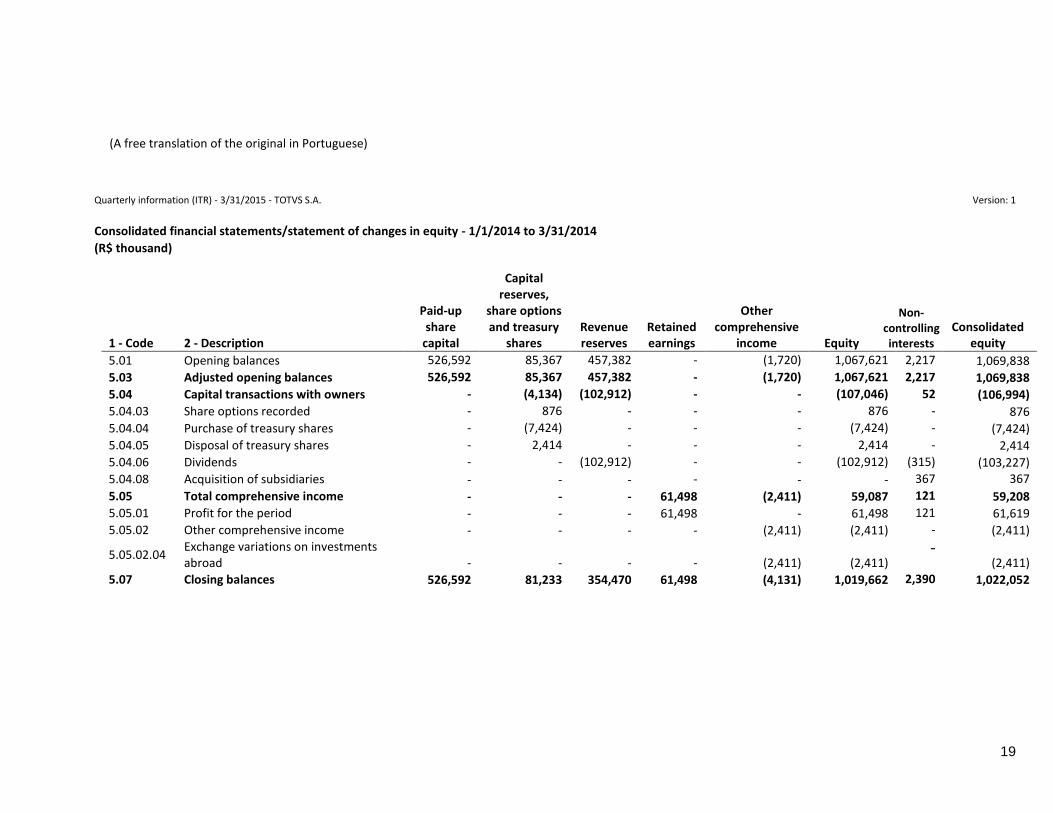
Consolidated financial statements/statement of changes in equity - 1/1/2014 to 3/31/2014
(R$ thousand)
1 - Code 2 - Description
Paid-up share
capital
Capital reserves,
share options and treasury
shares Revenue reserves
Retained earnings
Other comprehensive
income Equity
Non-controlling interests
Consolidated equity
5.01 Opening balances 526,592 85,367 457,382 - (1,720) 1,067,621 2,217 1,069,838
5.03 Adjusted opening balances 526,592 85,367 457,382 - (1,720) 1,067,621 2,217 1,069,838
5.04 Capital transactions with owners - (4,134) (102,912) - - (107,046) 52 (106,994)
5.04.03 Share options recorded - 876 - - - 876 - 876
5.04.04 Purchase of treasury shares - (7,424) - - - (7,424) - (7,424)
5.04.05 Disposal of treasury shares - 2,414 - - - 2,414 - 2,414
5.04.06 Dividends - - (102,912) - - (102,912) (315) (103,227)
5.04.08 Acquisition of subsidiaries - - - - - - 367 367 5.05 Total comprehensive income - - - 61,498 (2,411) 59,087 121 59,208
5.05.01 Profit for the period - - - 61,498 - 61,498 121 61,619
5.05.02 Other comprehensive income - - - - (2,411) (2,411) - (2,411)
5.05.02.04 Exchange variations on investments abroad - - - - (2,411) (2,411)
- (2,411)
5.07 Closing balances 526,592 81,233 354,470 61,498 (4,131) 1,019,662 2,390 1,022,052
(A free translation of the original in Portuguese)
20
Quarterly information (ITR) - 3/31/2015 - TOTVS S.A. Version: 1
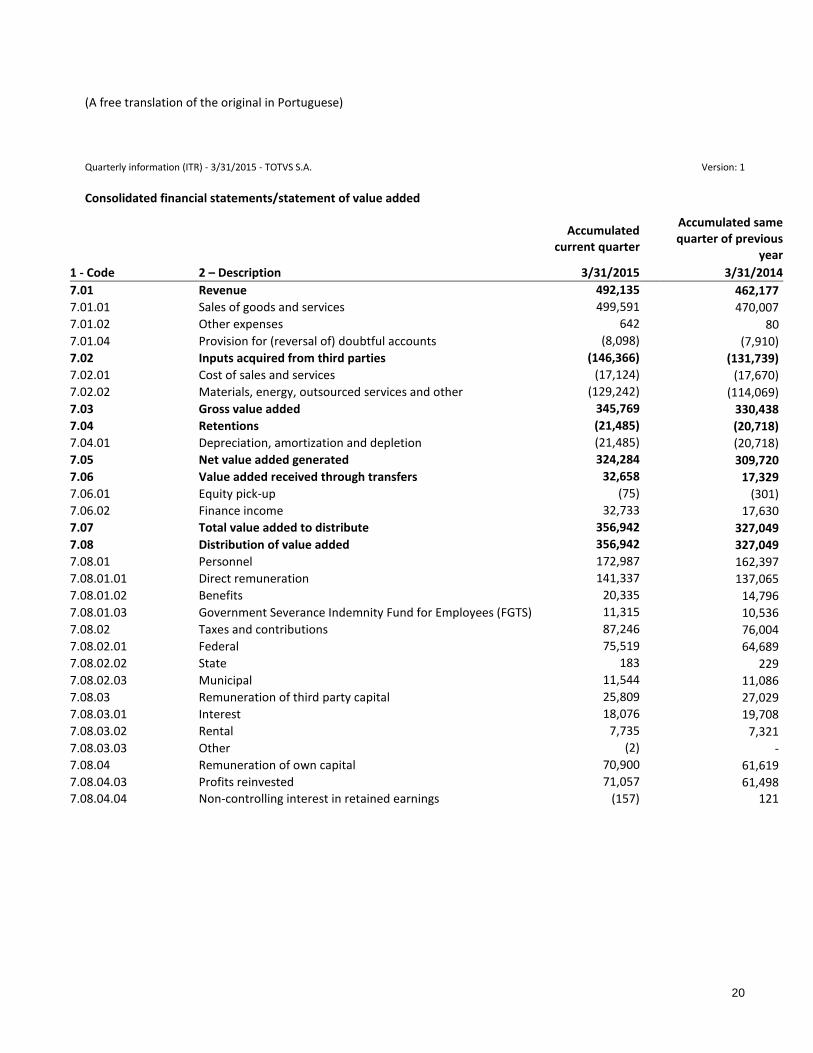
Consolidated financial statements/statement of value added
Accumulated
current quarter
Accumulated same quarter of previous
year
1 - Code 2 – Description 3/31/2015 3/31/2014
7.01 Revenue 492,135 462,177
7.01.01 Sales of goods and services 499,591 470,007
7.01.02 Other expenses 642 80
7.01.04 Provision for (reversal of) doubtful accounts (8,098) (7,910)
7.02 Inputs acquired from third parties (146,366) (131,739)
7.02.01 Cost of sales and services (17,124) (17,670)
7.02.02 Materials, energy, outsourced services and other (129,242) (114,069)
7.03 Gross value added 345,769 330,438
7.04 Retentions (21,485) (20,718)
7.04.01 Depreciation, amortization and depletion (21,485) (20,718)
7.05 Net value added generated 324,284 309,720
7.06 Value added received through transfers 32,658 17,329
7.06.01 Equity pick-up (75) (301)
7.06.02 Finance income 32,733 17,630
7.07 Total value added to distribute 356,942 327,049
7.08 Distribution of value added 356,942 327,049
7.08.01 Personnel 172,987 162,397
7.08.01.01 Direct remuneration 141,337 137,065
7.08.01.02 Benefits 20,335 14,796
7.08.01.03 Government Severance Indemnity Fund for Employees (FGTS) 11,315 10,536
7.08.02 Taxes and contributions 87,246 76,004
7.08.02.01 Federal 75,519 64,689
7.08.02.02 State 183 229
7.08.02.03 Municipal 11,544 11,086
7.08.03 Remuneration of third party capital 25,809 27,029
7.08.03.01 Interest 18,076 19,708
7.08.03.02 Rental 7,735 7,321
7.08.03.03 Other (2) -
7.08.04 Remuneration of own capital 70,900 61,619
7.08.04.03 Profits reinvested 71,057 61,498 7.08.04.04 Non-controlling interest in retained earnings (157) 121
(A free translation of the original in Portuguese)
21
COMMENTS ON PERFORMANCE
CONSOLIDATED OPERATING AND FINANCIAL PERFORMANCE
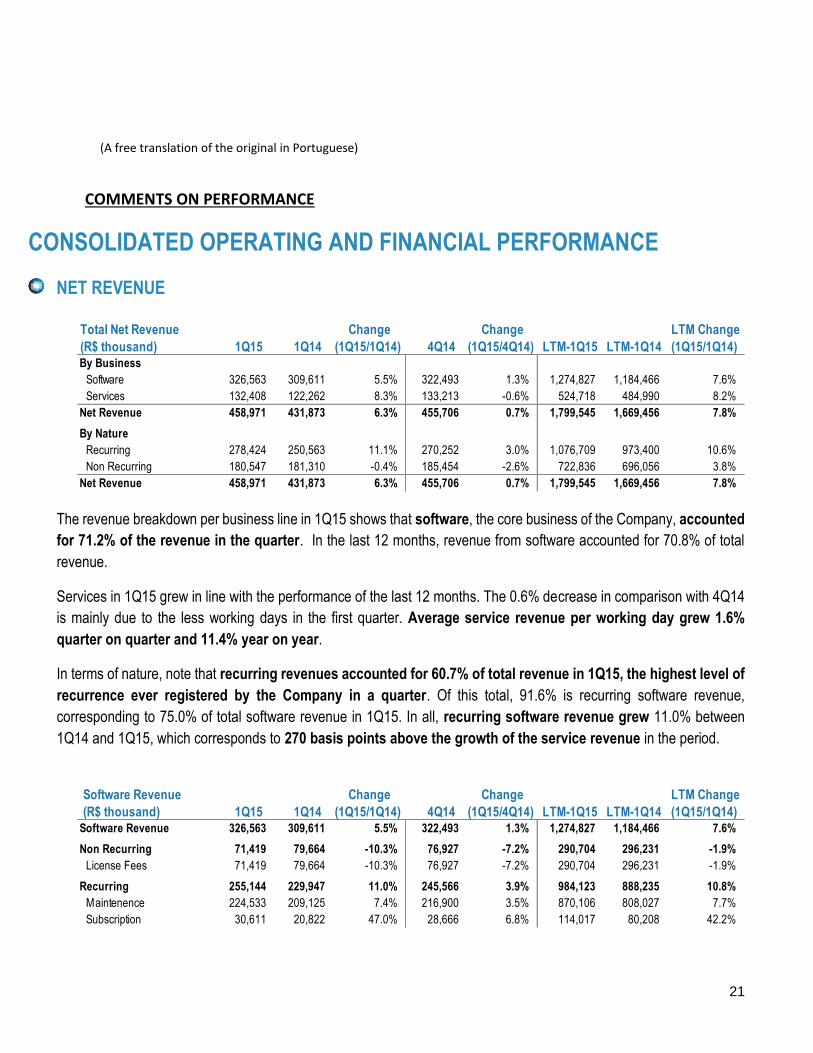
NET REVENUE
The revenue breakdown per business line in 1Q15 shows that software, the core business of the Company, accounted
for 71.2% of the revenue in the quarter. In the last 12 months, revenue from software accounted for 70.8% of total
revenue.
Services in 1Q15 grew in line with the performance of the last 12 months. The 0.6% decrease in comparison with 4Q14
is mainly due to the less working days in the first quarter. Average service revenue per working day grew 1.6%
quarter on quarter and 11.4% year on year.
In terms of nature, note that recurring revenues accounted for 60.7% of total revenue in 1Q15, the highest level of
recurrence ever registered by the Company in a quarter. Of this total, 91.6% is recurring software revenue,
corresponding to 75.0% of total software revenue in 1Q15. In all, recurring software revenue grew 11.0% between
1Q14 and 1Q15, which corresponds to 270 basis points above the growth of the service revenue in the period.
Total Net Revenue
(R$ thousand) 1Q15 1Q14
Change
(1Q15/1Q14) 4Q14
Change
(1Q15/4Q14) LTM-1Q15 LTM-1Q14
LTM Change
(1Q15/1Q14) By Business
Software 326,563 309,611 5.5% 322,493 1.3% 1,274,827 1,184,466 7.6%
Services 132,408 122,262 8.3% 133,213 -0.6% 524,718 484,990 8.2%
Net Revenue 458,971 431,873 6.3% 455,706 0.7% 1,799,545 1,669,456 7.8%
By Nature
Recurring 278,424 250,563 11.1% 270,252 3.0% 1,076,709 973,400 10.6%
Non Recurring 180,547 181,310 -0.4% 185,454 -2.6% 722,836 696,056 3.8%
Net Revenue 458,971 431,873 6.3% 455,706 0.7% 1,799,545 1,669,456 7.8%
Software Revenue
(R$ thousand) 1Q15 1Q14
Change
(1Q15/1Q14) 4Q14
Change
(1Q15/4Q14) LTM-1Q15 LTM-1Q14
LTM Change
(1Q15/1Q14) Software Revenue 326,563 309,611 5.5% 322,493 1.3% 1,274,827 1,184,466 7.6%
Non Recurring 71,419 79,664 -10.3% 76,927 -7.2% 290,704 296,231 -1.9%
License Fees 71,419 79,664 -10.3% 76,927 -7.2% 290,704 296,231 -1.9%
Recurring 255,144 229,947 11.0% 245,566 3.9% 984,123 888,235 10.8%
Maintenence 224,533 209,125 7.4% 216,900 3.5% 870,106 808,027 7.7%
Subscription 30,611 20,822 47.0% 28,666 6.8% 114,017 80,208 42.2%
(A free translation of the original in Portuguese)
22
Maintenance revenue accounted for 80.6% of total recurring revenue and for 88.0% of recurring revenue from software
in 1Q15. The year on year growth of 7.4% in maintenance revenue in 1Q15 is 1.9 percentage points higher than
the 12 month accumulated IGP-M index (inflation index used in most of the maintenance agreements) average of last
year.
Subscription revenue in 1Q15 grew 47.0% year on year, with 816 new subscription clients added, growing 47.3%
from 1Q14. In 1Q15, subscription revenue already accounted for 12.0% of total recurring revenue from software,
compared to 9.1% in 1Q14. The growth in this revenue line accounted for 38.8% of the growth in recurring revenue from
software between 1Q14 and 1Q15.
The drop of 23.6% in license sales to new clients (see table below) is mainly related to the decline in economic activity
in Brazil and the transfer of TOTVS’ sales pipeline to acquired companies in the last two years, whose proportional
contribution to recurring revenues is higher.
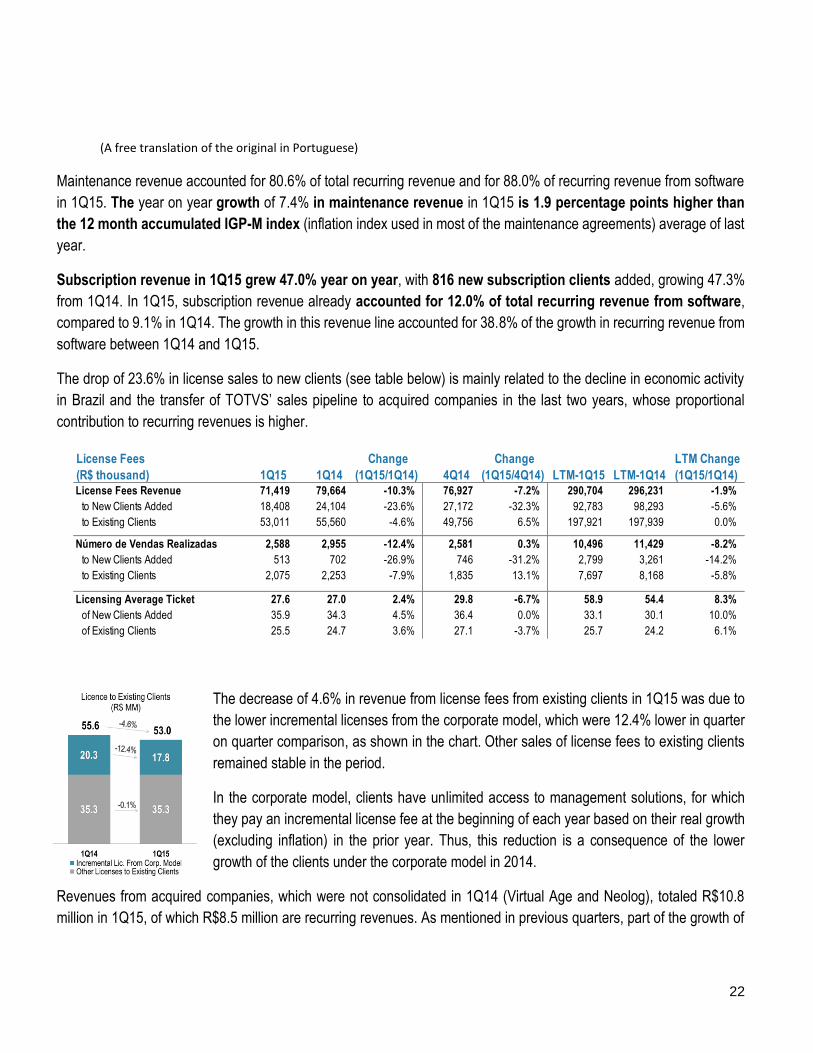
The decrease of 4.6% in revenue from license fees from existing clients in 1Q15 was due to
the lower incremental licenses from the corporate model, which were 12.4% lower in quarter
on quarter comparison, as shown in the chart. Other sales of license fees to existing clients
remained stable in the period.
In the corporate model, clients have unlimited access to management solutions, for which
they pay an incremental license fee at the beginning of each year based on their real growth
(excluding inflation) in the prior year. Thus, this reduction is a consequence of the lower
growth of the clients under the corporate model in 2014.
Revenues from acquired companies, which were not consolidated in 1Q14 (Virtual Age and Neolog), totaled R$10.8
million in 1Q15, of which R$8.5 million are recurring revenues. As mentioned in previous quarters, part of the growth of
License Fees
(R$ thousand) 1Q15 1Q14
Change
(1Q15/1Q14) 4Q14
Change
(1Q15/4Q14) LTM-1Q15 LTM-1Q14
LTM Change
(1Q15/1Q14) License Fees Revenue 71,419 79,664 -10.3% 76,927 -7.2% 290,704 296,231 -1.9%
to New Clients Added 18,408 24,104 -23.6% 27,172 -32.3% 92,783 98,293 -5.6%
to Existing Clients 53,011 55,560 -4.6% 49,756 6.5% 197,921 197,939 0.0%
Número de Vendas Realizadas 2,588 2,955 -12.4% 2,581 0.3% 10,496 11,429 -8.2%
to New Clients Added 513 702 -26.9% 746 -31.2% 2,799 3,261 -14.2%
to Existing Clients 2,075 2,253 -7.9% 1,835 13.1% 7,697 8,168 -5.8%
Licensing Average Ticket 27.6 27.0 2.4% 29.8 -6.7% 58.9 54.4 8.3%
of New Clients Added 35.9 34.3 4.5% 36.4 0.0% 33.1 30.1 10.0%
of Existing Clients 25.5 24.7 3.6% 27.1 -3.7% 25.7 24.2 6.1%
(A free translation of the original in Portuguese)
23
these acquired companies is organic, since TOTVS transfers opportunities from its sales pipeline to the acquired
companies.
CONTRIBUTION MARGIN BY BUSINESS
The decrease of 140 basis points in software contribution margin between 1Q14 and 1Q15 is mainly concentrated in
cost of support and in research and development expenses. As a ratio of software revenue, these two lines combined
increased from 24.8% in 1Q14 to 26.9% in 1Q15. Said increase was mainly due to: (i) the transition to the subscription
model, given that subscription revenue has a time-deferral effect that does not affect these costs and expenses; (ii) the
inorganic impact of Virtual Age and Neolog; and (iii) wage increases in the period.
Between 4Q14 and 1Q15, software contribution margin increased 140 basis points, mainly due to: (i) higher research
and development expenses in 4Q14, due to additional expenses from layoffs s accumulated throughout 2014; (ii)
retroactive effects on provisions for vacation and Christmas bonus (13th salary) resulting from wage increases in 4Q14;
and (iii) the reduction in software costs due to the lower share of partner solutions in the sales mix in the period.
The decrease of 230 basis points in the services contribution margin between 1Q14 and 1Q15 was mainly due to the
cost of services on account of the wage increases under collective bargaining agreements, already described in the
section on software contribution margin.
The increase of 410 basis points in service contribution margin between 4Q14 and 1Q15, despite the 7.0% wage
increase under the collective bargaining agreement signed in the state of São Paulo in 1Q15, was essentially due to: (i)
additional expenses from layoffs in 4Q14; and (ii) retroactive effects on provisions for vacation and Christmas bonus
(13th salary) resulting from wage increases in 4Q14.
Services Result
(R$ thousand) 1Q15 1Q14
Change
(1Q15/1Q14) 4Q14
Change
(1Q15/4Q14) LTM-1Q15 LTM-1Q14
LTM Change
(1Q15/1Q14) Services Revenue 132,408 122,262 8.3% 133,213 -0.6% 524,718 484,990 8.2%
Cost of Services (112,675) (101,277) 11.3% (118,820) -5.2% (443,705) (410,412) 8.1%
Services Result 19,733 20,985 -6.0% 14,393 37.1% 81,013 74,578 8.6%
Services Contibution Margin 14.9% 17.2% -230 bp 10.8% 410 bp 15.4% 15.4% 0 bp
Software Result
(R$ thousand) 1Q15 1Q14
Change
(1Q15/1Q14) 4Q14
Change
(1Q15/4Q14) LTM-1Q15 LTM-1Q14
LTM Change
(1Q15/1Q14) Software Revenue 326,563 309,611 5.5% 322,493 1.3% 1,274,827 1,184,466 7.6%
Cost of Software (17,125) (18,338) -6.6% (22,276) -23.1% (81,230) (72,687) 11.8%
Cost of Support (24,855) (19,565) 27.0% (22,450) 10.7% (89,699) (69,325) 29.4%
Research and Development (62,911) (57,206) 10.0% (63,408) -0.8% (246,095) (223,829) 9.9%
Software Result 221,672 214,502 3.3% 214,359 3.4% 857,803 818,625 4.8%
Software Contibution Margin 67.9% 69.3% -140 bp 66.5% 140 bp 67.3% 69.1% -180 bp
(A free translation of the original in Portuguese)
24
OTHER OPERATING EXPENSES
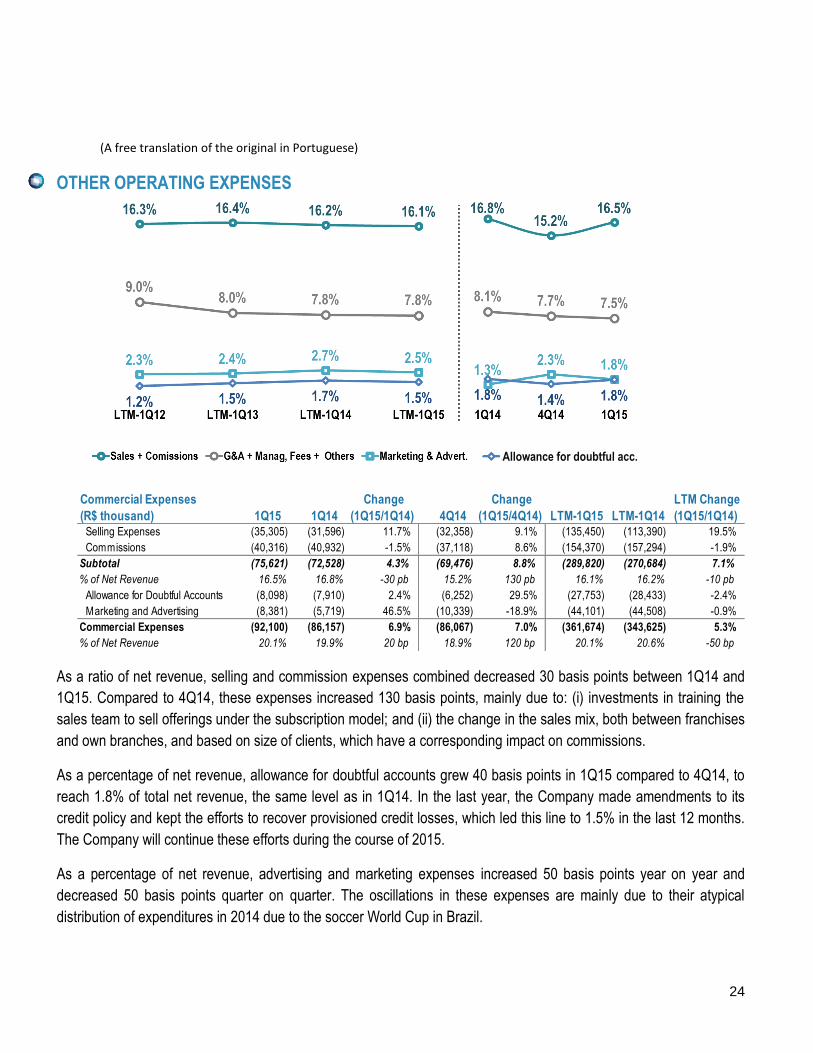
As a ratio of net revenue, selling and commission expenses combined decreased 30 basis points between 1Q14 and
1Q15. Compared to 4Q14, these expenses increased 130 basis points, mainly due to: (i) investments in training the
sales team to sell offerings under the subscription model; and (ii) the change in the sales mix, both between franchises
and own branches, and based on size of clients, which have a corresponding impact on commissions.
As a percentage of net revenue, allowance for doubtful accounts grew 40 basis points in 1Q15 compared to 4Q14, to
reach 1.8% of total net revenue, the same level as in 1Q14. In the last year, the Company made amendments to its
credit policy and kept the efforts to recover provisioned credit losses, which led this line to 1.5% in the last 12 months.
The Company will continue these efforts during the course of 2015.
As a percentage of net revenue, advertising and marketing expenses increased 50 basis points year on year and
decreased 50 basis points quarter on quarter. The oscillations in these expenses are mainly due to their atypical
distribution of expenditures in 2014 due to the soccer World Cup in Brazil.
Commercial Expenses
(R$ thousand) 1Q15 1Q14
Change
(1Q15/1Q14) 4Q14
Change
(1Q15/4Q14) LTM-1Q15 LTM-1Q14
LTM Change
(1Q15/1Q14) Selling Expenses (35,305) (31,596) 11.7% (32,358) 9.1% (135,450) (113,390) 19.5%
Commissions (40,316) (40,932) -1.5% (37,118) 8.6% (154,370) (157,294) -1.9%
Subtotal (75,621) (72,528) 4.3% (69,476) 8.8% (289,820) (270,684) 7.1%
% of Net Revenue 16.5% 16.8% -30 pb 15.2% 130 pb 16.1% 16.2% -10 pb
Allowance for Doubtful Accounts (8,098) (7,910) 2.4% (6,252) 29.5% (27,753) (28,433) -2.4%
Marketing and Advertising (8,381) (5,719) 46.5% (10,339) -18.9% (44,101) (44,508) -0.9%
Commercial Expenses (92,100) (86,157) 6.9% (86,067) 7.0% (361,674) (343,625) 5.3%
% of Net Revenue 20.1% 19.9% 20 bp 18.9% 120 bp 20.1% 20.6% -50 bp
Allowance for doubtful acc.
(A free translation of the original in Portuguese)
25
General and administrative (G&A) expenses increased by 8.8% year on year and 3.7% quarter on quarter, mainly
influenced by the collective bargaining agreement in São Paulo and by the merger of the administrative teams of
companies acquired in the period.
Management Fees decreased by 30.9% year-on-year and 16.7% quarter-on-quarter, mainly due to the provisioning for
bonus linked to financial and individual targets of executives, and to the provisioning for the stock option plan.
The decrease in other expenses compared to 4Q14 is explained by the provision for impairment of R$1.6 million related
to the minority interest in uMove.me, as mentioned in 4Q14. This stake was sold in 1Q15.
Depreciation and amortization totaled R$21.485 million in the quarter, of which R$6.078 million referred to depreciation
of fixed assets and R$15.407 million to amortization of intangible assets.
EBITDA AND NET INCOME
Administrative and Other
Expenses
(R$ thousand) 1Q15 1Q14
Change
(1Q15/1Q14) 4Q14
Change
(1Q15/4Q14) LTM-1Q15 LTM-1Q14
LTM Change
(1Q15/1Q14) General and Administrative (29,283) (26,903) 8.8% (28,251) 3.7% (116,756) (100,723) 15.9%
Management Fees (5,721) (8,277) -30.9% (6,870) -16.7% (23,493) (29,793) -21.1%
Other Expenses 640 81 690.1% (1,103) -158.0% 404 (280) -244.3%
Administrative and Other Expenses (34,364) (35,099) -2.1% (36,224) -5.1% (139,845) (130,796) 6.9%
% of Net Revenue 7.5% 8.1% -60 bp 7.9% -40 bp 7.8% 7.8% 0 bp
Depreciation and
Amortization Expenses 1Q15 1Q14
Change
(1Q15/1Q14) 4Q14
Change
(1Q15/4Q14) LTM-1Q15 LTM-1Q14
LTM Change
(1Q15/1Q14) Depreciation (6,078) (5,452) 11.5% (5,648) 7.6% (22,455) (20,037) 12.1%
Amortization (15,407) (15,266) 0.9% (17,875) -13.8% (67,240) (61,677) 9.0%
Depreciation and Amortization (21,485) (20,718) 3.7% (23,523) -8.7% (89,695) (81,714) 9.8%
% of Net Revenue -4.7% -4.8% 10 bp -5.2% 50 bp -5.0% -4.9% -10 bp
EBITDA and Net Income
(R$ thousand) 1Q15 1Q14
Change
(1Q15/1Q14) 4Q14
Change
(1Q15/4Q14) LTM-1Q15 LTM-1Q14
LTM Change
(1Q15/1Q14) Net Income 70,900 61,619 15.1% 69,057 2.7% 272,079 232,825 16.9%
Net Margin 15.4% 14.3% 110 pb 15.2% 20 pb 15.1% 13.9% 120 pb
Equity Pickup (75) (301) -75.1% (124) -39.5% (357) (797) -55.2%
Income Tax and Social Contribution (37,138) (29,515) 25.8% (22,698) 63.6% (105,083) (97,426) 7.9%
Financial Result 14,657 (2,078) -805.3% 8,941 63.9% 29,917 (6,020) -597.0%
Depreciation and Amortization (21,485) (20,718) 3.7% (23,523) -8.7% (89,695) (81,714) 9.8%
EBITDA 114,941 114,231 0.6% 106,461 8.0% 437,297 418,782 4.4%
EBITDA Margin 25.0% 26.5% -150 bp 23.4% 160 bp 24.3% 25.1% -80 bp

(A free translation of the original in Portuguese)
26
EBITDA margin in 1Q15 came to 25.0%, down 150 basis points from 1Q14. The decrease in EBITDA margin year-on-
year was mainly due to the lower contribution margin from the Software and Services business segments (see
“Contribution Margin by Business”). The increase of 160 basis points of the EBITDA margin when compared to 1Q14 was
mainly due to the recovery of the businesses contribution margins and to the lower representativeness of the administrative
expenses as a percentual of the net revenue.
The EBITDA margin management in this quarter also involved the following additional challenges: (i) cumulative 12-month
average inflation measured by the IGP-M of 3.8% in 1Q15, compared to the average 12-month inflation measured by the
IPC-A of 7.5% in the quarter; (ii) wage increase of 7.0% under the collective bargaining agreement in São Paulo; (iii)
12.4% decline in the incremental license fees of corporate model.
Net income came to R$70.900 million in the quarter, growing 15.1% from the same period in the previous year, with net
margin of 15.4%, an increase of 110 basis points from 1Q14. In the last 12 months, net income grew 16.9%, or 12.5
percentage points above EBITDA growth, with net margin of 15.1%, an increase of 120 basis points from the LTM-1Q14.

(A free translation of the original in Portuguese)
27
Net income outgrew EBITDA due to the following factors: (i) positive financial result of R$14.657 million in 1Q15,
compared to a negative financial result of R$2.078 million in 1Q14; and (ii) lower growth of depreciation and amortization
expenses.
The positive financial result was due to a combination of: (i) higher financial revenue, driven by the higher balance of
financial investments; (ii) lower financial expenses year on year, mainly due to the non-recurring adjustment of the
debentures interest on 1Q14, amounting R$2.807 million; and (iii) the result from the sale of minority interest in
ZeroPaper in January 2015.
The increase in the effective tax rate was due to: (i) the adjustment to the provision for income tax of 2014 related to
subsidiaries; and (ii) the smaller share of research and development projects eligible for “Lei do Bem” in relation to EBT
(earnings before taxes).
(A free translation of the original in Portuguese)
28
CASH FLOW AND NET DEBT
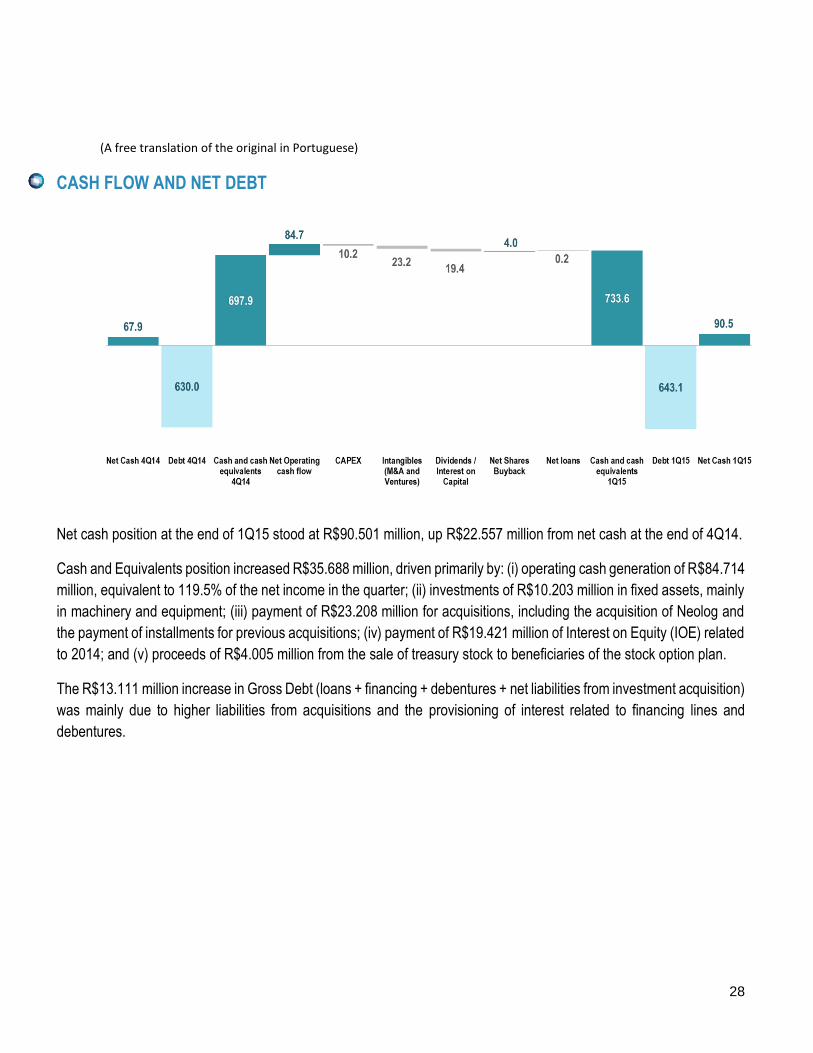
Net cash position at the end of 1Q15 stood at R$90.501 million, up R$22.557 million from net cash at the end of 4Q14.
Cash and Equivalents position increased R$35.688 million, driven primarily by: (i) operating cash generation of R$84.714
million, equivalent to 119.5% of the net income in the quarter; (ii) investments of R$10.203 million in fixed assets, mainly
in machinery and equipment; (iii) payment of R$23.208 million for acquisitions, including the acquisition of Neolog and
the payment of installments for previous acquisitions; (iv) payment of R$19.421 million of Interest on Equity (IOE) related
to 2014; and (v) proceeds of R$4.005 million from the sale of treasury stock to beneficiaries of the stock option plan.
The R$13.111 million increase in Gross Debt (loans + financing + debentures + net liabilities from investment acquisition)
was mainly due to higher liabilities from acquisitions and the provisioning of interest related to financing lines and
debentures.
(A free translation of the original in Portuguese)
29
Notes to the financial statements
1. Operations TOTVS S.A. (reinafter referred to as the parent company, TOTVS or the Company) is a publicly-held corporation, which is headquartered at Av. Braz Leme, 1631 - 2º floor, in the City and State of São Paulo, whose shares are traded on the Novo Mercado of BM&FBOVESPA – the Securities, Commodities and Futures Exchange. The Company’s business purpose is the development and sale of management software, productivity and collaboration plataforms, as well as provision of implementation, consulting, assistance and maintenance services. The solutions by the Company are segmented according to the economic sector of the economy, producing higher relevance of applications within the context of the business of our clients, both in back-office processes and for the specific processes of each segment. TOTVS’ parent company and consolidated financial statements were approved at the Board of Directors’ Meeting held on May 4, 2015. All amounts presented in these interim financial statements are expressed in thousands of Reais, except where otherwise indicated. Because the figures have been rounded, they may not add up precisely to their respective totals. Non-financial data included in this report, such as the number of clients, average tickets, market share, and other data items were not reviewed by our independent auditors.
2. Presentation of interim financial information and summary of accounting policies, assumptions and estimates
The principal accounting policies applied in preparing this interim financial information have been consistently applied to the years presented. This interim financial information does not include all of the information required for annual or complete financial statements, and therefore should be read together with the Company’s complete financial statements for the year ended December 31, 2014. To better reflect the results, our business and revenue arrangements, the Company added two new lines, one for the software subscription revenue and other for cost of support, as well as changed the nomenclature of the licensing fee cost to cost of software in its financial statements. Because of this change, revenue lines and costs disclosed in the first quarter 2014 were reclassified to maintain the comparability between periods.
(A free translation of the original in Portuguese)
30
2.1. Basis of preparation The financial statements were prepared using historical cost as the valuation basis, except for the valuation of certain assets and liabilities, such as financial instruments, which were measured at their fair value. (a) Consolidated financial information
The consolidated financial statements were prepared in accordance with CPC 21 - R1 (IAS 34), which is applicable to the preparation of interim financial information, and in accordance with the accounting practices adopted in Brazil, including the standards issued by the Securities and Exchange Commission (CVM) applicable to Quarterly Information (ITR). (b) Individual financial information The individual financial statements of the Company have been prepared in accordance with CPC 21(R1), applicable to the preparation of interim financial information, and in a manner consistent with the standards issued by the CVM applicable to ITR, and are disclosed in conjunction with the consolidated financial statements. (c) Changes in accounting policies and disclosure requirements There are no new pronouncements or interpretations of CPCs/IFRS effective from 2015 that could have a significant impact on the Company's interim financial information.
2.2. Consolidated interim financial information The consolidated interim financial information includes the Company’s operations and those of the following subsidiaries, in which the percentage interests held by the Company on its balance sheet are shown below: Direct Investments:
Head Interest %
Corporate Name office Denomination 3/31/2015 12/31/2014
TOTVS Rio Software Ltda. BRA TOTVS Rio 100.00 100.00
TOTVS Nordeste Software Ltda. BRA TOTVS Nordeste 100.00 100.00 TOTVS Brasília Software Ltda. BRA TOTVS Brasília 100.00 100.00 TQTVD Software Ltda. BRA TQTVD 100.00 100.00 TOTVS Ventures Participações Ltda. BRA TOTVS Ventures 100.00 100.00 TOTVS Soluções em Agroindústria S.A. BRA TOTVS Agroindústria 60.00 60.00
P2RX Soluções em Software S.A. BRA P2RX 60.00 60.00
TOTVS Argentina S.A. ARG TOTVS Argentina 100.00 100.00 Datasul Argentina S.A. ARG Datasul Argentina 100.00 100.00 TOTVS México S.A. MEX TOTVS México 100.00 100.00 Datasul S.A. de CV. MEX Datasul México 100.00 100.00

(A free translation of the original in Portuguese)
31
TOTVS Corporation BVI TOTVS Corporation 100.00 100.00 Eurototvs Lda. POR Eurototvs 100.00 100.00 TOTVS Incorporation USA TOTVS Inc. 100.00 100.00 Virtual Age Soluções em Tecnologia Ltda. BRA Virtual Age 100.00 100.00 Ciashop Soluções para Comércio Eletrônico S.A. BRA Ciashop 70.00 70.00 TOTVS Resultados em Outsourcing Ltda. BRA RO 100.00 100.00 Neolog Consultoria e Sistemas S.A. BRA Neolog (a) 60.00 -
Indirect Investments: Head Interest %
Corporate Name office Denomination Investor 3/31/2015 12/31/2014
DTS Consulting Partner. SA de CV MEX Partner TOTVS México 100.00 100.00 W&D Participações S.A. BRA W&D TOTVS Brasília 100.00 100.00 PC Informática S.A. BRA PC Informática W&D 100.00 100.00 uMov.me S.A. BRA uMov.me TOTVS Ventures 20.00 20.00 RMS Software S.A. BRA RMS TOTVS Nordeste 100.00 100.00 Webstrategie Software Ltda. BRA Webstrategie RMS 100.00 100.00
(a) Business Combinations in 2015.
The results of subsidiaries acquired during the period ended March 31, 2015 are included in the statements of income from the date of their acquisition. Therefore, for the purposes of comparison between the consolidated and parent company results for 2015 and 2014, the dates of acquisition and incorporation of each subsidiary’s results must be considered. All intercompany balances and transactions were eliminated in the consolidation.
2.3. Critical accounting estimates and assumptions
Accounting estimates and assumptions are continually assessed, and are based on historical experience and other factors, including expected future events which are considered to be relevant. Accounting estimates will rarely be equal to the actual results. For the period ended March 31, 2015, no changes in estimates and assumptions entailing a significant risk of causing relevant adjustments to the book values of assets and liabilities for the following fiscal year were recognized in addition to the latest annual financial statements.
3. Business combinations The acquisition made in 2015 have been in line with the Company's strategies of specialization and consolidation of its positions in different markets, in addition to bringing new solutions to TOTVS´s customers through portfolio diversification, offering tailored solutions for specific niches.
(A free translation of the original in Portuguese)
32
3.1. Business combinations
Neolog – Consultoria e Sistemas S.A. On February 11, 2015, the Company acquired 60% of the capital of Neolog Consultoria e Sistemas S.A., (Neolog) for R$15,547. This Company is focused on the development of SaaS solutions for the logistics and supply chain management. This Agreement also includes the payment of an additional variable amount, which shall be paid in accordance with metrics defined in the Agreement up until June 30, 2016. The Agreement also foresees a future purchase by the Company of the remaining capital of Neolog, which can be executed between January 2018 and January 2020, by a variable amount based on Neolog’s performance metrics. Due to the being a step acquisition, the Company recorded the estimated amount at R$13,584, concerning the payment for the acquisition of the remaining interest.
3.2. Identifiable assets acquired and goodwill
The amount paid for the acquisition of control of Virtual Age and Neolog is being allocated among the identified assets acquired and liabilities assumed at their fair values at the acquisition date, and this process had not been completed at the time of disclosure of this interim financial information. The fair value, goodwill and the cost of holding interest on the acquisition date of the identificable assets acquiried that impacted this interim financial information ended on March 31, 2015 are presented below:
Preliminar fair value Neolog
Assets 1,421
Cash and Cash equivalents 254 Accounts receivable 1,005 Other current assets 162 Non-current assets 638 Current liabilities 1,090 Non-current liabilities 184 Minority participation 314 Liquid assets and liabilities 471 Acquisition cost 16,223 Contingent Consideration 13,584
Goodwill in the operation 29,336
(A free translation of the original in Portuguese)
33
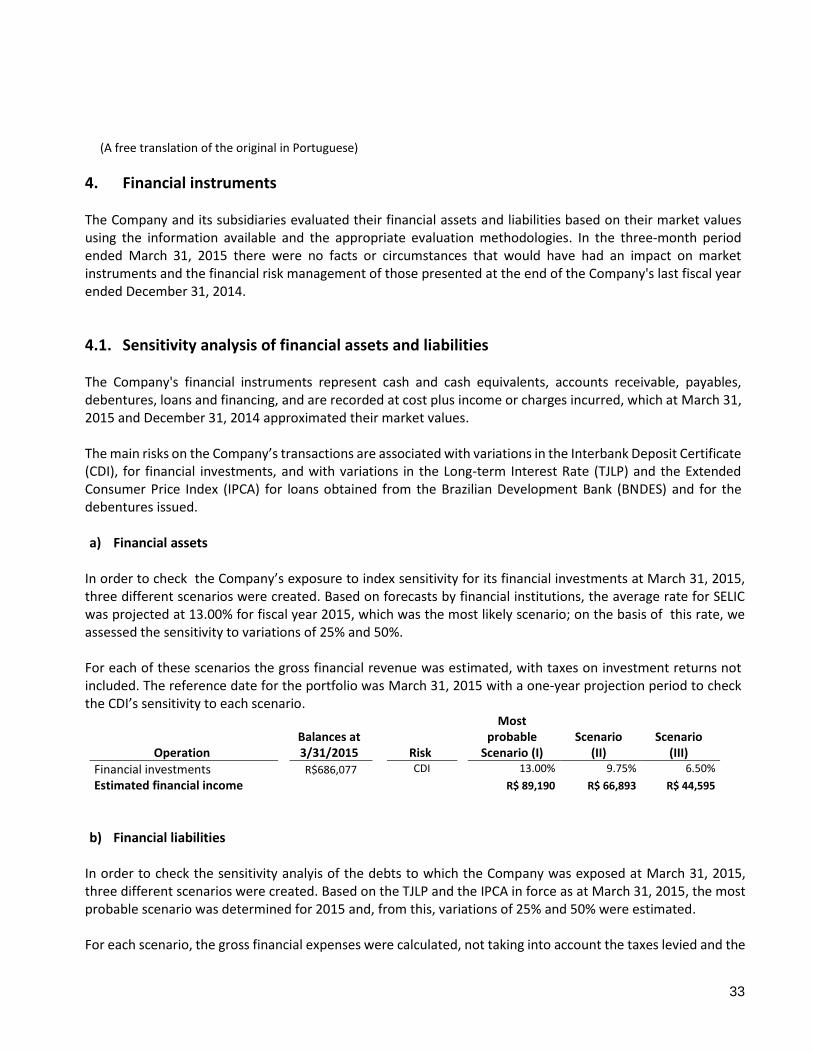
4. Financial instruments The Company and its subsidiaries evaluated their financial assets and liabilities based on their market values using the information available and the appropriate evaluation methodologies. In the three-month period ended March 31, 2015 there were no facts or circumstances that would have had an impact on market instruments and the financial risk management of those presented at the end of the Company's last fiscal year ended December 31, 2014.
4.1. Sensitivity analysis of financial assets and liabilities The Company's financial instruments represent cash and cash equivalents, accounts receivable, payables, debentures, loans and financing, and are recorded at cost plus income or charges incurred, which at March 31, 2015 and December 31, 2014 approximated their market values. The main risks on the Company’s transactions are associated with variations in the Interbank Deposit Certificate (CDI), for financial investments, and with variations in the Long-term Interest Rate (TJLP) and the Extended Consumer Price Index (IPCA) for loans obtained from the Brazilian Development Bank (BNDES) and for the debentures issued. a) Financial assets
In order to check the Company’s exposure to index sensitivity for its financial investments at March 31, 2015, three different scenarios were created. Based on forecasts by financial institutions, the average rate for SELIC was projected at 13.00% for fiscal year 2015, which was the most likely scenario; on the basis of this rate, we assessed the sensitivity to variations of 25% and 50%. For each of these scenarios the gross financial revenue was estimated, with taxes on investment returns not included. The reference date for the portfolio was March 31, 2015 with a one-year projection period to check the CDI’s sensitivity to each scenario.
Operation Balances at 3/31/2015 Risk
Most probable
Scenario (I) Scenario
(II) Scenario
(III)
Financial investments R$686,077 CDI 13.00% 9.75% 6.50%
Estimated financial income R$ 89,190 R$ 66,893 R$ 44,595
b) Financial liabilities
In order to check the sensitivity analyis of the debts to which the Company was exposed at March 31, 2015, three different scenarios were created. Based on the TJLP and the IPCA in force as at March 31, 2015, the most probable scenario was determined for 2015 and, from this, variations of 25% and 50% were estimated. For each scenario, the gross financial expenses were calculated, not taking into account the taxes levied and the

(A free translation of the original in Portuguese)
34
maturities of each agreement scheduled for 2015. The reference date used for the financing and debentures was March 31, 2015, projecting the rates for one year and checking their sensitivity under each scenario.
Operation
Balances at 3/31/2015 Risk
Most probable Scenario I Scenario II Scenario III
Financing R$484,439 TJLP 5.50% 6.88% 8.25% Rate subject to variation R$26,644 R$ 33,329 R$39,966 Debentures R$116,515 IPCA 8.13% 10.16% 12.20% TJLP 5.50% 6.88% 8.25%
Rate/index subject to variation R$11,524 R$12,640 R$13,749
4.2. Financial assets at fair value TOTVS Ventures´ investments in startups, are made in view of a medium-term strategy, with output planned for the moment when the expected financial returns are achieved. As these startups are privately held companies and have no prices quoted in an active market, their fair value is based on discounted cash flow using a rate based on the interest rate and the market risk premium specific to each investment. At the March 31,2015 the total of investments in startups was R$55,907. On January 21,2015, TOTVS Ventures announced the divestment of its noncontrolling interest in ZeroPaper.
5. Cash and cash equivalents Cash equivalents are maintained for the purpose of meeting short-term cash requirements and for investment or other purposes, are redeemable for a period of up to 90 days from the date of the respective transaction.
Company Consolidated
03/31/2015 12/31/2014 03/31/2015 12/31/2014
Cash 16,456 32,518 47,512 61,564
Cash equivalents 669,038 626,718 686,077 636,337
Purchase and sale commitments 668,812 618,429 656,912 598,649
CDB 226 8,289 29,165 37,688
685,494 659,236 733,589 697,901
The Company has financial investment policies, which establish that investments should focus on low-risk securities and the investments in top-tier financial institutions, and are significantly remunerated based on the CDI rate, which averaged 0.93% a month during the three-month period ended on March 31,2015.
(A free translation of the original in Portuguese)
35
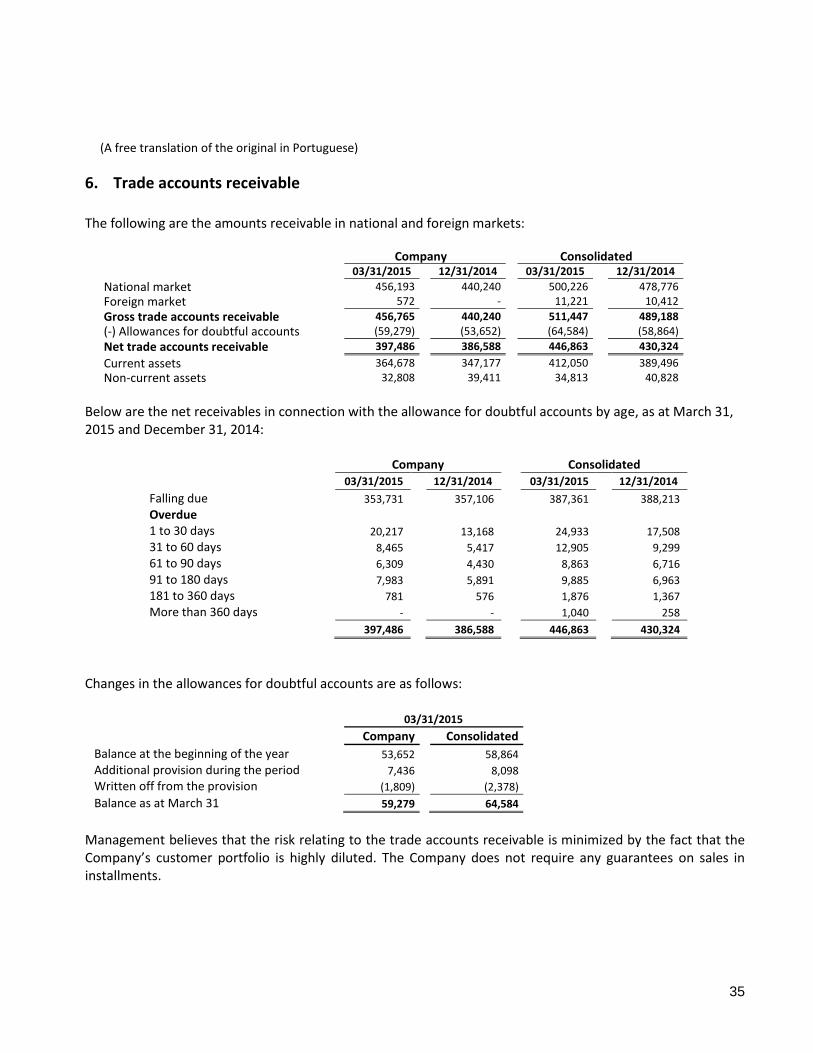
6. Trade accounts receivable
The following are the amounts receivable in national and foreign markets:
Company Consolidated 03/31/2015 12/31/2014 03/31/2015 12/31/2014
National market 456,193 440,240 500,226 478,776
Foreign market 572 - 11,221 10,412
Gross trade accounts receivable 456,765 440,240 511,447 489,188
(-) Allowances for doubtful accounts (59,279) (53,652) (64,584) (58,864)
Net trade accounts receivable 397,486 386,588 446,863 430,324
Current assets 364,678 347,177 412,050 389,496
Non-current assets 32,808 39,411 34,813 40,828
Below are the net receivables in connection with the allowance for doubtful accounts by age, as at March 31, 2015 and December 31, 2014:
Company Consolidated
03/31/2015 12/31/2014 03/31/2015 12/31/2014
Falling due 353,731 357,106 387,361 388,213
Overdue
1 to 30 days 20,217 13,168 24,933 17,508
31 to 60 days 8,465 5,417 12,905 9,299
61 to 90 days 6,309 4,430 8,863 6,716
91 to 180 days 7,983 5,891 9,885 6,963
181 to 360 days 781 576 1,876 1,367
More than 360 days - - 1,040 258
397,486 386,588 446,863 430,324
Changes in the allowances for doubtful accounts are as follows:
03/31/2015
Company Consolidated
Balance at the beginning of the year 53,652 58,864 Additional provision during the period 7,436 8,098 Written off from the provision (1,809) (2,378)
Balance as at March 31 59,279 64,584
Management believes that the risk relating to the trade accounts receivable is minimized by the fact that the Company’s customer portfolio is highly diluted. The Company does not require any guarantees on sales in installments.
(A free translation of the original in Portuguese)
36
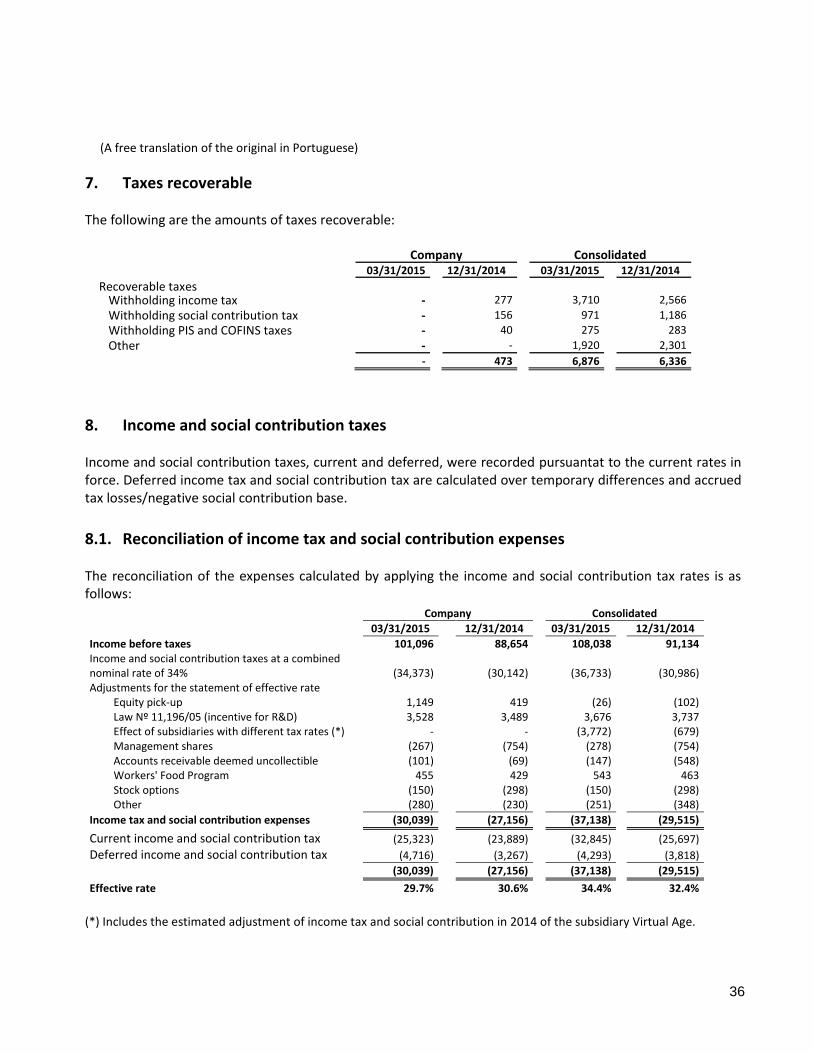
7. Taxes recoverable The following are the amounts of taxes recoverable:
Company Consolidated 03/31/2015 12/31/2014 03/31/2015 12/31/2014
Recoverable taxes Withholding income tax - 277 3,710 2,566
Withholding social contribution tax - 156 971 1,186
Withholding PIS and COFINS taxes - 40 275 283
Other - - 1,920 2,301
- 473 6,876 6,336
8. Income and social contribution taxes Income and social contribution taxes, current and deferred, were recorded pursuantat to the current rates in force. Deferred income tax and social contribution tax are calculated over temporary differences and accrued tax losses/negative social contribution base.
8.1. Reconciliation of income tax and social contribution expenses The reconciliation of the expenses calculated by applying the income and social contribution tax rates is as follows:
Company Consolidated
03/31/2015 12/31/2014 03/31/2015 12/31/2014
Income before taxes 101,096 88,654 108,038 91,134 Income and social contribution taxes at a combined nominal rate of 34% (34,373) (30,142) (36,733) (30,986) Adjustments for the statement of effective rate
Equity pick-up 1,149 419 (26) (102) Law Nº 11,196/05 (incentive for R&D) 3,528 3,489 3,676 3,737 Effect of subsidiaries with different tax rates (*) - - (3,772) (679) Management shares (267) (754) (278) (754) Accounts receivable deemed uncollectible (101) (69) (147) (548) Workers' Food Program 455 429 543 463 Stock options (150) (298) (150) (298) Other (280) (230) (251) (348)
Income tax and social contribution expenses (30,039) (27,156) (37,138) (29,515)
Current income and social contribution tax (25,323) (23,889) (32,845) (25,697)
Deferred income and social contribution tax (4,716) (3,267) (4,293) (3,818)
(30,039) (27,156) (37,138) (29,515)
Effective rate 29.7% 30.6% 34.4% 32.4%
(*) Includes the estimated adjustment of income tax and social contribution in 2014 of the subsidiary Virtual Age.
(A free translation of the original in Portuguese)
37
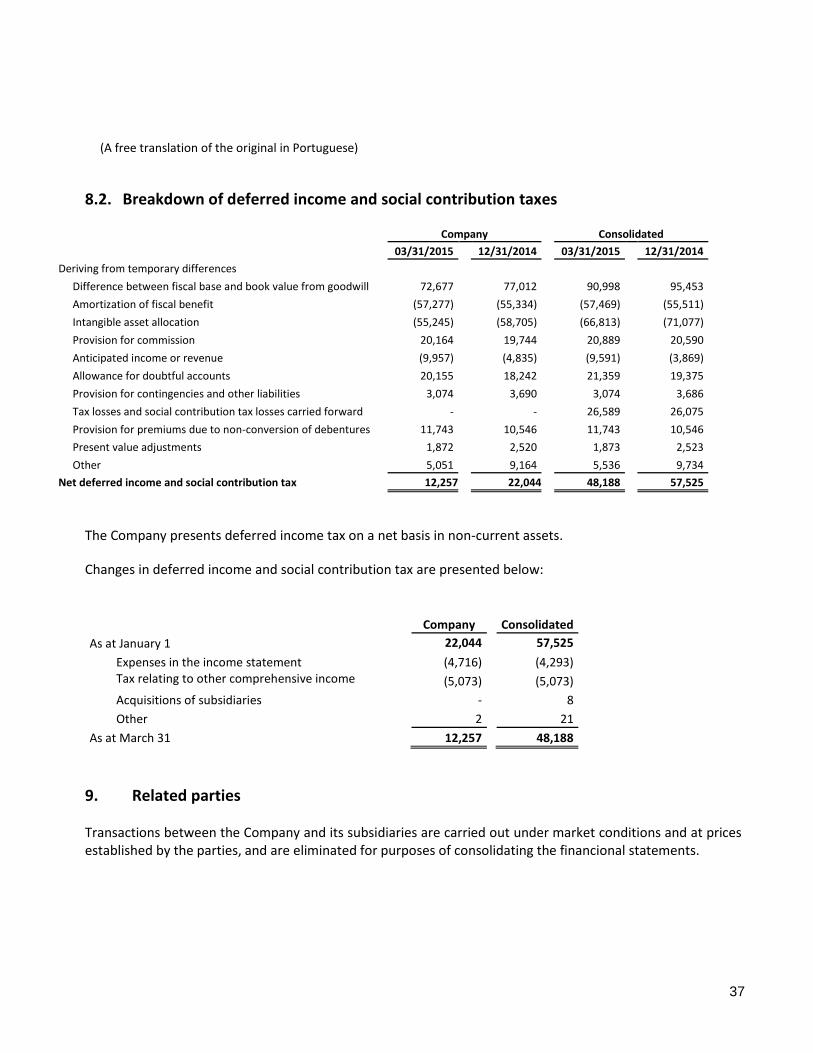
8.2. Breakdown of deferred income and social contribution taxes
Company Consolidated
03/31/2015 12/31/2014 03/31/2015 12/31/2014
Deriving from temporary differences
Difference between fiscal base and book value from goodwill 72,677 77,012 90,998 95,453
Amortization of fiscal benefit (57,277) (55,334) (57,469) (55,511)
Intangible asset allocation (55,245) (58,705) (66,813) (71,077)
Provision for commission 20,164 19,744 20,889 20,590
Anticipated income or revenue (9,957) (4,835) (9,591) (3,869)
Allowance for doubtful accounts 20,155 18,242 21,359 19,375
Provision for contingencies and other liabilities 3,074 3,690 3,074 3,686
Tax losses and social contribution tax losses carried forward - - 26,589 26,075
Provision for premiums due to non-conversion of debentures 11,743 10,546 11,743 10,546
Present value adjustments 1,872 2,520 1,873 2,523
Other 5,051 9,164 5,536 9,734
Net deferred income and social contribution tax 12,257 22,044 48,188 57,525
The Company presents deferred income tax on a net basis in non-current assets.
Changes in deferred income and social contribution tax are presented below:
Company Consolidated
As at January 1 22,044 57,525
Expenses in the income statement (4,716) (4,293) Tax relating to other comprehensive income
( (5,073) (5,073)
Acquisitions of subsidiaries - 8
Other 2 21
As at March 31 12,257 48,188
9. Related parties Transactions between the Company and its subsidiaries are carried out under market conditions and at prices established by the parties, and are eliminated for purposes of consolidating the financional statements.
(A free translation of the original in Portuguese)
38
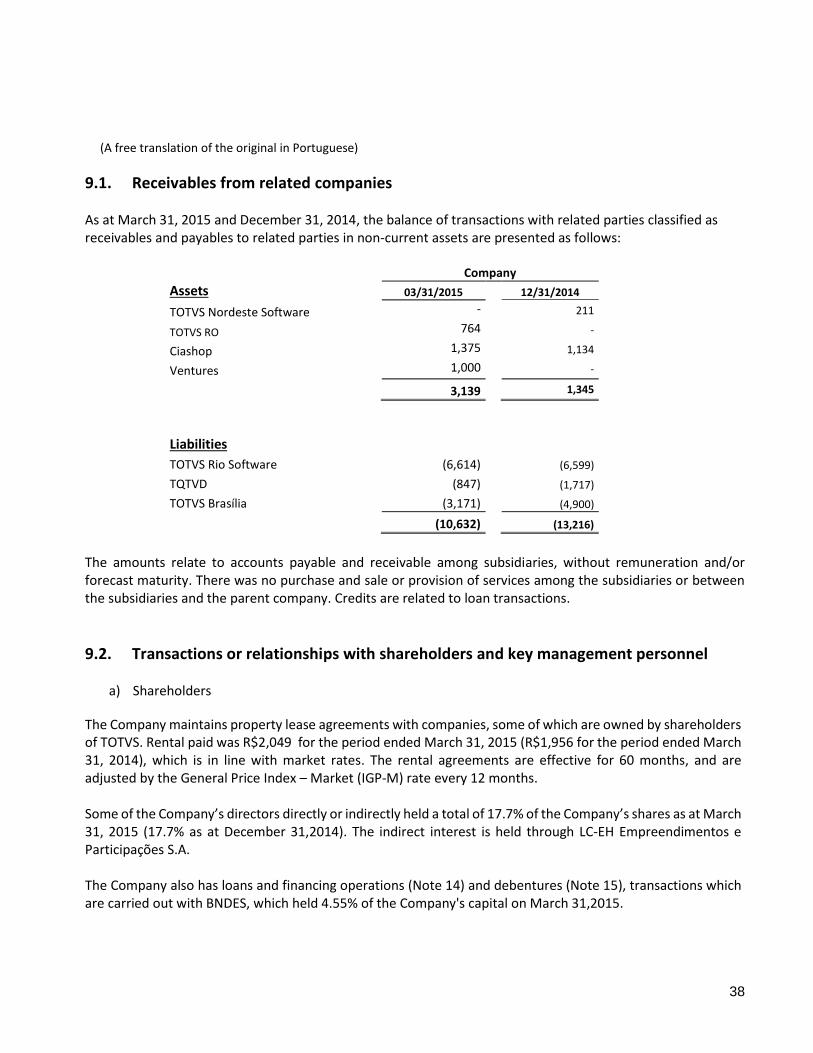
9.1. Receivables from related companies As at March 31, 2015 and December 31, 2014, the balance of transactions with related parties classified as receivables and payables to related parties in non-current assets are presented as follows:
Company
Assets 03/31/2015 12/31/2014
TOTVS Nordeste Software - 211
TOTVS RO 764 -
Ciashop 1,375 1,134
Ventures 1,000 -
3,139 1,345
Liabilities
TOTVS Rio Software (6,614) (6,599)
TQTVD (847) (1,717)
TOTVS Brasília (3,171) (4,900)
(10,632) (13,216)
The amounts relate to accounts payable and receivable among subsidiaries, without remuneration and/or forecast maturity. There was no purchase and sale or provision of services among the subsidiaries or between the subsidiaries and the parent company. Credits are related to loan transactions.
9.2. Transactions or relationships with shareholders and key management personnel
a) Shareholders
The Company maintains property lease agreements with companies, some of which are owned by shareholders of TOTVS. Rental paid was R$2,049 for the period ended March 31, 2015 (R$1,956 for the period ended March 31, 2014), which is in line with market rates. The rental agreements are effective for 60 months, and are adjusted by the General Price Index – Market (IGP-M) rate every 12 months. Some of the Company’s directors directly or indirectly held a total of 17.7% of the Company’s shares as at March 31, 2015 (17.7% as at December 31,2014). The indirect interest is held through LC-EH Empreendimentos e Participações S.A. The Company also has loans and financing operations (Note 14) and debentures (Note 15), transactions which are carried out with BNDES, which held 4.55% of the Company's capital on March 31,2015.

(A free translation of the original in Portuguese)
39
b) Key management personnel
Itaú Unibanco is a related party to the Company through one of the independent members on its Board of Directors. Amounts and transactions involving the companies of the Itaú Unibanco Group on March 31, 2015 corresponded to R$73,372 (R$68,957 on December 31, 2014) of financial investments, R$529 (R$296 on March 31,2015) related to contracts of bail, stock management and other, and R$2,593 (R$1,446 on March 31,2015) related to contracts for the transfer of the rights to use systems and technical support provided by TOTVS. All contracts are signed in accordance with usual market conditions. On February 24, 2015 the Company entered into a commercial partnership agreement with Rede S.A., payment method company of Itaú Group, to provide a complete management solution, e-commerce and automation of shops and payment systems aimed at micro and small businesses. On March 31, 2015 the amount involved in this partnership was R$ 500 related the structure of supply. The Company has a non-onerous contract relating to the management of it is pension plan with Itaú Vida e Previdência S.A.
9.3. Management fees Expenses relating to the compensation of the senior executives and management of the Company and its subsidiaries are summarized below:
Company Consolidated
03/31/2015 12/31/2014 03/31/2015 12/31/2014
Short-term benefits to employees Salaries, fees and payroll charges 3,189 3,713 4,312 5,078
Private pension plan 111 104 111 104
Variable bonuses 785 2,219 857 2,219
4,085 6,036 5,280 7,401
Share-based payments 441 876 441 876
4,526 6,912 5,721 8,277
(A free translation of the original in Portuguese)
40
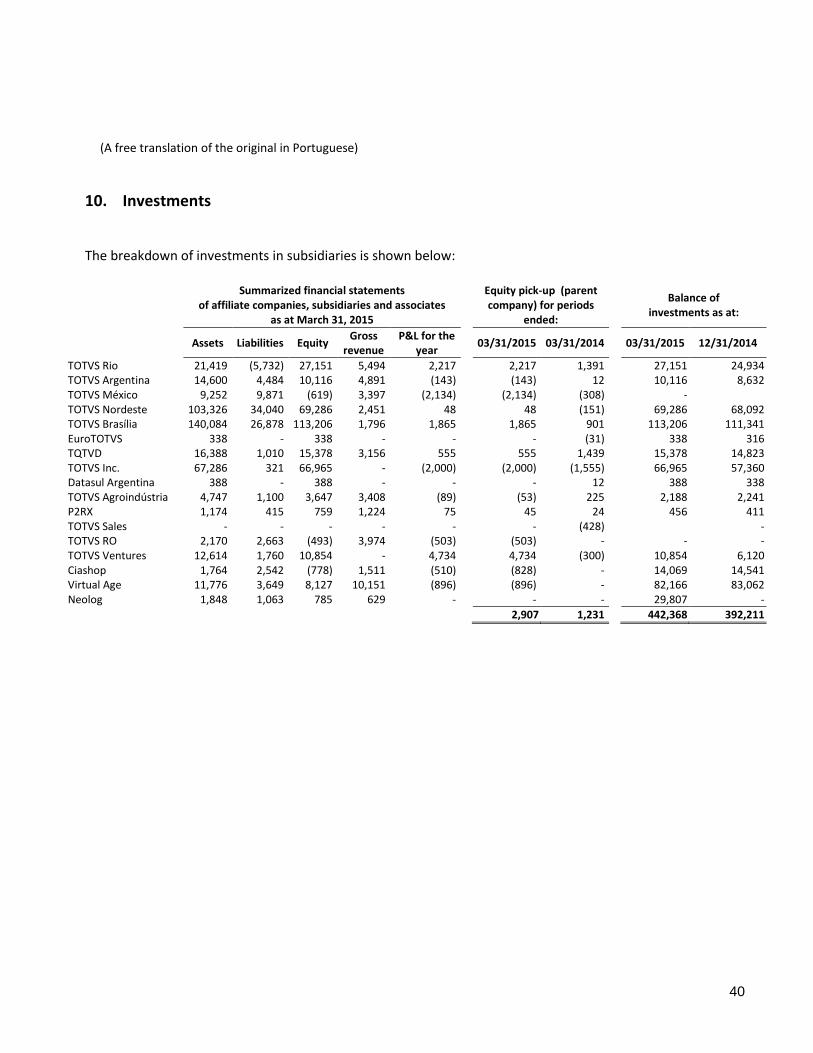
10. Investments The breakdown of investments in subsidiaries is shown below:
Summarized financial statements of affiliate companies, subsidiaries and associates
as at March 31, 2015
Equity pick-up (parent company) for periods
ended:
Balance of investments as at:
Assets Liabilities Equity Gross
revenue P&L for the
year 03/31/2015 03/31/2014 03/31/2015 12/31/2014
TOTVS Rio 21,419 (5,732) 27,151 5,494 2,217 2,217 1,391 27,151 24,934 TOTVS Argentina 14,600 4,484 10,116 4,891 (143) (143) 12 10,116 8,632 TOTVS México 9,252 9,871 (619) 3,397 (2,134) (2,134) (308) - TOTVS Nordeste 103,326 34,040 69,286 2,451 48 48 (151) 69,286 68,092 TOTVS Brasília 140,084 26,878 113,206 1,796 1,865 1,865 901 113,206 111,341 EuroTOTVS 338 - 338 - - - (31) 338 316 TQTVD 16,388 1,010 15,378 3,156 555 555 1,439 15,378 14,823 TOTVS Inc. 67,286 321 66,965 - (2,000) (2,000) (1,555) 66,965 57,360 Datasul Argentina 388 - 388 - - - 12 388 338 TOTVS Agroindústria 4,747 1,100 3,647 3,408 (89) (53) 225 2,188 2,241 P2RX 1,174 415 759 1,224 75 45 24 456 411 TOTVS Sales - - - - - - (428) - TOTVS RO 2,170 2,663 (493) 3,974 (503) (503) - - - TOTVS Ventures 12,614 1,760 10,854 - 4,734 4,734 (300) 10,854 6,120 Ciashop 1,764 2,542 (778) 1,511 (510) (828) - 14,069 14,541 Virtual Age 11,776 3,649 8,127 10,151 (896) (896) - 82,166 83,062 Neolog 1,848 1,063 785 629 - - - 29,807 -
2,907 1,231 442,368 392,211
(A free translation of the original in Portuguese)
41
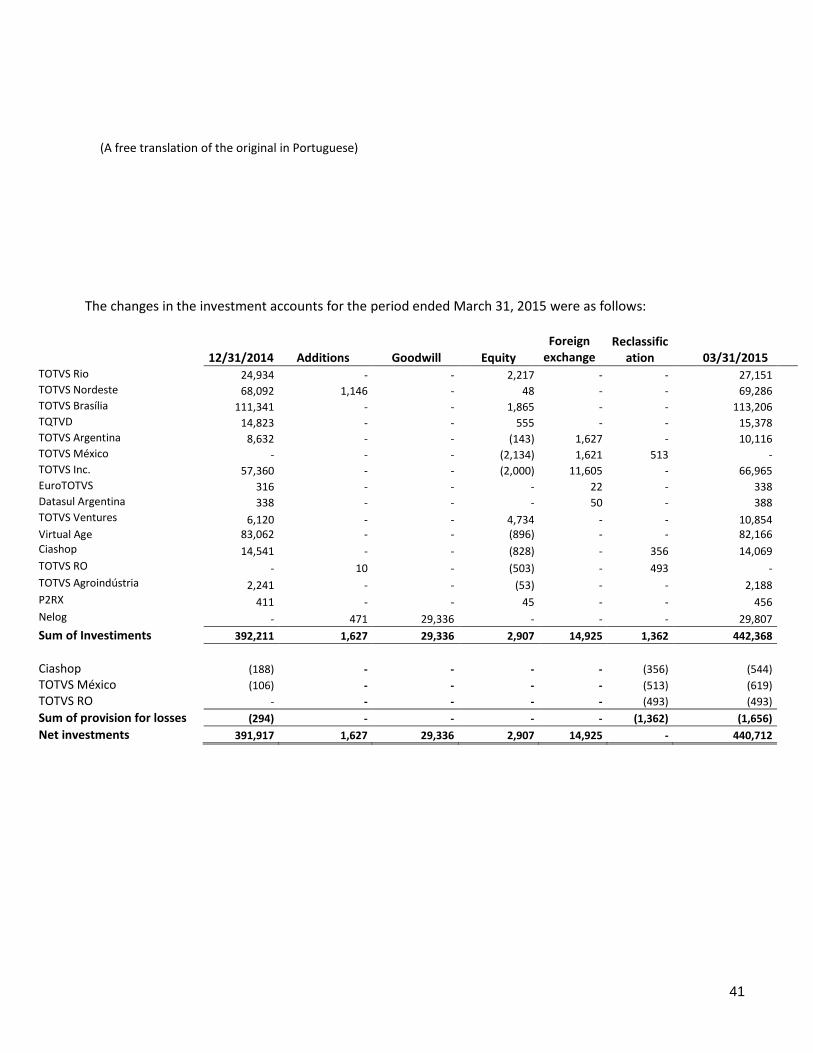
The changes in the investment accounts for the period ended March 31, 2015 were as follows:
12/31/2014 Additions Goodwill Equity
Foreign exchange
Reclassification 03/31/2015
TOTVS Rio 24,934 - - 2,217 - - 27,151 TOTVS Nordeste 68,092 1,146 - 48 - - 69,286 TOTVS Brasília 111,341 - - 1,865 - - 113,206 TQTVD 14,823 - - 555 - - 15,378 TOTVS Argentina 8,632 - - (143) 1,627 - 10,116 TOTVS México - - - (2,134) 1,621 513 - TOTVS Inc. 57,360 - - (2,000) 11,605 - 66,965 EuroTOTVS 316 - - - 22 - 338 Datasul Argentina 338 - - - 50 - 388 TOTVS Ventures 6,120 - - 4,734 - - 10,854 Virtual Age 83,062 - - (896) - - 82,166 Ciashop 14,541 - - (828) - 356 14,069 TOTVS RO - 10 - (503) - 493 - TOTVS Agroindústria 2,241 - - (53) - - 2,188 P2RX 411 - - 45 - - 456 Nelog - 471 29,336 - - - 29,807
Sum of Investiments 392,211 1,627 29,336 2,907 14,925 1,362 442,368
Ciashop (188) - - - - (356) (544)
TOTVS México (106) - - - - (513) (619)
TOTVS RO - - - - - (493) (493)
Sum of provision for losses (294) - - - - (1,362) (1,656)
Net investments 391,917 1,627 29,336 2,907 14,925 - 440,712
(A free translation of the original in Portuguese)
42
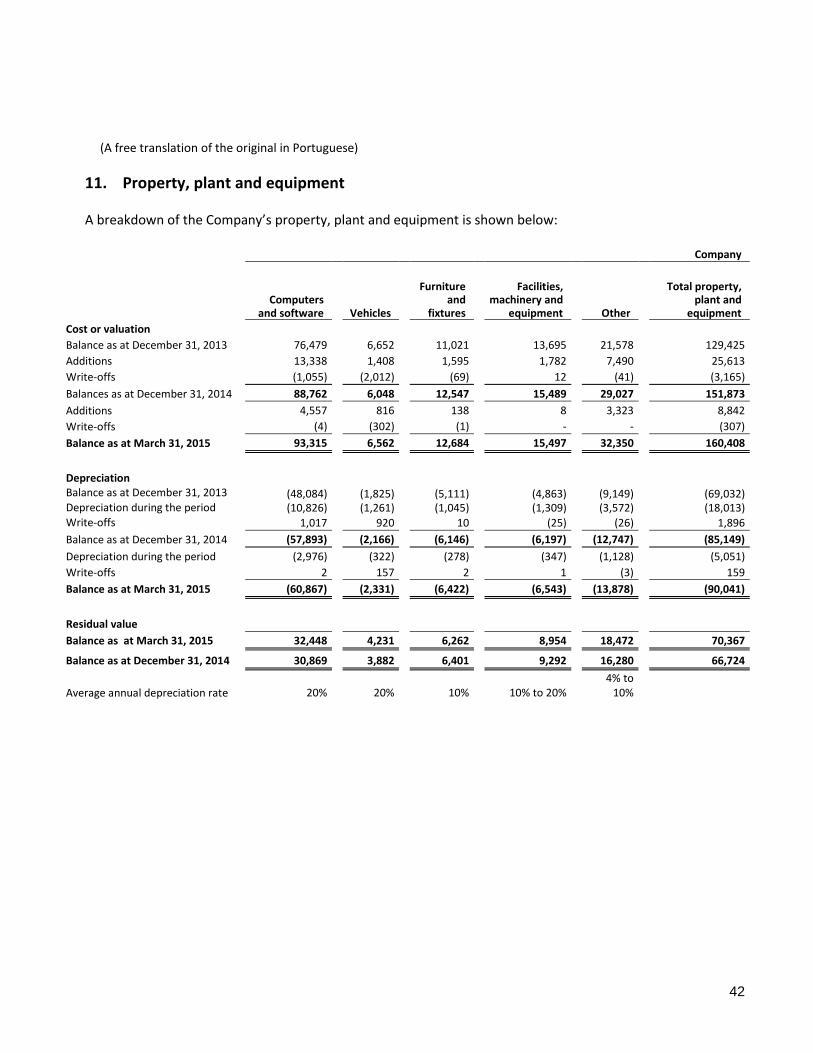
11. Property, plant and equipment A breakdown of the Company’s property, plant and equipment is shown below:
Company
Computers
and software Vehicles
Furniture and
fixtures
Facilities, machinery and
equipment Other
Total property, plant and
equipment
Cost or valuation
Balance as at December 31, 2013 76,479 6,652 11,021 13,695 21,578 129,425
Additions 13,338 1,408 1,595 1,782 7,490 25,613
Write-offs (1,055) (2,012) (69) 12 (41) (3,165)
Balances as at December 31, 2014 88,762 6,048 12,547 15,489 29,027 151,873
Additions 4,557 816 138 8 3,323 8,842
Write-offs (4) (302) (1) - - (307)
Balance as at March 31, 2015 93,315 6,562 12,684 15,497 32,350 160,408
Depreciation Balance as at December 31, 2013 (48,084) (1,825) (5,111) (4,863) (9,149) (69,032) Depreciation during the period (10,826) (1,261) (1,045) (1,309) (3,572) (18,013) Write-offs 1,017 920 10 (25) (26) 1,896
Balance as at December 31, 2014 (57,893) (2,166) (6,146) (6,197) (12,747) (85,149)
Depreciation during the period (2,976) (322) (278) (347) (1,128) (5,051)
Write-offs 2 157 2 1 (3) 159
Balance as at March 31, 2015 (60,867) (2,331) (6,422) (6,543) (13,878) (90,041)
Residual value
Balance as at March 31, 2015 32,448 4,231 6,262 8,954 18,472 70,367
Balance as at December 31, 2014 30,869 3,882 6,401 9,292 16,280 66,724
Average annual depreciation rate 20% 20% 10% 10% to 20% 4% to
10%

(A free translation of the original in Portuguese)
43
Consolidated
Computers and software Vehicles
Furniture and
fixtures
Facilities, machinery
and equipment Other
Total property, plant and
equipment Cost or valuation
Balance as at December 31, 2013 85,060 8,141 13,386 15,061 24,635 146,283
Additions 15,573 1,649 2,050 2,293 8,844 30,409
Acquisitions of subsidiaries 254 219 167 66 112 818
Write-offs (2,208) (2,381) (384) (157) (358) (5,488)
Exchange variations 1,742 370 533 769 288 3,702
Balance as at December 31, 2014 100,421 7,998 15,752 18,032 33,521 175,724
Additions 4,954 1,303 521 283 3,342 10,403
Write-offs (7) (303) (1) (1) - (312)
Exchange rate variations 705 99 190 59 211 1,264
Balance as at March 31, 2015 106,073 9,097 16,462 18,373 37,074 187,079
Depreciation
Balance as at December 31, 2013 (52,636) (2,262) (5,881) (5,186) (9,644) (75,609) Depreciation during the year (12,706) (1,615) (1,368) (1,569) (4,571) (21,829)
Write-offs 2,057 1,085 190 94 292 3,718
Exchange variations (1,548) (177) (382) (558) (218) (2,883)
Balance as at December 31, 2014 (64,833) (2,969) (7,441) (7,219) (14,141) (96,603)
Depreciation during the period (3,481) (444) (366) (424) (1,360) (6,075)
Write-offs 3 157 1 - - 161
Exchange rate variations (439) (43) (106) (24) (45) (657)
Balance as at March 31, 2015 (68,750) (3,299) (7,912) (7,667) (15,546) (103,174)
Residual value
Balance as at March 31, 2015 37,323 5,798 8,550 10,706 21,528 83,905
Balance as at December 31, 2014 35,588 5,029 8,311 10,813 19,380 79,121
Average annual depreciation rate 20% 20% 10% 10% to 20% 4% to
10%

(A free translation of the original in Portuguese)
44
12. Intangible assets Intangible assets and changes in the group’s balances are as follows:
Company
Software Trademarks
& patents Client
portfolio Other Goodwill
Total intangible
assets Cost/valuation
Balance as at December 31, 2013 189,080 63,149 207,586 15,080 353,726 828,621
Additions 6,957 - 21 - - 6,978
Merger - - - - 15,463 15,463
Allocation of intangible assets - - 1,362 1,257 (1,164) 1,455
Write-offs 32 - - - - 32
Balance as at December 31, 2014 196,069 63,149 208,969 16,337 368,025 852,549
Additions 7,967 - - - - 7,967
Transfers - - - - (134,214) (134,214)
Balance as at March 31,2015 204,036 63,149 208,969 16,337 233,811 726,302
Amortization
Balance as at December 31, 2013 (98,247) (22,818) (113,031) (11,608) (134,214) (379,918)
Amortization in the year (22,064) (4,201) (23,082) (1,889) - (51,236)
Write-offs (17) (1) - 1 - (17)
Balance as at December 31, 2014 (120,328) (27,020) (136,113) (13,496) (134,214) (431,171)
Amortization during the period (5,377) (1,049) (5,409) (462) - (12,297)
Transfers - - - - 134,214 134,214
Balance as at March 31,2015 (125,705) (28,069) (141,522) (13,958) - (309,254)
Residual value
Balance as at March 31,2015 78,331 35,080 67,447 2,379 233,811 417,048
Balance as at December 31, 2014 75,741 36,129 72,856 2,841 233,811 421,378
Average annual amortization rates 10% to 20% 6,7% a 8% 10% to 12,5% 20% to 50%
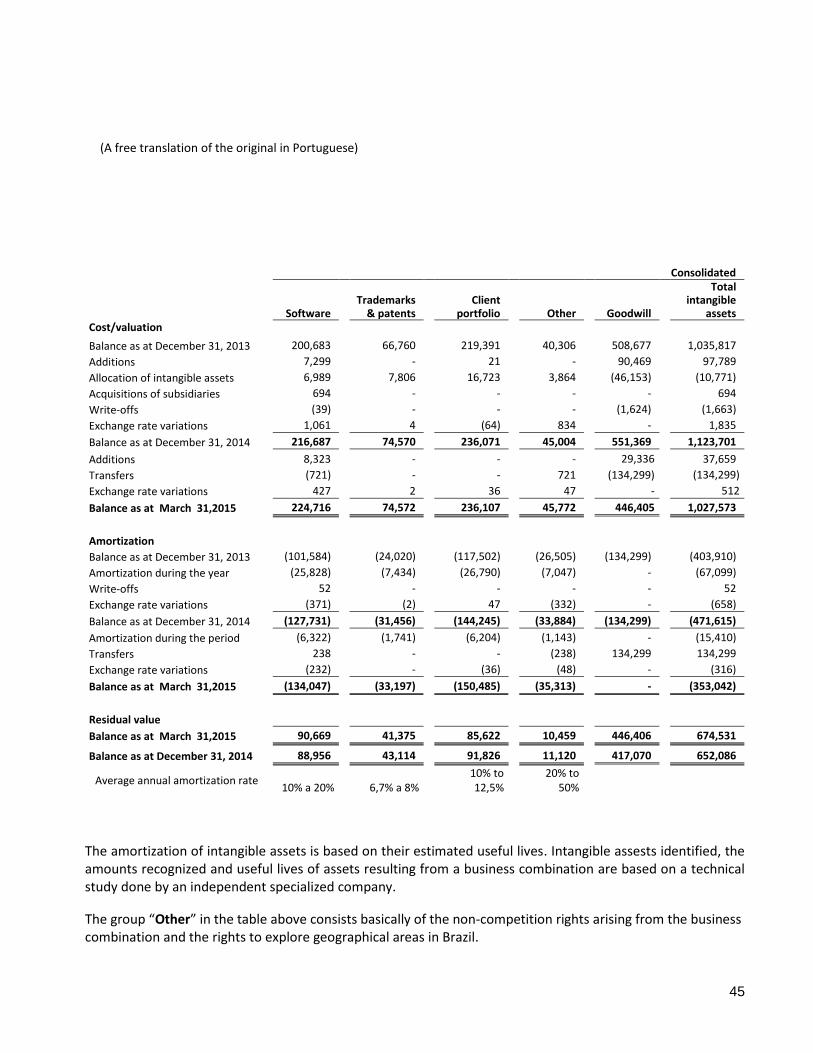
(A free translation of the original in Portuguese)
45
The amortization of intangible assets is based on their estimated useful lives. Intangible assests identified, the amounts recognized and useful lives of assets resulting from a business combination are based on a technical study done by an independent specialized company.
The group “Other” in the table above consists basically of the non-competition rights arising from the business combination and the rights to explore geographical areas in Brazil.
Consolidated
Software Trademarks
& patents Client
portfolio Other Goodwill
Total intangible
assets Cost/valuation
Balance as at December 31, 2013 200,683 66,760 219,391 40,306 508,677 1,035,817
Additions 7,299 - 21 - 90,469 97,789
Allocation of intangible assets 6,989 7,806 16,723 3,864 (46,153) (10,771)
Acquisitions of subsidiaries 694 - - - - 694
Write-offs (39) - - - (1,624) (1,663)
Exchange rate variations 1,061 4 (64) 834 - 1,835
Balance as at December 31, 2014 216,687 74,570 236,071 45,004 551,369 1,123,701
Additions 8,323 - - - 29,336 37,659
Transfers (721) - - 721 (134,299) (134,299)
Exchange rate variations 427 2 36 47 - 512
Balance as at March 31,2015 224,716 74,572 236,107 45,772 446,405 1,027,573
Amortization
Balance as at December 31, 2013 (101,584) (24,020) (117,502) (26,505) (134,299) (403,910)
Amortization during the year (25,828) (7,434) (26,790) (7,047) - (67,099)
Write-offs 52 - - - - 52
Exchange rate variations (371) (2) 47 (332) - (658)
Balance as at December 31, 2014 (127,731) (31,456) (144,245) (33,884) (134,299) (471,615)
Amortization during the period (6,322) (1,741) (6,204) (1,143) - (15,410)
Transfers 238 - - (238) 134,299 134,299
Exchange rate variations (232) - (36) (48) - (316)
Balance as at March 31,2015 (134,047) (33,197) (150,485) (35,313) - (353,042)
Residual value
Balance as at March 31,2015 90,669 41,375 85,622 10,459 446,406 674,531
Balance as at December 31, 2014 88,956 43,114 91,826 11,120 417,070 652,086
Average annual amortization rate 10% a 20% 6,7% a 8%
10% to 12,5%
20% to 50%

(A free translation of the original in Portuguese)
46
12.1. Changes in goodwill
The composition of goodwill on March 31, 2015 and December 31, 2014 and the movements in the three-month period ended on March 31, 2015 are as follows:
Goodwill 12/31/2014 Additions 03/31/2015
RM 90,992 - 90,992
Logo Center 5,703 - 5,703
TOTVS BMI 2,053 - 2,053
Midbyte 1,765 - 1,765
IOSSTS 2,643 - 2,643
BCS 11,821 - 11,821
Datasul 30,084 - 30,084 Setware 961 - 961
Hery 2,927 - 2,927
TotalBanco 6,008 - 6,008
M2S 12 - 12
SRC 33,688 - 33,688
Mafipa 1,195 - 1,195
Gens FDES 16,340 - 16,340
W&D 64,070 - 64,070
uMov.me 1,437 - 1,437
TOTVS Agroindústria 13,128 - 13,128
RMS 35,740 - 35,740 Seventeen 15,463 - 15,463
Ciashop 7,001 - 7,001
Virtual Age 74,039 - 74,039
Neolog (a) - 29,336 29,336
417,070 29,336 446,406
(a) Business combinations according to Note 3.
12.2. Asset impairment tests The Company assesses the recoverable book value of goodwill by employing the value-in-use concept in the discounted cash flow models for cash-generating units representing the group of tangible and intangible assets used to develop and sell different solutions to customers. The Company's management has not identified any events occurring during the period ended March 31, 2015 that would indicate a need for interim impairment test.
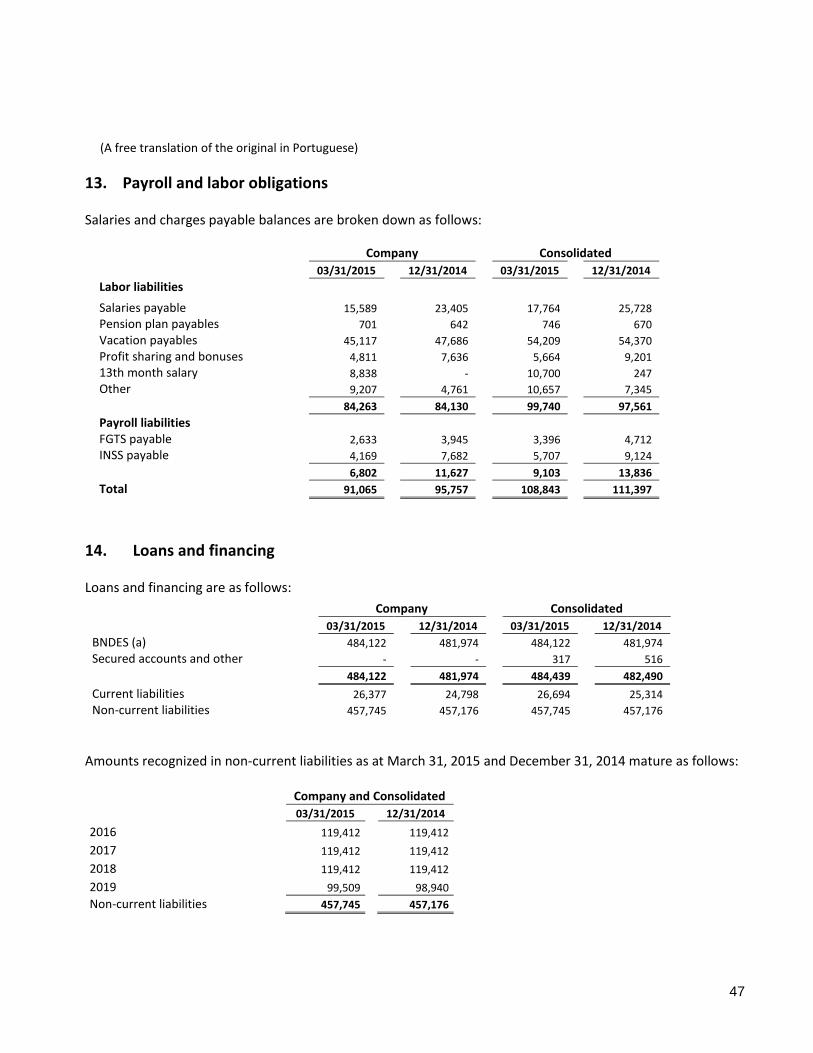
(A free translation of the original in Portuguese)
47
13. Payroll and labor obligations
Salaries and charges payable balances are broken down as follows:
Company Consolidated
03/31/2015 12/31/2014 03/31/2015 12/31/2014
Labor liabilities Salaries payable 15,589 23,405 17,764 25,728
Pension plan payables 701 642 746 670
Vacation payables 45,117 47,686 54,209 54,370
Profit sharing and bonuses 4,811 7,636 5,664 9,201
13th month salary 8,838 - 10,700 247
Other 9,207 4,761 10,657 7,345
84,263 84,130 99,740 97,561
Payroll liabilities
FGTS payable 2,633 3,945 3,396 4,712
INSS payable 4,169 7,682 5,707 9,124
6,802 11,627 9,103 13,836
Total 91,065 95,757 108,843 111,397
14. Loans and financing Loans and financing are as follows:
Company Consolidated
03/31/2015 12/31/2014 03/31/2015 12/31/2014
BNDES (a) 484,122 481,974 484,122 481,974
Secured accounts and other - - 317 516
484,122 481,974 484,439 482,490
Current liabilities 26,377 24,798 26,694 25,314
Non-current liabilities 457,745 457,176 457,745 457,176
Amounts recognized in non-current liabilities as at March 31, 2015 and December 31, 2014 mature as follows: Company and Consolidated
03/31/2015 12/31/2014
2016 119,412 119,412
2017 119,412 119,412
2018 119,412 119,412
2019 99,509 98,940
Non-current liabilities 457,745 457,176
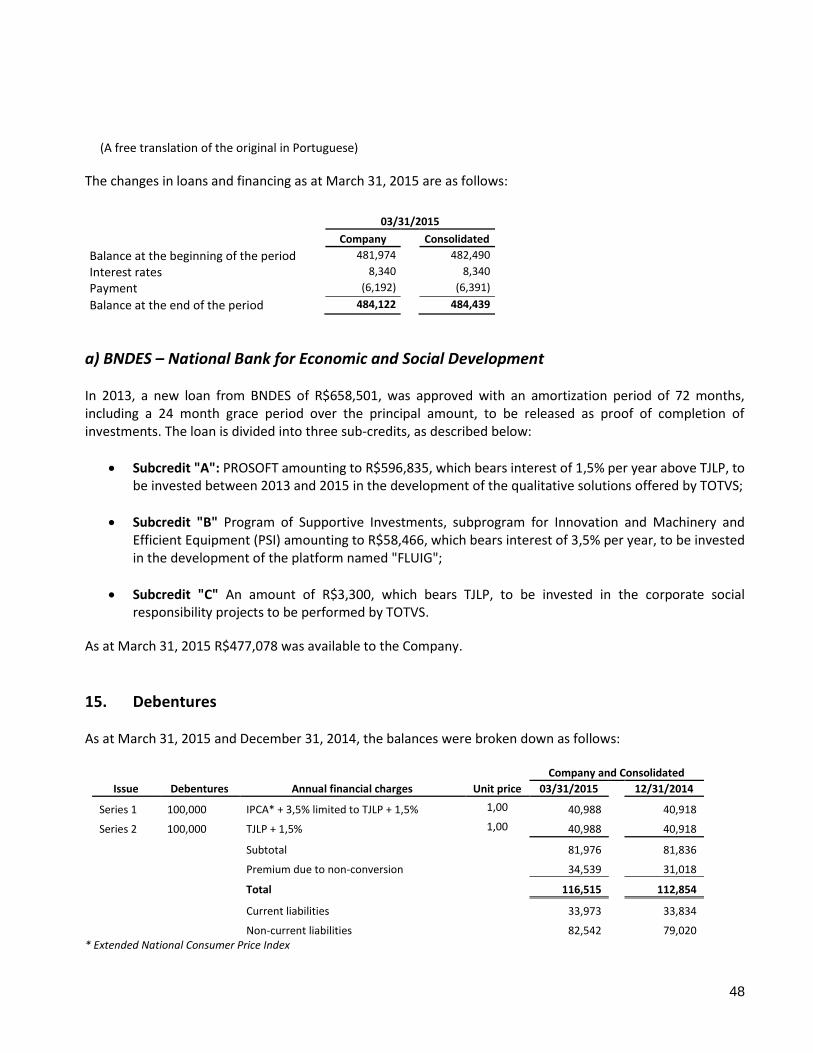
(A free translation of the original in Portuguese)
48
The changes in loans and financing as at March 31, 2015 are as follows:
03/31/2015
Company Consolidated
Balance at the beginning of the period 481,974 482,490
Interest rates 8,340 8,340
Payment (6,192) (6,391)
Balance at the end of the period 484,122 484,439
a) BNDES – National Bank for Economic and Social Development In 2013, a new loan from BNDES of R$658,501, was approved with an amortization period of 72 months, including a 24 month grace period over the principal amount, to be released as proof of completion of investments. The loan is divided into three sub-credits, as described below:
Subcredit "A": PROSOFT amounting to R$596,835, which bears interest of 1,5% per year above TJLP, to be invested between 2013 and 2015 in the development of the qualitative solutions offered by TOTVS;
Subcredit "B" Program of Supportive Investments, subprogram for Innovation and Machinery and Efficient Equipment (PSI) amounting to R$58,466, which bears interest of 3,5% per year, to be invested in the development of the platform named "FLUIG";
Subcredit "C" An amount of R$3,300, which bears TJLP, to be invested in the corporate social responsibility projects to be performed by TOTVS.
As at March 31, 2015 R$477,078 was available to the Company.
15. Debentures As at March 31, 2015 and December 31, 2014, the balances were broken down as follows:
Issue Debentures Annual financial charges Unit price
Company and Consolidated
03/31/2015 12/31/2014
Series 1 100,000 IPCA* + 3,5% limited to TJLP + 1,5% 1,00 40,988 40,918
Series 2 100,000 TJLP + 1,5% 1,00 40,988 40,918
Subtotal 81,976 81,836
Premium due to non-conversion 34,539 31,018
Total 116,515 112,854
Current liabilities 33,973 33,834
Non-current liabilities 82,542 79,020 * Extended National Consumer Price Index
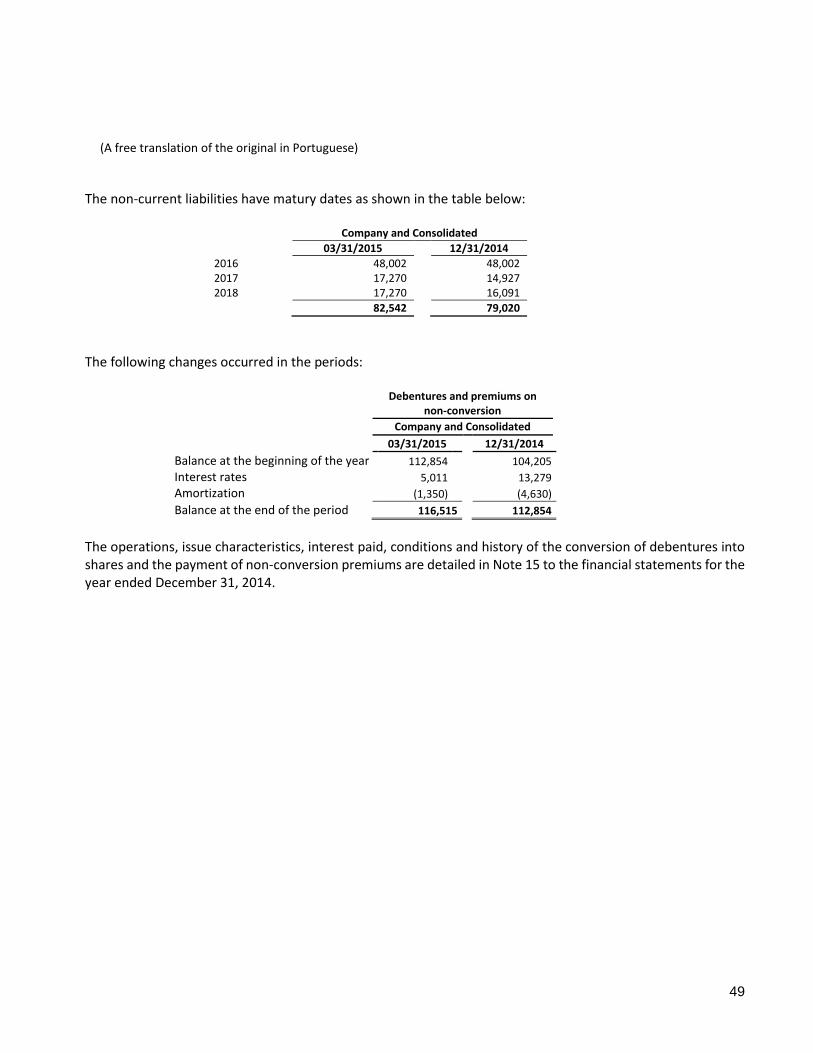
(A free translation of the original in Portuguese)
49
The non-current liabilities have matury dates as shown in the table below:
Company and Consolidated
03/31/2015 12/31/2014
2016 48,002 48,002 2017 17,270 14,927 2018 17,270 16,091
82,542 79,020
The following changes occurred in the periods:
Debentures and premiums on
non-conversion
Company and Consolidated
03/31/2015 12/31/2014
Balance at the beginning of the year 112,854 104,205
Interest rates 5,011 13,279
Amortization (1,350) (4,630)
Balance at the end of the period 116,515 112,854
The operations, issue characteristics, interest paid, conditions and history of the conversion of debentures into shares and the payment of non-conversion premiums are detailed in Note 15 to the financial statements for the year ended December 31, 2014.
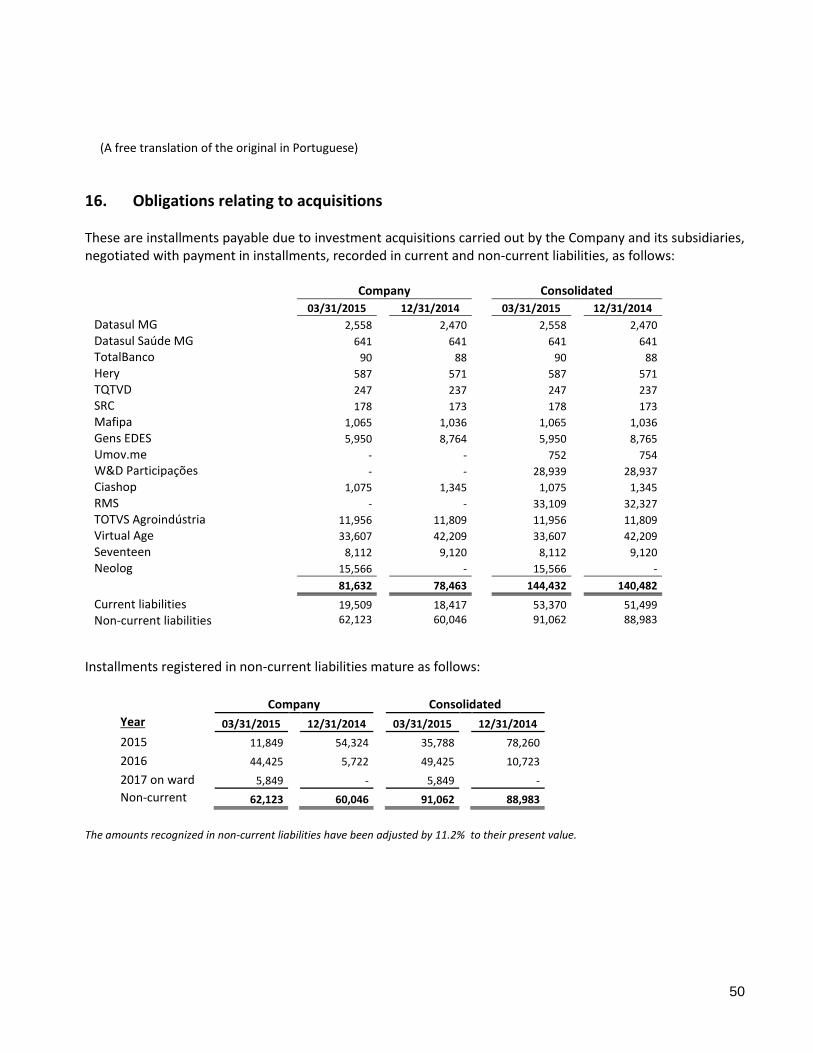
(A free translation of the original in Portuguese)
50
16. Obligations relating to acquisitions These are installments payable due to investment acquisitions carried out by the Company and its subsidiaries, negotiated with payment in installments, recorded in current and non-current liabilities, as follows:
Company Consolidated
03/31/2015 12/31/2014 03/31/2015 12/31/2014
Datasul MG 2,558 2,470 2,558 2,470
Datasul Saúde MG 641 641 641 641
TotalBanco 90 88 90 88
Hery 587 571 587 571
TQTVD 247 237 247 237
SRC 178 173 178 173
Mafipa 1,065 1,036 1,065 1,036
Gens EDES 5,950 8,764 5,950 8,765
Umov.me - - 752 754
W&D Participações - - 28,939 28,937
Ciashop 1,075 1,345 1,075 1,345
RMS - - 33,109 32,327
TOTVS Agroindústria 11,956 11,809 11,956 11,809
Virtual Age 33,607 42,209 33,607 42,209
Seventeen 8,112 9,120 8,112 9,120
Neolog 15,566 - 15,566 -
81,632 78,463 144,432 140,482
Current liabilities 19,509 18,417 53,370 51,499
Non-current liabilities 62,123 60,046 91,062 88,983
Installments registered in non-current liabilities mature as follows:
Company Consolidated
Year 03/31/2015 12/31/2014 03/31/2015 12/31/2014
2015 11,849 54,324 35,788 78,260
2016 44,425 5,722 49,425 10,723
2017 on ward 5,849 - 5,849 -
Non-current liabilities
62,123 60,046 91,062 88,983
The amounts recognized in non-current liabilities have been adjusted by 11.2% to their present value.
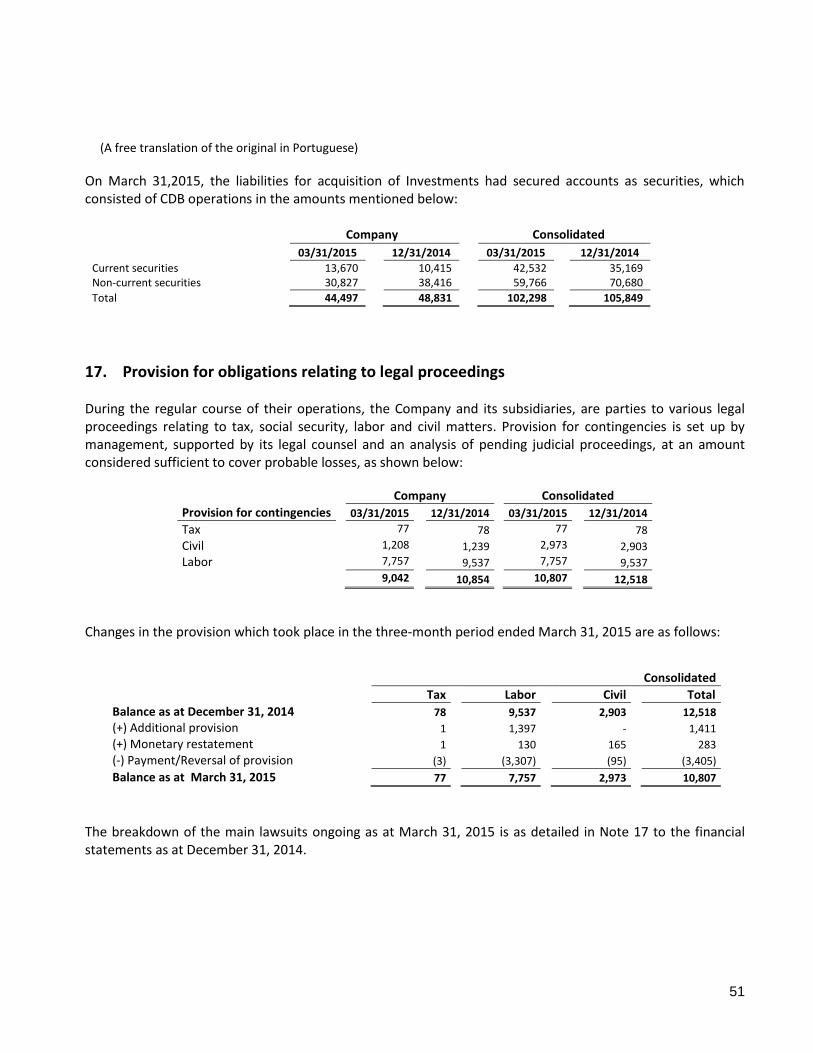
(A free translation of the original in Portuguese)
51
On March 31,2015, the liabilities for acquisition of Investments had secured accounts as securities, which consisted of CDB operations in the amounts mentioned below:
Company Consolidated
03/31/2015 12/31/2014 03/31/2015 12/31/2014
Current securities 13,670 10,415 42,532 35,169 Non-current securities 30,827 38,416 59,766 70,680
Total 44,497 48,831 102,298 105,849
17. Provision for obligations relating to legal proceedings During the regular course of their operations, the Company and its subsidiaries, are parties to various legal proceedings relating to tax, social security, labor and civil matters. Provision for contingencies is set up by management, supported by its legal counsel and an analysis of pending judicial proceedings, at an amount considered sufficient to cover probable losses, as shown below:
Company Consolidated
Provision for contingencies 03/31/2015 12/31/2014 03/31/2015 12/31/2014
Tax 77 78 77 78
Civil 1,208 1,239 2,973 2,903
Labor 7,757 9,537 7,757 9,537
9,042 10,854 10,807 12,518
Changes in the provision which took place in the three-month period ended March 31, 2015 are as follows:
The breakdown of the main lawsuits ongoing as at March 31, 2015 is as detailed in Note 17 to the financial statements as at December 31, 2014.
Consolidated
Tax Labor Civil Total
Balance as at December 31, 2014 78 9,537 2,903 12,518
(+) Additional provision 1 1,397 - 1,411
(+) Monetary restatement 1 130 165 283
(-) Payment/Reversal of provision (3) (3,307) (95) (3,405)
Balance as at March 31, 2015 77 7,757 2,973 10,807

(A free translation of the original in Portuguese)
52
The court deposits linked or not to provision for individual lawsuits are stated below and are recorded under non-current assets: Company Consolidated
03/31/2015 12/31/2014 03/31/2015 12/31/2014
Judicial deposits Social security 3,144 3,088 3,144 3,088
Tax 2,085 1,982 2,085 1,982
Labor 12,101 11,625 12,101 11,625
Civil 5,326 5,116 5,792 5,725
22,656 21,811 23,122 22,420
18. Contingent liabilities
The Company and its subsidiaries are involved in other actions, which carry a risk of loss, according to outside counsel and the Company´s management are classified as possible and for which no provision has been recognized, as follows:
Company Consolidated
Type 03/31/2015 12/31/2014 03/31/2015 12/31/2014
Social Security 22,240 19,916 22,240 19,916
Tax 21,106 20,623 35,525 32,226
Civil 183,725 147,826 184,172 149,076
Labor 30,841 25,534 35,022 29,289
257,912 213,899 276,959 230,507
A breakdown of the main ongoing lawsuits until December 31, 2014 is given in Note 17.b to the financial statements for 2014. No significant changes in ongoing lawsuits for which a risk of loss assessed as “possible” by the Company for the period ended March 31, 2015 have been recognized.

(A free translation of the original in Portuguese)
53
19. Equity
a) Capital As at March 31, 2015, the Company’s capital was made up of 163,467,071 non-par common shares, issued and fully paid (163,467,071 shares as at December 31, 2014), and held as follows:
03/31/2015 12/31/2014
Shareholder Shares % Shares %
LC EH Participações e Empreendimentos S/A 26,760,990 16.37% 26,760,990 16.37%
Fundação Petrobras de Seguridade Social - Petros 16,042,359 9.81% 16,042,359 9.81%
BNDES Participações S/A 7,444,981 4.55% 7,444,981 4.55%
Genesis Asset Managers LLP 8,436,429 5.16% 4,158,594 2.54%
Laércio José de Lucena Cosentino 1,910,618 1.17% 1,906,947 1.17%
Ernesto Mário Haberkorn 37,587 0.02% 29,710 0.02%
CSHG Senta Pua Fia 43,500 0.03% 43,500 0.03%
Other 101,484,920 62.09% 105,646,980 64.63%
Total shares outstanding 162,161,384 99.20% 162,034,061 99.12%
Treasury shares 1,305,687 0.80% 1,433,010 0.88%
Total shares 163,467,071 100.00% 163,467,071 100.0%
b) Capital reserves
The balances of capital reserves at March 31,2015 and December 31, 2014 are broken down as follows:
03/31/2015 12/31/2014
Goodwill reserve 31,557 31,557
Goodwill reserve for mergers 14,330 14,330
Premium on purchases from non-controlling (25,518) (25,518)
Debentures converted into shares 44,629 44,629
Stock option plans (Note 22) 27,670 27,495
92,668 92,493
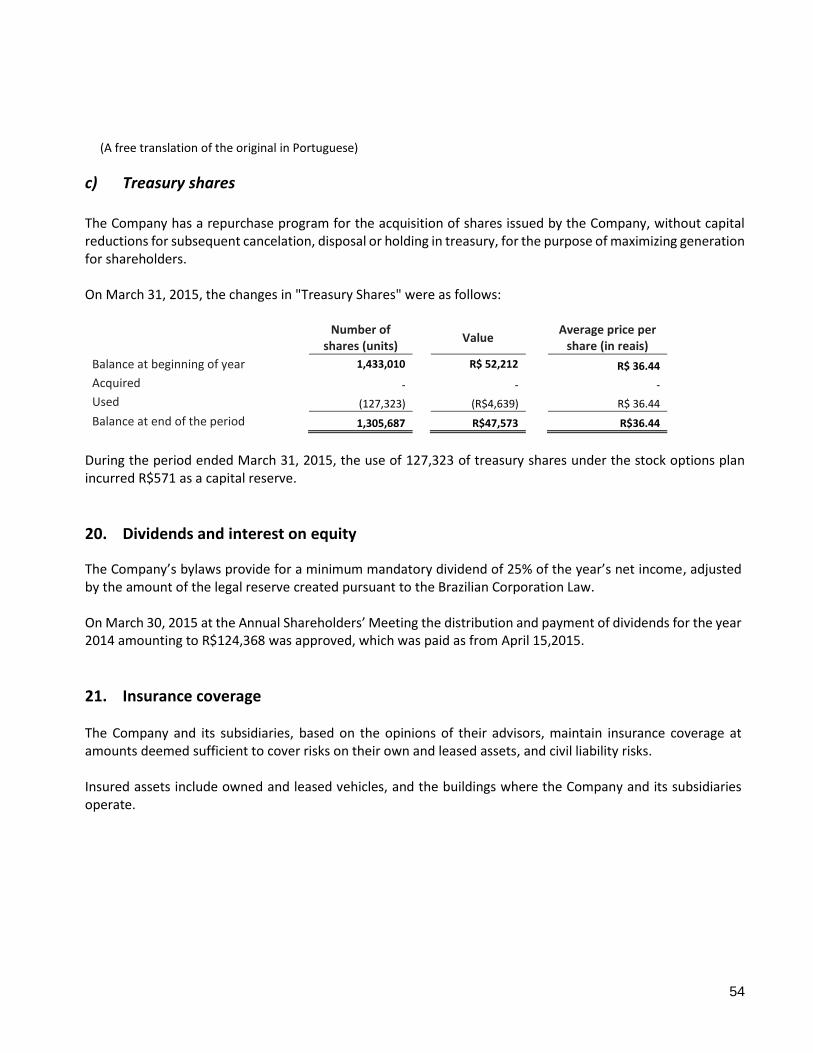
(A free translation of the original in Portuguese)
54
c) Treasury shares
The Company has a repurchase program for the acquisition of shares issued by the Company, without capital reductions for subsequent cancelation, disposal or holding in treasury, for the purpose of maximizing generation for shareholders. On March 31, 2015, the changes in "Treasury Shares" were as follows:
Number of
shares (units) Value
Average price per share (in reais)
Balance at beginning of year 1,433,010 R$ 52,212 R$ 36.44
Acquired - - -
Used (127,323) (R$4,639) R$ 36.44
Balance at end of the period 1,305,687 R$47,573 R$36.44
During the period ended March 31, 2015, the use of 127,323 of treasury shares under the stock options plan incurred R$571 as a capital reserve.
20. Dividends and interest on equity
The Company’s bylaws provide for a minimum mandatory dividend of 25% of the year’s net income, adjusted by the amount of the legal reserve created pursuant to the Brazilian Corporation Law. On March 30, 2015 at the Annual Shareholders’ Meeting the distribution and payment of dividends for the year 2014 amounting to R$124,368 was approved, which was paid as from April 15,2015.
21. Insurance coverage The Company and its subsidiaries, based on the opinions of their advisors, maintain insurance coverage at amounts deemed sufficient to cover risks on their own and leased assets, and civil liability risks. Insured assets include owned and leased vehicles, and the buildings where the Company and its subsidiaries operate.

(A free translation of the original in Portuguese)
55
22. Stock option plan The main events associated with the stock option plan since December 31, 2014 are described in Note 21 to the financial statements for the year ended December 31, 2014. In the period ended March 31, 2015 two new stock options plans were approved at the meeting of the Board of Directors on November 29,2012:
(i) Regular options, whose strike prices will be the share´s market price at the time of the grant of options, determined based on the avarege of the closing prices of the last five trading days preceding the date of grant; and
(ii) Restricted options, where the strike prices will be established after certain obligation have been met,
which consists in the acquisition of Company shares using 100% of the amount received by the beneficiary in the year prior to profit sharing, net of taxes.
The fair value of these plans were estimated based on grant data using the Black-Scholes model for option pricing, for which the variables and results are shown below:
Date
Premises of fair value Pricing options
Expectancy: Interest rate risk-free
Term to maturity Plan Dividends Volatility
Regular Options 2/20/2015 2.6% 29.61% 12.75% 3 years 11.36 Restricted Options 2/20/2015 2.6% 29.61% 12.75% 3 years 33.34
The breakdown of the options for the period is as follows:
Company and Consolidated
03/31/2015 12/31/2014
Number (units)
Average cost (R$)
Number (units)
Average cost (R$)
Stock option balance at the beginning of the year 1,732,518 32.14 2,770,782 30.00
Breakdown:
Exercised (89,234) 29.68 (1,055,056) 25.71
Granted 251,570 31.90 306,129 29.85
Canceled (18,868) 41.75 (289,337) 32.68
Stock option balance at the end of the year/period 1,875,986 32.13 1,732,518 32.14
The accumulated effect of stock options for the three-month period ended March 31, 2015 was R$809 (R$876 as at March 31, 2014) and was recorded as expenses for the granting of stock options. As at March 31, 2015, there were 754,595 exercisable options, since the 36-month terms of the fourth and fifth grant dates had already elapsed.
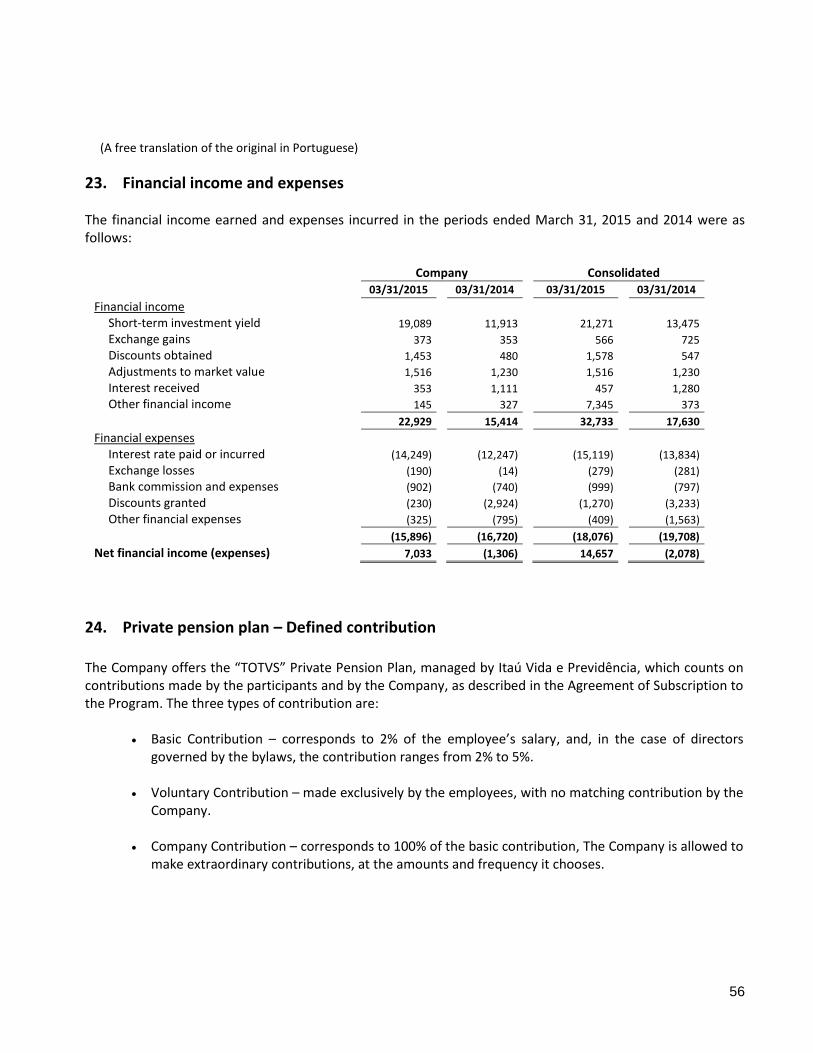
(A free translation of the original in Portuguese)
56
23. Financial income and expenses The financial income earned and expenses incurred in the periods ended March 31, 2015 and 2014 were as follows:
Company Consolidated
03/31/2015 03/31/2014 03/31/2015 03/31/2014
Financial income Short-term investment yield 19,089 11,913 21,271 13,475
Exchange gains 373 353 566 725
Discounts obtained 1,453 480 1,578 547
Adjustments to market value 1,516 1,230 1,516 1,230
Interest received 353 1,111 457 1,280
Other financial income 145 327 7,345 373
22,929 15,414 32,733 17,630
Financial expenses
Interest rate paid or incurred (14,249) (12,247) (15,119) (13,834)
Exchange losses (190) (14) (279) (281)
Bank commission and expenses (902) (740) (999) (797)
Discounts granted (230) (2,924) (1,270) (3,233)
Other financial expenses (325) (795) (409) (1,563)
(15,896) (16,720) (18,076) (19,708)
Net financial income (expenses) 7,033 (1,306) 14,657 (2,078)
24. Private pension plan – Defined contribution The Company offers the “TOTVS” Private Pension Plan, managed by Itaú Vida e Previdência, which counts on contributions made by the participants and by the Company, as described in the Agreement of Subscription to the Program. The three types of contribution are:
Basic Contribution – corresponds to 2% of the employee’s salary, and, in the case of directors governed by the bylaws, the contribution ranges from 2% to 5%.
Voluntary Contribution – made exclusively by the employees, with no matching contribution by the
Company. Company Contribution – corresponds to 100% of the basic contribution, The Company is allowed to
make extraordinary contributions, at the amounts and frequency it chooses.

(A free translation of the original in Portuguese)
57
25. Earnings per share The charts below show the earnings and share data used to calculate the basic earnings and diluted earnings per share:
Company and Consolidated
03/31/2015 03/31/2014
Basic earnings per share Numerator Net income for the period assigned to the Company’s shareholders 71,057 61,498 Denominator (in thousands of shares) Weighted average number of common shares outstanding 162,056 163,173
Basic earnings per share 0.44 0.38
Company and Consolidated
03/31/2015 03/31/2014
Diluted earnings per share Numerator Net income for the period assigned to the Company’s
shareholders 71,057 61,498 Denominator (in thousands of shares) Weighted average number of common shares outstanding Dilutive effect 162,056 163,173
Stock options 1,914 2,690
Weighted average number of common shares adjusted according to dilutive effect 163,970 165,863
Diluted earnings per share 0.43 0.37
There were no other transactions involving common shares or potential common shares between the date of the balance sheet and the date when these interim financial statements were concluded.
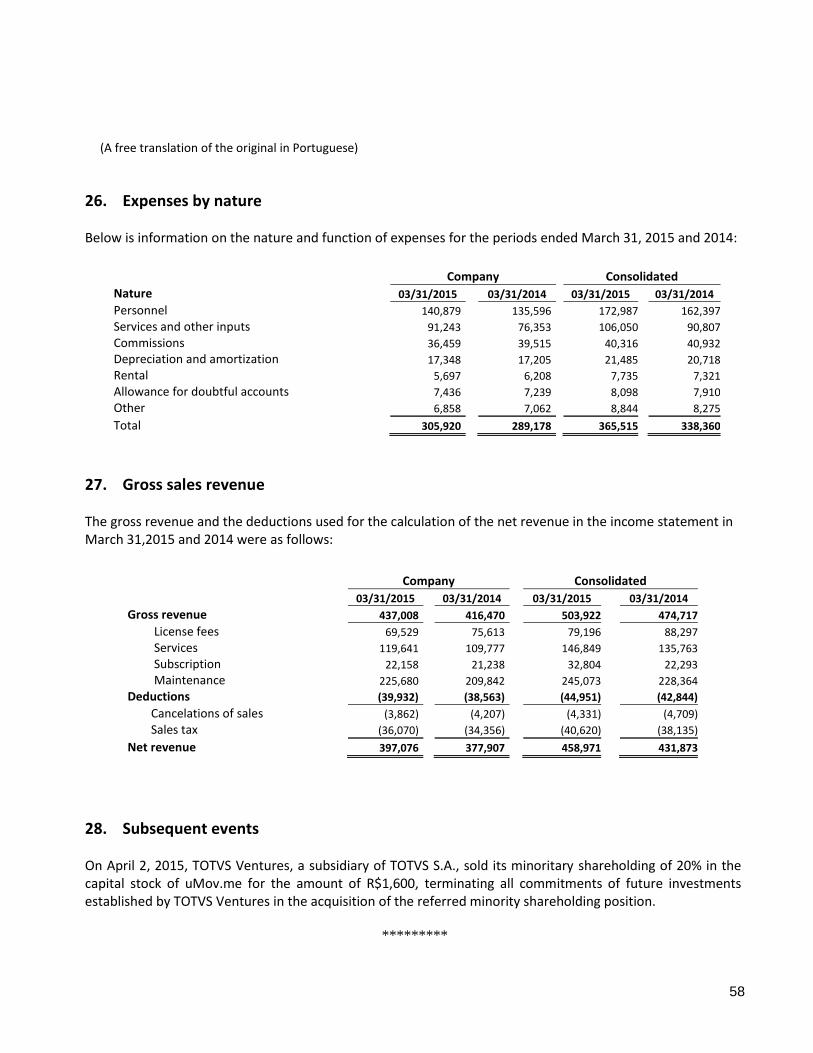
(A free translation of the original in Portuguese)
58
26. Expenses by nature Below is information on the nature and function of expenses for the periods ended March 31, 2015 and 2014:
Company Consolidated
Nature 03/31/2015 03/31/2014 03/31/2015 03/31/2014 Personnel 140,879 135,596 172,987 162,397
Services and other inputs 91,243 76,353 106,050 90,807
Commissions 36,459 39,515 40,316 40,932
Depreciation and amortization 17,348 17,205 21,485 20,718
Rental 5,697 6,208 7,735 7,321
Allowance for doubtful accounts 7,436 7,239 8,098 7,910
Other 6,858 7,062 8,844 8,275
Total 305,920 289,178 365,515 338,360
27. Gross sales revenue The gross revenue and the deductions used for the calculation of the net revenue in the income statement in March 31,2015 and 2014 were as follows:
Company Consolidated
03/31/2015 03/31/2014 03/31/2015 03/31/2014 Gross revenue 437,008 416,470 503,922 474,717
License fees 69,529 75,613 79,196 88,297
Services 119,641 109,777 146,849 135,763
Subscription 22,158 21,238 32,804 22,293
Maintenance 225,680 209,842 245,073 228,364
Deductions (39,932) (38,563) (44,951) (42,844)
Cancelations of sales (3,862) (4,207) (4,331) (4,709)
Sales tax (36,070) (34,356) (40,620) (38,135)
Net revenue 397,076 377,907 458,971 431,873
28. Subsequent events
On April 2, 2015, TOTVS Ventures, a subsidiary of TOTVS S.A., sold its minoritary shareholding of 20% in the capital stock of uMov.me for the amount of R$1,600, terminating all commitments of future investments established by TOTVS Ventures in the acquisition of the referred minority shareholding position.
*********
(A free translation of the original in Portuguese)
59
Report on review of quarterly information To the Board of Directors and Stockholders TOTVS S.A. Introduction We have reviewed the accompanying parent company and consolidated interim accounting information of TOTVS S.A., included in the Quarterly Information Form (ITR) for the quarter ended March 31, 2015, comprising the balance sheet as at that date and the statements of income, comprehensive income, changes in equity and cash flows for the quarter then ended, and a summary of significant accounting policies and other explanatory information. Management is responsible for the preparation of the parent company interim accounting information in accordance with the accounting standard CPC 21, Interim Financial Reporting, of the Brazilian Accounting Pronouncements Committee (CPC), and of the consolidated interim accounting information in accordance with CPC 21 and International Accounting Standard (IAS) 34 - Interim Financial Reporting issued by the International Accounting Standards Board (IASB), as well as the presentation of this information in accordance with the standards issued by the Brazilian Securities Commission (CVM), applicable to the preparation of the Quarterly Information (ITR). Our responsibility is to express a conclusion on this interim accounting information based on our review. Scope of review We conducted our review in accordance with Brazilian and International Standards on Reviews of Interim Financial Information (NBC TR 2410 – Review of Interim Financial Information Performed by the Independent Auditor of the Entity and ISRE 2410 – Review of Interim Financial Information Performed by the Independent Auditor of the Entity, respectively). A review of interim information consists of making inquiries, primarily of persons responsible for financial and accounting matters, and applying analytical and other review procedures. A review is substantially less in scope than an audit conducted in accordance with Brazilian and International Standards on Auditing and consequently does not enable us to obtain assurance that we would become aware of all significant matters that might be identified in an audit. Accordingly, we do not express an audit opinion. Conclusion on the parent company interim information Based on our review, nothing has come to our attention that causes us to believe that the accompanying parent company interim accounting information included in the quarterly information referred to above has not been prepared, in all material respects, in accordance with CPC 21 applicable to the preparation of the Quarterly Information, and presented in accordance with the standards issued by the CVM.
(A free translation of the original in Portuguese)
60
Conclusion on the consolidated interim information Based on our review, nothing has come to our attention that causes us to believe that the accompanying consolidated interim accounting information included in the quarterly information referred to above has not been prepared, in all material respects, in accordance with CPC 21 and IAS 34 applicable to the preparation of the Quarterly Information, and presented in accordance with the standards issued by the CVM. Other matters Statements of value added We have also reviewed the parent company and consolidated statements of value added for the quarter ended March 31, 2015. These statements are the responsibility of the Company’s management, and are required to be presented in accordance with standards issued by the CVM applicable to the preparation of Quarterly Information (ITR) and are considered supplementary information under IFRS, which do not require the presentation of the statement of value added. These statements have been submitted to the same review procedures described above and, based on our review, nothing has come to our attention that causes us to believe that they have not been prepared, in all material respects, in a manner consistent with the parent company and consolidated interim accounting information taken as a whole. São Paulo May 4, 2015. PricewaterhouseCoopers Auditores Independentes CRC 2SP000160/O-5 Marco Aurélio de Castro e Melo Contador CRC 1SP153070/O-3

![INDIAN INCOME TAX RETURN ACKNOWLEDGEMENT ......[Where the data of the Return of Income in Form ITR-1 (SAHAJ), ITR-2, ITR-3, ITR-4 , ITR-5, ITR-6,ITR-7 filed and verified electronically]](https://static.fdocuments.us/doc/165x107/61250246c71ac647a36c0516/indian-income-tax-return-acknowledgement-where-the-data-of-the-return-of.jpg)


![[Totvs] - Instal an Do Com (SQL)](https://static.fdocuments.us/doc/165x107/577d1db61a28ab4e1e8ccac8/totvs-instal-an-do-com-sql.jpg)