TOTVS S.A. · (A free translation of the original in Portuguese) TOTVS S.A. Quarterly information...
61
(A free translation of the original in Portuguese) TOTVS S.A. Quarterly information (ITR) at June 30, 2014 and report on review of quarterly information
Transcript of TOTVS S.A. · (A free translation of the original in Portuguese) TOTVS S.A. Quarterly information...

(A free translation of the original in Portuguese)
TOTVS S.A. Quarterly information (ITR) at June 30, 2014 and report on review of quarterly information
(A free translation of the original in Portuguese)
Quarterly information (ITR) - 6/30/2014 - TOTVS S.A. Version: 1
Contents
Company information
Capital composition 1 Dividends 2 Parent company financial statements
Balance sheet - assets 3 Balance sheet - liabilities and equity 4 Statement of income 6 Statement of comprehensive income 8 Statement of cash flow - indirect method 9 Statement of changes in equity 1/1/2014 to 6/30/2014 10 1/1/2013 to 6/30/2013 11 Statement of value added 12
Consolidated financial statements
Balance sheet - assets 13 Balance sheet - liabilities and equity 14 Statement of income 16 Statement of comprehensive income 18 Statement of cash flow - indirect method 19 Statement of changes in equity 1/1/2014 to 6/30/2014 20 1/1/2013 to 6/30/2013 21 Statement of value added 22 Comments on performance 23
Notes 26 Guidance tracking 57 Opinions and statements Report on review of interim quarterly financial information 58
(A free translation of the original in Portuguese)
1
Quarterly information (ITR) - 6/30/2014 - TOTVS S.A. Version: 1
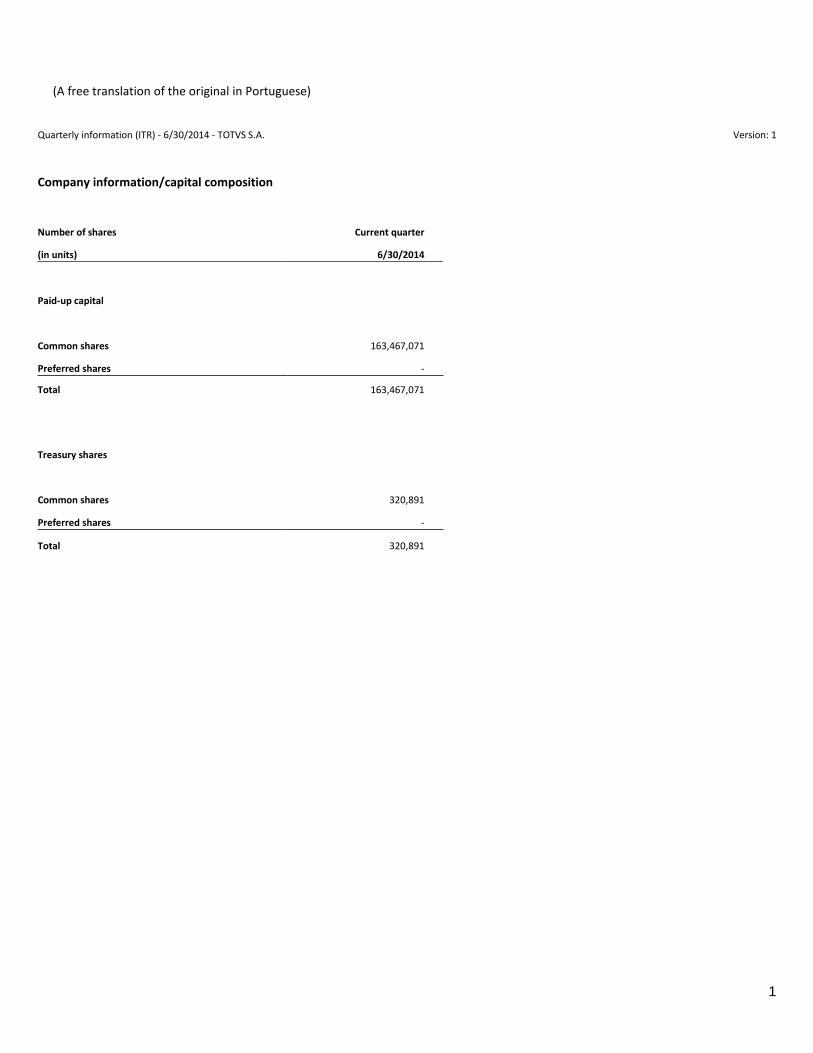
Company information/capital composition
Number of shares Current quarter
(in units) 6/30/2014
Paid-up capital
Common shares 163,467,071
Preferred shares -
Total 163,467,071 Treasury shares
Common shares 320,891
Preferred shares -
Total 320,891
(A free translation of the original in Portuguese)
2
Quarterly information (ITR) - 6/30/2014 - TOTVS S.A. Version: 1
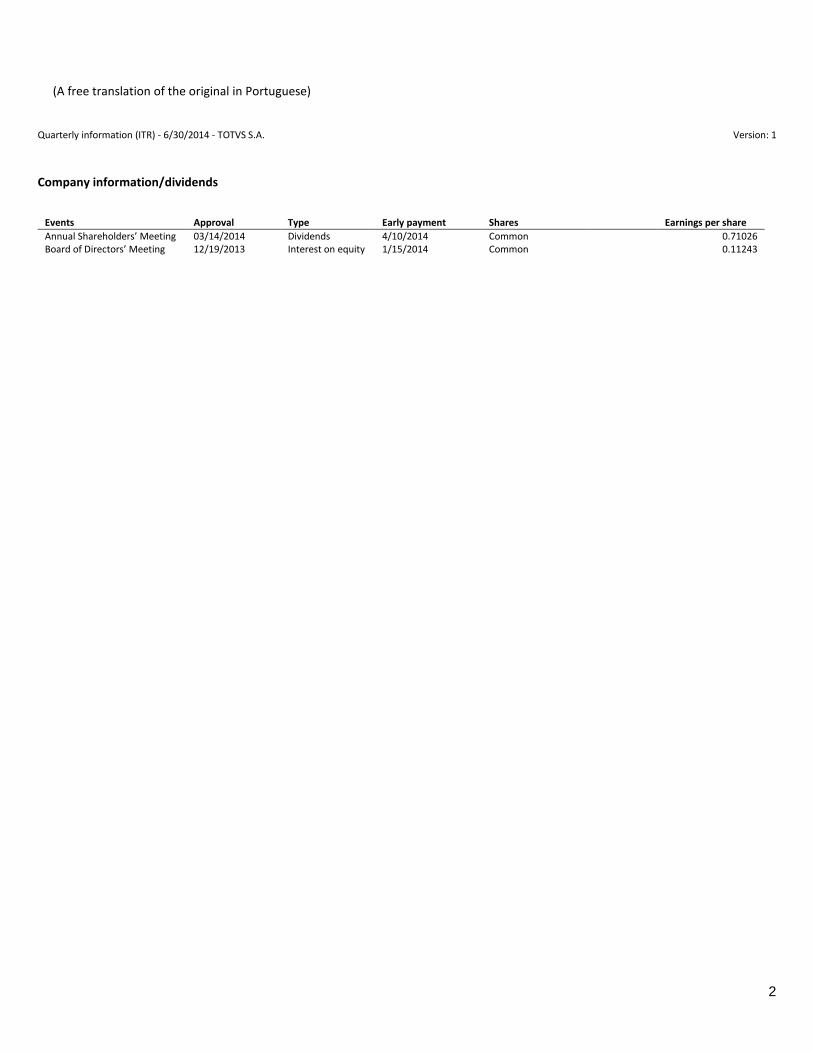
Company information/dividends
Events Approval Type Early payment Shares Earnings per share
Annual Shareholders’ Meeting 03/14/2014 Dividends 4/10/2014 Common 0.71026 Board of Directors’ Meeting 12/19/2013 Interest on equity 1/15/2014 Common 0.11243

(A free translation of the original in Portuguese)
3
Quarterly information (ITR) - 6/30/2014 - TOTVS S.A. Version: 1
Parent company financial statements/balance sheet - assets
(R$ thousand)
Current quarter Previous year
1 – Code 2 - Description 6/30/2014 12/31/2013
1 Total assets 1,757,851 1,724,141
1.01 Current assets 771,693 855,578
1.01.01 Cash and cash equivalents 380,089 506,886
1.01.02 Financial investments 8,625 7,428
1.01.02.02 Financial investments measured at amortized cost 8,625 7,428
1.01.02.02.01 Securities 8,625 7,428
1.01.03 Trade receivables 356,792 322,516
1.01.03.01 Customers 356,792 322,516
1.01.03.01.01 Trade receivables 401,874 357,155
1.01.03.01.02 Provision for doubtful accounts (45,082) (34,639)
1.01.06 Taxes recoverable - 1,476
1.01.08 Other current assets 26,187 17,272
1.01.08.03 Other 26,187 17,272
1.01.08.03.02 Other assets 26,187 17,272
1.02 Non-current assets 986,158 868,563
1.02.01 Long-term receivables 117,560 93,547
1.02.01.02 Financial investments measured at amortized cost 33,490 15,297
1.02.01.02.01 Securities 33,490 15,297
1.02.01.03 Trade receivables 46,741 35,032
1.02.01.03.01 Customers 33,278 22,633
1.02.01.03.02 Other receivables 13,463 12,399
1.02.01.06 Deferred taxes 17,954 25,463
1.02.01.06.01 Deferred income tax and social contribution 17,954 25,463
1.02.01.08 Receivables from related parties 958 3,139
1.02.01.08.02 Receivables from subsidiaries 958 3,139
1.02.01.09 Other non-current assets 18,417 14,616
1.02.01.09.03 Judicial deposits 18,417 14,616
1.02.02 Investments 379,399 265,920
1.02.02.01 Equity investments 379,399 265,920
1.02.02.01.02 Interests in subsidiaries 379,399 265,920
1.02.03 Property, plant and equipment 61,324 60,393
1.02.03.01 Property, plant and equipment in service 61,324 60,393
1.02.04 Intangible assets 427,875 448,703
1.02.04.01 Intangible assets 427,875 448,703

(A free translation of the original in Portuguese)
4
Quarterly information (ITR) - 6/30/2014 - TOTVS S.A. Version: 1
Parent company financial statements / balance sheet - liabilities and equity
(R$ thousand)
Current Quarter
Previous
year
1 – Code 2 - Description 6/30/2014 12/31/2013
2 Total liabilities 1,757,851 1,724,141
2.01 Current liabilities 262,947 277,528
2.01.01 Social and labor obligations 104,747 83,394
2.01.01.01 Social obligations 9,284 10,298
2.01.01.02 Labor obligations 95,463 73,096
2.01.02 Trade payables 29,921 27,539
2.01.02.01 Domestic suppliers 29,921 27,539
2.01.03 Tax obligations 4,453 11,127
2.01.03.01 Federal tax obligations 4,453 11,127
2.01.04 Borrowing 32,541 56,932
2.01.04.01 Borrowing 29,311 55,127
2.01.04.01.01 In local currency 29,311 55,127
2.01.04.02 Debentures 3,230 1,805
2.01.05 Other liabilities 91,285 98,536
2.01.05.02 Other 91,285 98,536
2.01.05.02.01 Dividends and interest on capital payable 858 32,012
2.01.05.02.04 Obligations for purchases of investments 24,440 8,530
2.01.05.02.05 Commission payable 57,907 56,409
2.01.05.02.06 Other liabilities 8,080 1,585
2.02 Non-current liabilities 412,795 378,992
2.02.01 Borrowing 358,306 352,400
2.02.01.01 Borrowing 250,000 250,000
2.02.01.01.01 In local currency 250,000 250,000
2.02.01.02 Debentures 108,306 102,400
2.02.02 Other liabilities 45,931 19,409
2.02.02.02 Other 45,931 19,409
2.02.02.02.03 Obligations for purchases of investments 45,931 19,409
2.02.04 Provision 8,558 7,183 2.02.04.01 Tax, social security, labor and civil provision 8,558 7,183
2.02.04.01.01 Tax provision 75 645
2.02.04.01.02 Social security and labor provision 7,068 5,546
2.02.04.01.04 Civil provision 1,415 992
2.03 Equity 1,082,109 1,067,621
2.03.01 Paid-up capital 526,592 526,592
2.03.02 Capital reserves 80,600 85,367
2.03.02.02 Special goodwill reserve on mergers 14,330 14,330
2.03.02.04 Share options 27,869 33,329 2.03.02.05 Treasury shares (12,267) (12,960) 2.03.02.07 Goodwill reserves 31,557 31,557
(A free translation of the original in Portuguese)
5
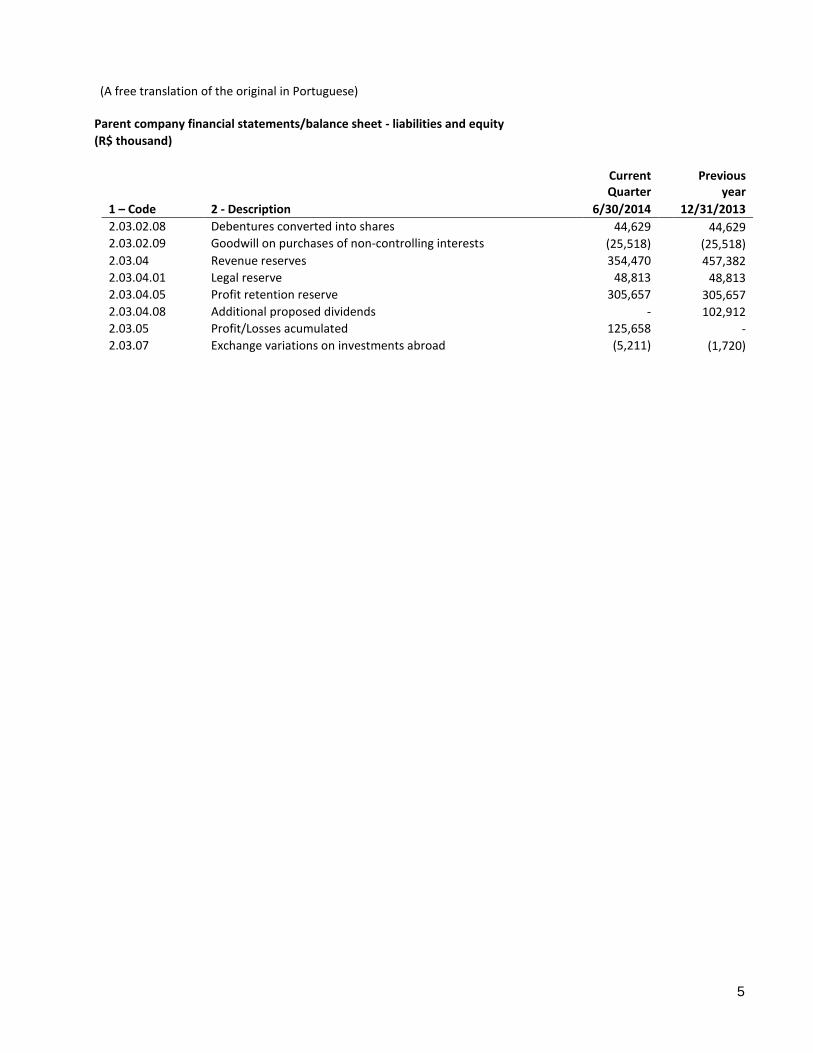
Parent company financial statements/balance sheet - liabilities and equity
(R$ thousand)
Current Quarter
Previous
year
1 – Code 2 - Description 6/30/2014 12/31/2013
2.03.02.08 Debentures converted into shares 44,629 44,629 2.03.02.09 Goodwill on purchases of non-controlling interests (25,518) (25,518)
2.03.04 Revenue reserves 354,470 457,382
2.03.04.01 Legal reserve 48,813 48,813
2.03.04.05 Profit retention reserve 305,657 305,657
2.03.04.08 Additional proposed dividends - 102,912
2.03.05 Profit/Losses acumulated 125,658 -
2.03.07 Exchange variations on investments abroad (5,211) (1,720)

(A free translation of the original in Portuguese)
6
Quarterly information (ITR) - 6/30/2014 - TOTVS S.A. Version: 1
Parent company financial statements/statement of income
(R$ thousand)
1 – Code 2 – Description
Current quarter
4/1/2014 to 6/30/2014
Accumulated - current period
1/1/2014 to 6/30/2014
Same quarter of prior year
4/1/2013 to 6/30/2013
Accumulated - prior year
1/1/2013 to 6/30/2013
3.01 Sales and/or service revenue 381,333 759,240 359,032 699,843 3.01.01 Licensing fees 80,367 164,430 79,563 155,287 3.01.02 Services 104,848 204,323 102,667 192,287 3.01.03 Maintenance 196,118 390,487 176,802 352,269 3.02 Cost of sales and/or services (120,773) (237,304) (111,008) (219,715) 3.02.01 Cost of licensing fees (17,213) (32,818) (15,239) (32,000) 3.02.02 Cost of services (103,560) (204,486) (95,769) (187,715) 3.03 Gross profit 260,560 521,936 248,024 480,128 3.04 Operating income (expenses) (173,447) (344,863) (168,551) (323,176) 3.04.01 Selling expenses (26,049) (49,688) (19,744) (39,935) 3.04.02 General and administrative expenses (21,578) (44,426) (19,718) (38,016) 3.04.05 Other operating expenses (126,479) (252,639) (122,115) (232,007) 3.04.05.01 Research and development (52,891) (103,743) (45,727) (87,880) 3.04.05.02 Advertising expenses (11,999) (16,418) (10,940) (15,328) 3.04.05.03 Commission (34,302) (73,817) (36,380) (72,321) 3.04.05.04 Management fees (4,486) (11,398) (5,371) (11,783) 3.04.05.05 Depreciation and amortization (17,187) (34,392) (17,751) (35,638) 3.04.05.06 Provision for doubtful accounts (5,875) (13,114) (5,787) (8,857) 3.04.05.07 Other operating income and expenses, net 261 243 (159) (200) 3.04.06 Equity pick-up 659 1,890 (6,974) (13,218) 3.05 Profit before finance results and taxes 87,113 177,073 79,473 156,952 3.06 Finance results 3,258 1,952 (342) 1,032 3.06.01 Finance income 13,453 28,867 7,944 16,774 3.06.02 Finance costs (10,195) (26,915) (8,286) (15,742) 3.07 Profit before taxes on income 90,371 179,025 79,131 157,984 3.08 Income tax and social contribution on net income (26,211) (53,367) (25,466) (52,425) 3.08.01 Current (20,172) (44,061) (11,955) (36,835) 3.08.02 Deferred (6,039) (9,306) (13,511) (15,590) 3.09 Profit for the period from continuing operations 64,160 125,658 53,665 105,559
(A free translation of the original in Portuguese)
7
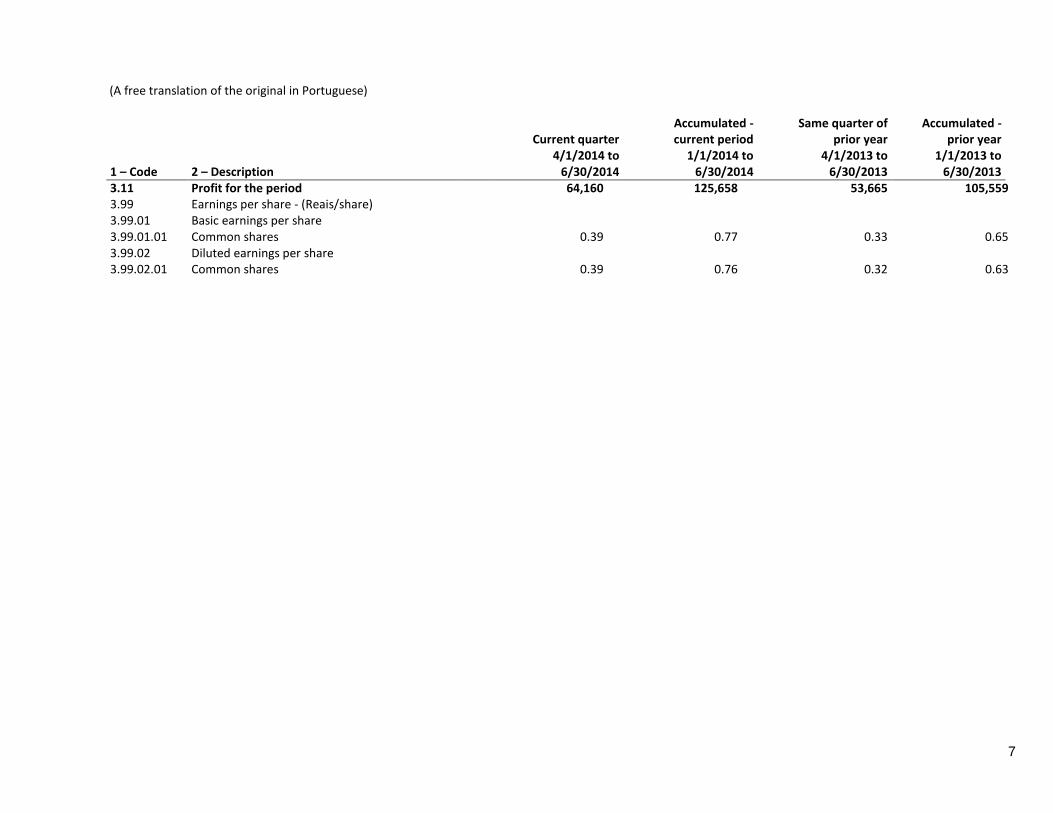
1 – Code 2 – Description
Current quarter
4/1/2014 to 6/30/2014
Accumulated - current period
1/1/2014 to 6/30/2014
Same quarter of prior year
4/1/2013 to 6/30/2013
Accumulated - prior year
1/1/2013 to 6/30/2013
3.11 Profit for the period 64,160 125,658 53,665 105,559 3.99 Earnings per share - (Reais/share) 3.99.01 Basic earnings per share 3.99.01.01 Common shares 0.39 0.77 0.33 0.65 3.99.02 Diluted earnings per share 3.99.02.01 Common shares 0.39 0.76 0.32 0.63
(A free translation of the original in Portuguese)
8
Quarterly information (ITR) - 6/30/2014 - TOTVS S.A. Version: 1
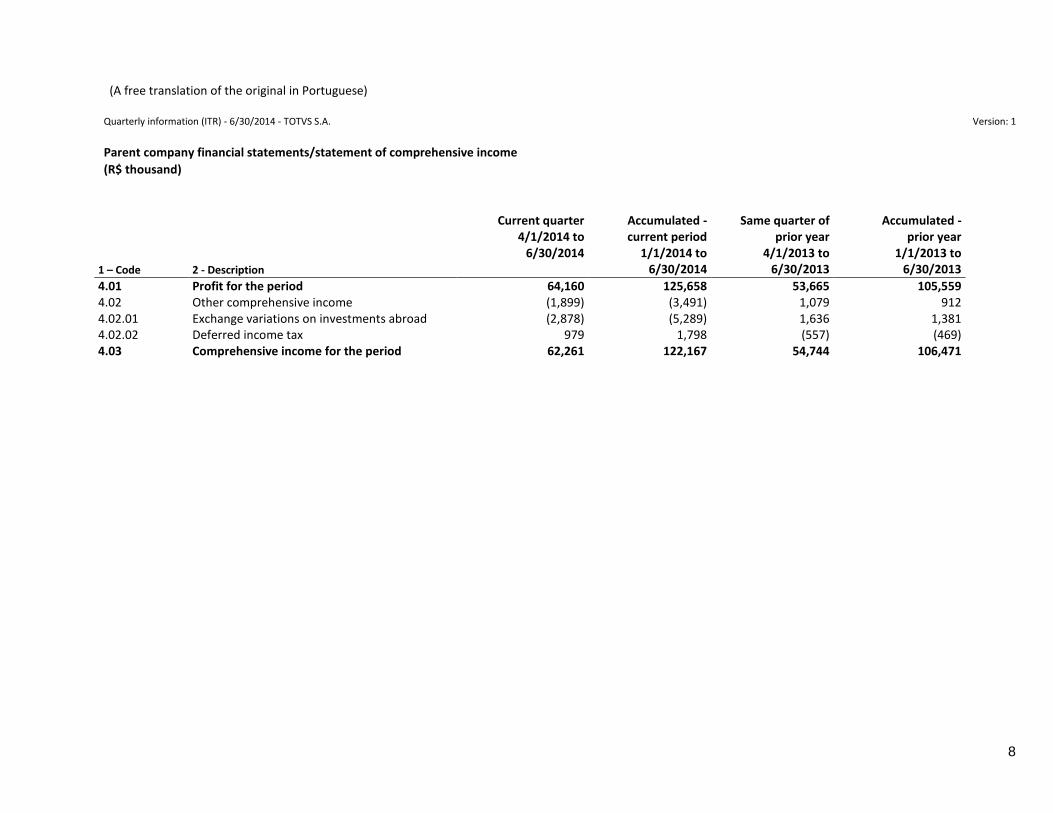
Parent company financial statements/statement of comprehensive income
(R$ thousand)
1 – Code 2 - Description
Current quarter
4/1/2014 to 6/30/2014
Accumulated - current period
1/1/2014 to 6/30/2014
Same quarter of prior year
4/1/2013 to 6/30/2013
Accumulated - prior year
1/1/2013 to 6/30/2013
4.01 Profit for the period 64,160 125,658 53,665 105,559 4.02 Other comprehensive income (1,899) (3,491) 1,079 912 4.02.01 Exchange variations on investments abroad (2,878) (5,289) 1,636 1,381 4.02.02 Deferred income tax 979 1,798 (557) (469) 4.03 Comprehensive income for the period 62,261 122,167 54,744 106,471

(A free translation of the original in Portuguese)
9
Quarterly information (ITR) - 6/30/2014 - TOTVS S.A. Version: 1
Parent company financial statements/statement of cash flow - indirect method
(R$ thousand)
Accumulated current quarter
Accumulated same quarter of previous
year
1 - Code 2 - Description 6/30/2014 6/30/2013
6.01 Net cash provided by operating activities 147,248 147,915 6.01.01 Cash provided by operations 251,724 226,786 6.01.01.01 Profit before taxes for the period 179,025 157,984
6.01.01.02 Depreciation and amortization 34,392 35,638
6.01.01.03 Share-based payments 2,638 4,497 6.01.01.04 Losses on sales of assets 308 355 6.01.01.05 Provision for doubtful accounts 13,114 8,857
6.01.01.06 Equity pick-up (1,890) 13,218
6.01.01.07 Provision for (reversal of) contingencies 1,375 (326) 6.01.01.08 Interest, monetary and exchange variations, net 22,762 6,563 6.01.02 Changes in assets and liabilities (67,209) (55.641)
6.01.02.01 Trade receivables (58,035) (26,246)
6.01.02.03 Other assets (15,267) (11,590) 6.01.02.04 Judicial deposits (3,801) (1,186) 6.01.02.05 Social and labor obligations 21,353 (890)
6.01.02.06 Trade payables 2,382 (1,744)
6.01.02.07 Commission payable 1,498 3,714 6.01.02.08 Taxes payable (23,813) (19,846) 6.01.02.09 Other payables 6,998 (530)
6.01.02.10 Taxes recoverable 1,476 2,677
6.01.03 Other (37,267) (23,230) 6.01.03.01 Interest paid (10,345) (5,314) 6.01.03.02 Income tax and social contribution paid (26,922) (17,916) 6.02 Net cash used in investment activities (109,142) (149,886) 6.02.01 Increases in the capital of subsidiaries (43,342) (138,516)
6.02.02 Purchases of intangible assets (6,382) (1,529)
6.02.03 Acquisition of investments, net of cash obtained upon acquisition (49,384) 6.02.06 Value of fixed assets sale 382 - 6.02.08 Purchases of property, plant and equipment (10,416) (9,841)
6.03 Net cash used in financing activities (164,903) (137,782)
6.03.01 Bank borrowing (25,613) (25,613)
6.03.02 6.03.03
Credit from related companies 2,181 (2,129) Dividends paid (134,066) (117,837)
6.03.05 Increase in capital - 13,253 6.03.07 Treasury shares, net (7,405) (5,456) 6.05 Increase (decrease) in cash and cash equivalents (126,797) (139,753) 6.05.01 Cash and cash equivalents at the beginning of the period 506,886 398,753 6.05.02 Cash and cash equivalents at the end of the period 380,089 259,000

(A free translation of the original in Portuguese)
10
Quarterly information (ITR) - 6/30/2014 - TOTVS S.A. Version: 1
Parent company financial statements/statement of changes in equity - 1/1/2014 to 6/30/2014
(R$ thousand)
1 - Code 2 – Description Paid-up
share capital
Capital reserves, share options and
treasury shares Revenue reserves
Retained earnings
Other comprehensive
income Equity
5.01 Opening balances 526,592 85,367 457,382 - (1,720) 1,067,621
5.03 Adjusted opening balances 526,592 85,367 457,382 - (1,720) 1,067,621
5.04 Capital transactions with owners - (4,767) (102,912) - - (107,679)
5.04.03 Share options recorded - 2,638 - - - 2,638
5.04.04 Purchase of treasury shares - (28,760) - - - (28,760)
5.04.05 Disposal of treasury shares - 21,355 - - - 21,355
5.04.06 Dividends - - (102,912) - - (102,912)
5.05 Total comprehensive income - - - 125,658 (3,491) 122,167
5.05.01 Profit for the period - - - 125,658 - 125,658
5.05.02 Other comprehensive income - - - - (3,491) (3,491)
5.05.02.04 Exchange variations on investiments abroad - - - - (3,491) (3,491)
5.07 Closing balances 526,592 80,600 354,470 125,658 (5,211) 1,082,109

(A free translation of the original in Portuguese)
11
Quarterly information (ITR) - 6/30/2014 - TOTVS S.A. Version: 1
Parent company financial statements/statement of changes in equity - 1/1/2013 to 6/30/2013
(R$ thousand)
1 - Code 2 - Description Paid-up
share capital
Capital reserves, share
options and treasury shares
Revenue reserves
Retained earnings
Other comprehensive
income Equity
5.01 Opening balances 480,598 78,241 356,520 - (2,213) 913,146
5.03 Adjusted opening balances 480,598 78,241 356,520 - (2,213) 913,146
5.04 Capital transactions with owners 13,253 (959) (68,803) - - (56,509)
5.04.03 Share options recorded 13,253 4,497 - - - 17,750
5.04.04 Purchase of treasury shares - (5,456) - - - (5,456)
5.04.05 Disposal of treasury shares - - - - - -
5.04.06 Dividends - - (68,803) - - (68,803)
5.05 Total comprehensive income - - - 105,559 912 106,471
5.05.01 Profit for the period - - - 105,559 - 105,559
5.05.02 Other comprehensive income - - - - 912 912
5.05.02.04 Exchange variations on investiments abroad - - - - 912 912
5.07 Closing balances 493,851 77,282 287,717 105,559 (1,301) 963,108

(A free translation of the original in Portuguese)
12
Quarterly information (ITR) - 6/30/2014 - TOTVS S.A. Version: 1
Parent company financial statements/statement of value added
(R$ thousand)
Accumulated
current quarter
6/30/2014
Accumulated same quarter of
previous year 6/30/2013 1 – Code 2 - Description
er
Accumulated same quarter
of previous year
7.01 Revenue 814,726 753,722
7.01.01 Sale of goods and services 827,598 762,781
7.01.02 Other expenses 242 (202)
7.01.04 Provision for (reversal of) doubtful accounts (13,114) (8,857)
7.02 Inputs acquired from third parties (245,650) (233,509)
7.02.01 Cost of sales and services (32,385) (32,644)
7.02.02 Materials, energy, outsourced services and other (213,265) (200,865)
7.03 Gross value added 569,076 520,213
7.04 Retentions (34,392) (35,638)
7.04.01 Depreciation, amortization and depletion (34,392) (35,638)
7.05 Net value added generated 534,684 484,575
7.06 Value added received through transfers 30,757 1,826
7.06.01 Equity in the results of subsidiaries 1,890 (13,218)
7.06.02 Finance income 28,867 15,044
7.07 Total value added to distribute 565,441 486,401
7.08 Distribution of value added 565,441 486,401
7.08.01 Personnel 264,558 232,463
7.08.01.01 Direct remuneration 222,435 191,415
7.08.01.02 Benefits 24,609 24,041
7.08.01.03 Government Severance Indemnity Fund for Employees (FGTS) 17,514 17,007
7.08.02 Taxes and contributions 135,856 124,786
7.08.02.01 Federal 116,557 107,030
7.08.02.02 State 81 (56)
7.08.02.03 Municipal 19,218 17,812
7.08.03 Remuneration of third party capital 39,369 23,593
7.08.03.01 Interest 26,915 12,350
7.08.03.02 Rent 12,454 11,243
7.08.04 Remuneration of own capital 125,658 105,559
7.08.04.03 Profits reinvested 125,658 105,559

(A free translation of the original in Portuguese)
13
Quarterly information (ITR) - 6/30/2014 - TOTVS S.A. Version: 1
Consolidated financial statements/balance sheet - assets
(R$ thousand)
Current Quarter Previous year
1 - Code 2 – Description 6/30/2014 12/31/2013
1 Total assets 1,861,068 1,848,780
1.01 Current assets 858,947 941,748
1.01.01 Cash and cash equivalents 401,539 533,063
1.01.02 Financial investments 14,339 13,277
1.01.02.02 Financial investments measured at amortized cost 14,339 13,277
1.01.02.02.01 Securities 14,339 13,277
1.01.03 Trade receivables 407,348 365,220
1.01.03.01 Customers 407,348 365,220
1.01.03.01.01 Trade receivables 456,635 404,985
1.01.03.01.02 Provision for doubtful accounts (49,287) (39,765)
1.01.06 Taxes recoverable 6,015 7,634
1.01.06.01 Current taxes recoverable 6,015 7,634
1.01.08 Other current assets 29,706 22,554
1.01.08.03 Other 29,706 22,554
1.01.08.03.02 Other assets 29,706 22,554
1.02 Non-current assets 1,002,121 907,032
1.02.01 Long-term receivables 223,957 204,451
1.02.01.02 Financial investments measured at amortized cost 81,935 61,322
1.02.01.02.01 Securities 81,935 61,322
1.02.01.03 Trade receivables 53,228 43,474
1.02.01.03.01 Customers 34,564 24,126
1.02.01.03.02 Other receivables 18,664 19,348
1.02.01.06 Deferred taxes 33,459 48,707
1.02.01.06.01 Deferred income tax and social contribution 33,459 48,707
1.02.01.09 Other non-current assets 55,335 50,948
1.02.01.09.03 Judicial deposits 18,859 14,616
1.02.01.09.04 Financial assets at fair value 36,476 36,332
1.02.03 Property, plant and equipment 73,227 70,674
1.02.03.01 Property, plant and equipment in service 73,227 70,674
1.02.04 Intangible assets 704,937 631,907
1.02.04.01 Intangible assets 253,492 257,529
1.02.04.02 Goodwill 451,445 374,378
(A free translation of the original in Portuguese)
14
Quarterly information (ITR) - 6/30/2014 - TOTVS S.A. Version: 1
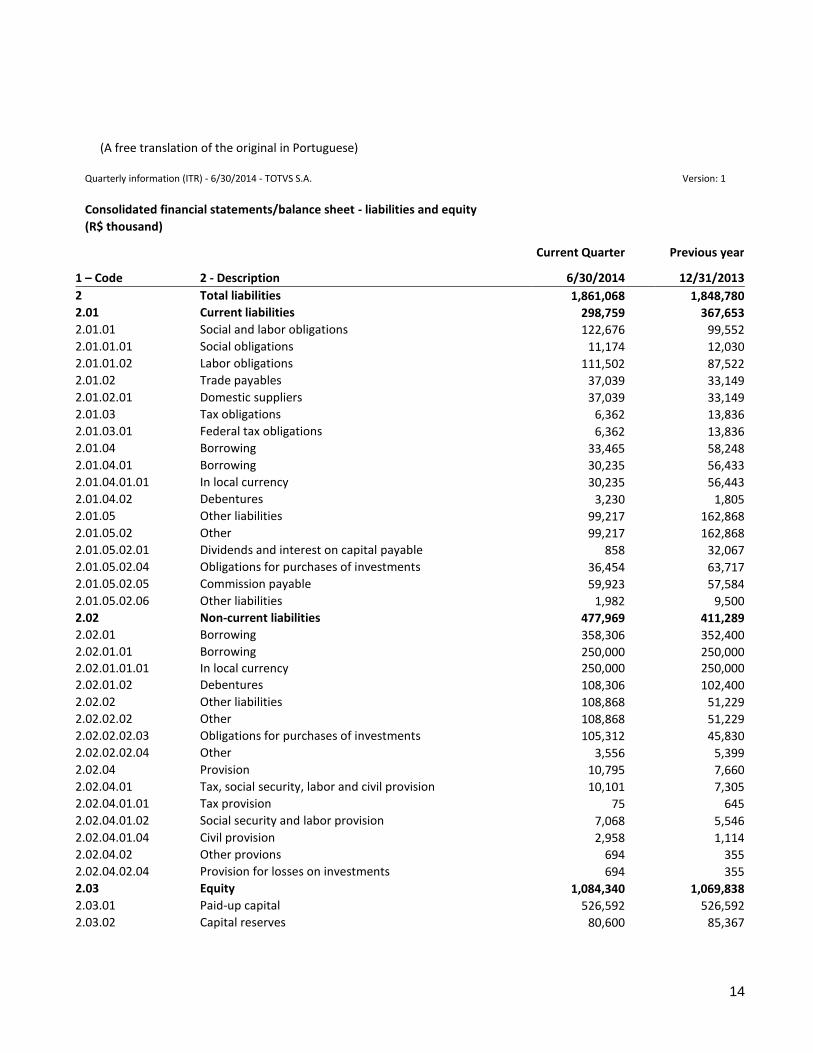
Consolidated financial statements/balance sheet - liabilities and equity
(R$ thousand)
Current Quarter Previous year
1 – Code 2 - Description 6/30/2014 12/31/2013
2 Total liabilities 1,861,068 1,848,780 2.01 Current liabilities 298,759 367,653
2.01.01 Social and labor obligations 122,676 99,552
2.01.01.01 Social obligations 11,174 12,030
2.01.01.02 Labor obligations 111,502 87,522 2.01.02 Trade payables 37,039 33,149
2.01.02.01 Domestic suppliers 37,039 33,149
2.01.03 Tax obligations 6,362 13,836
2.01.03.01 Federal tax obligations 6,362 13,836 2.01.04 Borrowing 33,465 58,248
2.01.04.01 Borrowing 30,235 56,433
2.01.04.01.01 In local currency 30,235 56,443
2.01.04.02 Debentures 3,230 1,805 2.01.05 Other liabilities 99,217 162,868
2.01.05.02 Other 99,217 162,868
2.01.05.02.01 Dividends and interest on capital payable 858 32,067
2.01.05.02.04 Obligations for purchases of investments 36,454 63,717 2.01.05.02.05 Commission payable 59,923 57,584
2.01.05.02.06 Other liabilities 1,982 9,500
2.02 Non-current liabilities 477,969 411,289
2.02.01 Borrowing 358,306 352,400 2.02.01.01 Borrowing 250,000 250,000 2.02.01.01.01 In local currency 250,000 250,000
2.02.01.02 Debentures 108,306 102,400
2.02.02 Other liabilities 108,868 51,229
2.02.02.02 Other 108,868 51,229
2.02.02.02.03 Obligations for purchases of investments 105,312 45,830
2.02.02.02.04 Other 3,556 5,399
2.02.04 Provision 10,795 7,660
2.02.04.01 Tax, social security, labor and civil provision 10,101 7,305
2.02.04.01.01 Tax provision 75 645
2.02.04.01.02 Social security and labor provision 7,068 5,546
2.02.04.01.04 Civil provision 2,958 1,114
2.02.04.02 Other provions 694 355
2.02.04.02.04 Provision for losses on investments 694 355
2.03 Equity 1,084,340 1,069,838
2.03.01 Paid-up capital 526,592 526,592
2.03.02 Capital reserves 80,600 85,367

(A free translation of the original in Portuguese)
15
Consolidated financial statements/balance sheet - liabilities and equity
(R$ thousand)
Current Quarter
Previous year
1 - Code 2 – Description 6/30/2014 12/31/2013
2.03.02.02 Special goodwill reserve on mergers 14,330 14,330
2.03.02.04 Share options 27,869 33,329
2.03.02.05 Treasury shares (12,267) (12,960)
2.03.02.07 Goodwill reserve 31,557 31,557
2.03.02.08 Debentures converted into shares 44,629 44,629
2.03.02.09 Goodwill on purchases of non-controlling interests (25,518) (25,518)
2.03.04 Profit reserve 354,470 457,382
2.03.04.01 Legal reserve 48,813 48,813
2.03.04.05 Profit retention reserve 305,657 305,657
2.03.04.08 Additional proposed dividends - 102,912
2.03.05 Profit/losses accumulated 125,658 -
2.03.07 Exchange variations on investiments abroad (5,211) (1,720)
2.03.09 Participation of non-controlling shareholders 2,231 2,217
(A free translation of the original in Portuguese)
16
Quarterly information (ITR) - 6/30/2014 - TOTVS S.A. Version: 1
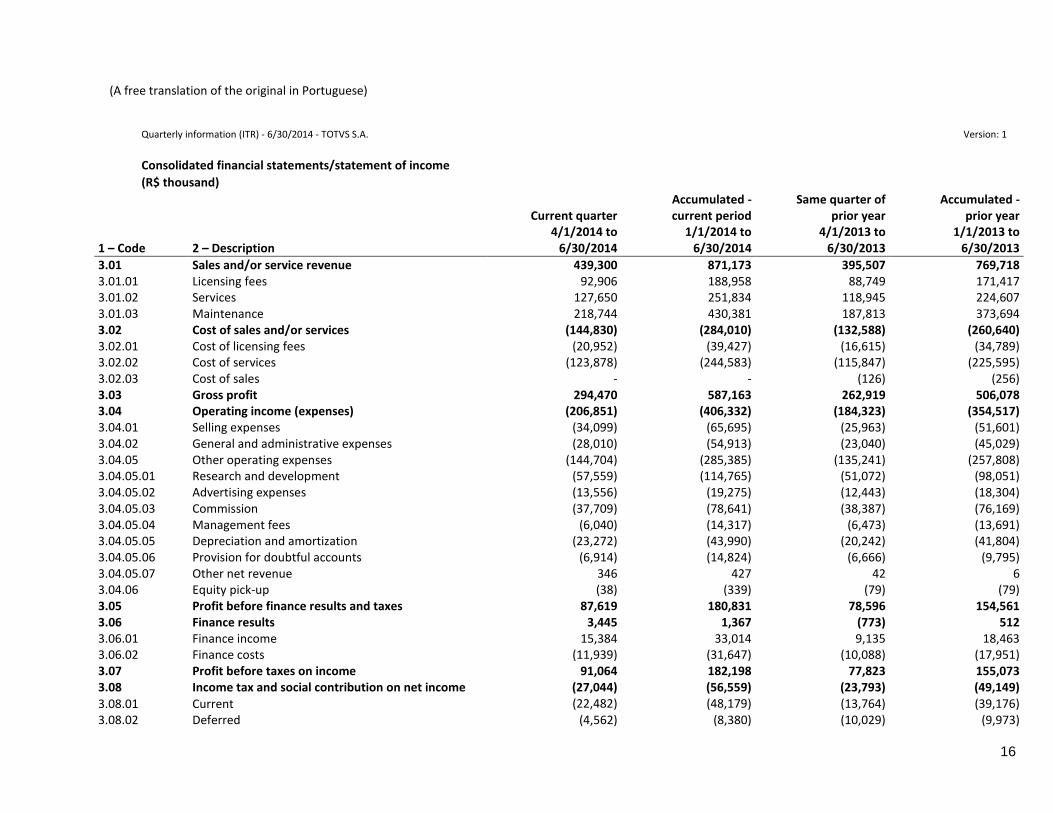
Consolidated financial statements/statement of income
(R$ thousand)
1 – Code 2 – Description
Current quarter
4/1/2014 to 6/30/2014
Accumulated - current period
1/1/2014 to 6/30/2014
Same quarter of prior year
4/1/2013 to 6/30/2013
Accumulated - prior year
1/1/2013 to 6/30/2013
3.01 Sales and/or service revenue 439,300 871,173 395,507 769,718 3.01.01 Licensing fees 92,906 188,958 88,749 171,417 3.01.02 Services 127,650 251,834 118,945 224,607 3.01.03 Maintenance 218,744 430,381 187,813 373,694 3.02 Cost of sales and/or services (144,830) (284,010) (132,588) (260,640) 3.02.01 Cost of licensing fees (20,952) (39,427) (16,615) (34,789) 3.02.02 Cost of services (123,878) (244,583) (115,847) (225,595) 3.02.03 Cost of sales - - (126) (256) 3.03 Gross profit 294,470 587,163 262,919 506,078 3.04 Operating income (expenses) (206,851) (406,332) (184,323) (354,517) 3.04.01 Selling expenses (34,099) (65,695) (25,963) (51,601) 3.04.02 General and administrative expenses (28,010) (54,913) (23,040) (45,029) 3.04.05 Other operating expenses (144,704) (285,385) (135,241) (257,808) 3.04.05.01 Research and development (57,559) (114,765) (51,072) (98,051) 3.04.05.02 Advertising expenses (13,556) (19,275) (12,443) (18,304) 3.04.05.03 Commission (37,709) (78,641) (38,387) (76,169) 3.04.05.04 Management fees (6,040) (14,317) (6,473) (13,691) 3.04.05.05 Depreciation and amortization (23,272) (43,990) (20,242) (41,804) 3.04.05.06 Provision for doubtful accounts (6,914) (14,824) (6,666) (9,795) 3.04.05.07 Other net revenue 346 427 42 6 3.04.06 Equity pick-up (38) (339) (79) (79) 3.05 Profit before finance results and taxes 87,619 180,831 78,596 154,561 3.06 Finance results 3,445 1,367 (773) 512 3.06.01 Finance income 15,384 33,014 9,135 18,463 3.06.02 Finance costs (11,939) (31,647) (10,088) (17,951) 3.07 Profit before taxes on income 91,064 182,198 77,823 155,073 3.08 Income tax and social contribution on net income (27,044) (56,559) (23,793) (49,149)
3.08.01 Current (22,482) (48,179) (13,764) (39,176) 3.08.02 Deferred (4,562) (8,380) (10,029) (9,973)
(A free translation of the original in Portuguese)
17
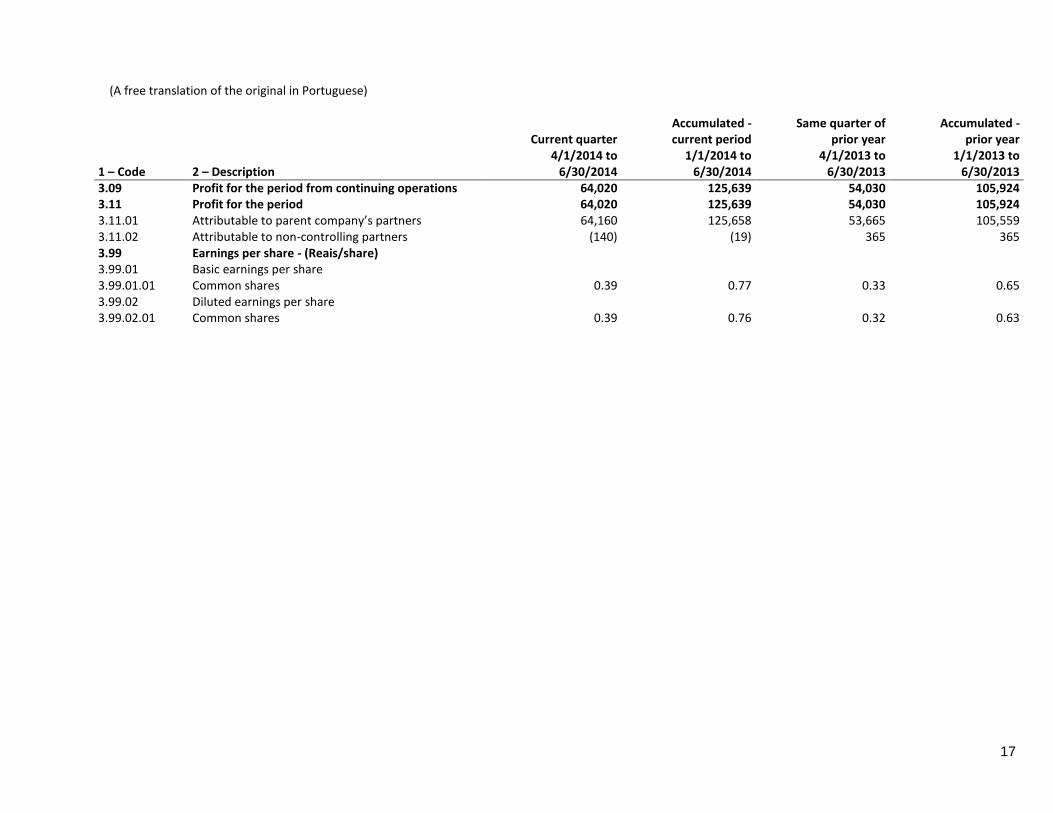
1 – Code 2 – Description
Current quarter
4/1/2014 to 6/30/2014
Accumulated - current period
1/1/2014 to 6/30/2014
Same quarter of prior year
4/1/2013 to 6/30/2013
Accumulated - prior year
1/1/2013 to 6/30/2013
3.09 Profit for the period from continuing operations 64,020 125,639 54,030 105,924 3.11 Profit for the period 64,020 125,639 54,030 105,924 3.11.01 Attributable to parent company’s partners 64,160 125,658 53,665 105,559 3.11.02 Attributable to non-controlling partners (140) (19) 365 365 3.99 Earnings per share - (Reais/share) 3.99.01 Basic earnings per share 3.99.01.01 Common shares 0.39 0.77 0.33 0.65 3.99.02 Diluted earnings per share 3.99.02.01 Common shares 0.39 0.76 0.32 0.63

(A free translation of the original in Portuguese)
18
Quarterly information (ITR) - 6/30/2014 - TOTVS S.A. Version: 1
Consolidated financial statements/statement of comprehensive income
(R$ thousand)
1 – Code 2 – Description
Current quarter
4/1/2014 to 6/30/2014
Accumulated - current period
1/1/2014 to 6/30/2014
Same quarter of prior year
4/1/2013 to 6/30/2013
Accumulated - prior year
1/1/2013 to 6/30/2013
4.01 Profit for the period 64,020 125,639 54,030 105,924
4.02 Other comprehensive income (1,899) (3,491) 1,079 912
4.02.01 Exchange variations on investments abroad (2,878) (5,289) 1,636 1,381
4.02.02 Deferred income tax 979 1,798 (557) (469)
4.03 Comprehensive income for the period 62,121 122,148 55,109 106,836
4.03.01 Attributable to the parent company's partners 62,261 122,167 54,744 106,471
4.03.02 Attributable to non-controlling partners (140) (19) 365 365

(A free translation of the original in Portuguese)
19
Quarterly information (ITR) - 6/30/2014 - TOTVS S.A. Version: 1
Consolidated financial statements/statement of cash flow - indirect method
(R$ thousand)
Accumulate
current quarter Accumulated same quarter
of previous year
1 – Code 2 - Description 1/1/2014 to 6/30/2014
1/1/2013 to
6/30/2013
6.01 Net cash provided by operating activities 139,002 140,203
6.01.01 Cash provided by operations 265,328 221,064
6.01.01.01 Profit before taxes for the period 182,198 155,073
6.01.01.02 Depreciation and amortization 43,990 41,804
6.01.01.03 Share-based payments 2,638 4,497
6.01.01.04 Losses on sales of assets 390 373
6.01.01.05 Provision for doubtful accounts 14,824 9,795
6.01.01.06 Equity pick-up 339 79
6.01.01.07 Interest, monetary and exchange variations, net 2,796 (212)
6.01.01.08 Provision (reversal) for contingencies 18,153 9,655
6.01.02 Changes in assets and liabilities (87,654) (56.492)
6.01.02.01 Trade receivables (64,117) (30,485)
6.01.02.03 Other assets (10,554) (13,740)
6.01.02.04 Judicial deposits (4,243) (1,028)
6.01.02.05 Social and labor obligations 22,118 3,321
6.01.02.06 Taxes recoverable 1,690 1,600
6.01.02.07 Trade payables 2,868 (1,570)
6.01.02.08 Commission payable 1,591 3,602
6.01.02.10 Taxes payable (27,592) (20.533)
6.01.02.11 Other payables (9,415) 2,341
6.01.03 Other (38,672) (24,369)
6.01.03.01 Interest paid (10,345) (5,314)
6.01.03.02 Income tax and social contribution paid (28,327) (19,055)
6.02 Net cash used in investment activities (100,708) (135,510) 6.02.01 Acquisitions of investments, net of cash obtained upon acquisition (433) (6,727)
6.02.03 Purchases of intangible assets (87,146) (79,117)
6.02.06 Value of sales of fixed assets 545 -
6.02.07 Purchases of investments measured at fair value - (35,453) 6.02.08 Purchases of property, plant and equipment (13,674) (14,213)
6.03 Net cash used in financing activities (169,818) (136,511)
6.03.02 Bank borrowing (26,789) (26,471)
6.03.03 Dividends paid (135,624) (117,837) 6.03.05 Increase in capital - 13,253
6.03.08 Treasury shares, net (7,405) (5,456)
6.05 Increase (decrease) in cash and cash equivalents (131,524) (131,818)
6.05.01 Cash and cash equivalents at the beginning of the period 533,063 412,408 6.05.02 Cash and cash equivalents at the end of the period 401,539 280,590
(A free translation of the original in Portuguese)
20
Quarterly information (ITR) - 6/30/2014 - TOTVS S.A. Version: 1
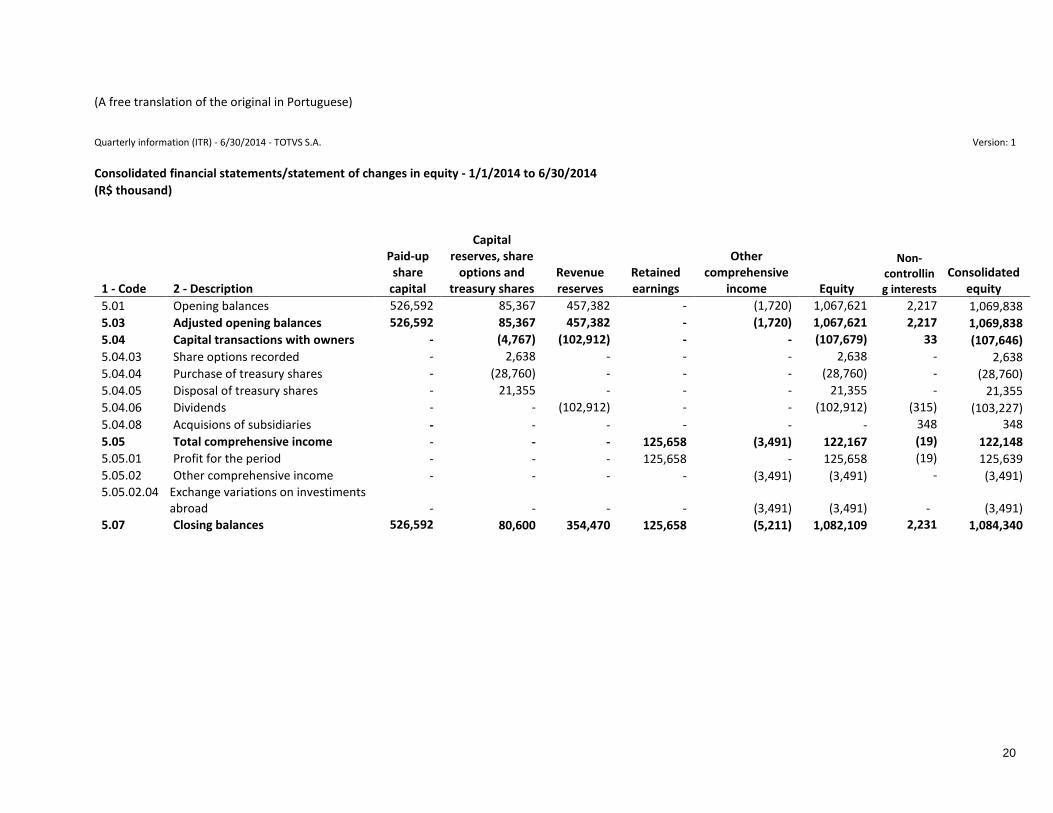
Consolidated financial statements/statement of changes in equity - 1/1/2014 to 6/30/2014
(R$ thousand)
1 - Code 2 - Description
Paid-up share
capital
Capital reserves, share
options and treasury shares
Revenue reserves
Retained earnings
Other comprehensive
income Equity
Non-controlling interests
Consolidated equity
5.01 Opening balances 526,592 85,367 457,382 - (1,720) 1,067,621 2,217 1,069,838
5.03 Adjusted opening balances 526,592 85,367 457,382 - (1,720) 1,067,621 2,217 1,069,838
5.04 Capital transactions with owners - (4,767) (102,912) - - (107,679) 33 (107,646)
5.04.03 Share options recorded - 2,638 - - - 2,638 - 2,638
5.04.04 Purchase of treasury shares - (28,760) - - - (28,760) - (28,760)
5.04.05 Disposal of treasury shares - 21,355 - - - 21,355 - 21,355
5.04.06 Dividends - - (102,912) - - (102,912) (315) (103,227)
5.04.08 Acquisions of subsidiaries - - - - - - 348 348
5.05 Total comprehensive income - - - 125,658 (3,491) 122,167 (19) 122,148
5.05.01 Profit for the period - - - 125,658 - 125,658 (19) 125,639
5.05.02 Other comprehensive income - - - - (3,491) (3,491) - (3,491) 5.05.02.04 Exchange variations on investiments
abroad - - - - (3,491) (3,491)
- (3,491)
5.07 Closing balances 526,592 80,600 354,470 125,658 (5,211) 1,082,109 2,231 1,084,340
(A free translation of the original in Portuguese)
21
Quarterly information (ITR) - 6/30/2014 - TOTVS S.A. Version: 1
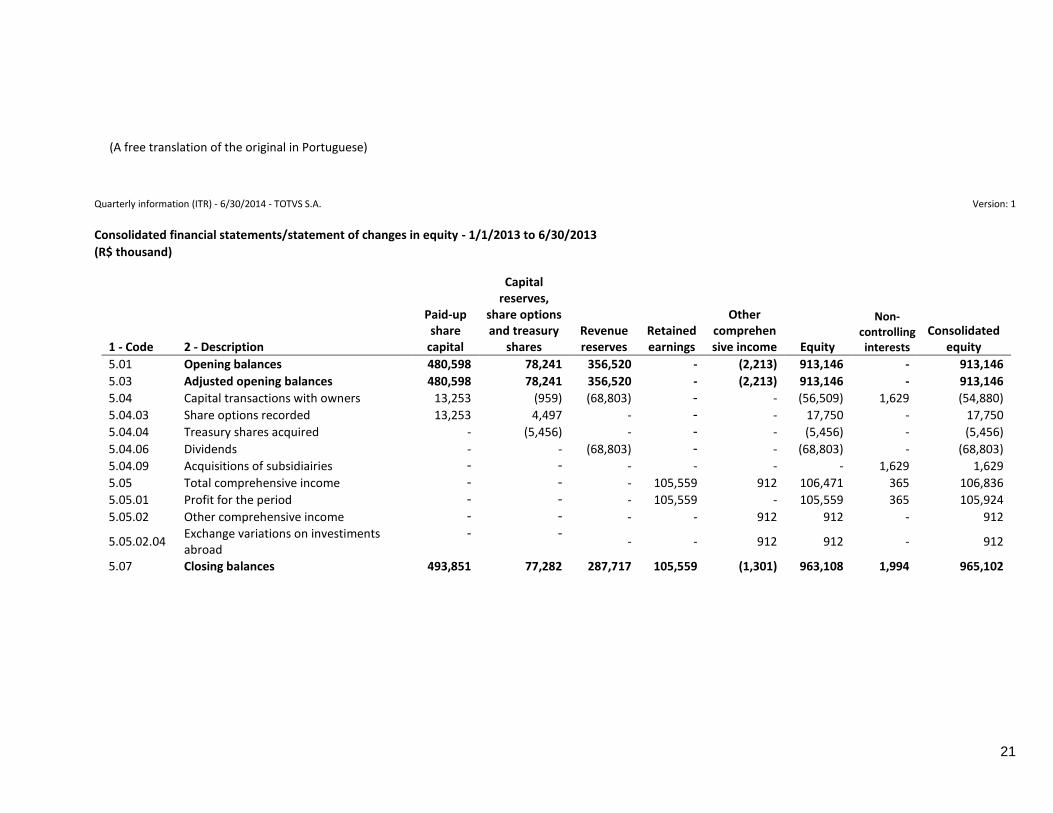
Consolidated financial statements/statement of changes in equity - 1/1/2013 to 6/30/2013
(R$ thousand)
1 - Code 2 - Description
Paid-up share
capital
Capital reserves,
share options and treasury
shares Revenue reserves
Retained earnings
Other comprehensive income Equity
Non-controlling interests
Consolidated equity
5.01 Opening balances 480,598 78,241 356,520 - (2,213) 913,146 - 913,146
5.03 Adjusted opening balances 480,598 78,241 356,520 - (2,213) 913,146 - 913,146
5.04 Capital transactions with owners 13,253 (959) (68,803) - - (56,509) 1,629 (54,880)
5.04.03 Share options recorded 13,253 4,497 - - - 17,750 - 17,750
5.04.04 Treasury shares acquired - (5,456) - - - (5,456) - (5,456)
5.04.06 Dividends - - (68,803) - - (68,803) - (68,803)
5.04.09 Acquisitions of subsidiairies - - - - - - 1,629 1,629
5.05 Total comprehensive income - - - 105,559 912 106,471 365 106,836
5.05.01 Profit for the period - - - 105,559 - 105,559 365 105,924
5.05.02 Other comprehensive income - - - - 912 912 - 912
5.05.02.04 Exchange variations on investiments abroad
- - - - 912 912 - 912
5.07 Closing balances 493,851 77,282 287,717 105,559 (1,301) 963,108 1,994 965,102
(A free translation of the original in Portuguese)
22
Quarterly information (ITR) - 6/30/2014 - TOTVS S.A. Version: 1
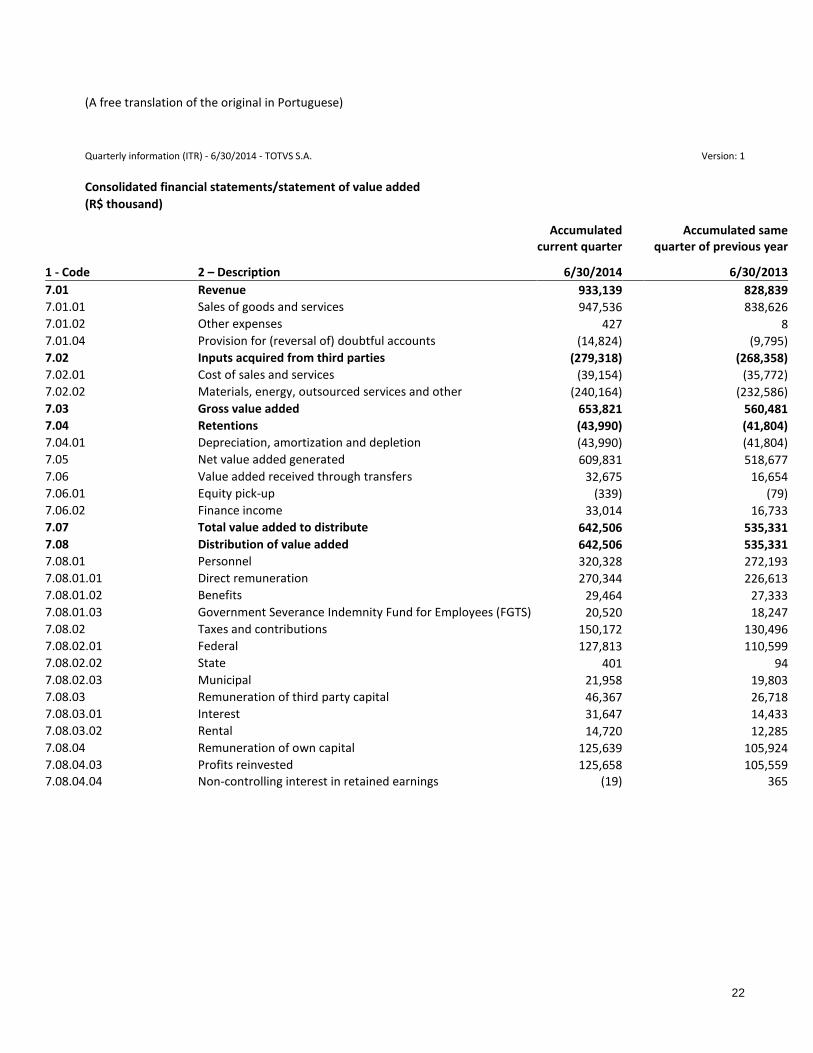
Consolidated financial statements/statement of value added
(R$ thousand)
Accumulated
current quarter
Accumulated same quarter of previous year
1 - Code 2 – Description 6/30/2014 6/30/2013
7.01 Revenue 933,139 828,839
7.01.01 Sales of goods and services 947,536 838,626
7.01.02 Other expenses 427 8
7.01.04 Provision for (reversal of) doubtful accounts (14,824) (9,795)
7.02 Inputs acquired from third parties (279,318) (268,358)
7.02.01 Cost of sales and services (39,154) (35,772)
7.02.02 Materials, energy, outsourced services and other (240,164) (232,586)
7.03 Gross value added 653,821 560,481
7.04 Retentions (43,990) (41,804)
7.04.01 Depreciation, amortization and depletion (43,990) (41,804)
7.05 Net value added generated 609,831 518,677
7.06 Value added received through transfers 32,675 16,654
7.06.01 Equity pick-up (339) (79)
7.06.02 Finance income 33,014 16,733
7.07 Total value added to distribute 642,506 535,331
7.08 Distribution of value added 642,506 535,331
7.08.01 Personnel 320,328 272,193
7.08.01.01 Direct remuneration 270,344 226,613
7.08.01.02 Benefits 29,464 27,333
7.08.01.03 Government Severance Indemnity Fund for Employees (FGTS) 20,520 18,247
7.08.02 Taxes and contributions 150,172 130,496
7.08.02.01 Federal 127,813 110,599
7.08.02.02 State 401 94
7.08.02.03 Municipal 21,958 19,803
7.08.03 Remuneration of third party capital 46,367 26,718
7.08.03.01 Interest 31,647 14,433
7.08.03.02 Rental 14,720 12,285
7.08.04 Remuneration of own capital 125,639 105,924
7.08.04.03 Profits reinvested 125,658 105,559 7.08.04.04 Non-controlling interest in retained earnings (19) 365
(A free translation of the original in Portuguese)
23
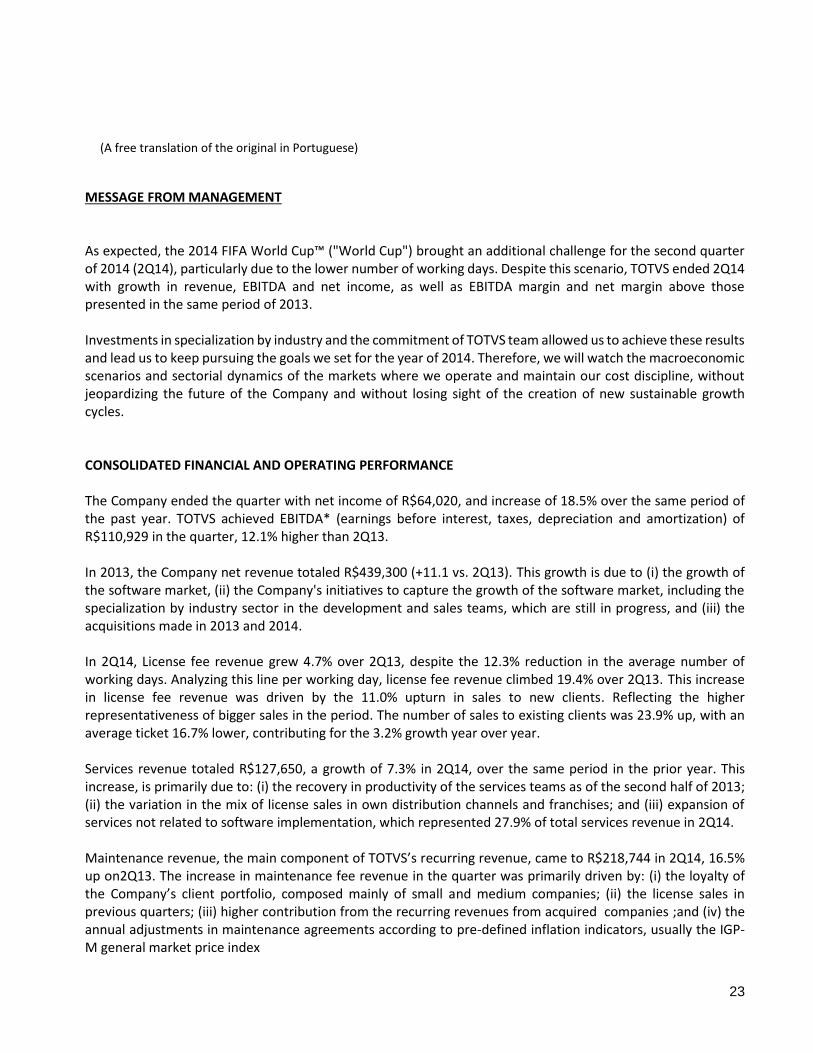
MESSAGE FROM MANAGEMENT As expected, the 2014 FIFA World Cup™ ("World Cup") brought an additional challenge for the second quarter of 2014 (2Q14), particularly due to the lower number of working days. Despite this scenario, TOTVS ended 2Q14 with growth in revenue, EBITDA and net income, as well as EBITDA margin and net margin above those presented in the same period of 2013. Investments in specialization by industry and the commitment of TOTVS team allowed us to achieve these results and lead us to keep pursuing the goals we set for the year of 2014. Therefore, we will watch the macroeconomic scenarios and sectorial dynamics of the markets where we operate and maintain our cost discipline, without jeopardizing the future of the Company and without losing sight of the creation of new sustainable growth cycles. CONSOLIDATED FINANCIAL AND OPERATING PERFORMANCE The Company ended the quarter with net income of R$64,020, and increase of 18.5% over the same period of the past year. TOTVS achieved EBITDA* (earnings before interest, taxes, depreciation and amortization) of R$110,929 in the quarter, 12.1% higher than 2Q13. In 2013, the Company net revenue totaled R$439,300 (+11.1 vs. 2Q13). This growth is due to (i) the growth of the software market, (ii) the Company's initiatives to capture the growth of the software market, including the specialization by industry sector in the development and sales teams, which are still in progress, and (iii) the acquisitions made in 2013 and 2014. In 2Q14, License fee revenue grew 4.7% over 2Q13, despite the 12.3% reduction in the average number of working days. Analyzing this line per working day, license fee revenue climbed 19.4% over 2Q13. This increase in license fee revenue was driven by the 11.0% upturn in sales to new clients. Reflecting the higher representativeness of bigger sales in the period. The number of sales to existing clients was 23.9% up, with an average ticket 16.7% lower, contributing for the 3.2% growth year over year. Services revenue totaled R$127,650, a growth of 7.3% in 2Q14, over the same period in the prior year. This increase, is primarily due to: (i) the recovery in productivity of the services teams as of the second half of 2013; (ii) the variation in the mix of license sales in own distribution channels and franchises; and (iii) expansion of services not related to software implementation, which represented 27.9% of total services revenue in 2Q14. Maintenance revenue, the main component of TOTVS’s recurring revenue, came to R$218,744 in 2Q14, 16.5% up on2Q13. The increase in maintenance fee revenue in the quarter was primarily driven by: (i) the loyalty of the Company’s client portfolio, composed mainly of small and medium companies; (ii) the license sales in previous quarters; (iii) higher contribution from the recurring revenues from acquired companies ;and (iv) the annual adjustments in maintenance agreements according to pre-defined inflation indicators, usually the IGP-M general market price index
(A free translation of the original in Portuguese)
24
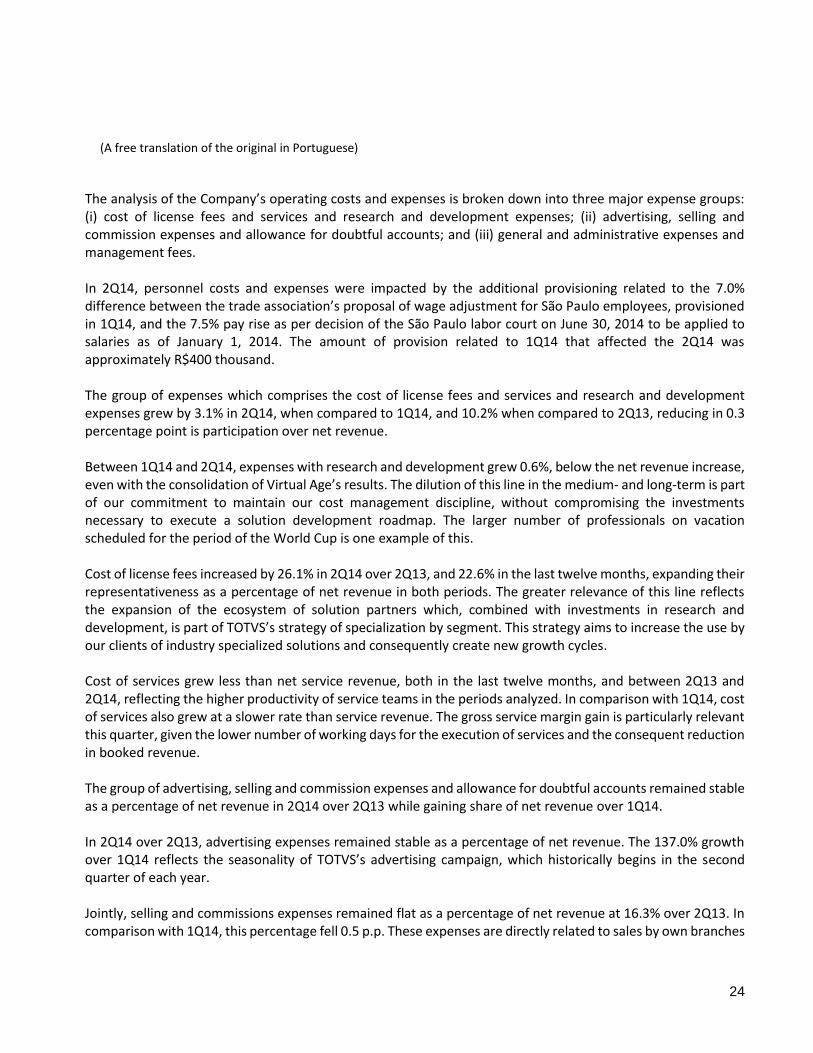
The analysis of the Company’s operating costs and expenses is broken down into three major expense groups: (i) cost of license fees and services and research and development expenses; (ii) advertising, selling and commission expenses and allowance for doubtful accounts; and (iii) general and administrative expenses and management fees. In 2Q14, personnel costs and expenses were impacted by the additional provisioning related to the 7.0% difference between the trade association’s proposal of wage adjustment for São Paulo employees, provisioned in 1Q14, and the 7.5% pay rise as per decision of the São Paulo labor court on June 30, 2014 to be applied to salaries as of January 1, 2014. The amount of provision related to 1Q14 that affected the 2Q14 was approximately R$400 thousand. The group of expenses which comprises the cost of license fees and services and research and development expenses grew by 3.1% in 2Q14, when compared to 1Q14, and 10.2% when compared to 2Q13, reducing in 0.3 percentage point is participation over net revenue. Between 1Q14 and 2Q14, expenses with research and development grew 0.6%, below the net revenue increase, even with the consolidation of Virtual Age’s results. The dilution of this line in the medium- and long-term is part of our commitment to maintain our cost management discipline, without compromising the investments necessary to execute a solution development roadmap. The larger number of professionals on vacation scheduled for the period of the World Cup is one example of this. Cost of license fees increased by 26.1% in 2Q14 over 2Q13, and 22.6% in the last twelve months, expanding their representativeness as a percentage of net revenue in both periods. The greater relevance of this line reflects the expansion of the ecosystem of solution partners which, combined with investments in research and development, is part of TOTVS’s strategy of specialization by segment. This strategy aims to increase the use by our clients of industry specialized solutions and consequently create new growth cycles. Cost of services grew less than net service revenue, both in the last twelve months, and between 2Q13 and 2Q14, reflecting the higher productivity of service teams in the periods analyzed. In comparison with 1Q14, cost of services also grew at a slower rate than service revenue. The gross service margin gain is particularly relevant this quarter, given the lower number of working days for the execution of services and the consequent reduction in booked revenue. The group of advertising, selling and commission expenses and allowance for doubtful accounts remained stable as a percentage of net revenue in 2Q14 over 2Q13 while gaining share of net revenue over 1Q14. In 2Q14 over 2Q13, advertising expenses remained stable as a percentage of net revenue. The 137.0% growth over 1Q14 reflects the seasonality of TOTVS’s advertising campaign, which historically begins in the second quarter of each year. Jointly, selling and commissions expenses remained flat as a percentage of net revenue at 16.3% over 2Q13. In comparison with 1Q14, this percentage fell 0.5 p.p. These expenses are directly related to sales by own branches

(A free translation of the original in Portuguese)
25
and franchises, as well as the breakdown of net revenue in the period, considering the different commission levels on the revenue lines. The allowance for doubtful accounts grew at a slower pace than net revenue in 2Q14 over 2Q13, and decreased by 12.3% over 1Q14, resulting from the credit analysis on accounts receivable. In 2Q14, the group of general and administrative expenses and management fees decreased 3.2% when compared to 1Q14, primarily led by variations on the variable compensations. When compared to the 2Q13 this group drew 15.4%, mainly due to the consolidation of the administrative teams from the companies acquired in 2013 and 2014. Depreciation and amortization expenses came to R$20,718 in 1Q14, of which R$15,266 refers to the amortization of intangible assets and R$5,452 to depreciation of fixed assets.
(A free translation of the original in Portuguese)
26
Notes to the financial statements
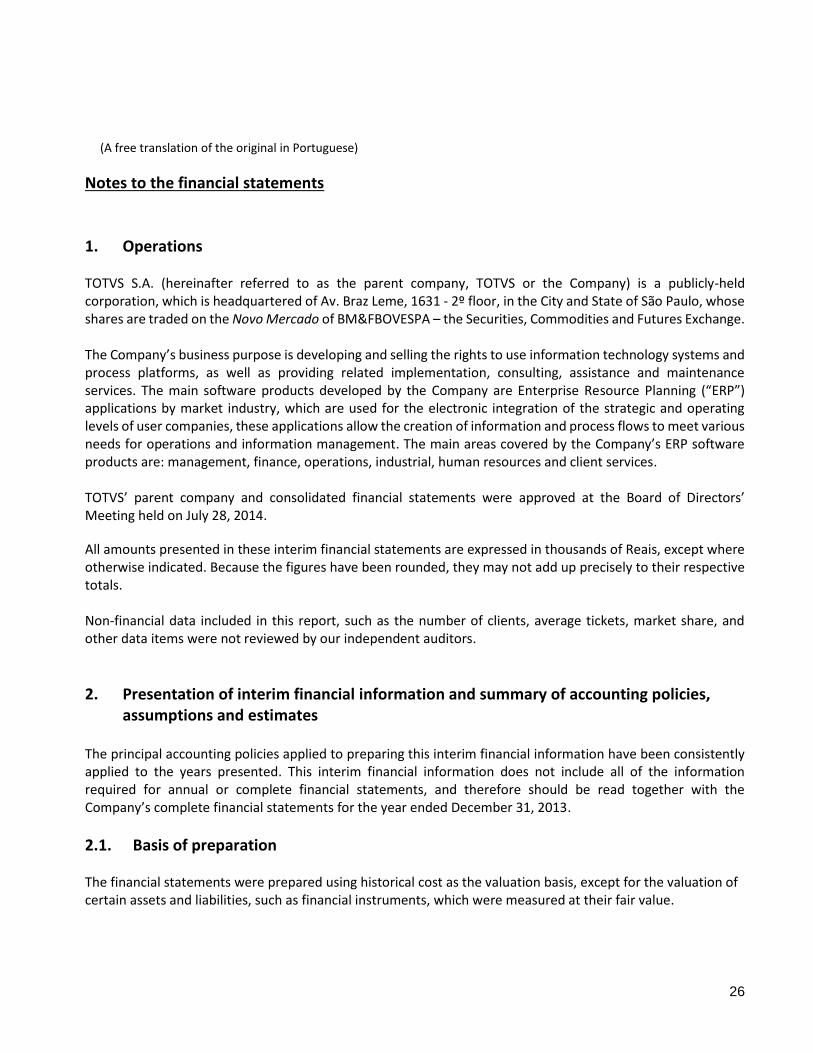
1. Operations TOTVS S.A. (hereinafter referred to as the parent company, TOTVS or the Company) is a publicly-held corporation, which is headquartered of Av. Braz Leme, 1631 - 2º floor, in the City and State of São Paulo, whose shares are traded on the Novo Mercado of BM&FBOVESPA – the Securities, Commodities and Futures Exchange. The Company’s business purpose is developing and selling the rights to use information technology systems and process platforms, as well as providing related implementation, consulting, assistance and maintenance services. The main software products developed by the Company are Enterprise Resource Planning (“ERP”) applications by market industry, which are used for the electronic integration of the strategic and operating levels of user companies, these applications allow the creation of information and process flows to meet various needs for operations and information management. The main areas covered by the Company’s ERP software products are: management, finance, operations, industrial, human resources and client services. TOTVS’ parent company and consolidated financial statements were approved at the Board of Directors’ Meeting held on July 28, 2014.
All amounts presented in these interim financial statements are expressed in thousands of Reais, except where otherwise indicated. Because the figures have been rounded, they may not add up precisely to their respective totals. Non-financial data included in this report, such as the number of clients, average tickets, market share, and other data items were not reviewed by our independent auditors.
2. Presentation of interim financial information and summary of accounting policies, assumptions and estimates
The principal accounting policies applied to preparing this interim financial information have been consistently applied to the years presented. This interim financial information does not include all of the information required for annual or complete financial statements, and therefore should be read together with the Company’s complete financial statements for the year ended December 31, 2013.
2.1. Basis of preparation The financial statements were prepared using historical cost as the valuation basis, except for the valuation of certain assets and liabilities, such as financial instruments, which were measured at their fair value.

(A free translation of the original in Portuguese)
27
(a) Consolidated financial information
The consolidated financial statements were prepared in accordance with CPC 21 - R1 (IAS 34), which is applicable to the preparation of interim financial information, and in accordance with the accounting practices adopted in Brazil, including the standards issued by the Securities and Exchange Commission (CVM) applicable to Quarterly Information (ITR). (b) Individual financial information The individual financial statements of the Company have been prepared in accordance with CPC 21(R1), applicable to the preparation of interim financial information, and in a manner consistent with the standards issued by the CVM applicable to ITR, and are disclosed in conjunction with the consolidated financial statements. In the individual financial statements, subsidiaries are accounted for using the equity method. The same adjustments are made in the financial statements as in the consolidated financial statements to achieve the same results for the equity attributable to the shareholders of the parent company. In TOTVS's case, the accounting practices adopted in Brazil applicable to individual financial statements differ from the IFRS applicable to separate financial statements, because the measurement of investments in subsidiaries, jointly controlled entities and associates is carried out using the equity method, while under IFRS this is done at cost or fair value. (c) Changes in accounting policies and disclosure requirements There are no new pronouncements or interpretations of CPCs / IFRS effective from 2014 that could have a significant impact on the Company's interim financial information. On Mayo 28, 2014, the IASB issued IFRS 15 - Revenue from contract customers that is a result of a project between the IASB and FASB to converge standard about revenue recognition and disclosure applied to contract with customers. This standard provides two approaches to revenue recognition at a point in time or over time and its analysis is based on five steps that must be used to determine the value and the time when revenue should be recognized. The standard is effective from January 1, 2017, with early adoption is permited under IFRS, but it has not be implemented by CPC. The Company is analyzing the possible impacts of the application of this standard and will inform the market of any impact in due course.
2.2. Consolidated interim financial information The consolidated interim financial information includes the Company’s operations and those of the following subsidiaries, for which the percentage interests held by the Company on its balance sheet are as shown below:
(A free translation of the original in Portuguese)
28
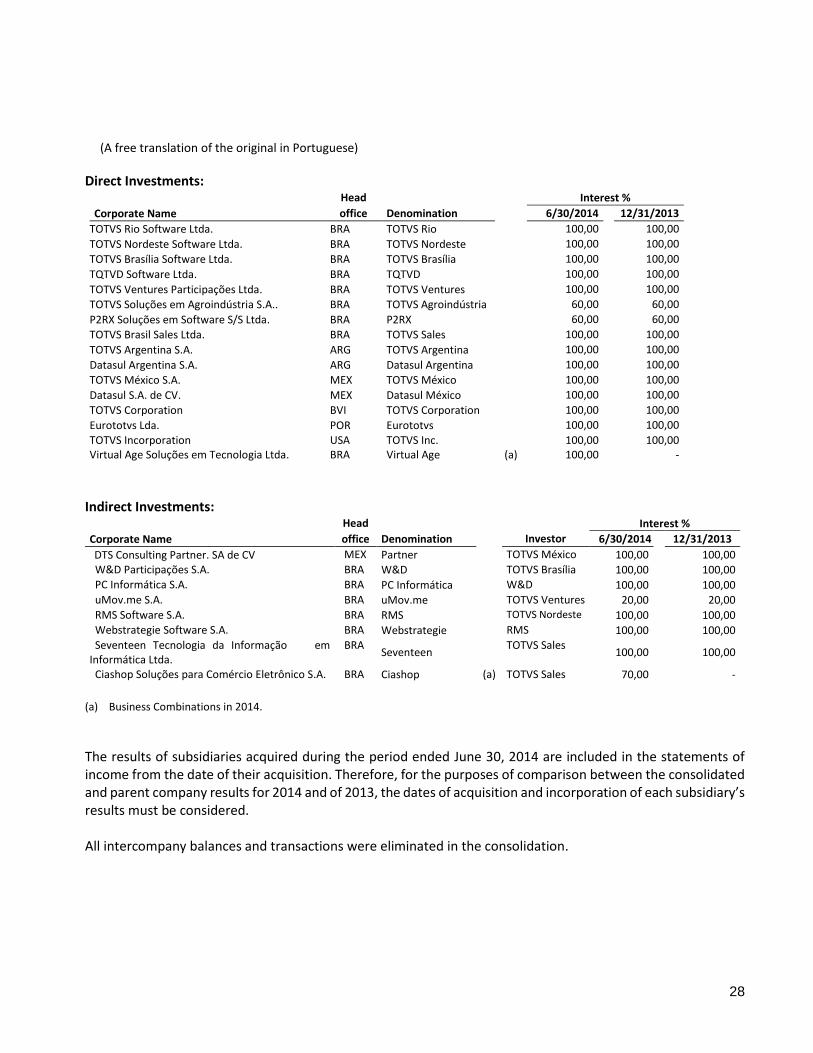
Direct Investments: Head Interest %
Corporate Name office Denomination 6/30/2014 12/31/2013
TOTVS Rio Software Ltda. BRA TOTVS Rio 100,00 100,00
TOTVS Nordeste Software Ltda. BRA TOTVS Nordeste 100,00 100,00 TOTVS Brasília Software Ltda. BRA TOTVS Brasília 100,00 100,00 TQTVD Software Ltda. BRA TQTVD 100,00 100,00 TOTVS Ventures Participações Ltda. BRA TOTVS Ventures 100,00 100,00 TOTVS Soluções em Agroindústria S.A.. BRA TOTVS Agroindústria 60,00 60,00
P2RX Soluções em Software S/S Ltda. BRA P2RX 60,00 60,00
TOTVS Brasil Sales Ltda. BRA TOTVS Sales 100,00 100,00 TOTVS Argentina S.A. ARG TOTVS Argentina 100,00 100,00 Datasul Argentina S.A. ARG Datasul Argentina 100,00 100,00 TOTVS México S.A. MEX TOTVS México 100,00 100,00 Datasul S.A. de CV. MEX Datasul México 100,00 100,00 TOTVS Corporation BVI TOTVS Corporation 100,00 100,00 Eurototvs Lda. POR Eurototvs 100,00 100,00 TOTVS Incorporation USA TOTVS Inc. 100,00 100,00 Virtual Age Soluções em Tecnologia Ltda. BRA Virtual Age (a) 100,00 -
Indirect Investments: Head Interest %
Corporate Name office Denomination Investor 6/30/2014 12/31/2013
DTS Consulting Partner. SA de CV MEX Partner TOTVS México 100,00 100,00 W&D Participações S.A. BRA W&D TOTVS Brasília 100,00 100,00 PC Informática S.A. BRA PC Informática W&D 100,00 100,00 uMov.me S.A. BRA uMov.me TOTVS Ventures 20,00 20,00 RMS Software S.A. BRA RMS TOTVS Nordeste 100,00 100,00 Webstrategie Software S.A. BRA Webstrategie RMS 100,00 100,00 Seventeen Tecnologia da Informação em Informática Ltda.
BRA Seventeen
TOTVS Sales 100,00 100,00
Ciashop Soluções para Comércio Eletrônico S.A. BRA Ciashop (a) TOTVS Sales 70,00 -
(a) Business Combinations in 2014.
The results of subsidiaries acquired during the period ended June 30, 2014 are included in the statements of income from the date of their acquisition. Therefore, for the purposes of comparison between the consolidated and parent company results for 2014 and of 2013, the dates of acquisition and incorporation of each subsidiary’s results must be considered. All intercompany balances and transactions were eliminated in the consolidation.

(A free translation of the original in Portuguese)
29
2.3. Critical accounting estimates and assumptions
Accounting estimates and assumptions are continually assessed, and are based on historical experience and other factors, including expected future events which are considered to be relevant. Accounting estimates will rarely be equal to the actual results. For the period ended June 30, 2014, no changes in estimates and assumptions entailing a significant risk of causing relevant adjustments to the book values of assets and liabilities for the following fiscal year were recognized in addition to those detailed in Note 2.25 to the latest annual financial statements.
3. Business combinations The acquisitions made in 2014 are in line with the Company's strategy of specialization and consolidation of its positions in different segments, in addition to bringing new solutions to TOTVS´s customers through portfolio diversification, offering tailored solutions for specific niches.
3.1. Business combinations
CIASHOP – Soluções para Comércio Eletrônico S.A. On December 2, 2013, the Company acquired, through its subsidiary TOTVS Sales, 68.5% of the capital of Ciashop Soluções para Comércio Eletrônico S,A, (“Ciashop”) for R$16,440, which is a pioneer in e-commerce in Brazil, offering a cloud platform that delivers it solutions in form of software as a service (SaaS). In addition to the acquisition of shares representing 68.5% of the total shares, TOTVS invested over R$1,200 in the acquisition of new shares issued by Ciashop, bringing its total participation to 70%. This Agreement also includes a variable payment of up to R$2,000, based on the achievement of certain parameters established for CIASHOP over 30 months after the closure of this business. On January 5, 2014, the acquisition of the capital of Ciashop was approved without restrictions by Brazilian Administrative Council for Economic Defense (CADE - Conselho Administrativo de Defesa Econômica) the acquisition of the capital of Ciashop, concluding the suspensive conditions in the Agreement. Virtual Age Soluções em Tecnologia Ltda. On May 21, 2014, the Company acquired 100% of the capital of Virtual Age Soluções em Tecnologia Ltda. (“Virtual Age”) for R$50,105. This Company is focused on the development of cloud-base software solutions for the Fashion and Apparel Value Chain. The agreement also establishes the payment of a variable amount that can reach up to R$25,000, which shall be paid in accordance with metrics defined in the Agreement up to the last day of December, 2016.
(A free translation of the original in Portuguese)
30
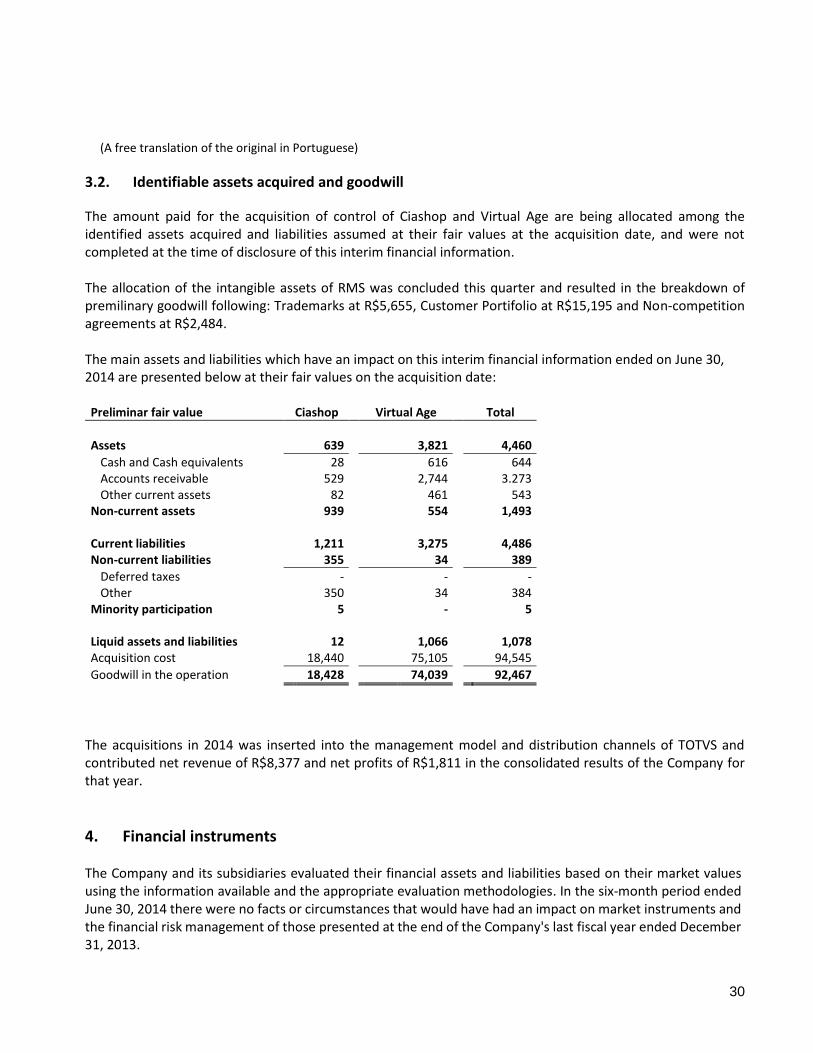
3.2. Identifiable assets acquired and goodwill
The amount paid for the acquisition of control of Ciashop and Virtual Age are being allocated among the identified assets acquired and liabilities assumed at their fair values at the acquisition date, and were not completed at the time of disclosure of this interim financial information. The allocation of the intangible assets of RMS was concluded this quarter and resulted in the breakdown of premilinary goodwill following: Trademarks at R$5,655, Customer Portifolio at R$15,195 and Non-competition agreements at R$2,484. The main assets and liabilities which have an impact on this interim financial information ended on June 30, 2014 are presented below at their fair values on the acquisition date:
The acquisitions in 2014 was inserted into the management model and distribution channels of TOTVS and contributed net revenue of R$8,377 and net profits of R$1,811 in the consolidated results of the Company for that year.
4. Financial instruments The Company and its subsidiaries evaluated their financial assets and liabilities based on their market values using the information available and the appropriate evaluation methodologies. In the six-month period ended June 30, 2014 there were no facts or circumstances that would have had an impact on market instruments and the financial risk management of those presented at the end of the Company's last fiscal year ended December 31, 2013.
Preliminar fair value Ciashop Virtual Age Total
Assets 639 3,821 4,460
Cash and Cash equivalents 28 616 644 Accounts receivable 529 2,744 3.273 Other current assets 82 461 543 Non-current assets 939 554 1,493 Current liabilities 1,211 3,275 4,486 Non-current liabilities 355 34 389
Deferred taxes - - - Other 350 34 384 Minority participation 5 - 5 Liquid assets and liabilities 12 1,066 1,078 Acquisition cost 18,440 75,105 94,545
Goodwill in the operation 18,428 74,039 92,467
(A free translation of the original in Portuguese)
31
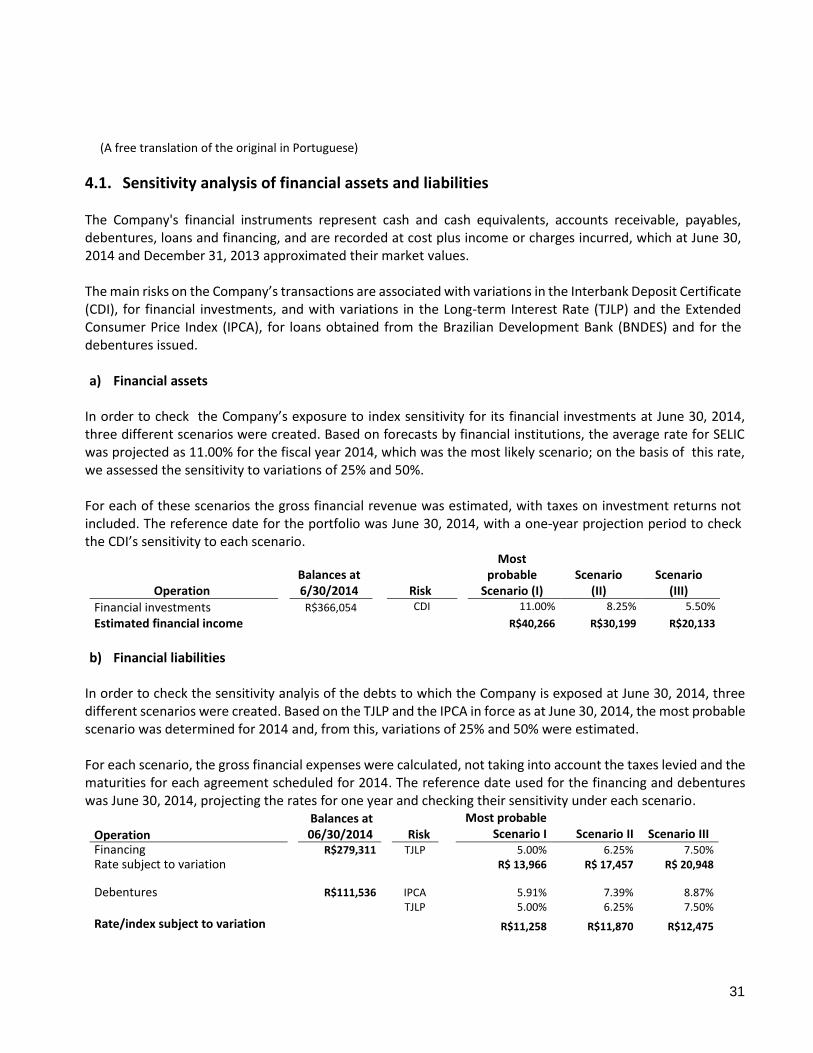
4.1. Sensitivity analysis of financial assets and liabilities The Company's financial instruments represent cash and cash equivalents, accounts receivable, payables, debentures, loans and financing, and are recorded at cost plus income or charges incurred, which at June 30, 2014 and December 31, 2013 approximated their market values. The main risks on the Company’s transactions are associated with variations in the Interbank Deposit Certificate (CDI), for financial investments, and with variations in the Long-term Interest Rate (TJLP) and the Extended Consumer Price Index (IPCA), for loans obtained from the Brazilian Development Bank (BNDES) and for the debentures issued. a) Financial assets
In order to check the Company’s exposure to index sensitivity for its financial investments at June 30, 2014, three different scenarios were created. Based on forecasts by financial institutions, the average rate for SELIC was projected as 11.00% for the fiscal year 2014, which was the most likely scenario; on the basis of this rate, we assessed the sensitivity to variations of 25% and 50%. For each of these scenarios the gross financial revenue was estimated, with taxes on investment returns not included. The reference date for the portfolio was June 30, 2014, with a one-year projection period to check the CDI’s sensitivity to each scenario.
Operation Balances at 6/30/2014 Risk
Most probable
Scenario (I) Scenario
(II) Scenario
(III)
Financial investments R$366,054 CDI 11.00% 8.25% 5.50%
Estimated financial income R$40,266 R$30,199 R$20,133
b) Financial liabilities
In order to check the sensitivity analyis of the debts to which the Company is exposed at June 30, 2014, three different scenarios were created. Based on the TJLP and the IPCA in force as at June 30, 2014, the most probable scenario was determined for 2014 and, from this, variations of 25% and 50% were estimated. For each scenario, the gross financial expenses were calculated, not taking into account the taxes levied and the maturities for each agreement scheduled for 2014. The reference date used for the financing and debentures was June 30, 2014, projecting the rates for one year and checking their sensitivity under each scenario.
Operation
Balances at 06/30/2014 Risk
Most probable Scenario I Scenario II Scenario III
Financing R$279,311 TJLP 5.00% 6.25% 7.50% Rate subject to variation R$ 13,966 R$ 17,457 R$ 20,948 Debentures R$111,536 IPCA 5.91% 7.39% 8.87% TJLP 5.00% 6.25% 7.50%
Rate/index subject to variation R$11,258 R$11,870 R$12,475
(A free translation of the original in Portuguese)
32
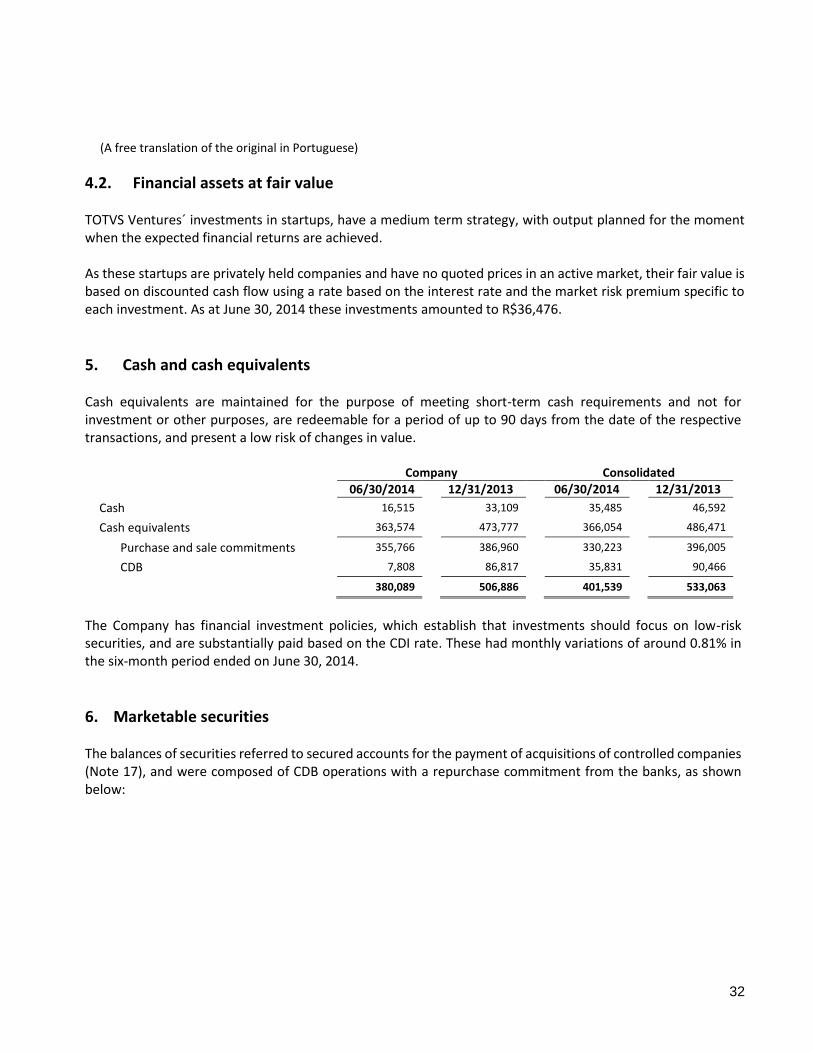
4.2. Financial assets at fair value TOTVS Ventures´ investments in startups, have a medium term strategy, with output planned for the moment when the expected financial returns are achieved. As these startups are privately held companies and have no quoted prices in an active market, their fair value is based on discounted cash flow using a rate based on the interest rate and the market risk premium specific to each investment. As at June 30, 2014 these investments amounted to R$36,476.
5. Cash and cash equivalents Cash equivalents are maintained for the purpose of meeting short-term cash requirements and not for investment or other purposes, are redeemable for a period of up to 90 days from the date of the respective transactions, and present a low risk of changes in value.
Company Consolidated
06/30/2014 12/31/2013 06/30/2014 12/31/2013
Cash 16,515 33,109 35,485 46,592
Cash equivalents 363,574 473,777 366,054 486,471
Purchase and sale commitments 355,766 386,960 330,223 396,005
CDB 7,808 86,817 35,831 90,466
380,089 506,886 401,539 533,063
The Company has financial investment policies, which establish that investments should focus on low-risk securities, and are substantially paid based on the CDI rate. These had monthly variations of around 0.81% in the six-month period ended on June 30, 2014.
6. Marketable securities
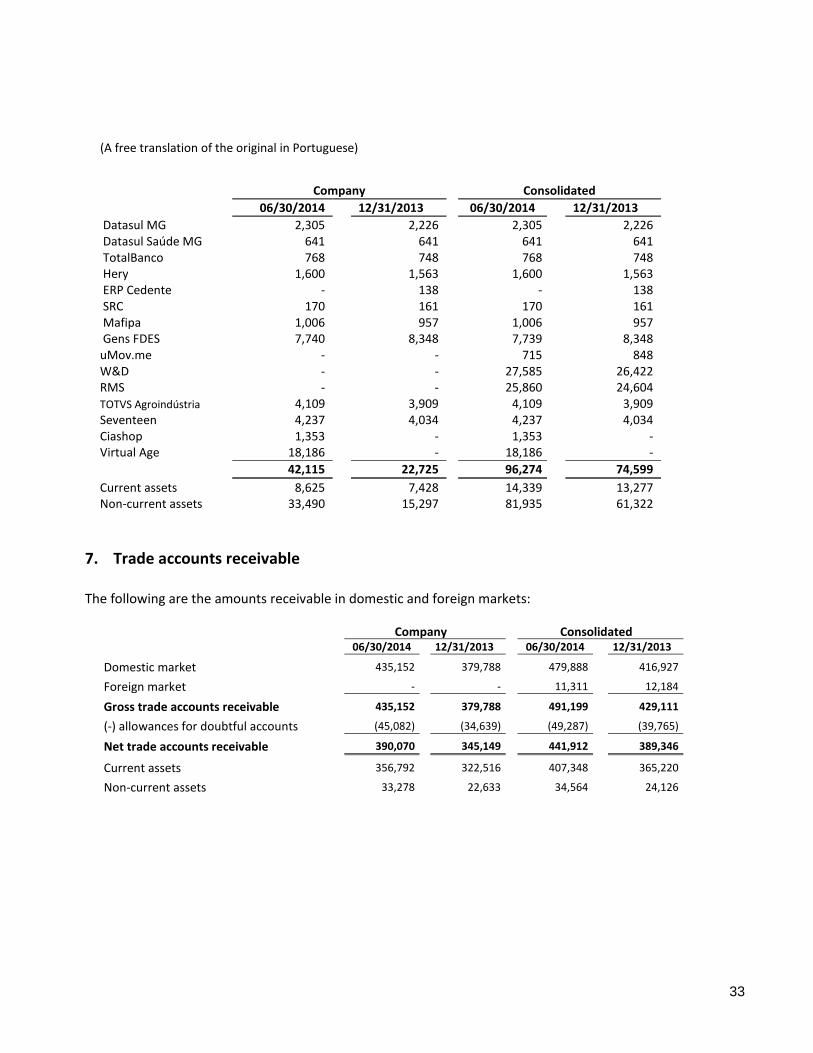
The balances of securities referred to secured accounts for the payment of acquisitions of controlled companies (Note 17), and were composed of CDB operations with a repurchase commitment from the banks, as shown below:
(A free translation of the original in Portuguese)
33
Company Consolidated
06/30/2014 12/31/2013 06/30/2014 12/31/2013
Datasul MG 2,305 2,226 2,305 2,226 Datasul Saúde MG 641 641 641 641 TotalBanco 768 748 768 748 Hery 1,600 1,563 1,600 1,563 ERP Cedente - 138 - 138 SRC 170 161 170 161 Mafipa 1,006 957 1,006 957 Gens FDES 7,740 8,348 7,739 8,348 uMov.me - - 715 848 W&D - - 27,585 26,422 RMS - - 25,860 24,604
TOTVS Agroindústria 4,109 3,909 4,109 3,909 Seventeen 4,237 4,034 4,237 4,034 Ciashop 1,353 - 1,353 - Virtual Age 18,186 - 18,186 -
42,115 22,725 96,274 74,599
Current assets 8,625 7,428 14,339 13,277 Non-current assets 33,490 15,297 81,935 61,322
7. Trade accounts receivable
The following are the amounts receivable in domestic and foreign markets:
Company Consolidated 06/30/2014 12/31/2013 06/30/2014 12/31/2013
Domestic market 435,152 379,788 479,888 416,927
Foreign market - - 11,311 12,184
Gross trade accounts receivable 435,152 379,788 491,199 429,111
(-) allowances for doubtful accounts (45,082) (34,639) (49,287) (39,765)
Net trade accounts receivable 390,070 345,149 441,912 389,346
Current assets 356,792 322,516 407,348 365,220
Non-current assets 33,278 22,633 34,564 24,126

(A free translation of the original in Portuguese)
34
Below are the net receivables in connection with the allowance for doubtful accounts by aging, as at June 30, 2014 and December 31, 2013:
Company Consolidated
06/30/2014 12/31/2013 06/30/2014 12/31/2013
Falling due 354,067 309,051 391,469 345,195
Overdue
1 to 30 days 15,471 20,376 22,720 23,057
31 to 60 days 6,946 6,505 10,379 7,595
61 to 90 days 5,755 4,404 8,210 5,130
91 to 180 days 7,831 4,813 8,406 5,857
181 to 360 days - - 561 1,153
More than 360 days - - 167 1,359
390,070 345,149 441,912 389,346
Changes in the allowances for doubtful accounts are as follow:
06/30/2014
Company Consolidated
Balance at the beginning of the year 34,639 39,765 Additional provision during the period 13,114 14,824 Written off from the provision (2,671) (5,302)
Balance as at June 30 45,082 49,287
Management believes that the risk related to the trade accounts receivable is minimized by the fact that the Company’s customer portfolio is highly diversified. The Company does not require any guarantees on sales in installments.
8. Taxes recoverable The following are the amounts of taxes recoverable:
Company Consolidated 06/30/2014 12/31/2013 06/30/2014 12/31/2013 Recoverable taxes
Withholding income tax - 1,740 2,390 3,666
Withholding social contribution tax - 631 1,041 1,799
Withholding PIS and COFINS taxes - - 387 303
Other - (895) 2,197 1,866
- 1,476 6,015 7,634
(A free translation of the original in Portuguese)
35
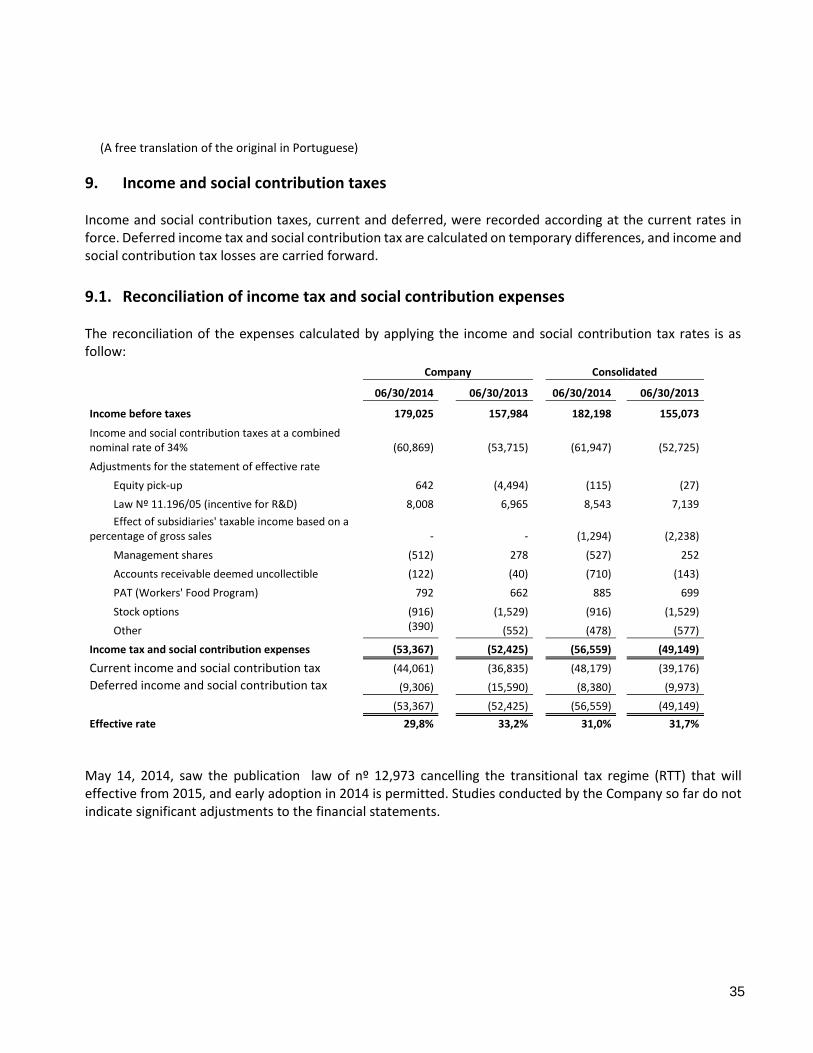
9. Income and social contribution taxes Income and social contribution taxes, current and deferred, were recorded according at the current rates in force. Deferred income tax and social contribution tax are calculated on temporary differences, and income and social contribution tax losses are carried forward.
9.1. Reconciliation of income tax and social contribution expenses The reconciliation of the expenses calculated by applying the income and social contribution tax rates is as follow:
Company Consolidated
06/30/2014 06/30/2013 06/30/2014 06/30/2013
Income before taxes 179,025 157,984 182,198 155,073
Income and social contribution taxes at a combined nominal rate of 34% (60,869) (53,715) (61,947) (52,725)
Adjustments for the statement of effective rate
Equity pick-up 642 (4,494) (115) (27)
Law Nº 11.196/05 (incentive for R&D) 8,008 6,965 8,543 7,139
Effect of subsidiaries' taxable income based on a percentage of gross sales - - (1,294) (2,238)
Management shares (512) 278 (527) 252
Accounts receivable deemed uncollectible (122) (40) (710) (143)
PAT (Workers' Food Program) 792 662 885 699
Stock options (916) (1,529) (916) (1,529)
Other (390)
(552) (478) (577)
Income tax and social contribution expenses (53,367) (52,425) (56,559) (49,149)
Current income and social contribution tax (44,061) (36,835) (48,179) (39,176)
Deferred income and social contribution tax (9,306) (15,590) (8,380) (9,973)
(53,367) (52,425) (56,559) (49,149)
Effective rate 29,8% 33,2% 31,0% 31,7%
May 14, 2014, saw the publication law of nº 12,973 cancelling the transitional tax regime (RTT) that will effective from 2015, and early adoption in 2014 is permitted. Studies conducted by the Company so far do not indicate significant adjustments to the financial statements.

(A free translation of the original in Portuguese)
36
9.2. Breakdown of deferred income and social contribution taxes
Company Consolidated
06/30/2014 12/31/2013 06/30/2014 12/31/2013
Deriving from temporary differences
Intangible asset allocation 109,701 99,040 115,192 102,509
Provision for commission 20,254 19,794 20,956 20,207
Anticipated income or revenue (10,675) 2,383 (10,003) 5,476
Allowance for doubtful accounts 15,328 11,777 16,324 13,061
Provision for contingencies and other liabilities 2,910 2,442 2,910 2,442
Tax losses and social contribution tax losses carried forward - - 25,002 14,849
Provision for premiums due to non-conversion of debentures 9,623 8,393 9,623 8,393
Present value adjustments 2,252 2,247 2,252 2,247
Other 8,405 7,754 (7,961) 8,754
Total deferred income and social contribution tax assets 157,798 153,830 174,295 177,938
LIABILITIES
Deriving from temporary differences
Goodwill in a business combination 139,433 127,492 140,425 128,265
Other 411 875 411 966
Total deferred income and social contribution tax liabilities 139,844 128,367 140,836 129,231
Net deferred income and social contribution tax 17,954 25,463 33,459 48,707
The Company is presenting deferred income tax on a net basis in non-current assets.
Changes in deferred income and social contribution tax are presented below:
Company Consolidated
As at January 1 25,463 48,707
Expenses in the income statement (9,306) (8,380)
Tax related to other comprehensive income (
1,797 1,797
Business combination - (7,934)
Other - (731)
As at June 30 17,954 33,459
10. Related parties Transactions with related parties are carried out under market conditions and prices established by the parties, and balances between the parent company and subsidiaries are eliminated for consolidation purposes.
(A free translation of the original in Portuguese)
37
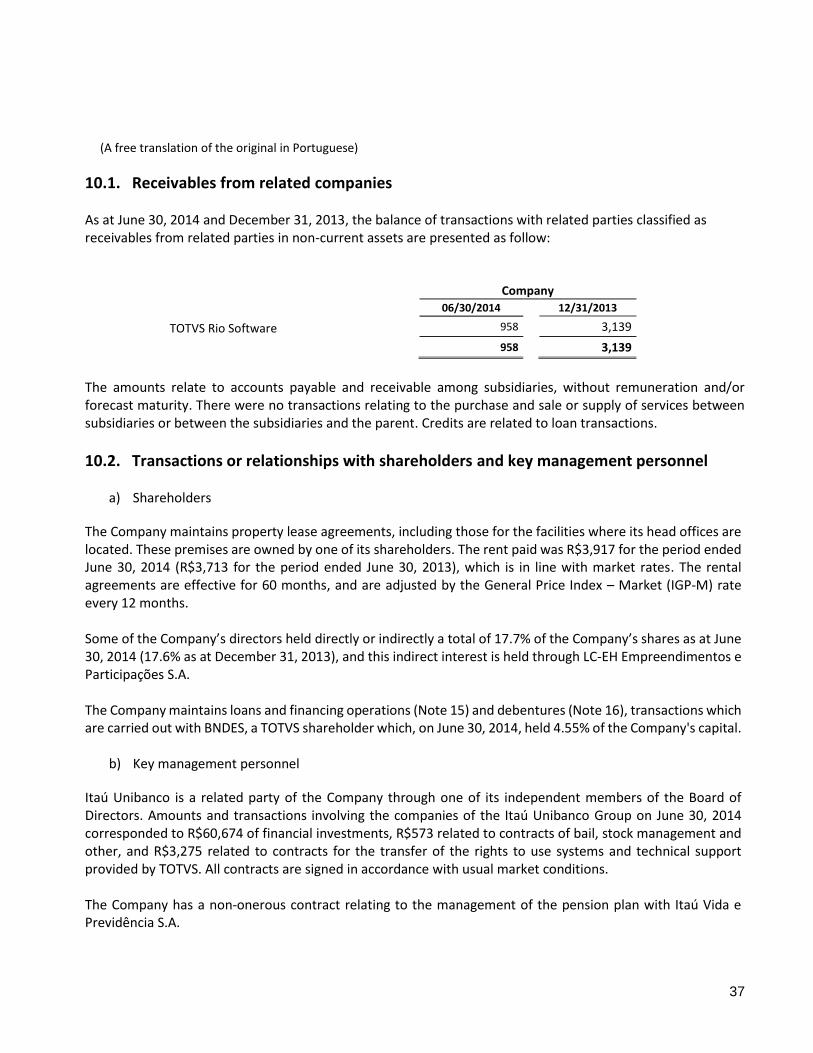
10.1. Receivables from related companies As at June 30, 2014 and December 31, 2013, the balance of transactions with related parties classified as receivables from related parties in non-current assets are presented as follow:
Company
06/30/2014 12/31/2013
TOTVS Rio Software 958 3,139
958 3,139
The amounts relate to accounts payable and receivable among subsidiaries, without remuneration and/or forecast maturity. There were no transactions relating to the purchase and sale or supply of services between subsidiaries or between the subsidiaries and the parent. Credits are related to loan transactions.
10.2. Transactions or relationships with shareholders and key management personnel
a) Shareholders
The Company maintains property lease agreements, including those for the facilities where its head offices are located. These premises are owned by one of its shareholders. The rent paid was R$3,917 for the period ended June 30, 2014 (R$3,713 for the period ended June 30, 2013), which is in line with market rates. The rental agreements are effective for 60 months, and are adjusted by the General Price Index – Market (IGP-M) rate every 12 months. Some of the Company’s directors held directly or indirectly a total of 17.7% of the Company’s shares as at June 30, 2014 (17.6% as at December 31, 2013), and this indirect interest is held through LC-EH Empreendimentos e Participações S.A. The Company maintains loans and financing operations (Note 15) and debentures (Note 16), transactions which are carried out with BNDES, a TOTVS shareholder which, on June 30, 2014, held 4.55% of the Company's capital.
b) Key management personnel
Itaú Unibanco is a related party of the Company through one of its independent members of the Board of Directors. Amounts and transactions involving the companies of the Itaú Unibanco Group on June 30, 2014 corresponded to R$60,674 of financial investments, R$573 related to contracts of bail, stock management and other, and R$3,275 related to contracts for the transfer of the rights to use systems and technical support provided by TOTVS. All contracts are signed in accordance with usual market conditions. The Company has a non-onerous contract relating to the management of the pension plan with Itaú Vida e Previdência S.A.

(A free translation of the original in Portuguese)
38
10.3. Management fees Expenses related to the compensation of the senior executives and management of the Company and its subsidiaries are summarized below:
Company Consolidated
06/30/2014 06/30/2013 06/30/2014 06/30/2013
Short-term benefits to employees Salaries, fees and payroll charges 6,988 7,882 9,862 9,713
Private pension plan 209 222 209 222
Variable bonuses 1,507 (818) 1,552 (741)
8,704 7,286 11,623 9,194
Share-based payments 2,694 4,497 2,694 4,497
11,398 11,783 14,317 13,691
11. Investments The breakdown of investments in subsidiaries is shown below:
Summarized financial statements of affiliate companies, subsidiaries and associates
as at June 30, 2014
Equity pick-up (parent company) for periods
ended:
Balance of investments as at:
Assets Liabilities Equity Gross
revenue P&L for the
year 06/30/2014 06/30/2013 06/30/2014 12/31/2013
TOTVS Rio 21,540 1,944 19,596 13,976 3,865 3,865 (5,379) 19,597 15,732 TOTVS Argentina 9,200 3,323 5,877 8,606 (303) (303) (1,652) 5,876 7,100 TOTVS México 10,125 7,863 2,262 8,829 (1,651) (1,651) (2,363) 2,263 987 TOTVS Nordeste 100,194 32,070 68,124 4,615 (1,959) (1,959) (675) 68,124 67,043
TOTVS Brasília 131,671 21,604 110,067 5,053 1,388 1,388 (310) 110,067 92,129
Eurototvs 296 - 296 - (31) (31) (16) 296 348
TQTVD 19,007 1,745 17,262 10,089 2,494 2,494 (423) 17,262 20,938
Datasul México - - - - - - 1,075 - -
TOTVS Inc. 42,496 196 42,300 - (3,076) (3,076) (3,972) 42,300 41,973
Datasul Argentina 392 9 383 27 26 26 28 383 508
TOTVS Agroindústria 6,069 1,600 4,469 9,281 182 109 648 2,681 3,075
P2RX 1,047 566 481 2,327 63 38 (100) 289 251
TOTVS Sales 37,328 12,235 25,093 - (748) (748) - 25,093 8,332
TOTVS Ventures 8,703 715 7,988 - (336) (336) (79) 7,989 7,504
Virtual Age 5,551 2,411 3,140 6,219 2,074 2,074 - 77,179 -
1,890 (13,218) 379,399 265,920

(A free translation of the original in Portuguese)
39
The changes in the investment accounts for the period ended June 30, 2014 were as follow:
12/31/2013 Goodwill Additions Equity
Foreign exchange Dividends 06/30/2014
TOTVS Rio 15,732 - - 3,865 - - 19,597
TOTVS Nordeste 67,043 - 3,040 (1,959) - - 68,124
TOTVS Brasília 92,129 - 16,550 1,388 - - 110,067
TQTVD 20,938 - (6,170) 2,494 - - 17,262
TOTVS Argentina 7,100 - 1,409 (303) (2,330) - 5,876
TOTVS México 987 - 3,077 (1,651) (150) - 2,263
TOTVS Inc. 41,974 - 6,040 (3,076) (2,637) - 42,300
EuroTotvs 348 - - (31) (21) - 296
Datasul Argentina 508 - - 26 (151) - 383
TOTVS Ventures 7,504 - 821 (336) - - 7,989
Virtual Age - 74,039 1,066 2,074 - - 77,179
TOTVS Sales 8,332 - 17,509 (748) - - 25,093
TOTVS Agroindústria 3,075 - - 109 - (503) 2,681
P2RX 251 - - 38 - - 289
Net investments 265,921 74,039 43,342 1,890 (5,289) (503) 379,399

(A free translation of the original in Portuguese)
40
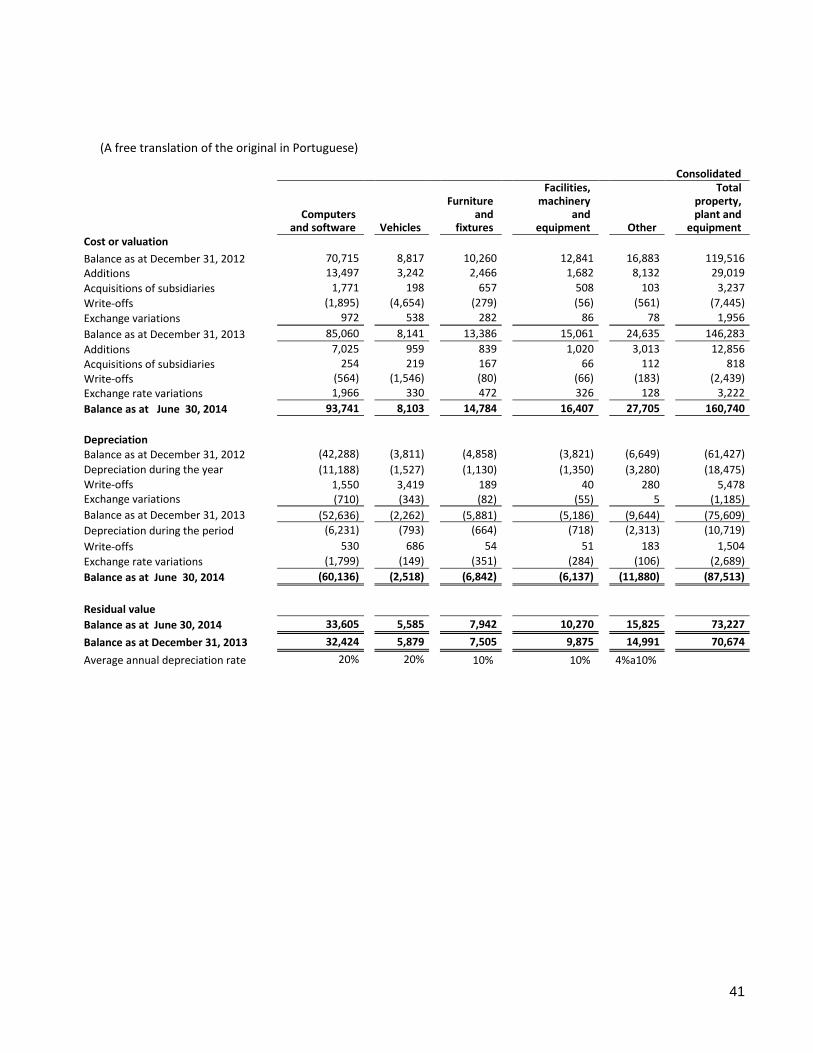
12. Property, plant and equipment A breakdown of the Company’s property, plant and equipment is shown below:
Company
Computers
and software Vehicles
Furniture and
fixtures
Facilities, machinery and
equipment Other
Total property, plant and
equipment
Cost or valuation
Balance as at December 31, 2012 66,269 8,070 9,121 12,503 15,807 111,770
Additions 12,041 2,618 1,997 1,243 5,993 23,892
Write-offs (1,831) (4,036) (97) (51) (222) (6,237)
Balances as at December 31, 2013 76,479 6,652 11,021 13,695 21,578 129,425
Additions 5,745 873 528 786 2,484 10,416
Transfers - - - 1 - 1
Write-offs (459) (1,177) - - - (1,636)
Balance as at June 30, 2014 81,765 6,348 11,549 14,482 24,062 138,206
Depreciation Balance as at December 31, 2012 (39,877) (3,551) (4,303) (3,678) (6,400) (57,809) Depreciation during the period (9,691) (1,299) (880) (1,224) (2,812) (15,906) Write-offs 1,484 3,025 72 39 63 4,683
Balance as at December 31, 2013 (48,084) (1,825) (5,111) (4,863) (9,149) (69,032)
Depreciation during the period (5,258) (634) (504) (633) (1,766) (8,795)
Transfers - - - - (1) (1)
Write-offs 426 520 - - - 946
Balance as at June 30, 2014 (52,916) (1,939) (5,615) (5,496) (10,916) (76,882)
Residual value
Balance as at June 30, 2014 28,849 4,409 5,934 8,986 13,146 61,324
Balance as at December 31, 2013 28,395 4,827 5,910 8,832 12,429 60,393
Average annual depreciation rate 20% 20% 10% 10% 4%a10%
(A free translation of the original in Portuguese)
41
Consolidated
Computers and software Vehicles
Furniture and
fixtures
Facilities, machinery
and equipment Other
Total property, plant and
equipment Cost or valuation
Balance as at December 31, 2012 70,715 8,817 10,260 12,841 16,883 119,516
Additions 13,497 3,242 2,466 1,682 8,132 29,019
Acquisitions of subsidiaries 1,771 198 657 508 103 3,237
Write-offs (1,895) (4,654) (279) (56) (561) (7,445)
Exchange variations 972 538 282 86 78 1,956
Balance as at December 31, 2013 85,060 8,141 13,386 15,061 24,635 146,283
Additions 7,025 959 839 1,020 3,013 12,856
Acquisitions of subsidiaries 254 219 167 66 112 818
Write-offs (564) (1,546) (80) (66) (183) (2,439)
Exchange rate variations 1,966 330 472 326 128 3,222
Balance as at June 30, 2014 93,741 8,103 14,784 16,407 27,705 160,740
Depreciation
Balance as at December 31, 2012 (42,288) (3,811) (4,858) (3,821) (6,649) (61,427)
Depreciation during the year (11,188) (1,527) (1,130) (1,350) (3,280) (18,475) Write-offs 1,550 3,419 189 40 280 5,478 Exchange variations (710) (343) (82) (55) 5 (1,185)
Balance as at December 31, 2013 (52,636) (2,262) (5,881) (5,186) (9,644) (75,609)
Depreciation during the period (6,231) (793) (664) (718) (2,313) (10,719)
Write-offs 530 686 54 51 183 1,504
Exchange rate variations (1,799) (149) (351) (284) (106) (2,689)
Balance as at June 30, 2014 (60,136) (2,518) (6,842) (6,137) (11,880) (87,513)
Residual value
Balance as at June 30, 2014 33,605 5,585 7,942 10,270 15,825 73,227
Balance as at December 31, 2013 32,424 5,879 7,505 9,875 14,991 70,674
Average annual depreciation rate 20% 20% 10% 10% 4%a10%

(A free translation of the original in Portuguese)
42
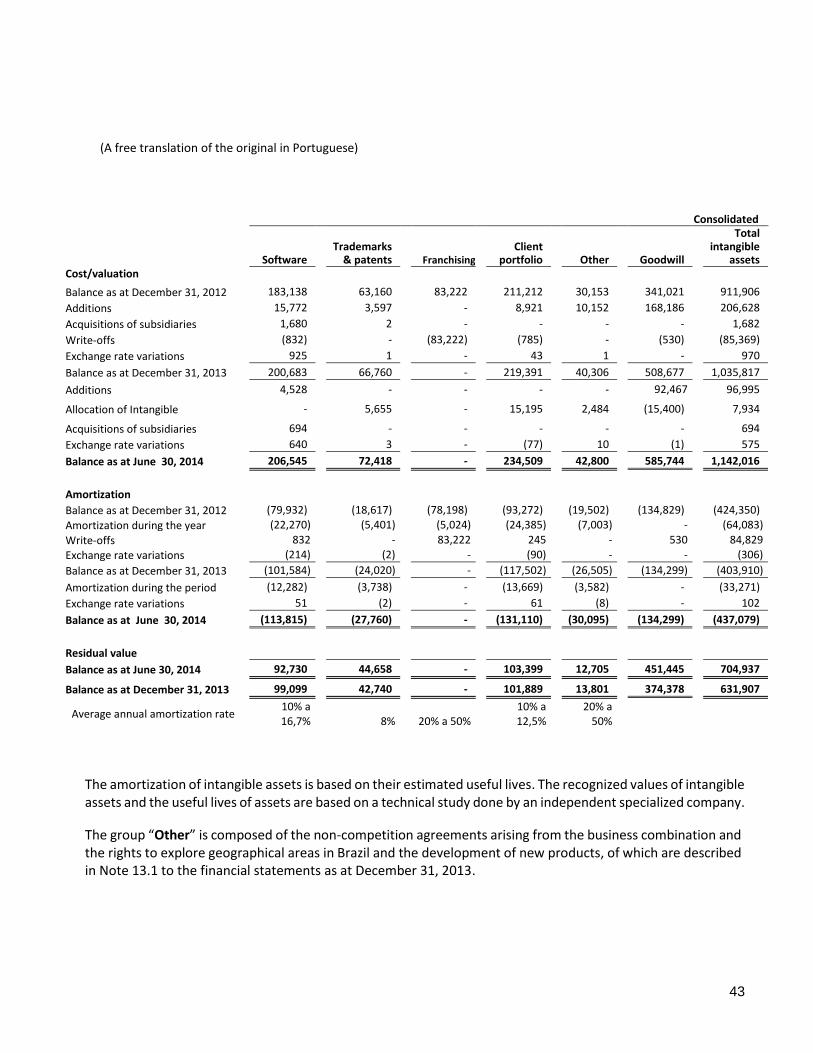
13. Intangible assets Intangible assets and changes in the group’s balances are as follow:
Company
Software Trademarks
& patents Franchising Client
portfolio Other Goodwill
Total intangible
assets Cost/valuation
Balance as at December 31, 2012 181,932 63,149 83,222 204,316 14,928 339,435 886,982
Additions 7,980 - - 3,270 152 14,291 25,693
Write-offs (832) - (83,222) - - - (84,054)
Balance as at December 31, 2013 189,080 63,149 - 207,586 15,080 353,726 828,621
Additions 4,769 - - - - - 4,769
Write-offs - - - - - - -
Balance as at June 30,2014 193,849 63,149 - 207,586 15,080 353,726 833,390
Amortization
Balance as at December 31, 2012 (78,770) (18,617) (78,198) (90,547) (9,609) (134,214) (409,955)
Amortization in the year (20,309) (4,201) (5,024) (22,485) (1,999) - (54,018)
Write-offs 832 - 83,222 1 - - 84,055
Balance as at December 31, 2013 (98,247) (22,818) - (113,031) (11,608) (134,214) (379,918)
Amortization during the period (11,129) (2,101) - (11,569) (798) - (25,597)
Transfers - - - (1) 1 - -
Balance as at June 30,2014 (109,376) (24,919) - (124,601) (12,405) (134,214) (405,515)
Residual value
Balance as at June 30, 2014 84,473 38,230 - 82,985 2,675 219,512 427,875
Balance as at December 31, 2013 90,833 40,331 - 94,555 3,472 219,512 448,703
Average annual amortization rates 10% to 16,7% 8%
20% to 50%
10% to 12,5%
20% to 50%
(A free translation of the original in Portuguese)
43
The amortization of intangible assets is based on their estimated useful lives. The recognized values of intangible assets and the useful lives of assets are based on a technical study done by an independent specialized company.
The group “Other” is composed of the non-competition agreements arising from the business combination and the rights to explore geographical areas in Brazil and the development of new products, of which are described in Note 13.1 to the financial statements as at December 31, 2013.
Consolidated
Software Trademarks
& patents Franchising Client
portfolio Other Goodwill
Total intangible
assets Cost/valuation
Balance as at December 31, 2012 183,138 63,160 83,222 211,212 30,153 341,021 911,906
Additions 15,772 3,597 - 8,921 10,152 168,186 206,628
Acquisitions of subsidiaries 1,680 2 - - - - 1,682
Write-offs (832) - (83,222) (785) - (530) (85,369)
Exchange rate variations 925 1 - 43 1 - 970
Balance as at December 31, 2013 200,683 66,760 - 219,391 40,306 508,677 1,035,817
Additions 4,528 - - - - 92,467 96,995
Allocation of Intangible - 5,655 - 15,195 2,484 (15,400) 7,934
Acquisitions of subsidiaries 694 - - - - - 694
Exchange rate variations 640 3 - (77) 10 (1) 575
Balance as at June 30, 2014 206,545 72,418 - 234,509 42,800 585,744 1,142,016
Amortization
Balance as at December 31, 2012 (79,932) (18,617) (78,198) (93,272) (19,502) (134,829) (424,350)
Amortization during the year (22,270) (5,401) (5,024) (24,385) (7,003) - (64,083)
Write-offs 832 - 83,222 245 - 530 84,829
Exchange rate variations (214) (2) - (90) - - (306)
Balance as at December 31, 2013 (101,584) (24,020) - (117,502) (26,505) (134,299) (403,910)
Amortization during the period (12,282) (3,738) - (13,669) (3,582) - (33,271)
Exchange rate variations 51 (2) - 61 (8) - 102
Balance as at June 30, 2014 (113,815) (27,760) - (131,110) (30,095) (134,299) (437,079)
Residual value
Balance as at June 30, 2014 92,730 44,658 - 103,399 12,705 451,445 704,937
Balance as at December 31, 2013 99,099 42,740 - 101,889 13,801 374,378 631,907
Average annual amortization rate 10% a 16,7% 8% 20% a 50%
10% a 12,5%
20% a 50%
(A free translation of the original in Portuguese)
44
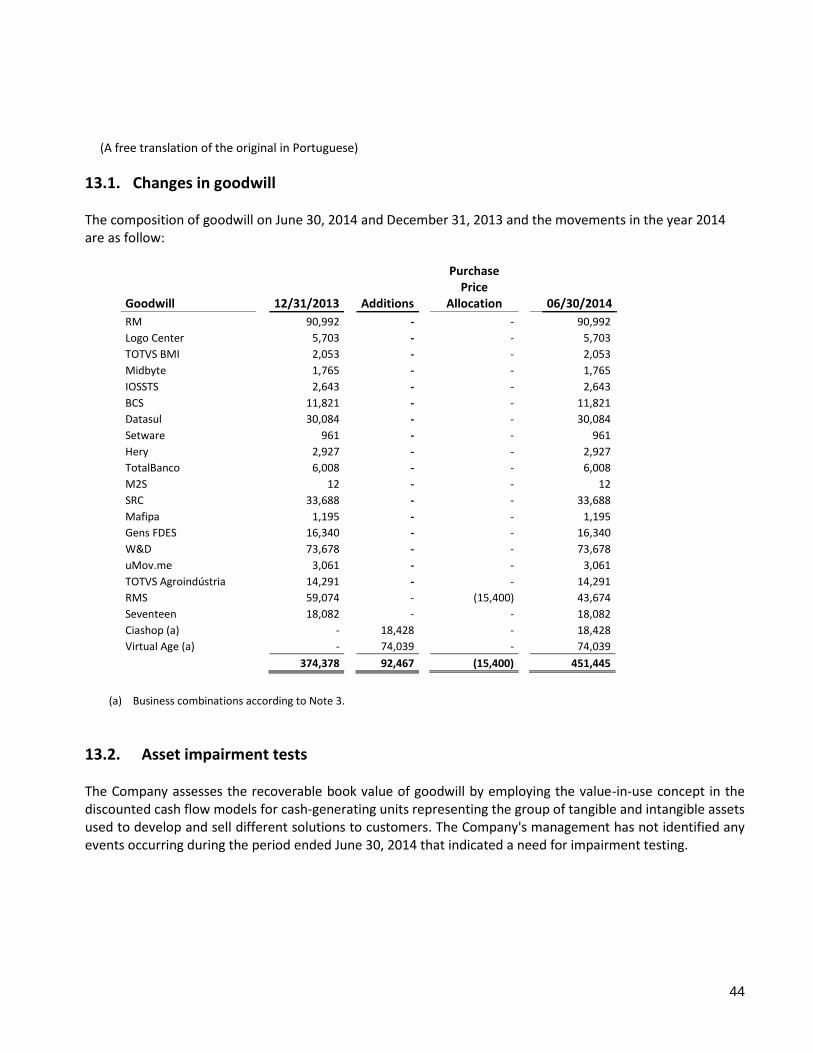
13.1. Changes in goodwill
The composition of goodwill on June 30, 2014 and December 31, 2013 and the movements in the year 2014 are as follow:
Goodwill 12/31/2013 Additions
Purchase Price
Allocation
06/30/2014
RM 90,992 - - 90,992
Logo Center 5,703 - - 5,703 TOTVS BMI 2,053 - - 2,053
Midbyte 1,765 - - 1,765
IOSSTS 2,643 - - 2,643
BCS 11,821 - - 11,821
Datasul 30,084 - - 30,084
Setware 961 - - 961
Hery 2,927 - - 2,927 TotalBanco 6,008 - - 6,008
M2S 12 - - 12
SRC 33,688 - - 33,688
Mafipa 1,195 - - 1,195
Gens FDES 16,340 - - 16,340
W&D 73,678 - - 73,678
uMov.me 3,061 - - 3,061
TOTVS Agroindústria 14,291 - - 14,291
RMS 59,074 - (15,400) 43,674
Seventeen 18,082 - - 18,082
Ciashop (a) - 18,428 - 18,428 Virtual Age (a) - 74,039 - 74,039
374,378 92,467 (15,400) 451,445
(a) Business combinations according to Note 3.
13.2. Asset impairment tests The Company assesses the recoverable book value of goodwill by employing the value-in-use concept in the discounted cash flow models for cash-generating units representing the group of tangible and intangible assets used to develop and sell different solutions to customers. The Company's management has not identified any events occurring during the period ended June 30, 2014 that indicated a need for impairment testing.
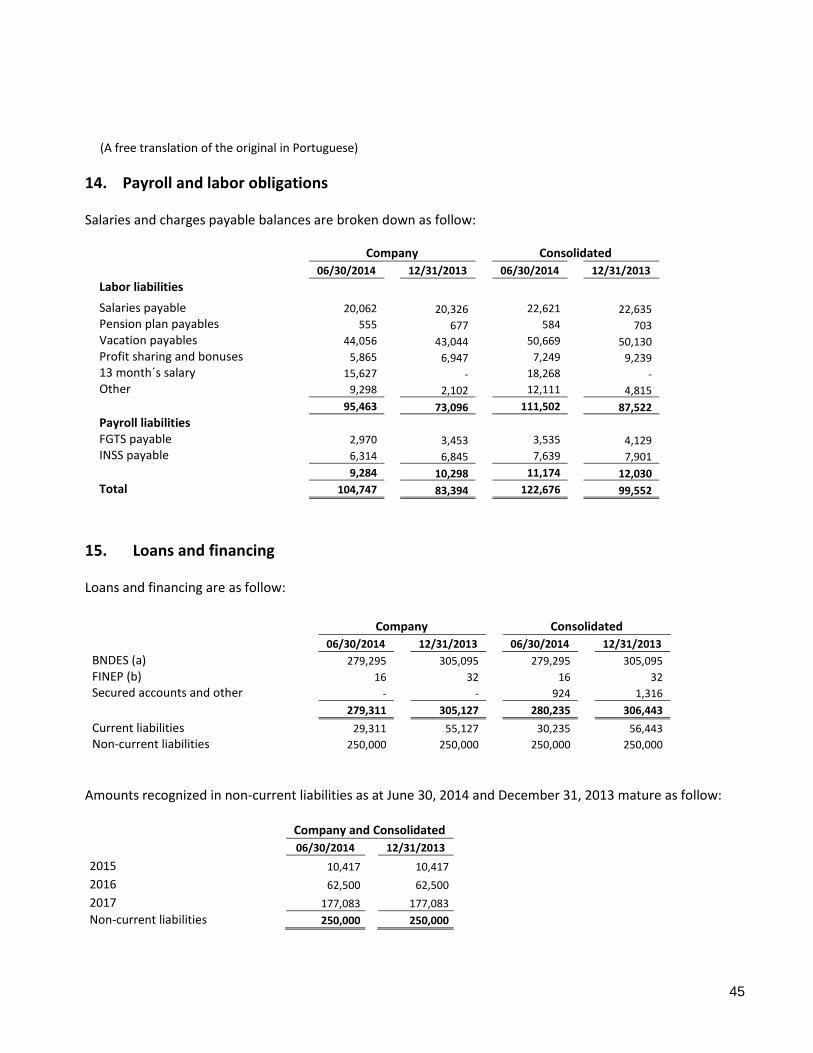
(A free translation of the original in Portuguese)
45
14. Payroll and labor obligations
Salaries and charges payable balances are broken down as follow:
Company Consolidated
06/30/2014 12/31/2013 06/30/2014 12/31/2013
Labor liabilities Salaries payable 20,062 20,326 22,621 22,635
Pension plan payables 555 677 584 703
Vacation payables 44,056 43,044 50,669 50,130
Profit sharing and bonuses 5,865 6,947 7,249 9,239
13 month´s salary 15,627 - 18,268 -
Other 9,298 2,102 12,111 4,815
95,463 73,096 111,502 87,522
Payroll liabilities
FGTS payable 2,970 3,453 3,535 4,129
INSS payable 6,314 6,845 7,639 7,901
9,284 10,298 11,174 12,030
Total 104,747 83,394 122,676 99,552
15. Loans and financing Loans and financing are as follow:
Company Consolidated
06/30/2014 12/31/2013 06/30/2014 12/31/2013
BNDES (a) 279,295 305,095 279,295 305,095
FINEP (b) 16 32 16 32
Secured accounts and other - - 924 1,316
279,311 305,127 280,235 306,443
Current liabilities 29,311 55,127 30,235 56,443
Non-current liabilities 250,000 250,000 250,000 250,000
Amounts recognized in non-current liabilities as at June 30, 2014 and December 31, 2013 mature as follow: Company and Consolidated
06/30/2014 12/31/2013
2015 10,417 10,417
2016 62,500 62,500
2017 177,083 177,083
Non-current liabilities 250,000 250,000

(A free translation of the original in Portuguese)
46
The changes in loans and financing as at June 30, 2014 are as follow:
06/30/2014
Company Consolidated
Balance at the beginning of the period 305,127 306,443
Interest rates 8,819 9,360
Amortization (34,635) (35,568)
Balance at the end of the period 279,311 280,235
a) BNDES – National Bank for Economic and Social Development The purpose of the BNDES Program for the Development of the Software National Industry and Information Technology Services – PROSOFT, which became available in 2008, is to finance software innovation research, brand repositioning and the restructuring of sales channels. It bears TJLP plus 1.5% interest p.a., maturing every six months. To guarantee this agreement, the Company has signed a bank guarantee with Santander Bank. In 2013, a new loan from BNDES of R$658,501, was approved, with an amortization period of 72 months, including a 24 months of grace period over the principal amount, to be released as proof of completion of investments. The loan is divided into three sub-credits, as described below:
Subcredit "A": PROSOFT amounting to R$596,835, which bears interest of 1.5% per year above TJLP, to be invested between 2013 and 2015 in the development of the qualitative solutions offered by TOTVS;
Subcredit "B" Program of Investment Supporting, Subprogram Innovation and Machinery and Efficient Equipment (PSI) amounting to R$58,466, which bears interest of 3.5% per year, to be invested in the development of its platform named "FLUIG";
Subcredit "C" an amount of R$3,300, which bears TJLP, to be invested in corporate social responsibility projects to be performed by TOTVS.
As at June 30, 2014, R$250,000 was available to the Company.
b) FINEP – Research and Project Financing: Software development This loan is paid based on TJLP, plus interest of 5% per annum and is secured by bank letters of guarantee.

(A free translation of the original in Portuguese)
47
16. Debentures The operations, issue characteristics, interest paid, conditions and history of conversion of debentures into shares and the payment of non-conversion premiums are detailed in Note 16 to the financial statements for the year ended December 31, 2013. As at June 30, 2014 and December 31, 2013, the balances were broken down as follow:
Issue Debentures Annual financial charges Unit price
Company and Consolidated
06/30/2014 12/31/2013
Series 1 100,000 IPCA* + 3,5% limited to TJLP + 1,5% 1,00 41,617 39,760
Series 2 100,000 TJLP + 1,5% 1,00 41,617 39,760
Subtotal 83,234 79,520
Premium due to non-conversion 28,302 24,685
Total 111,536 104,205
Current liabilities 3,230 1,805
Non-current liabilities 108,306 102,400 * Extended National Consumer Price Index
The non-current liabilities have matury date as shown in the table below:
Company and Consolidated
06/30/2014 12/31/2013
2015 32,002 29,712 2016 48,002 48,002 2017 14,927 14,927
2018 on ward 13,375 9,759
108,306 102,400
The following changes occurred in the periods:
Debentures and premiums from
non-conversion
Company and Consolidated
06/30/2014 12/31/2013
Balance at the beginning of the year 104,205 130,369 Interest rates 8,654 11,296 Amortization (1,323) (37,460)
Balance as at June 30 111,536 104,205

(A free translation of the original in Portuguese)
48
17. Obligations relating to acquisitions These referred to installments payable due to investment acquisitions carried out by the Company and its subsidiaries, negotiated with payment in installments, recorded in current and non-current liabilities, as follow:
Company Consolidated
06/30/2014 12/31/2013 06/30/2014 12/31/2013
Datasul MG 2,305 2,226 2,305 2,226
Datasul Saúde MG 641 641 641 641
TotalBanco 768 748 768 748
Hery 1,600 1,563 1,600 1,563
ERP Cedente - 138 - 138
TQTVD 184 662 184 662
SRC 170 161 170 161
Mafipa 1,006 957 1,006 957
Gens EDES 8,331 8,940 8,331 8,940
Umov.me - - 715 848
W&D Participações - - 27,585 41,422
Ciashop - - 3,352 -
RMS - - 30,860 29,604
TOTVS Agroindústria 12,180 11,903 12,180 11,903
Virtual Age 43,186 - 43,186 -
Seventeen - - 8,883 9,734
70,371 27,939 141,766 109,547
Current liabilities 24,440 8,530 36,454 63,717
Non-current liabilities 45,931 19,409 105,312 45,830
Installments registered in non-current liabilities mature as follow:
Company Consolidated
Year 06/30/2014 12/31/2013 06/30/2014 12/31/2013
2015 2,617 4,739 26,663 4,739
2016 43,314 14,670 67,229 36,091
2017 on ward - - 11,420 5,000
Non-current liabilities
45,931 19,409 105,312 45,830
The amounts recognized in non-current liabilities are adjusted to their present value at the rate of 11.2% p. in June 30, 2014.
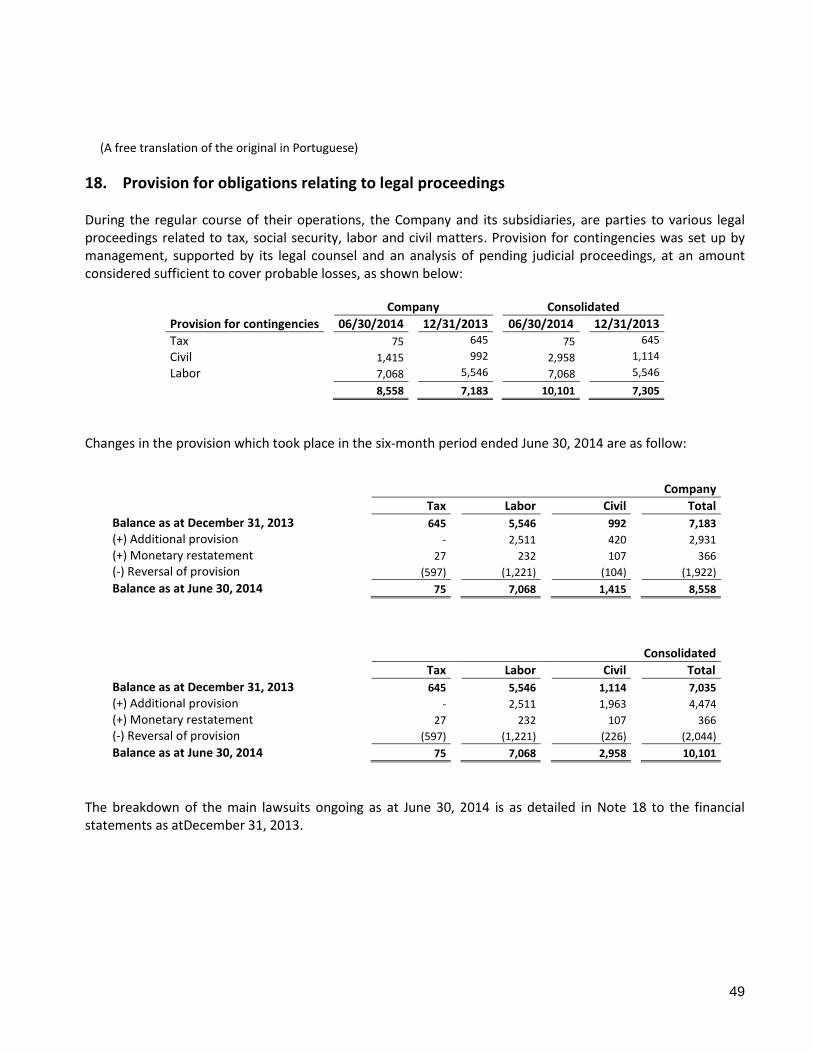
(A free translation of the original in Portuguese)
49
18. Provision for obligations relating to legal proceedings During the regular course of their operations, the Company and its subsidiaries, are parties to various legal proceedings related to tax, social security, labor and civil matters. Provision for contingencies was set up by management, supported by its legal counsel and an analysis of pending judicial proceedings, at an amount considered sufficient to cover probable losses, as shown below:
Company Consolidated
Provision for contingencies 06/30/2014 12/31/2013 06/30/2014 12/31/2013
Tax 75 645 75 645
Civil 1,415 992 2,958 1,114
Labor 7,068 5,546 7,068 5,546
8,558 7,183 10,101 7,305
Changes in the provision which took place in the six-month period ended June 30, 2014 are as follow:
The breakdown of the main lawsuits ongoing as at June 30, 2014 is as detailed in Note 18 to the financial statements as atDecember 31, 2013.
Company
Tax Labor Civil Total
Balance as at December 31, 2013 645 5,546 992 7,183
(+) Additional provision - 2,511 420 2,931
(+) Monetary restatement 27 232 107 366
(-) Reversal of provision (597) (1,221) (104) (1,922)
Balance as at June 30, 2014 75 7,068 1,415 8,558
Consolidated
Tax Labor Civil Total
Balance as at December 31, 2013 645 5,546 1,114 7,035
(+) Additional provision - 2,511 1,963 4,474
(+) Monetary restatement 27 232 107 366
(-) Reversal of provision (597) (1,221) (226) (2,044)
Balance as at June 30, 2014 75 7,068 2,958 10,101
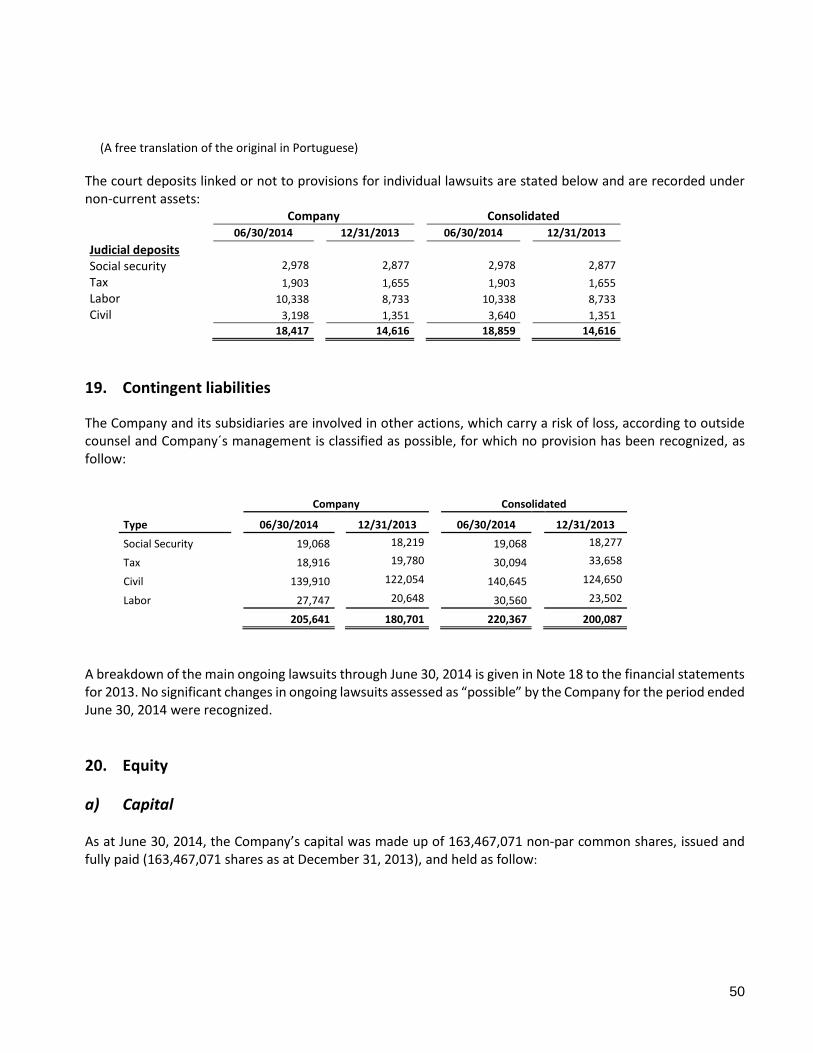
(A free translation of the original in Portuguese)
50
The court deposits linked or not to provisions for individual lawsuits are stated below and are recorded under non-current assets: Company Consolidated
06/30/2014 12/31/2013 06/30/2014 12/31/2013
Judicial deposits Social security 2,978 2,877 2,978 2,877
Tax 1,903 1,655 1,903 1,655
Labor 10,338 8,733 10,338 8,733
Civil 3,198 1,351 3,640 1,351
18,417 14,616 18,859 14,616
19. Contingent liabilities
The Company and its subsidiaries are involved in other actions, which carry a risk of loss, according to outside counsel and Company´s management is classified as possible, for which no provision has been recognized, as follow:
Company Consolidated
Type 06/30/2014 12/31/2013 06/30/2014 12/31/2013
Social Security 19,068 18,219 19,068 18,277
Tax 18,916 19,780 30,094 33,658
Civil 139,910 122,054 140,645 124,650
Labor 27,747 20,648 30,560 23,502
205,641 180,701 220,367 200,087
A breakdown of the main ongoing lawsuits through June 30, 2014 is given in Note 18 to the financial statements for 2013. No significant changes in ongoing lawsuits assessed as “possible” by the Company for the period ended June 30, 2014 were recognized.
20. Equity
a) Capital As at June 30, 2014, the Company’s capital was made up of 163,467,071 non-par common shares, issued and fully paid (163,467,071 shares as at December 31, 2013), and held as follow:
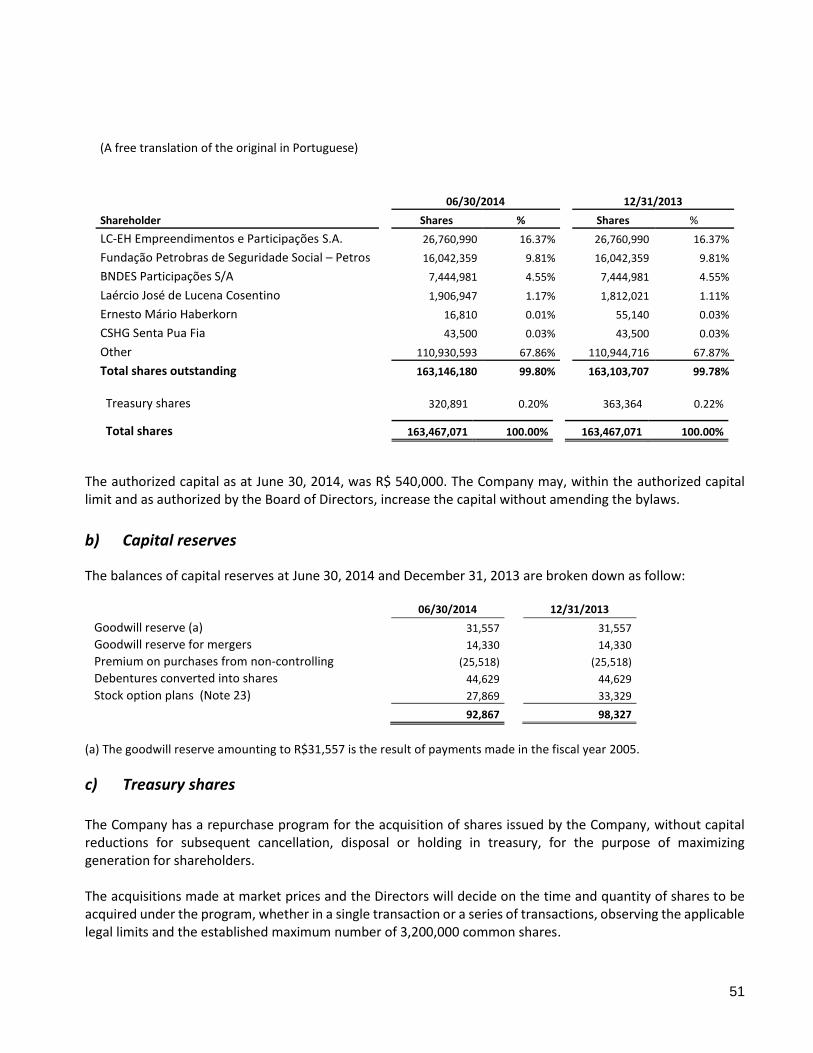
(A free translation of the original in Portuguese)
51
06/30/2014 12/31/2013
Shareholder Shares % Shares %
LC-EH Empreendimentos e Participações S.A. 26,760,990 16.37% 26,760,990 16.37%
Fundação Petrobras de Seguridade Social – Petros 16,042,359 9.81% 16,042,359 9.81%
BNDES Participações S/A 7,444,981 4.55% 7,444,981 4.55%
Laércio José de Lucena Cosentino 1,906,947 1.17% 1,812,021 1.11%
Ernesto Mário Haberkorn 16,810 0.01% 55,140 0.03%
CSHG Senta Pua Fia 43,500 0.03% 43,500 0.03%
Other 110,930,593 67.86% 110,944,716 67.87%
Total shares outstanding 163,146,180 99.80% 163,103,707 99.78%
Treasury shares 320,891 0.20% 363,364 0.22%
Total shares 163,467,071 100.00% 163,467,071 100.00%
The authorized capital as at June 30, 2014, was R$ 540,000. The Company may, within the authorized capital limit and as authorized by the Board of Directors, increase the capital without amending the bylaws.
b) Capital reserves
The balances of capital reserves at June 30, 2014 and December 31, 2013 are broken down as follow:
06/30/2014 12/31/2013
Goodwill reserve (a) 31,557 31,557
Goodwill reserve for mergers 14,330 14,330
Premium on purchases from non-controlling (25,518) (25,518)
Debentures converted into shares 44,629 44,629
Stock option plans (Note 23) 27,869 33,329
92,867 98,327
(a) The goodwill reserve amounting to R$31,557 is the result of payments made in the fiscal year 2005.
c) Treasury shares
The Company has a repurchase program for the acquisition of shares issued by the Company, without capital reductions for subsequent cancellation, disposal or holding in treasury, for the purpose of maximizing generation for shareholders. The acquisitions made at market prices and the Directors will decide on the time and quantity of shares to be acquired under the program, whether in a single transaction or a series of transactions, observing the applicable legal limits and the established maximum number of 3,200,000 common shares.
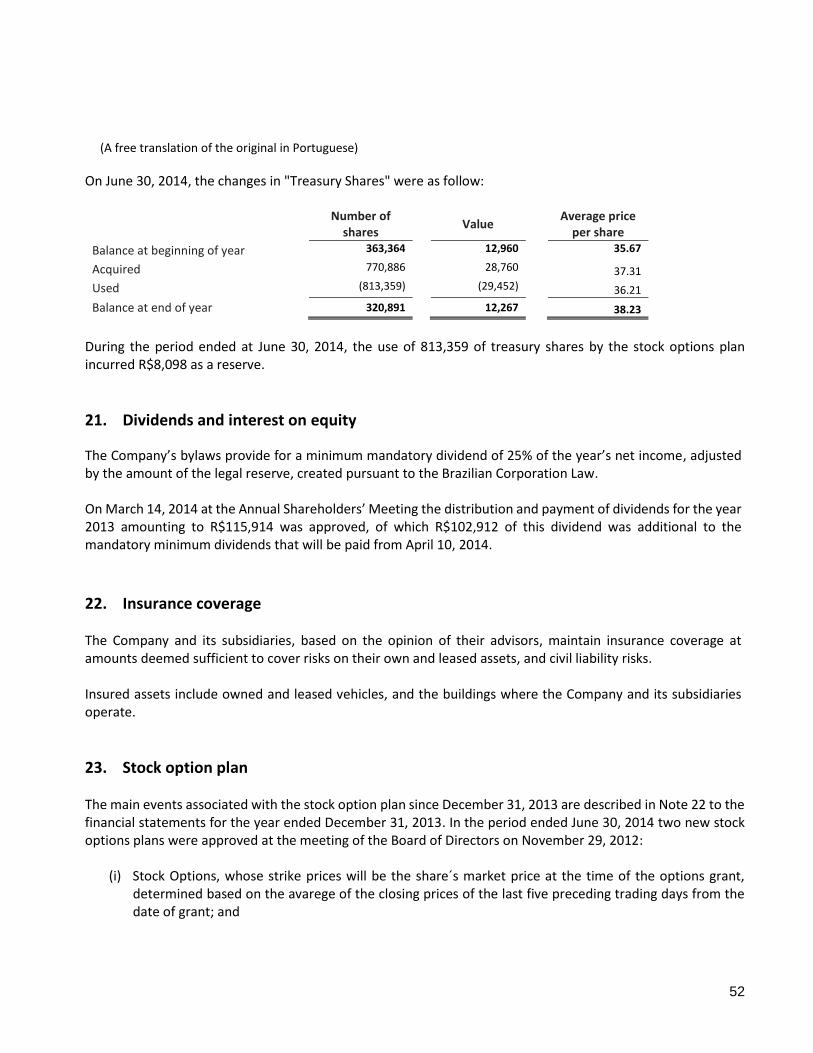
(A free translation of the original in Portuguese)
52
On June 30, 2014, the changes in "Treasury Shares" were as follow:
Number of
shares Value
Average price per share
Balance at beginning of year 363,364 12,960 35.67
Acquired 770,886 28,760 37.31
Used (813,359) (29,452) 36.21
Balance at end of year 320,891 12,267 38.23
During the period ended at June 30, 2014, the use of 813,359 of treasury shares by the stock options plan incurred R$8,098 as a reserve.
21. Dividends and interest on equity
The Company’s bylaws provide for a minimum mandatory dividend of 25% of the year’s net income, adjusted by the amount of the legal reserve, created pursuant to the Brazilian Corporation Law. On March 14, 2014 at the Annual Shareholders’ Meeting the distribution and payment of dividends for the year 2013 amounting to R$115,914 was approved, of which R$102,912 of this dividend was additional to the mandatory minimum dividends that will be paid from April 10, 2014.
22. Insurance coverage The Company and its subsidiaries, based on the opinion of their advisors, maintain insurance coverage at amounts deemed sufficient to cover risks on their own and leased assets, and civil liability risks. Insured assets include owned and leased vehicles, and the buildings where the Company and its subsidiaries operate.
23. Stock option plan The main events associated with the stock option plan since December 31, 2013 are described in Note 22 to the financial statements for the year ended December 31, 2013. In the period ended June 30, 2014 two new stock options plans were approved at the meeting of the Board of Directors on November 29, 2012:
(i) Stock Options, whose strike prices will be the share´s market price at the time of the options grant, determined based on the avarege of the closing prices of the last five preceding trading days from the date of grant; and
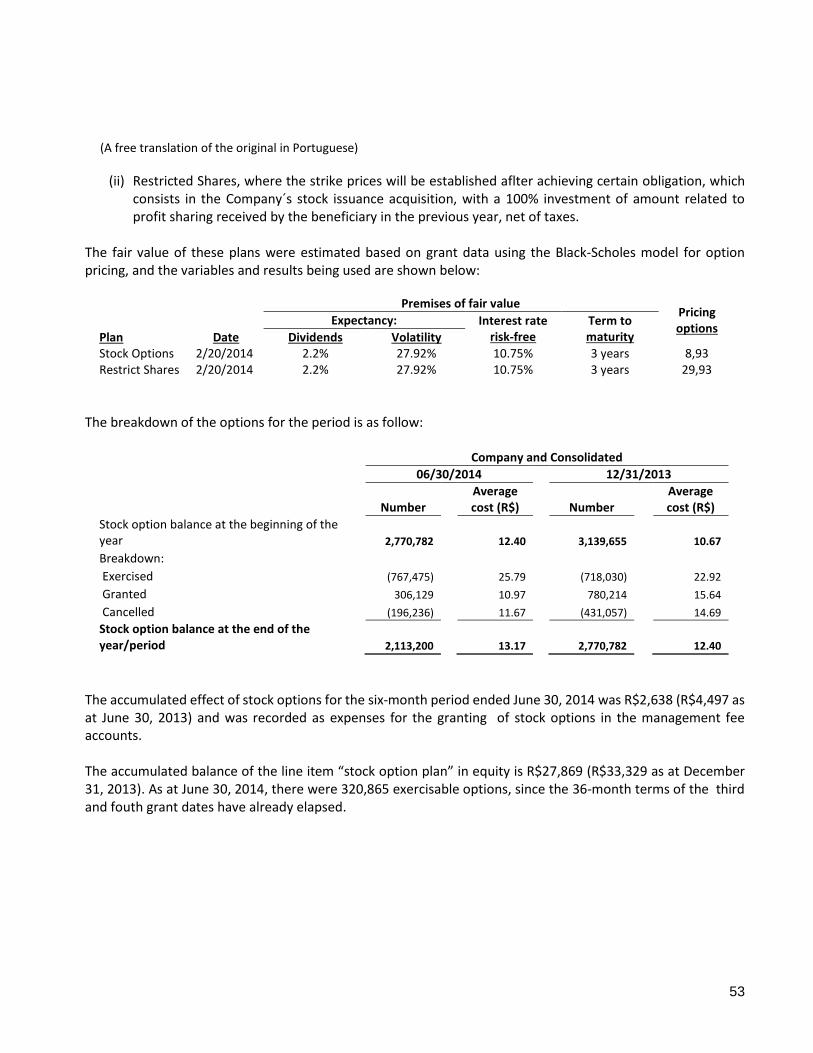
(A free translation of the original in Portuguese)
53
(ii) Restricted Shares, where the strike prices will be established aflter achieving certain obligation, which consists in the Company´s stock issuance acquisition, with a 100% investment of amount related to profit sharing received by the beneficiary in the previous year, net of taxes.
The fair value of these plans were estimated based on grant data using the Black-Scholes model for option pricing, and the variables and results being used are shown below:
Date
Premises of fair value Pricing options
Expectancy: Interest rate risk-free
Term to maturity Plan Dividends Volatility
Stock Options 2/20/2014 2.2% 27.92% 10.75% 3 years 8,93 Restrict Shares 2/20/2014 2.2% 27.92% 10.75% 3 years 29,93
The breakdown of the options for the period is as follow:
Company and Consolidated
06/30/2014 12/31/2013
Number
Average cost (R$)
Number
Average cost (R$)
Stock option balance at the beginning of the year 2,770,782 12.40 3,139,655 10.67
Breakdown:
Exercised (767,475) 25.79 (718,030) 22.92
Granted 306,129 10.97 780,214 15.64
Cancelled (196,236) 11.67 (431,057) 14.69
Stock option balance at the end of the year/period 2,113,200 13.17 2,770,782 12.40
The accumulated effect of stock options for the six-month period ended June 30, 2014 was R$2,638 (R$4,497 as at June 30, 2013) and was recorded as expenses for the granting of stock options in the management fee accounts. The accumulated balance of the line item “stock option plan” in equity is R$27,869 (R$33,329 as at December 31, 2013). As at June 30, 2014, there were 320,865 exercisable options, since the 36-month terms of the third and fouth grant dates have already elapsed.
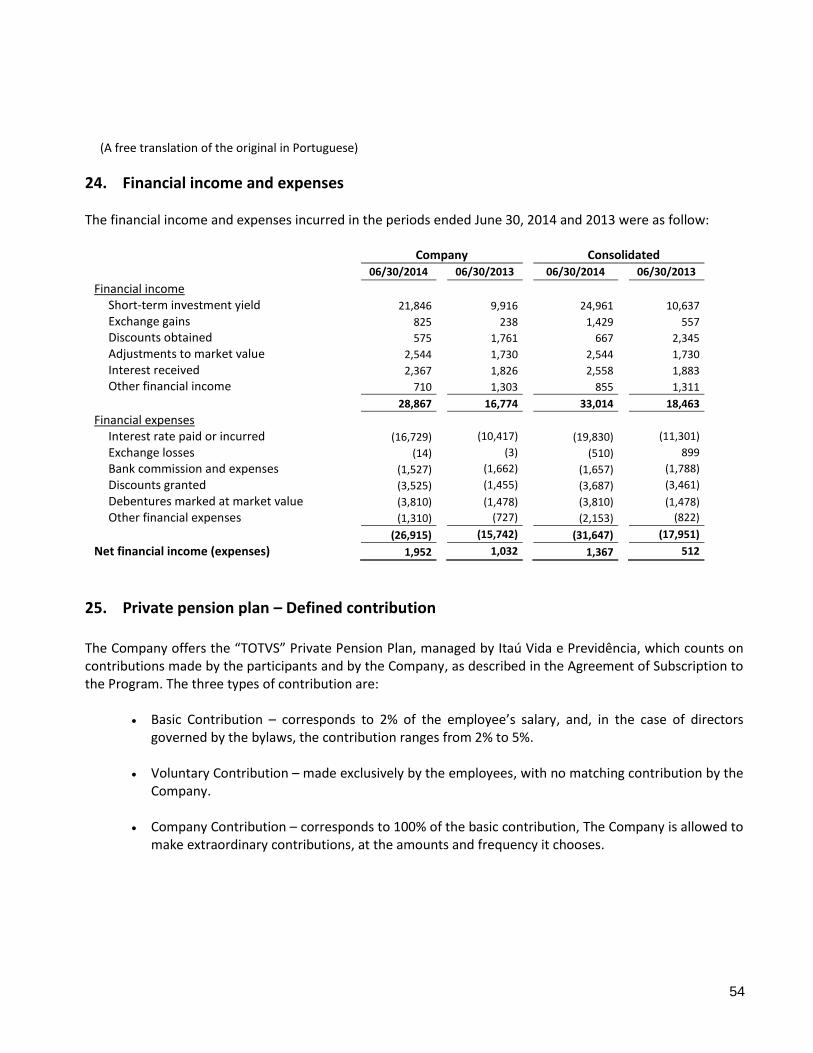
(A free translation of the original in Portuguese)
54
24. Financial income and expenses The financial income and expenses incurred in the periods ended June 30, 2014 and 2013 were as follow:
Company Consolidated
06/30/2014 06/30/2013 06/30/2014 06/30/2013
Financial income Short-term investment yield 21,846 9,916 24,961 10,637
Exchange gains 825 238 1,429 557
Discounts obtained 575 1,761 667 2,345
Adjustments to market value 2,544 1,730 2,544 1,730
Interest received 2,367 1,826 2,558 1,883
Other financial income 710 1,303 855 1,311
28,867 16,774 33,014 18,463
Financial expenses
Interest rate paid or incurred (16,729) (10,417) (19,830) (11,301)
Exchange losses (14) (3) (510) 899
Bank commission and expenses (1,527) (1,662) (1,657) (1,788)
Discounts granted (3,525) (1,455) (3,687) (3,461)
Debentures marked at market value (3,810) (1,478) (3,810) (1,478)
Other financial expenses (1,310) (727) (2,153) (822)
(26,915) (15,742) (31,647) (17,951)
Net financial income (expenses) 1,952 1,032 1,367 512
25. Private pension plan – Defined contribution The Company offers the “TOTVS” Private Pension Plan, managed by Itaú Vida e Previdência, which counts on contributions made by the participants and by the Company, as described in the Agreement of Subscription to the Program. The three types of contribution are:
Basic Contribution – corresponds to 2% of the employee’s salary, and, in the case of directors governed by the bylaws, the contribution ranges from 2% to 5%.
Voluntary Contribution – made exclusively by the employees, with no matching contribution by the
Company. Company Contribution – corresponds to 100% of the basic contribution, The Company is allowed to
make extraordinary contributions, at the amounts and frequency it chooses.

(A free translation of the original in Portuguese)
55
26. Earnings per share The charts below show the earnings and share data used to calculate the basic earnings and diluted earnings per share:
Company and Consolidated
06/30/2014 06/30/2013
Basic earnings per share Numerator Net income for the period assigned to the Company’s shareholders 125,658 105,559 Denominator (in thousands of shares) Weighted average number of common shares outstanding 163,124 161,945
Basic earnings per share 0.77 0.65
Company and Consolidated
06/30/2014 06/30/2013
Diluted earnings per share Numerator Net income for the period assigned to the Company’s
shareholders 125,658 105,559 Denominator (in thousands of shares) Weighted average number of common shares outstanding Dilutive effect 163,124 161,945
Stock options 2,578 3,474
Debentures - 1,175
Weighted average number of common shares adjusted according to dilutive effect 165,702 166,594
Diluted earnings per share 0.76 0.63
There were no other transactions involving common shares or potential common shares between the date of the balance sheet and the date when these interim financial statements were concluded.
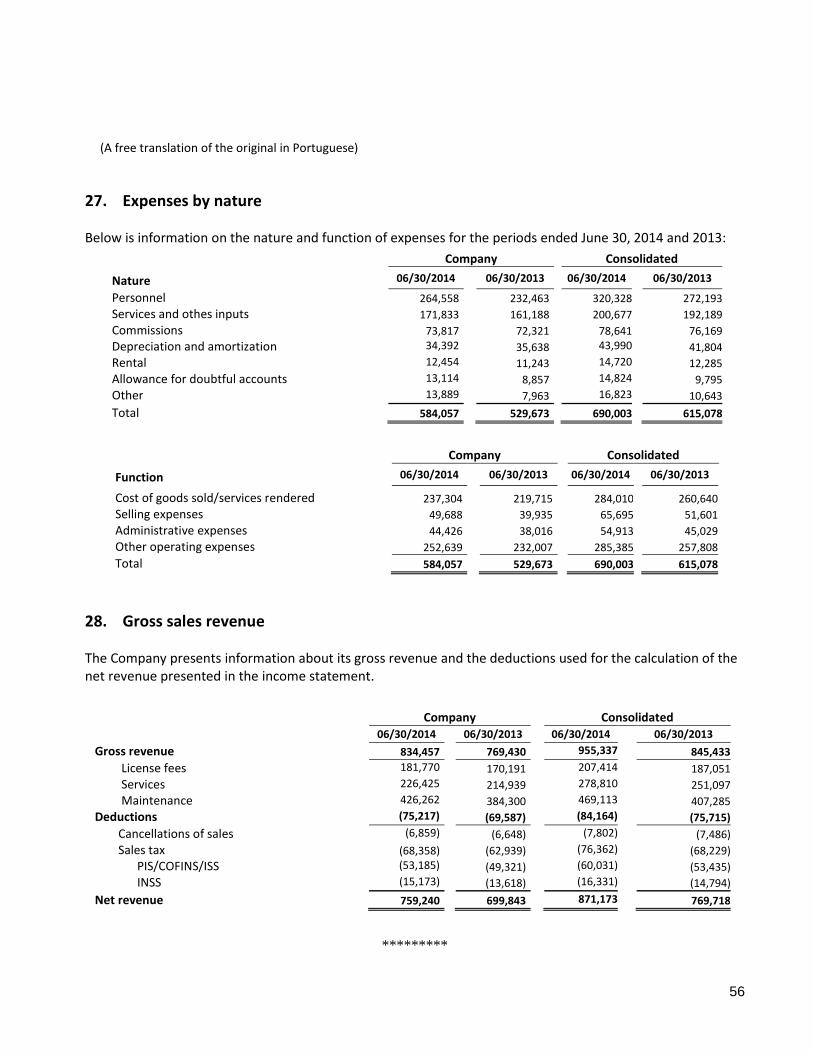
(A free translation of the original in Portuguese)
56
27. Expenses by nature Below is information on the nature and function of expenses for the periods ended June 30, 2014 and 2013:
Company Consolidated
Nature 06/30/2014 06/30/2013 06/30/2014 06/30/2013
Personnel 264,558 232,463 320,328 272,193
Services and othes inputs 171,833 161,188 200,677 192,189
Commissions 73,817 72,321 78,641 76,169
Depreciation and amortization 34,392 35,638 43,990 41,804
Rental 12,454 11,243 14,720 12,285
Allowance for doubtful accounts 13,114 8,857 14,824 9,795
Other 13,889 7,963 16,823 10,643
Total 584,057 529,673 690,003 615,078
Company Consolidated
Function 06/30/2014 06/30/2013 06/30/2014 06/30/2013
Cost of goods sold/services rendered 237,304 219,715 284,010 260,640
Selling expenses 49,688 39,935 65,695 51,601
Administrative expenses 44,426 38,016 54,913 45,029
Other operating expenses 252,639 232,007 285,385 257,808
Total 584,057 529,673 690,003 615,078
28. Gross sales revenue The Company presents information about its gross revenue and the deductions used for the calculation of the net revenue presented in the income statement.
Company Consolidated
06/30/2014 06/30/2013 06/30/2014 06/30/2013
Gross revenue 834,457 769,430 955,337 845,433
License fees 181,770 170,191 207,414 187,051
Services 226,425 214,939 278,810 251,097
Maintenance 426,262 384,300 469,113 407,285
Deductions (75,217) (69,587) (84,164) (75,715)
Cancellations of sales (6,859) (6,648) (7,802) (7,486)
Sales tax (68,358) (62,939) (76,362) (68,229) PIS/COFINS/ISS (53,185) (49,321) (60,031) (53,435) INSS (15,173) (13,618) (16,331) (14,794)
Net revenue 759,240 699,843 871,173 769,718
*********
(A free translation of the original in Portuguese)
57
Guidances Tracking EBITDA margin Projected EBITDA margin in the range between 27% and 30% for the fiscal years of 2013 to 2016. TOTVS´s EBITDA Margin was of 25.8% in 1st semester 2014 and 25.5% in the 1st semester of 2013, below the range of 27% to 30% mentioned above. By the end of the 1st semester of 2014, the main elements that affected the EBITDA margin were: (i) the increase of sales expenses as a percentage of net revenues, when compared to the 1st semester of 2013, due to the higher investments on the market industry specialization of the sales teams, (ii) the increase in research and development expenses as a percentage of net revenues, when compared to same period of 2013, reflecting the investments in product vertical specialization, and (iii) the allowance for doubtful accounts above the Company’s historical levels. So far, the Company has not identified reasons to change such guidance.
(A free translation of the original in Portuguese)
58
Report on review of quarterly information To the Board of Directors and Stockholders TOTVS S.A. Introduction We have reviewed the accompanying parent company and consolidated interim accounting information of TOTVS S.A. ("Company"), included in the Quarterly Information Form (ITR) for the quarter ended June 30, 2014, comprising the balance sheet as at that date and the statements of income and comprehensive income for the quarter and six-month period then ended, and the statements of changes in equity and cash flows for the six-month period then ended, and a summary of significant accounting policies and other explanatory information. Management is responsible for the preparation of the parent company interim accounting information in accordance with the accounting standard CPC 21, Interim Financial Reporting, of the Brazilian Accounting Pronouncements Committee (CPC), and of the consolidated interim accounting information in accordance with CPC 21 and International Accounting Standard (IAS) 34 - Interim Financial Reporting issued by the International Accounting Standards Board (IASB), as well as the presentation of this information in accordance with the standards issued by the Brazilian Securities Commission (CVM), applicable to the preparation of the Quarterly Information (ITR). Our responsibility is to express a conclusion on this interim accounting information based on our review. Scope of review We conducted our review in accordance with Brazilian and International Standards on Reviews of Interim Financial Information (NBC TR 2410 - Review of Interim Financial Information Performed by the Independent Auditor of the Entity and ISRE 2410 - Review of Interim Financial Information Performed by the Independent Auditor of the Entity, respectively). A review of interim information consists of making inquiries, primarily of persons responsible for financial and accounting matters, and applying analytical and other review procedures. A review is substantially less in scope than an audit conducted in accordance with Brazilian and International Standards on Auditing and consequently does not enable us to obtain assurance that we would become aware of all significant matters that might be identified in an audit. Accordingly, we do not express an audit opinion. Conclusion on the parent company interim information Based on our review, nothing has come to our attention that causes us to believe that the accompanying parent company interim accounting information included in the quarterly information referred to above has not been prepared, in all material respects, in accordance with CPC 21 applicable to the preparation of the Quarterly Information, and presented in accordance with the standards issued by the CVM.
(A free translation of the original in Portuguese)
59
Conclusion on the consolidated interim information Based on our review, nothing has come to our attention that causes us to believe that the accompanying consolidated interim accounting information included in the quarterly information referred to above has not been prepared, in all material respects, in accordance with CPC 21 and IAS 34 applicable to the preparation of the Quarterly Information, and presented in accordance with the standards issued by the CVM. Other matters Statements of value added We have also reviewed the parent company and consolidated statements of value added for the six-month period ended June 30, 2014. These statements are the responsibility of the Company's management, and are required to be presented in accordance with standards issued by the CVM applicable to the preparation of Quarterly Information (ITR) and are considered supplementary information under IFRS, which do not require the presentation of the statement of value added. These statements have been submitted to the same review procedures described above and, based on our review, nothing has come to our attention that causes us to believe that they have not been prepared, in all material respects, in a manner consistent with the parent company and consolidated interim accounting information taken as a whole. São Paulo, July 28, 2014 PricewaterhouseCoopers Auditores Independentes CRC 2SP000160/O-5 Marco Aurélio de Castro e Melo Contador CRC 1SP153070/O-3


![[Totvs] - Instal an Do Com (SQL)](https://static.fdocuments.us/doc/165x107/577d1db61a28ab4e1e8ccac8/totvs-instal-an-do-com-sql.jpg)