TOTVS S.A. - 2 ITR 2016_ENG.pdf · Quarterly information (ITR) - 6/30/2016 - TOTVS S.A. Version: 1...
57
(A free translation of the original in Portuguese) TOTVS S.A. Quarterly information (ITR) at June 30, 2016 and report on review of quarterly information
Transcript of TOTVS S.A. - 2 ITR 2016_ENG.pdf · Quarterly information (ITR) - 6/30/2016 - TOTVS S.A. Version: 1...

(A free translation of the original in Portuguese)
TOTVS S.A. Quarterly information (ITR) at June 30, 2016 and report on review of quarterly information
(A free translation of the original in Portuguese)
Quarterly information (ITR) - 6/30/2016 - TOTVS S.A. Version: 1
Contents
Company information
Capital composition 1 Dividends 2 Parent company financial statements
Balance sheet - assets 3 Balance sheet - liabilities and equity 4 Statement of income 6 Statement of comprehensive income 8 Statement of cash flow - indirect method 9 Statement of changes in equity 1/1/2016 to 6/30/2016 10 1/1/2015 to 6/30/2015 11 Statement of value added 12
Consolidated financial statements
Balance sheet - assets 13 Balance sheet - liabilities and equity 14 Statement of income 16 Statement of comprehensive income 18 Statement of cash flow - indirect method 19 Statement of changes in equity 1/1/2016 to 6/30/2016 20 1/1/2015 to 6/30/2015 21 Statement of value added 22 Comments on performance 23
Notes to the financial statements 26 Opinions and statements Report on review of quarterly information 54
(A free translation of the original in Portuguese)
1
Quarterly information (ITR) - 6/30/2016 - TOTVS S.A. Version: 1
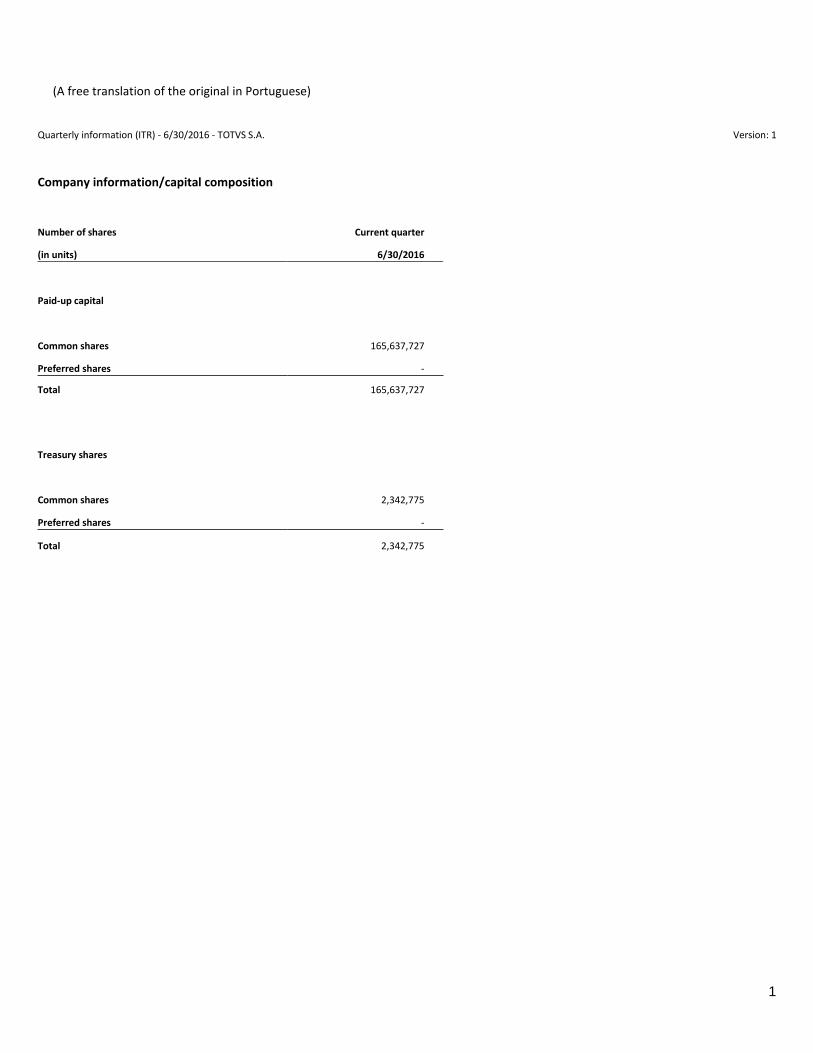
Company information/capital composition
Number of shares Current quarter
(in units) 6/30/2016
Paid-up capital
Common shares 165,637,727
Preferred shares -
Total 165,637,727 Treasury shares
Common shares 2,342,775
Preferred shares -
Total 2,342,775
(A free translation of the original in Portuguese)
2
Quarterly information (ITR) - 6/30/2016- TOTVS S.A. Version: 1
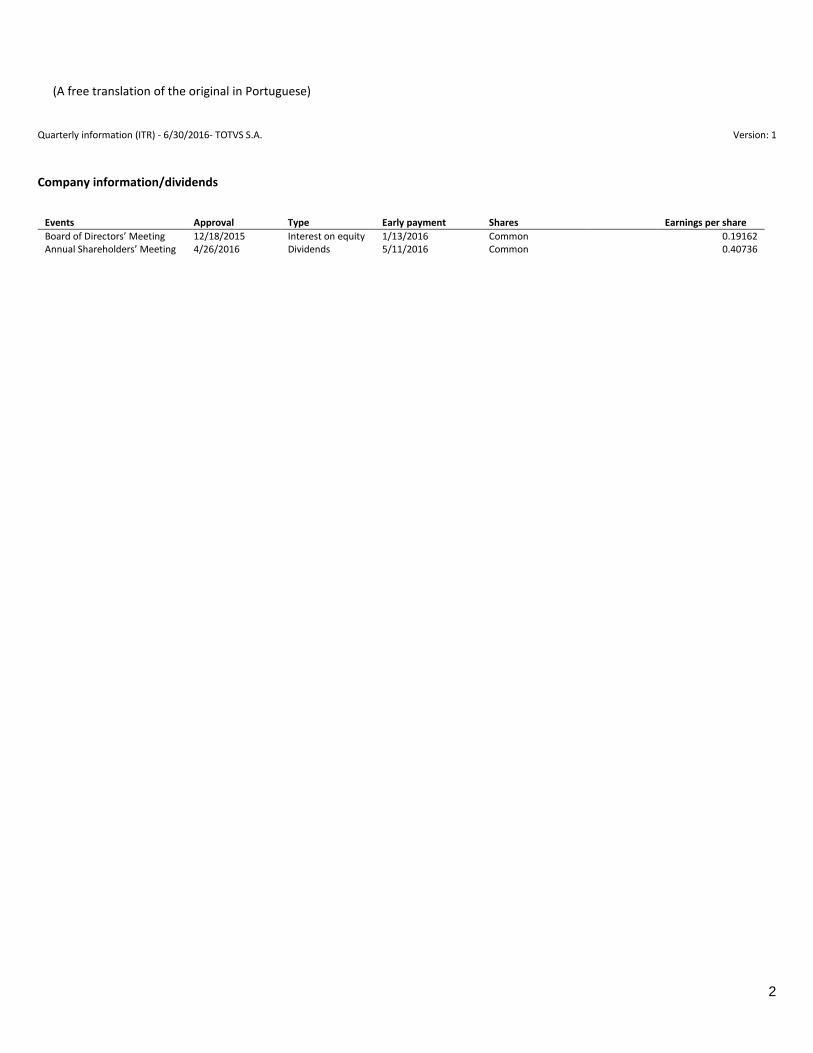
Company information/dividends
Events Approval Type Early payment Shares Earnings per share
Board of Directors’ Meeting 12/18/2015 Interest on equity 1/13/2016 Common 0.19162 Annual Shareholders’ Meeting
4/26/2016 Dividends 5/11/2016 Common 0.40736
(A free translation of the original in Portuguese)
3
Quarterly information (ITR) - 6/30/2016- TOTVS S.A. Version: 1
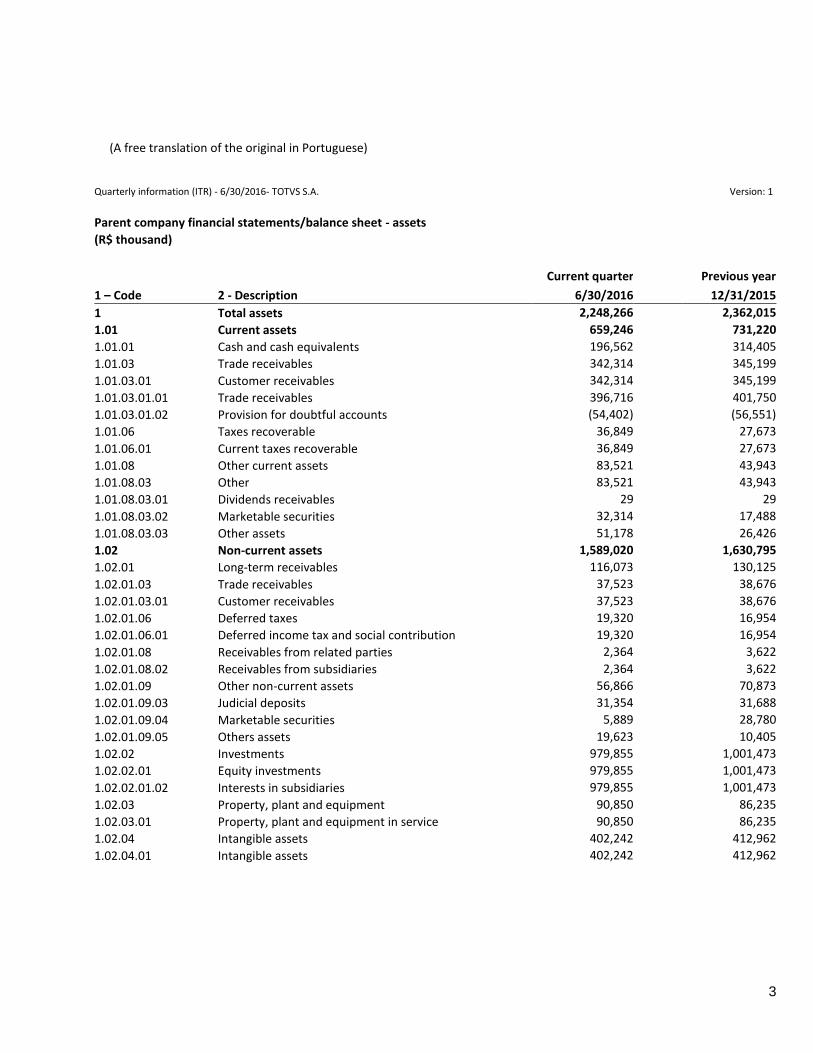
Parent company financial statements/balance sheet - assets
(R$ thousand)
Current quarter Previous year
1 – Code 2 - Description 6/30/2016 12/31/2015
1 Total assets 2,248,266 2,362,015
1.01 Current assets 659,246 731,220
1.01.01 Cash and cash equivalents 196,562 314,405
1.01.03 Trade receivables 342,314 345,199
1.01.03.01 Customer receivables 342,314 345,199
1.01.03.01.01 Trade receivables 396,716 401,750
1.01.03.01.02 Provision for doubtful accounts (54,402) (56,551)
1.01.06 Taxes recoverable 36,849 27,673
1.01.06.01 Current taxes recoverable 36,849 27,673
1.01.08 Other current assets 83,521 43,943
1.01.08.03 Other 83,521 43,943
1.01.08.03.01 Dividends receivables 29 29
1.01.08.03.02 Marketable securities 32,314 17,488
1.01.08.03.03 Other assets 51,178 26,426
1.02 Non-current assets 1,589,020 1,630,795
1.02.01 Long-term receivables 116,073 130,125
1.02.01.03 Trade receivables 37,523 38,676
1.02.01.03.01 Customer receivables 37,523 38,676
1.02.01.06 Deferred taxes 19,320 16,954
1.02.01.06.01 Deferred income tax and social contribution 19,320 16,954
1.02.01.08 Receivables from related parties 2,364 3,622
1.02.01.08.02 Receivables from subsidiaries 2,364 3,622
1.02.01.09 Other non-current assets 56,866 70,873
1.02.01.09.03 Judicial deposits 31,354 31,688
1.02.01.09.04 Marketable securities 5,889 28,780
1.02.01.09.05 Others assets 19,623 10,405
1.02.02 Investments 979,855 1,001,473
1.02.02.01 Equity investments 979,855 1,001,473
1.02.02.01.02 Interests in subsidiaries 979,855 1,001,473
1.02.03 Property, plant and equipment 90,850 86,235
1.02.03.01 Property, plant and equipment in service 90,850 86,235
1.02.04 Intangible assets 402,242 412,962
1.02.04.01 Intangible assets 402,242 412,962
(A free translation of the original in Portuguese)
4
Quarterly information (ITR) - 6/30/2016- TOTVS S.A. Version: 1
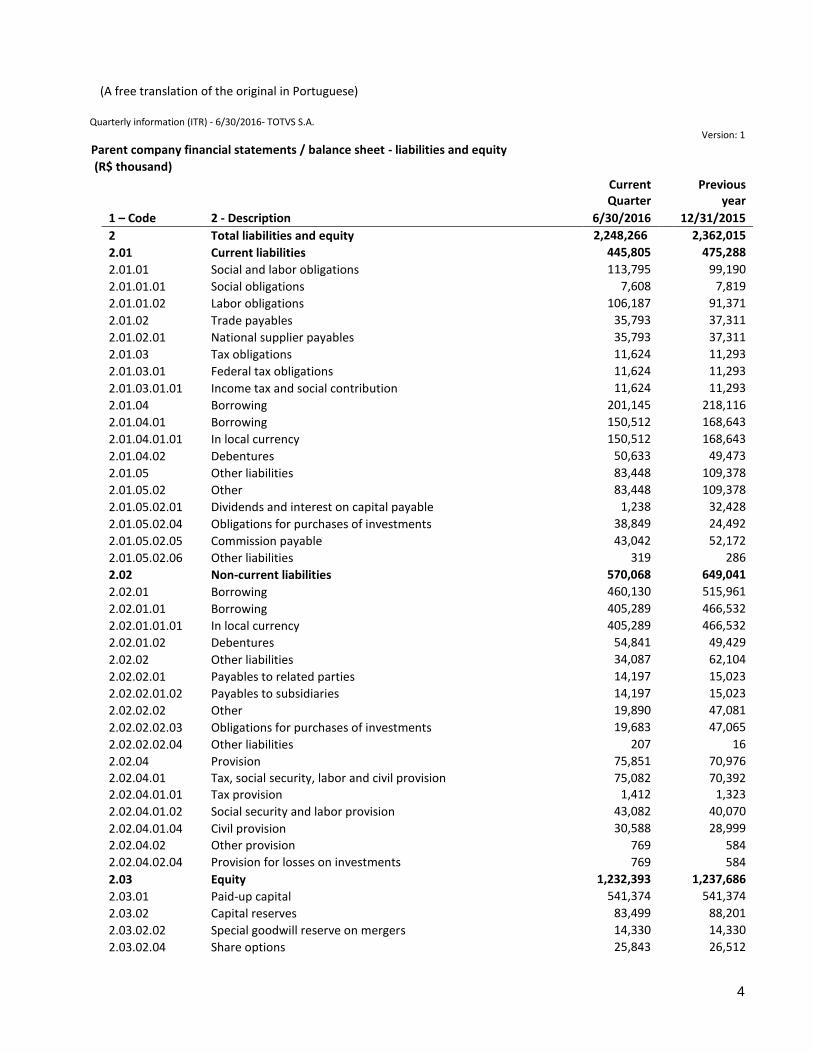
Parent company financial statements / balance sheet - liabilities and equity
(R$ thousand)
Current Quarter
Previous
year
1 – Code 2 - Description 6/30/2016 12/31/2015
2 Total liabilities and equity 2,248,266 2,362,015
2.01 Current liabilities 445,805 475,288
2.01.01 Social and labor obligations 113,795 99,190
2.01.01.01 Social obligations 7,608 7,819
2.01.01.02 Labor obligations 106,187 91,371
2.01.02 Trade payables 35,793 37,311
2.01.02.01 National supplier payables 35,793 37,311
2.01.03 Tax obligations 11,624 11,293
2.01.03.01 Federal tax obligations 11,624 11,293
2.01.03.01.01 Income tax and social contribution 11,624 11,293
2.01.04 Borrowing 201,145 218,116
2.01.04.01 Borrowing 150,512 168,643
2.01.04.01.01 In local currency 150,512 168,643
2.01.04.02 Debentures 50,633 49,473
2.01.05 Other liabilities 83,448 109,378
2.01.05.02 Other 83,448 109,378
2.01.05.02.01 Dividends and interest on capital payable 1,238 32,428
2.01.05.02.04 Obligations for purchases of investments 38,849 24,492
2.01.05.02.05 Commission payable 43,042 52,172
2.01.05.02.06 Other liabilities 319 286
2.02 Non-current liabilities 570,068 649,041
2.02.01 Borrowing 460,130 515,961
2.02.01.01 Borrowing 405,289 466,532
2.02.01.01.01 In local currency 405,289 466,532
2.02.01.02 Debentures 54,841 49,429
2.02.02 Other liabilities 34,087 62,104
2.02.02.01 Payables to related parties 14,197 15,023
2.02.02.01.02 Payables to subsidiaries 14,197 15,023
2.02.02.02 Other 19,890 47,081
2.02.02.02.03 Obligations for purchases of investments 19,683 47,065
2.02.02.02.04 Other liabilities 207 16
2.02.04 Provision 75,851 70,976
2.02.04.01 Tax, social security, labor and civil provision 75,082 70,392
2.02.04.01.01 Tax provision 1,412 1,323
2.02.04.01.02 Social security and labor provision 43,082 40,070
2.02.04.01.04 Civil provision 30,588 28,999
2.02.04.02 Other provision 769 584
2.02.04.02.04 Provision for losses on investments 769 584
2.03 Equity 1,232,393 1,237,686
2.03.01 Paid-up capital 541,374 541,374
2.03.02 Capital reserves 83,499 88,201
2.03.02.02 Special goodwill reserve on mergers 14,330 14,330
2.03.02.04 Share options 25,843 26,512
(A free translation of the original in Portuguese)
5
Quarterly information (ITR) - 6/30/2016 - TOTVS S.A. Version: 1
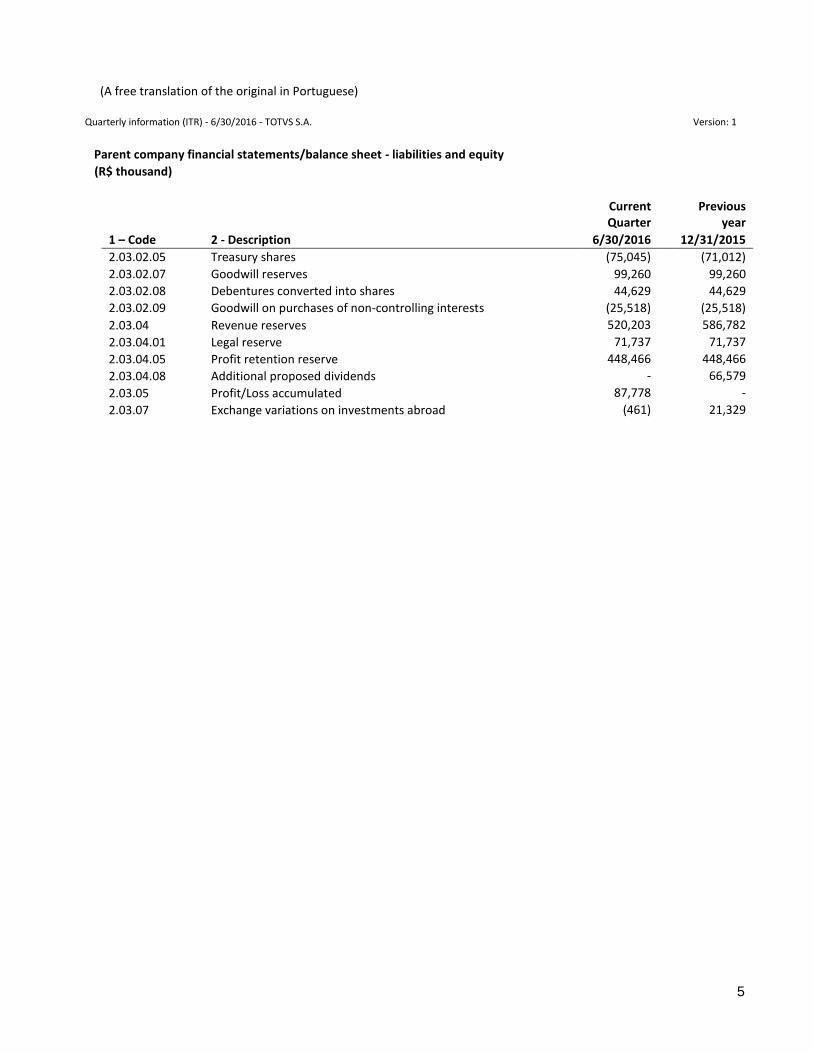
Parent company financial statements/balance sheet - liabilities and equity
(R$ thousand)
Current Quarter
Previous
year
1 – Code 2 - Description 6/30/2016 12/31/2015
2.03.02.05 Treasury shares (75,045) (71,012)
2.03.02.07 Goodwill reserves 99,260 99,260
2.03.02.08 Debentures converted into shares 44,629 44,629
2.03.02.09 Goodwill on purchases of non-controlling interests (25,518) (25,518)
2.03.04 Revenue reserves 520,203 586,782
2.03.04.01 Legal reserve 71,737 71,737
2.03.04.05 Profit retention reserve 448,466 448,466
2.03.04.08 Additional proposed dividends - 66,579
2.03.05 Profit/Loss accumulated 87,778 -
2.03.07 Exchange variations on investments abroad (461) 21,329
(A free translation of the original in Portuguese)
6
Quarterly information (ITR) - 6/30/2016 - TOTVS S.A. Version: 1
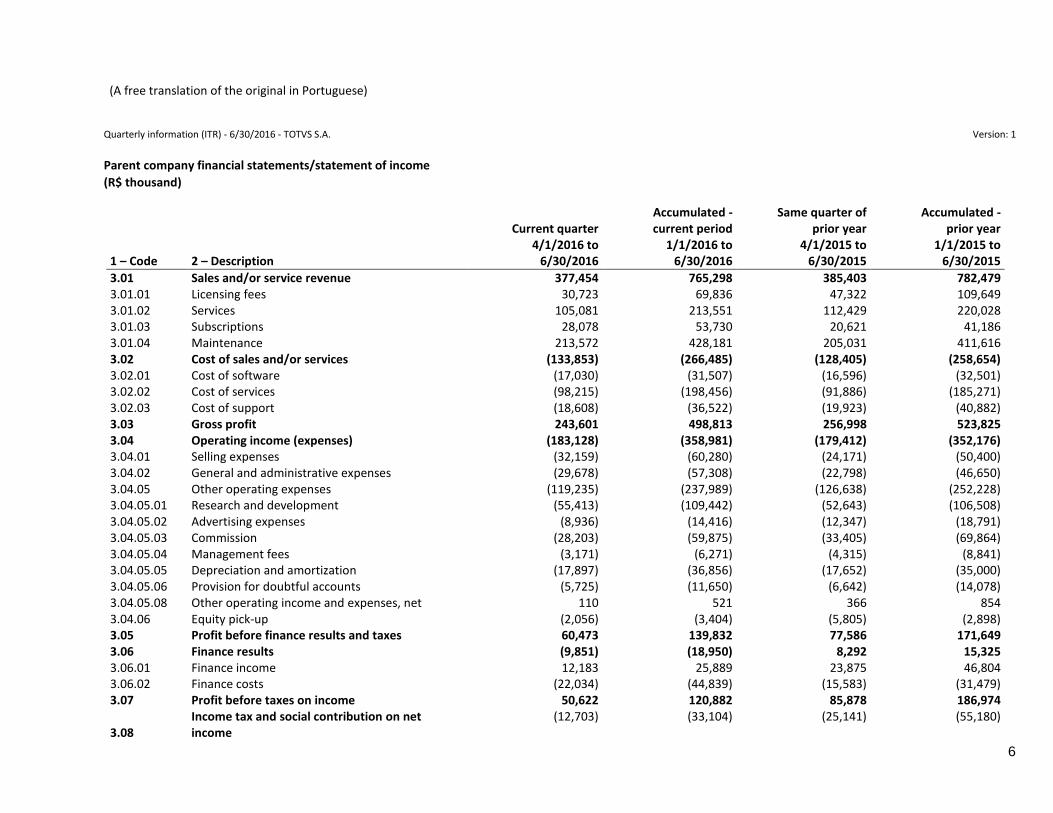
Parent company financial statements/statement of income
(R$ thousand)
1 – Code 2 – Description
Current quarter 4/1/2016 to
6/30/2016
Accumulated - current period
1/1/2016 to 6/30/2016
Same quarter of prior year
4/1/2015 to 6/30/2015
Accumulated - prior year
1/1/2015 to 6/30/2015
3.01 Sales and/or service revenue 377,454 765,298 385,403 782,479 3.01.01 Licensing fees 30,723 69,836 47,322 109,649 3.01.02 Services 105,081 213,551 112,429 220,028 3.01.03 Subscriptions 28,078 53,730 20,621 41,186 3.01.04 Maintenance 213,572 428,181 205,031 411,616 3.02 Cost of sales and/or services (133,853) (266,485) (128,405) (258,654) 3.02.01 Cost of software (17,030) (31,507) (16,596) (32,501) 3.02.02 Cost of services (98,215) (198,456) (91,886) (185,271) 3.02.03 Cost of support (18,608) (36,522) (19,923) (40,882) 3.03 Gross profit 243,601 498,813 256,998 523,825 3.04 Operating income (expenses) (183,128) (358,981) (179,412) (352,176) 3.04.01 Selling expenses (32,159) (60,280) (24,171) (50,400) 3.04.02 General and administrative expenses (29,678) (57,308) (22,798) (46,650) 3.04.05 Other operating expenses (119,235) (237,989) (126,638) (252,228) 3.04.05.01 Research and development (55,413) (109,442) (52,643) (106,508) 3.04.05.02 Advertising expenses (8,936) (14,416) (12,347) (18,791) 3.04.05.03 Commission (28,203) (59,875) (33,405) (69,864) 3.04.05.04 Management fees (3,171) (6,271) (4,315) (8,841) 3.04.05.05 Depreciation and amortization (17,897) (36,856) (17,652) (35,000) 3.04.05.06 Provision for doubtful accounts (5,725) (11,650) (6,642) (14,078) 3.04.05.08 Other operating income and expenses, net 110 521 366 854 3.04.06 Equity pick-up (2,056) (3,404) (5,805) (2,898) 3.05 Profit before finance results and taxes 60,473 139,832 77,586 171,649 3.06 Finance results (9,851) (18,950) 8,292 15,325 3.06.01 Finance income 12,183 25,889 23,875 46,804 3.06.02 Finance costs (22,034) (44,839) (15,583) (31,479) 3.07 Profit before taxes on income 50,622 120,882 85,878 186,974
3.08 Income tax and social contribution on net income
(12,703) (33,104) (25,141) (55,180)
(A free translation of the original in Portuguese)
7
1 – Code 2 – Description
Current quarter 4/1/2016 to
6/30/2016
Accumulated - current period
1/1/2016 to 6/30/2016
Same quarter of prior year
4/1/2015 to 6/30/2015
Accumulated - prior year
1/1/2015 to 6/30/2015
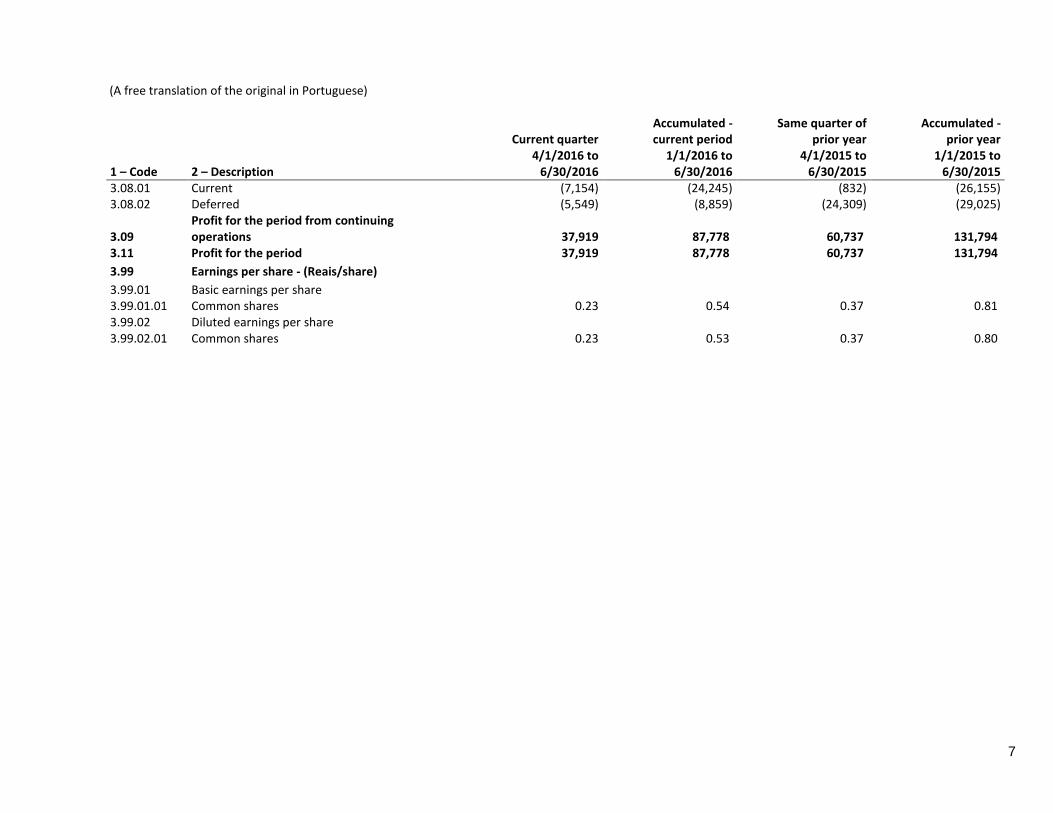
3.08.01 Current (7,154) (24,245) (832) (26,155) 3.08.02 Deferred (5,549) (8,859) (24,309) (29,025)
3.09 Profit for the period from continuing operations 37,919 87,778 60,737 131,794
3.11 Profit for the period 37,919 87,778 60,737 131,794
3.99 Earnings per share - (Reais/share)
3.99.01 Basic earnings per share 3.99.01.01 Common shares 0.23 0.54 0.37 0.81 3.99.02 Diluted earnings per share 3.99.02.01 Common shares 0.23 0.53 0.37 0.80
(A free translation of the original in Portuguese)
8
Quarterly information (ITR) - 6/30/2016 - TOTVS S.A. Version: 1
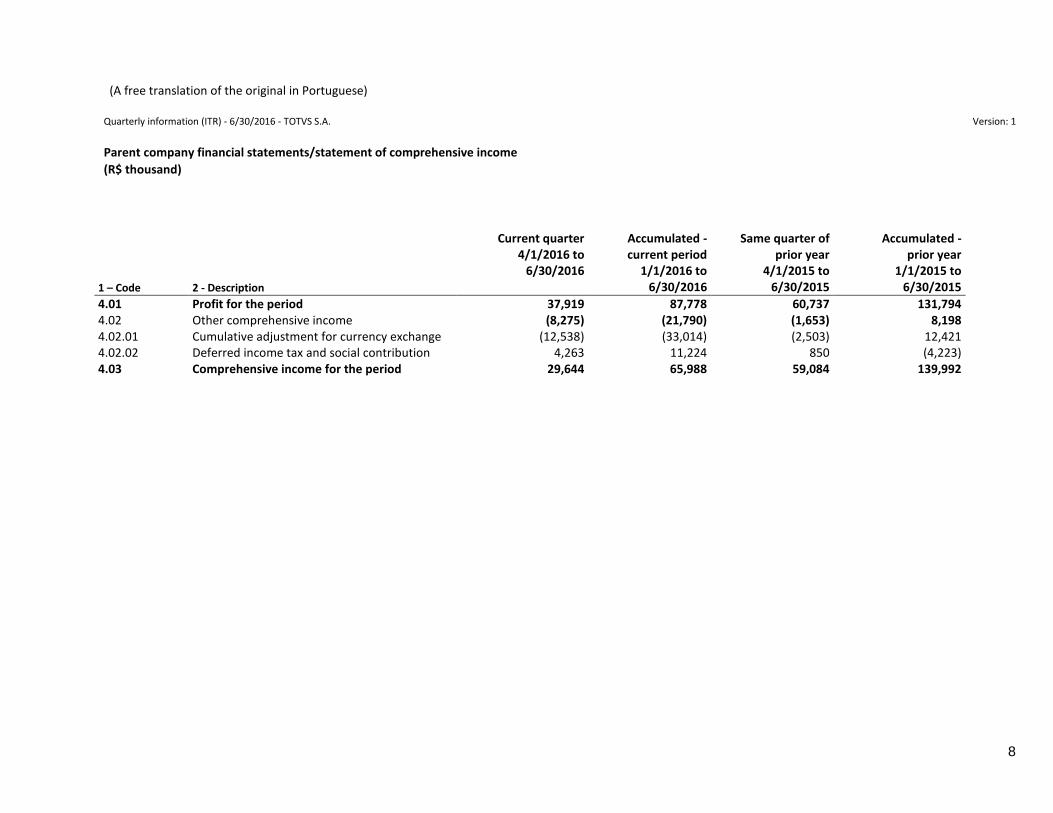
Parent company financial statements/statement of comprehensive income
(R$ thousand)
1 – Code 2 - Description
Current quarter
4/1/2016 to 6/30/2016
Accumulated - current period
1/1/2016 to 6/30/2016
Same quarter of prior year
4/1/2015 to 6/30/2015
Accumulated - prior year
1/1/2015 to 6/30/2015
4.01 Profit for the period 37,919 87,778 60,737 131,794 4.02 Other comprehensive income (8,275) (21,790) (1,653) 8,198 4.02.01 Cumulative adjustment for currency exchange (12,538) (33,014) (2,503) 12,421 4.02.02 Deferred income tax and social contribution 4,263 11,224 850 (4,223) 4.03 Comprehensive income for the period 29,644 65,988 59,084 139,992
(A free translation of the original in Portuguese)
9
Quarterly information (ITR) - 6/30/2016 - TOTVS S.A. Version: 1
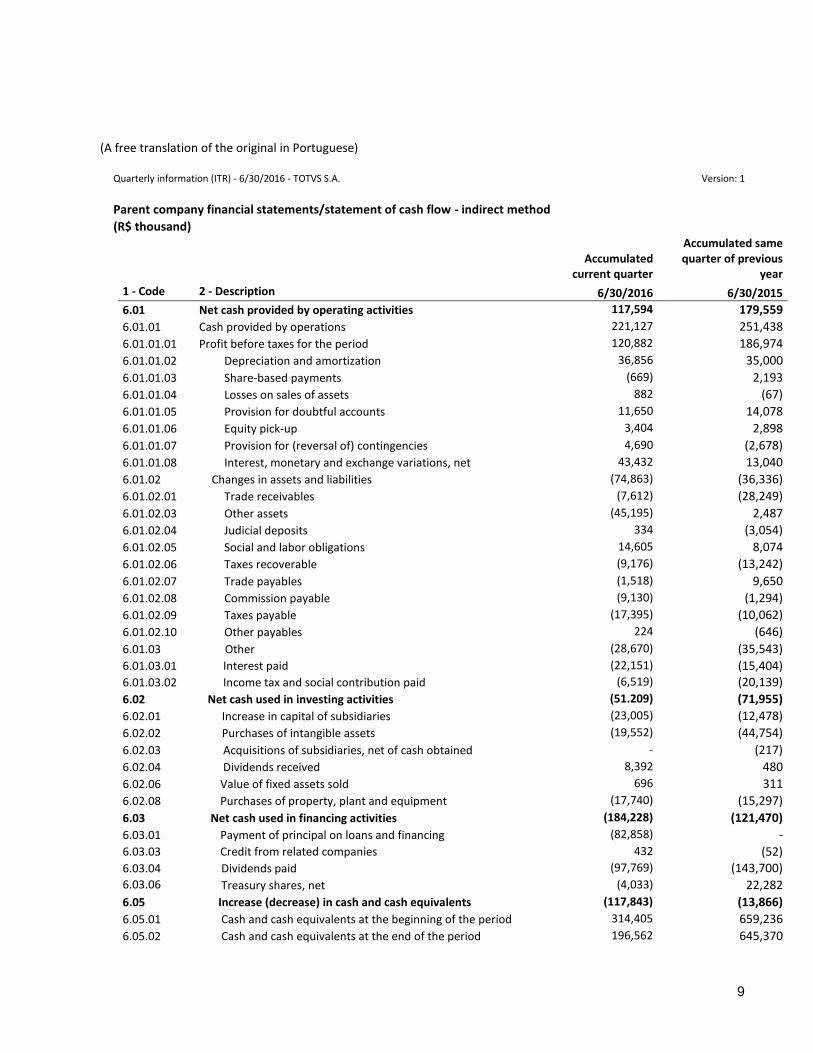
Parent company financial statements/statement of cash flow - indirect method
(R$ thousand)
Accumulated current quarter
Accumulated same quarter of previous
year
1 - Code 2 - Description 6/30/2016 6/30/2015
6.01 Net cash provided by operating activities 117,594 179,559
6.01.01 Cash provided by operations 221,127 251,438
6.01.01.01 Profit before taxes for the period 120,882 186,974
6.01.01.02 Depreciation and amortization 36,856 35,000
6.01.01.03 Share-based payments (669) 2,193
6.01.01.04 Losses on sales of assets 882 (67)
6.01.01.05 Provision for doubtful accounts 11,650 14,078
6.01.01.06 Equity pick-up 3,404 2,898
6.01.01.07 Provision for (reversal of) contingencies 4,690 (2,678)
6.01.01.08 Interest, monetary and exchange variations, net 43,432 13,040
6.01.02 Changes in assets and liabilities (74,863) (36,336)
6.01.02.01 Trade receivables (7,612) (28,249)
6.01.02.03 Other assets (45,195) 2,487
6.01.02.04 Judicial deposits 334 (3,054)
6.01.02.05 Social and labor obligations 14,605 8,074
6.01.02.06 Taxes recoverable (9,176) (13,242)
6.01.02.07 Trade payables (1,518) 9,650
6.01.02.08 Commission payable (9,130) (1,294)
6.01.02.09 Taxes payable (17,395) (10,062)
6.01.02.10 Other payables 224 (646)
6.01.03 Other (28,670) (35,543)
6.01.03.01 Interest paid (22,151) (15,404) 6.01.03.02 Income tax and social contribution paid (6,519) (20,139)
6.02 Net cash used in investing activities (51.209) (71,955)
6.02.01 Increase in capital of subsidiaries (23,005) (12,478)
6.02.02 Purchases of intangible assets (19,552) (44,754)
6.02.03 Acquisitions of subsidiaries, net of cash obtained - (217)
6.02.04 Dividends received 8,392 480
6.02.06 Value of fixed assets sold 696 311
6.02.08 Purchases of property, plant and equipment (17,740) (15,297)
6.03 Net cash used in financing activities (184,228) (121,470)
6.03.01 Payment of principal on loans and financing (82,858) -
6.03.03 Credit from related companies 432 (52)
6.03.04 Dividends paid (97,769) (143,700) 6.03.06 Treasury shares, net (4,033) 22,282
6.05 Increase (decrease) in cash and cash equivalents (117,843) (13,866)
6.05.01 Cash and cash equivalents at the beginning of the period 314,405 659,236
6.05.02 Cash and cash equivalents at the end of the period 196,562 645,370
(A free translation of the original in Portuguese)
10
Quarterly information (ITR) - 6/30/2016 - TOTVS S.A. Version: 1
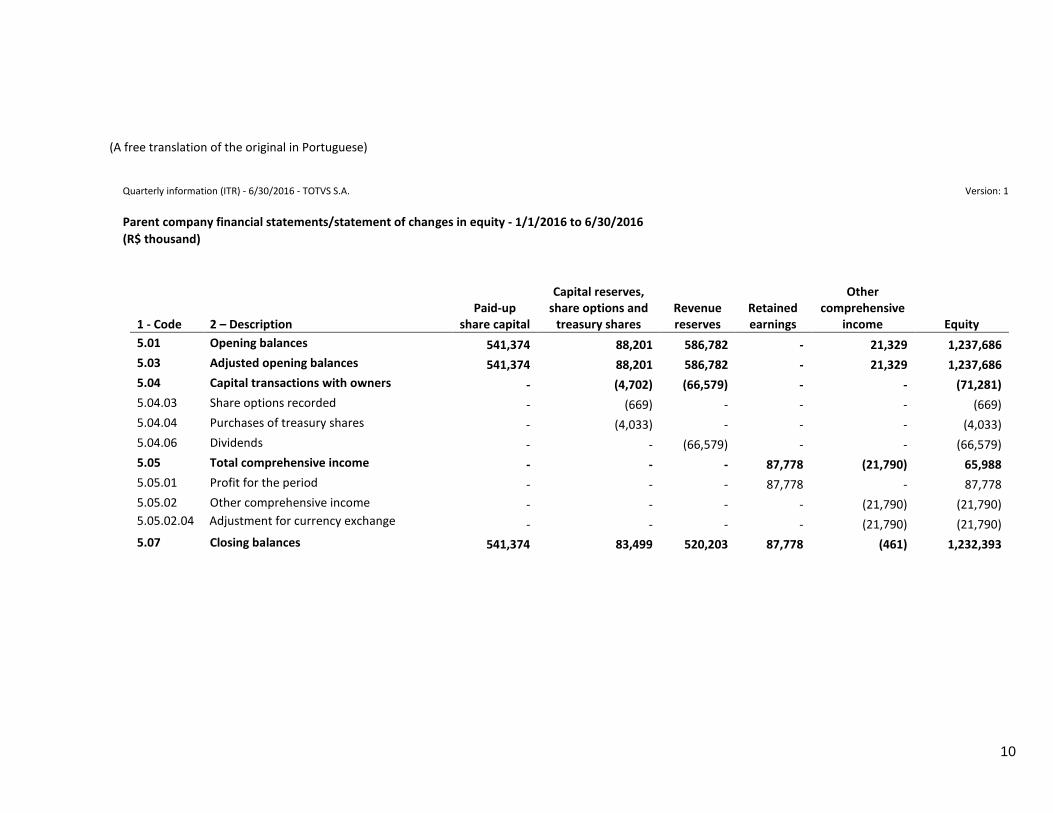
Parent company financial statements/statement of changes in equity - 1/1/2016 to 6/30/2016
(R$ thousand)
1 - Code 2 – Description Paid-up
share capital
Capital reserves, share options and
treasury shares Revenue reserves
Retained earnings
Other comprehensive
income Equity
5.01 Opening balances 541,374 88,201 586,782 - 21,329 1,237,686
5.03 Adjusted opening balances 541,374 88,201 586,782 - 21,329 1,237,686
5.04 Capital transactions with owners - (4,702) (66,579) - - (71,281)
5.04.03 Share options recorded - (669) - - - (669)
5.04.04 Purchases of treasury shares - (4,033) - - - (4,033)
5.04.06 Dividends - - (66,579) - - (66,579)
5.05 Total comprehensive income - - - 87,778 (21,790) 65,988
5.05.01 Profit for the period - - - 87,778 - 87,778
5.05.02 Other comprehensive income - - - - (21,790) (21,790) 5.05.02.04 Adjustment for currency exchange - - - - (21,790) (21,790)
5.07 Closing balances 541,374 83,499 520,203 87,778 (461) 1,232,393
(A free translation of the original in Portuguese)
11
Quarterly information (ITR) - 6/30/2016 - TOTVS S.A. Version: 1
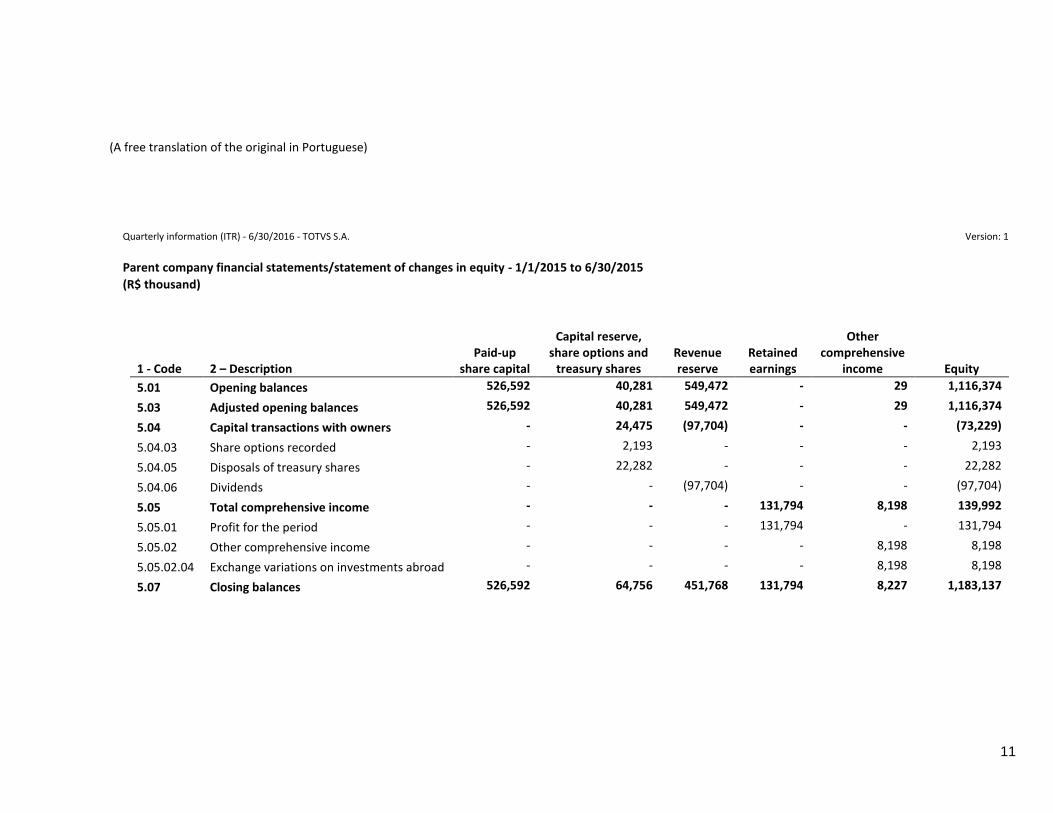
Parent company financial statements/statement of changes in equity - 1/1/2015 to 6/30/2015
(R$ thousand)
1 - Code 2 – Description Paid-up
share capital
Capital reserve, share options and
treasury shares Revenue reserve
Retained earnings
Other comprehensive
income Equity
5.01 Opening balances 526,592 40,281 549,472 - 29 1,116,374
5.03 Adjusted opening balances 526,592 40,281 549,472 - 29 1,116,374
5.04 Capital transactions with owners - 24,475 (97,704) - - (73,229)
5.04.03 Share options recorded - 2,193 - - - 2,193
5.04.05 Disposals of treasury shares - 22,282 - - - 22,282
5.04.06 Dividends - - (97,704) - - (97,704)
5.05 Total comprehensive income - - - 131,794 8,198 139,992
5.05.01 Profit for the period - - - 131,794 - 131,794
5.05.02 Other comprehensive income - - - - 8,198 8,198
5.05.02.04 Exchange variations on investments abroad - - - - 8,198 8,198
5.07 Closing balances 526,592 64,756 451,768 131,794 8,227 1,183,137
(A free translation of the original in Portuguese)
12
Quarterly information (ITR) - 6/30/2016 - TOTVS S.A. Version: 1
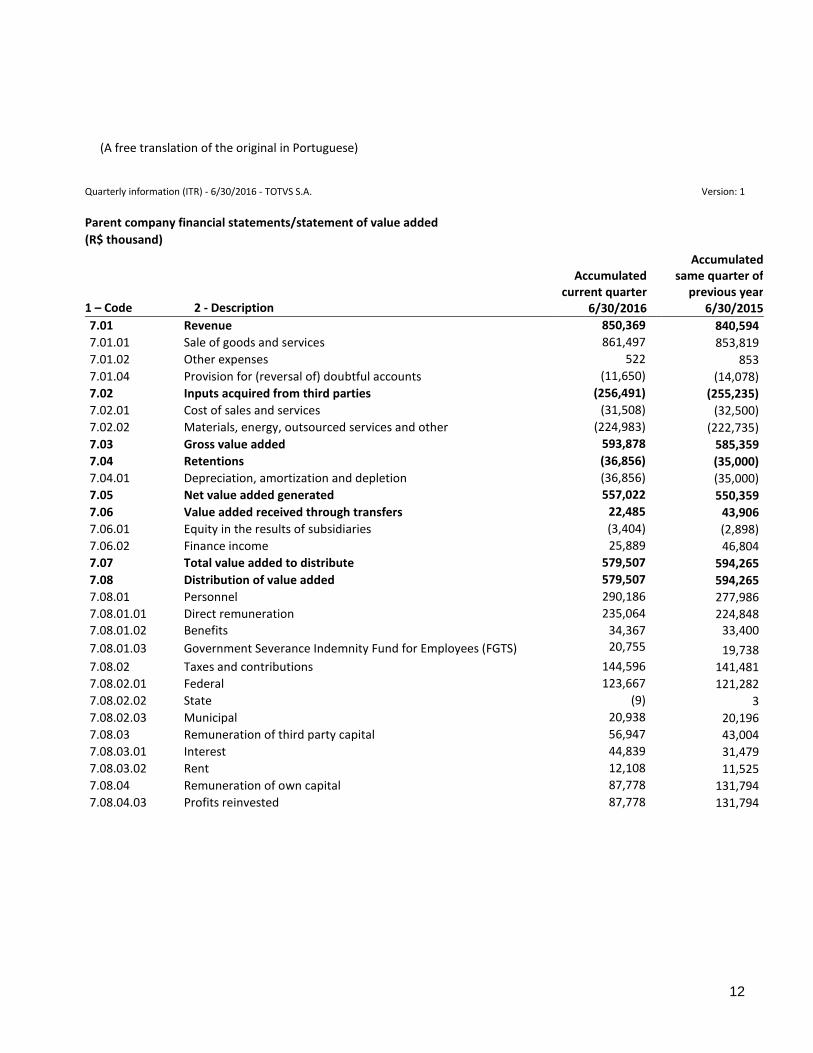
Parent company financial statements/statement of value added
(R$ thousand)
Accumulated current quarter
6/30/2016
Accumulated same quarter of
previous year 6/30/2015 1 – Code 2 - Description
7.01 Revenue 850,369 840,594
7.01.01 Sale of goods and services 861,497 853,819
7.01.02 Other expenses 522 853
7.01.04 Provision for (reversal of) doubtful accounts (11,650) (14,078)
7.02 Inputs acquired from third parties (256,491) (255,235)
7.02.01 Cost of sales and services (31,508) (32,500)
7.02.02 Materials, energy, outsourced services and other (224,983) (222,735)
7.03 Gross value added 593,878 585,359
7.04 Retentions (36,856) (35,000)
7.04.01 Depreciation, amortization and depletion (36,856) (35,000)
7.05 Net value added generated 557,022 550,359
7.06 Value added received through transfers 22,485 43,906
7.06.01 Equity in the results of subsidiaries (3,404) (2,898)
7.06.02 Finance income 25,889 46,804
7.07 Total value added to distribute 579,507 594,265
7.08 Distribution of value added 579,507 594,265
7.08.01 Personnel 290,186 277,986
7.08.01.01 Direct remuneration 235,064 224,848
7.08.01.02 Benefits 34,367 33,400
7.08.01.03 Government Severance Indemnity Fund for Employees (FGTS) 20,755 19,738
7.08.02 Taxes and contributions 144,596 141,481
7.08.02.01 Federal 123,667 121,282
7.08.02.02 State (9) 3
7.08.02.03 Municipal 20,938 20,196
7.08.03 Remuneration of third party capital 56,947 43,004
7.08.03.01 Interest 44,839 31,479
7.08.03.02 Rent 12,108 11,525
7.08.04 Remuneration of own capital 87,778 131,794
7.08.04.03 Profits reinvested 87,778 131,794
(A free translation of the original in Portuguese)
13
Quarterly information (ITR) - 6/30/2016 - TOTVS S.A. Version: 1
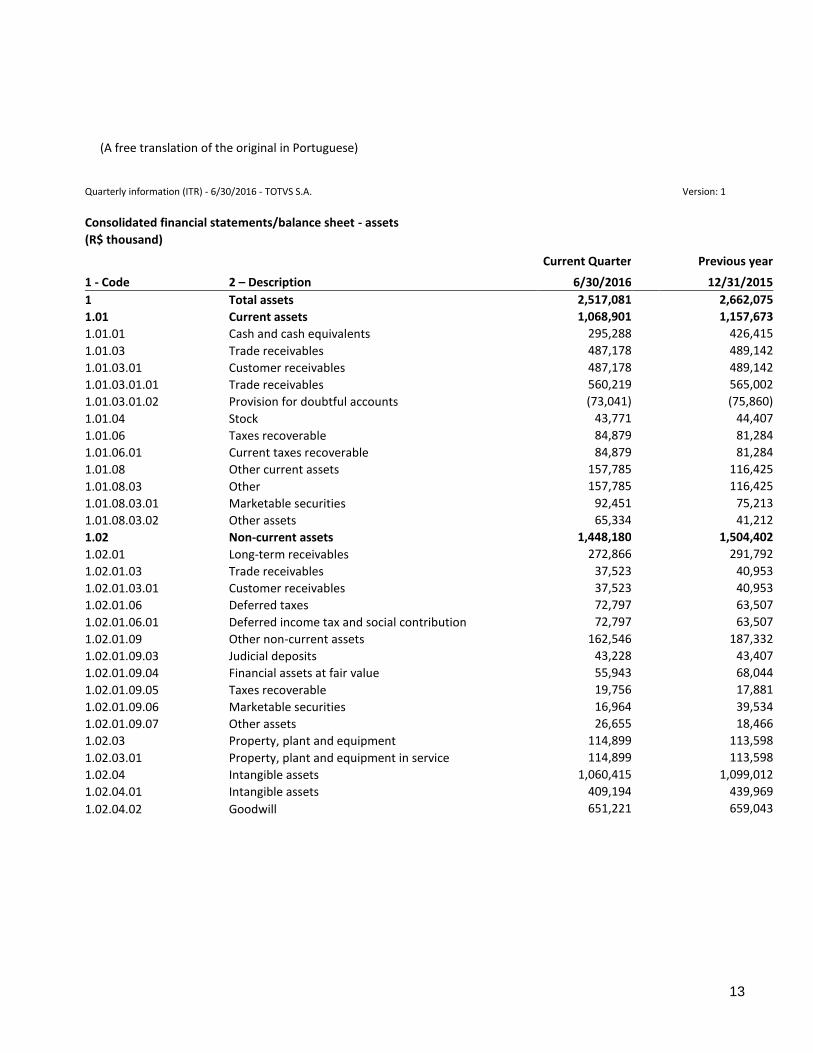
Consolidated financial statements/balance sheet - assets
(R$ thousand)
Current Quarter Previous year
1 - Code 2 – Description 6/30/2016 12/31/2015
1 Total assets 2,517,081 2,662,075
1.01 Current assets 1,068,901 1,157,673
1.01.01 Cash and cash equivalents 295,288 426,415
1.01.03 Trade receivables 487,178 489,142
1.01.03.01 Customer receivables 487,178 489,142
1.01.03.01.01 Trade receivables 560,219 565,002
1.01.03.01.02 Provision for doubtful accounts (73,041) (75,860)
1.01.04 Stock 43,771 44,407
1.01.06 Taxes recoverable 84,879 81,284
1.01.06.01 Current taxes recoverable 84,879 81,284
1.01.08 Other current assets 157,785 116,425
1.01.08.03 Other 157,785 116,425
1.01.08.03.01 Marketable securities 92,451 75,213
1.01.08.03.02 Other assets 65,334 41,212
1.02 Non-current assets 1,448,180 1,504,402
1.02.01 Long-term receivables 272,866 291,792
1.02.01.03 Trade receivables 37,523 40,953
1.02.01.03.01 Customer receivables 37,523 40,953
1.02.01.06 Deferred taxes 72,797 63,507
1.02.01.06.01 Deferred income tax and social contribution 72,797 63,507
1.02.01.09 Other non-current assets 162,546 187,332
1.02.01.09.03 Judicial deposits 43,228 43,407
1.02.01.09.04 Financial assets at fair value 55,943 68,044
1.02.01.09.05 Taxes recoverable 19,756 17,881
1.02.01.09.06 Marketable securities 16,964 39,534
1.02.01.09.07 Other assets 26,655 18,466
1.02.03 Property, plant and equipment 114,899 113,598
1.02.03.01 Property, plant and equipment in service 114,899 113,598
1.02.04 Intangible assets 1,060,415 1,099,012
1.02.04.01 Intangible assets 409,194 439,969
1.02.04.02 Goodwill 651,221 659,043
(A free translation of the original in Portuguese)
14
Quarterly information (ITR) - 6/30/2016 - TOTVS S.A. Version: 1
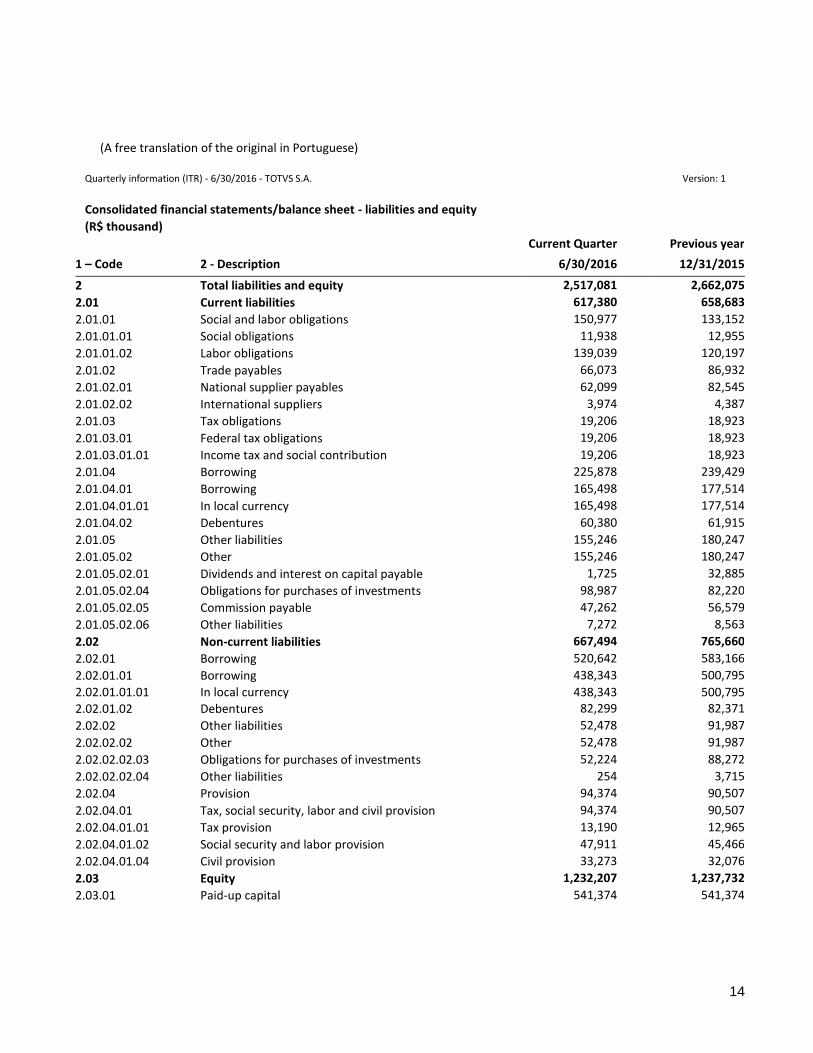
Consolidated financial statements/balance sheet - liabilities and equity
(R$ thousand)
Current Quarter Previous year
1 – Code 2 - Description 6/30/2016 12/31/2015
2 Total liabilities and equity 2,517,081 2,662,075
2.01 Current liabilities 617,380 658,683
2.01.01 Social and labor obligations 150,977 133,152
2.01.01.01 Social obligations 11,938 12,955
2.01.01.02 Labor obligations 139,039 120,197
2.01.02 Trade payables 66,073 86,932
2.01.02.01 National supplier payables 62,099 82,545
2.01.02.02 International suppliers 3,974 4,387
2.01.03 Tax obligations 19,206 18,923
2.01.03.01 Federal tax obligations 19,206 18,923
2.01.03.01.01 Income tax and social contribution 19,206 18,923
2.01.04 Borrowing 225,878 239,429
2.01.04.01 Borrowing 165,498 177,514
2.01.04.01.01 In local currency 165,498 177,514
2.01.04.02 Debentures 60,380 61,915
2.01.05 Other liabilities 155,246 180,247
2.01.05.02 Other 155,246 180,247
2.01.05.02.01 Dividends and interest on capital payable 1,725 32,885
2.01.05.02.04 Obligations for purchases of investments 98,987 82,220
2.01.05.02.05 Commission payable 47,262 56,579
2.01.05.02.06 Other liabilities 7,272 8,563
2.02 Non-current liabilities 667,494 765,660
2.02.01 Borrowing 520,642 583,166
2.02.01.01 Borrowing 438,343 500,795
2.02.01.01.01 In local currency 438,343 500,795
2.02.01.02 Debentures 82,299 82,371
2.02.02 Other liabilities 52,478 91,987
2.02.02.02 Other 52,478 91,987
2.02.02.02.03 Obligations for purchases of investments 52,224 88,272
2.02.02.02.04 Other liabilities 254 3,715
2.02.04 Provision 94,374 90,507
2.02.04.01 Tax, social security, labor and civil provision 94,374 90,507
2.02.04.01.01 Tax provision 13,190 12,965
2.02.04.01.02 Social security and labor provision 47,911 45,466
2.02.04.01.04 Civil provision 33,273 32,076
2.03 Equity 1,232,207 1,237,732
2.03.01 Paid-up capital 541,374 541,374
(A free translation of the original in Portuguese)
15
Quarterly information (ITR) - 6/30/2016 - TOTVS S.A. Version: 1
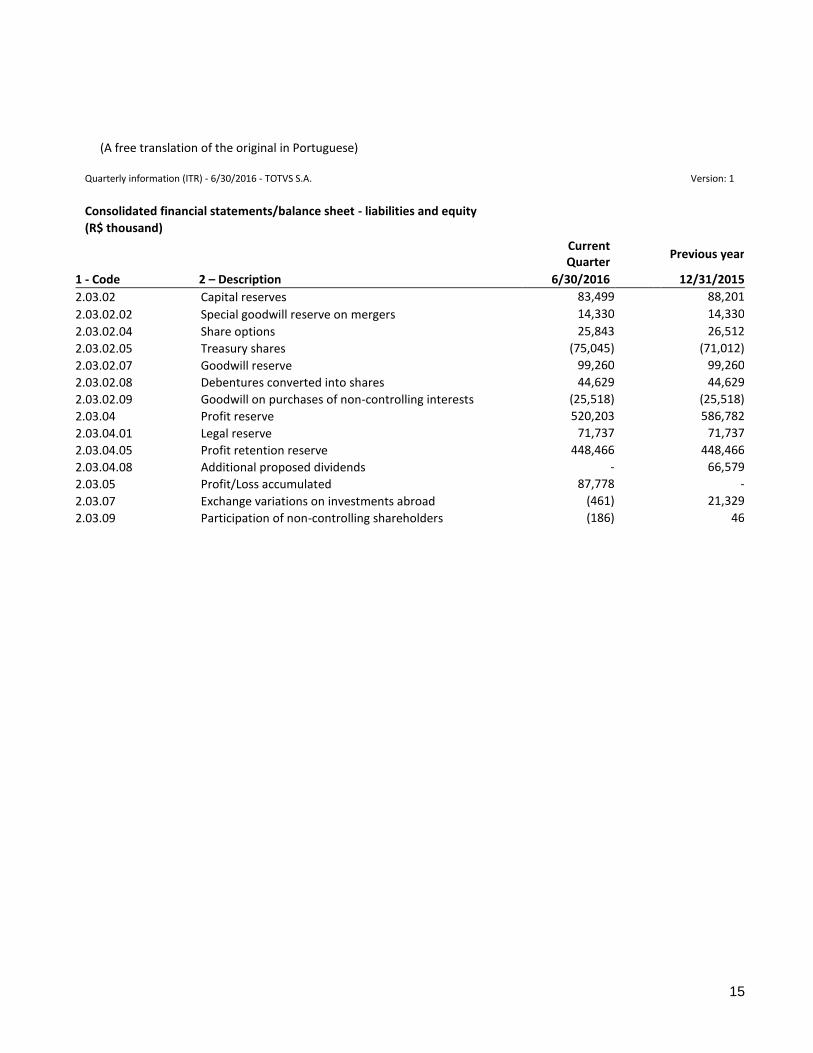
Consolidated financial statements/balance sheet - liabilities and equity
(R$ thousand)
Current Quarter
Previous year
1 - Code 2 – Description 6/30/2016 12/31/2015
2.03.02 Capital reserves 83,499 88,201
2.03.02.02 Special goodwill reserve on mergers 14,330 14,330
2.03.02.04 Share options 25,843 26,512
2.03.02.05 Treasury shares (75,045) (71,012)
2.03.02.07 Goodwill reserve 99,260 99,260
2.03.02.08 Debentures converted into shares 44,629 44,629
2.03.02.09 Goodwill on purchases of non-controlling interests (25,518) (25,518)
2.03.04 Profit reserve 520,203 586,782
2.03.04.01 Legal reserve 71,737 71,737
2.03.04.05 Profit retention reserve 448,466 448,466
2.03.04.08 Additional proposed dividends - 66,579
2.03.05 Profit/Loss accumulated 87,778 -
2.03.07 Exchange variations on investments abroad (461) 21,329
2.03.09 Participation of non-controlling shareholders (186) 46
(A free translation of the original in Portuguese)
16
Quarterly information (ITR) - 6/30/2016 - TOTVS S.A. Version: 1
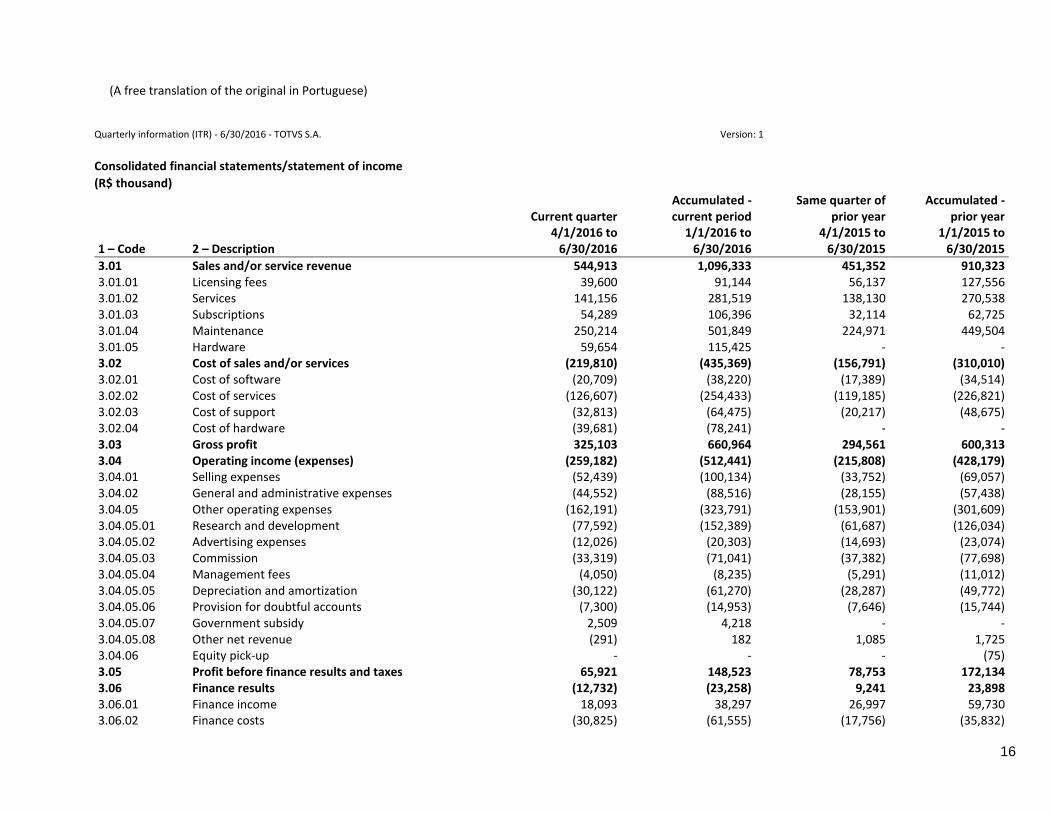
Consolidated financial statements/statement of income
(R$ thousand)
1 – Code 2 – Description
Current quarter 4/1/2016 to
6/30/2016
Accumulated - current period
1/1/2016 to 6/30/2016
Same quarter of prior year
4/1/2015 to 6/30/2015
Accumulated - prior year
1/1/2015 to 6/30/2015
3.01 Sales and/or service revenue 544,913 1,096,333 451,352 910,323 3.01.01 Licensing fees 39,600 91,144 56,137 127,556 3.01.02 Services 141,156 281,519 138,130 270,538 3.01.03 Subscriptions 54,289 106,396 32,114 62,725 3.01.04 Maintenance 250,214 501,849 224,971 449,504 3.01.05 Hardware 59,654 115,425 - - 3.02 Cost of sales and/or services (219,810) (435,369) (156,791) (310,010) 3.02.01 Cost of software (20,709) (38,220) (17,389) (34,514) 3.02.02 Cost of services (126,607) (254,433) (119,185) (226,821) 3.02.03 Cost of support (32,813) (64,475) (20,217) (48,675) 3.02.04 Cost of hardware (39,681) (78,241) - - 3.03 Gross profit 325,103 660,964 294,561 600,313 3.04 Operating income (expenses) (259,182) (512,441) (215,808) (428,179) 3.04.01 Selling expenses (52,439) (100,134) (33,752) (69,057) 3.04.02 General and administrative expenses (44,552) (88,516) (28,155) (57,438) 3.04.05 Other operating expenses (162,191) (323,791) (153,901) (301,609) 3.04.05.01 Research and development (77,592) (152,389) (61,687) (126,034) 3.04.05.02 Advertising expenses (12,026) (20,303) (14,693) (23,074) 3.04.05.03 Commission (33,319) (71,041) (37,382) (77,698) 3.04.05.04 Management fees (4,050) (8,235) (5,291) (11,012) 3.04.05.05 Depreciation and amortization (30,122) (61,270) (28,287) (49,772) 3.04.05.06 Provision for doubtful accounts (7,300) (14,953) (7,646) (15,744) 3.04.05.07 Government subsidy 2,509 4,218 - - 3.04.05.08 Other net revenue (291) 182 1,085 1,725 3.04.06 Equity pick-up - - - (75) 3.05 Profit before finance results and taxes 65,921 148,523 78,753 172,134 3.06 Finance results (12,732) (23,258) 9,241 23,898 3.06.01 Finance income 18,093 38,297 26,997 59,730 3.06.02 Finance costs (30,825) (61,555) (17,756) (35,832)
(A free translation of the original in Portuguese)
17
1 – Code 2 – Description
Current quarter 4/1/2016 to
6/30/2016
Accumulated - current period
1/1/2016 to 6/30/2016
Same quarter of prior year
4/1/2015 to 6/30/2015
Accumulated - prior year
1/1/2015 to 6/30/2015
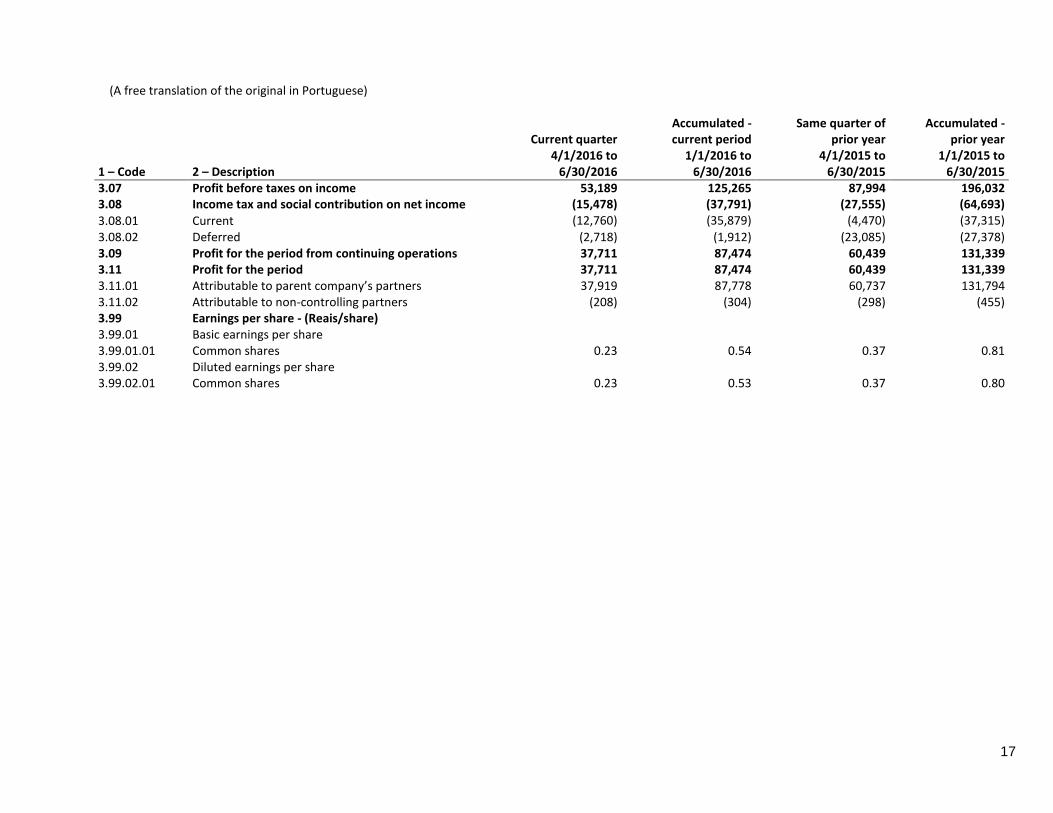
3.07 Profit before taxes on income 53,189 125,265 87,994 196,032 3.08 Income tax and social contribution on net income (15,478) (37,791) (27,555) (64,693)
3.08.01 Current (12,760) (35,879) (4,470) (37,315)
3.08.02 Deferred (2,718) (1,912) (23,085) (27,378) 3.09 Profit for the period from continuing operations 37,711 87,474 60,439 131,339 3.11 Profit for the period 37,711 87,474 60,439 131,339 3.11.01 Attributable to parent company’s partners 37,919 87,778 60,737 131,794 3.11.02 Attributable to non-controlling partners (208) (304) (298) (455) 3.99 Earnings per share - (Reais/share) 3.99.01 Basic earnings per share 3.99.01.01 Common shares 0.23 0.54 0.37 0.81 3.99.02 Diluted earnings per share 3.99.02.01 Common shares 0.23 0.53 0.37 0.80
(A free translation of the original in Portuguese)
18
Quarterly information (ITR) - 6/30/2016 - TOTVS S.A. Version: 1
Consolidated financial statements/statement of comprehensive income
(R$ thousand)
1 – Code 2 – Description
Current quarter
4/1/2016 to 6/30/2016
Accumulated - current period
1/1/2016 to 6/30/2016
Same quarter of prior year
4/1/2015 to 6/30/2015
Accumulated - prior year
1/1/2015 to 6/30/2015
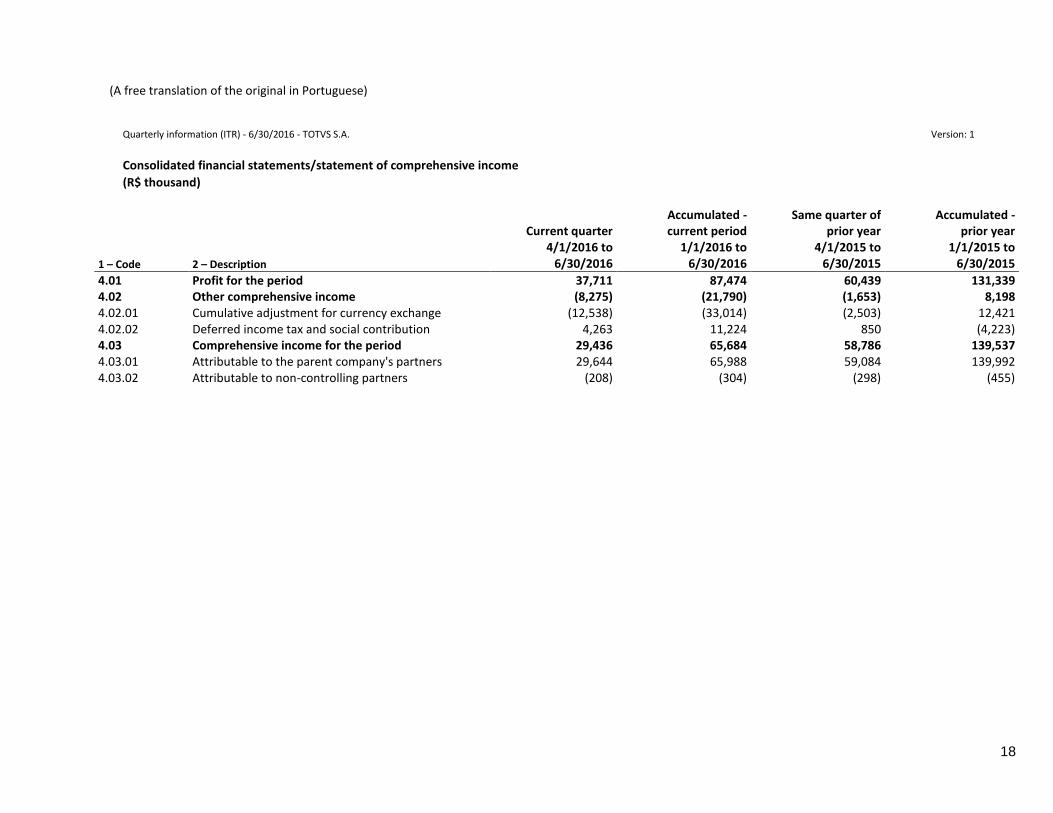
4.01 Profit for the period 37,711 87,474 60,439 131,339 4.02 Other comprehensive income (8,275) (21,790) (1,653) 8,198 4.02.01 Cumulative adjustment for currency exchange (12,538) (33,014) (2,503) 12,421 4.02.02 Deferred income tax and social contribution 4,263 11,224 850 (4,223) 4.03 Comprehensive income for the period 29,436 65,684 58,786 139,537 4.03.01 Attributable to the parent company's partners 29,644 65,988 59,084 139,992 4.03.02 Attributable to non-controlling partners (208) (304) (298) (455)
(A free translation of the original in Portuguese)
19
Quarterly information (ITR) - 6/30/2016 - TOTVS S.A. Version: 1
Consolidated financial statements/statement of cash flow - indirect method
(R$ thousand)
Accumulated current
quarter
Accumulated same quarter of previous
year 6/30/2015
1 – Code 2 - Description 6/30/2016
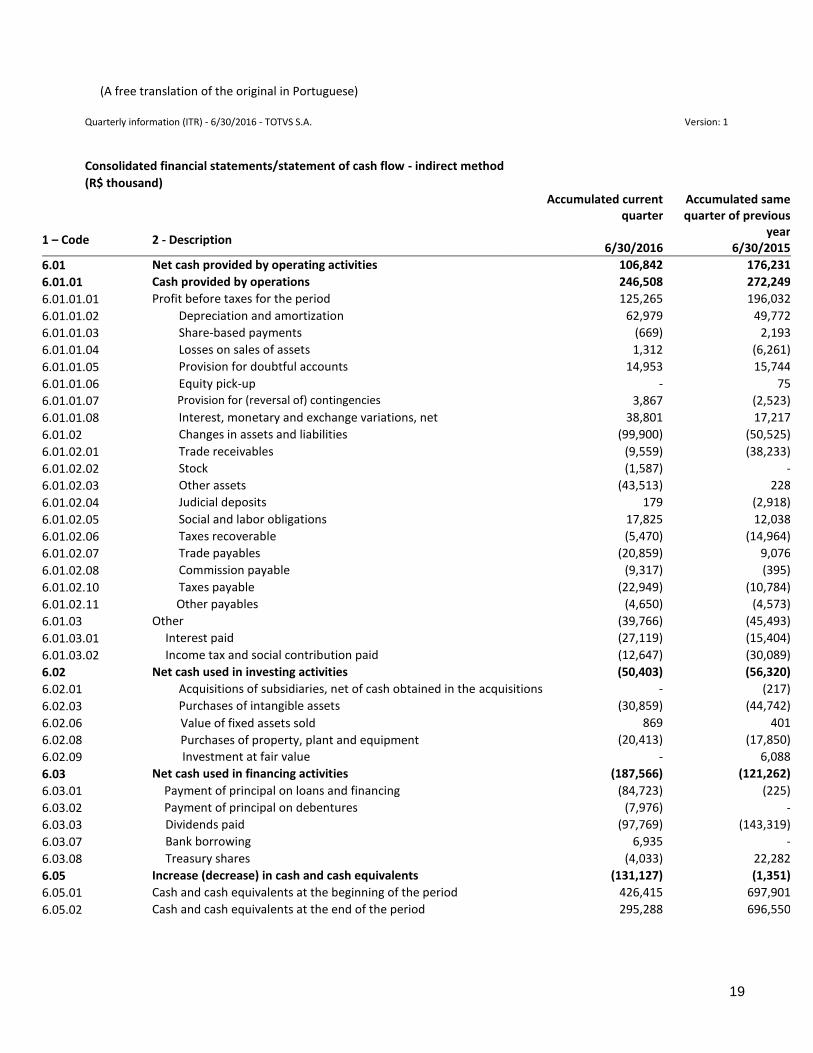
6.01 Net cash provided by operating activities 106,842 176,231
6.01.01 Cash provided by operations 246,508 272,249
6.01.01.01 Profit before taxes for the period 125,265 196,032
6.01.01.02 Depreciation and amortization 62,979 49,772
6.01.01.03 Share-based payments (669) 2,193
6.01.01.04 Losses on sales of assets 1,312 (6,261)
6.01.01.05 Provision for doubtful accounts 14,953 15,744
6.01.01.06 Equity pick-up - 75
6.01.01.07 Provision for (reversal of) contingencies 3,867 (2,523)
6.01.01.08 Interest, monetary and exchange variations, net 38,801 17,217
6.01.02 Changes in assets and liabilities (99,900) (50,525)
6.01.02.01 Trade receivables (9,559) (38,233)
6.01.02.02 Stock (1,587) -
6.01.02.03 Other assets (43,513) 228
6.01.02.04 Judicial deposits 179 (2,918)
6.01.02.05 Social and labor obligations 17,825 12,038
6.01.02.06 Taxes recoverable (5,470) (14,964)
6.01.02.07 Trade payables (20,859) 9,076
6.01.02.08 Commission payable (9,317) (395)
6.01.02.10 Taxes payable (22,949) (10,784)
6.01.02.11 Other payables (4,650) (4,573)
6.01.03 Other (39,766) (45,493)
6.01.03.01 Interest paid (27,119) (15,404)
6.01.03.02 Income tax and social contribution paid (12,647) (30,089)
6.02 Net cash used in investing activities (50,403) (56,320)
6.02.01 Acquisitions of subsidiaries, net of cash obtained in the acquisitions - (217)
6.02.03 Purchases of intangible assets (30,859) (44,742)
6.02.06 Value of fixed assets sold 869 401
6.02.08 Purchases of property, plant and equipment (20,413) (17,850)
6.02.09 Investment at fair value - 6,088
6.03 Net cash used in financing activities (187,566) (121,262)
6.03.01 Payment of principal on loans and financing (84,723) (225)
6.03.02 Payment of principal on debentures (7,976) -
6.03.03 Dividends paid (97,769) (143,319)
6.03.07 Bank borrowing 6,935 -
6.03.08 Treasury shares (4,033) 22,282
6.05 Increase (decrease) in cash and cash equivalents (131,127) (1,351)
6.05.01 Cash and cash equivalents at the beginning of the period 426,415 697,901
6.05.02 Cash and cash equivalents at the end of the period 295,288 696,550
(A free translation of the original in Portuguese)
20
Quarterly information (ITR) - 6/30/2016 - TOTVS S.A. Version: 1
Consolidated financial statements/statement of changes in equity - 1/1/2016 to 6/30/2016
(R$ thousand)
1 - Code 2 - Description
Paid-up share
capital
Capital reserves, share
options and treasury shares
Revenue reserves
Retained earnings
Other comprehensive
income Equity
Non-controlling interests
Consolidated equity
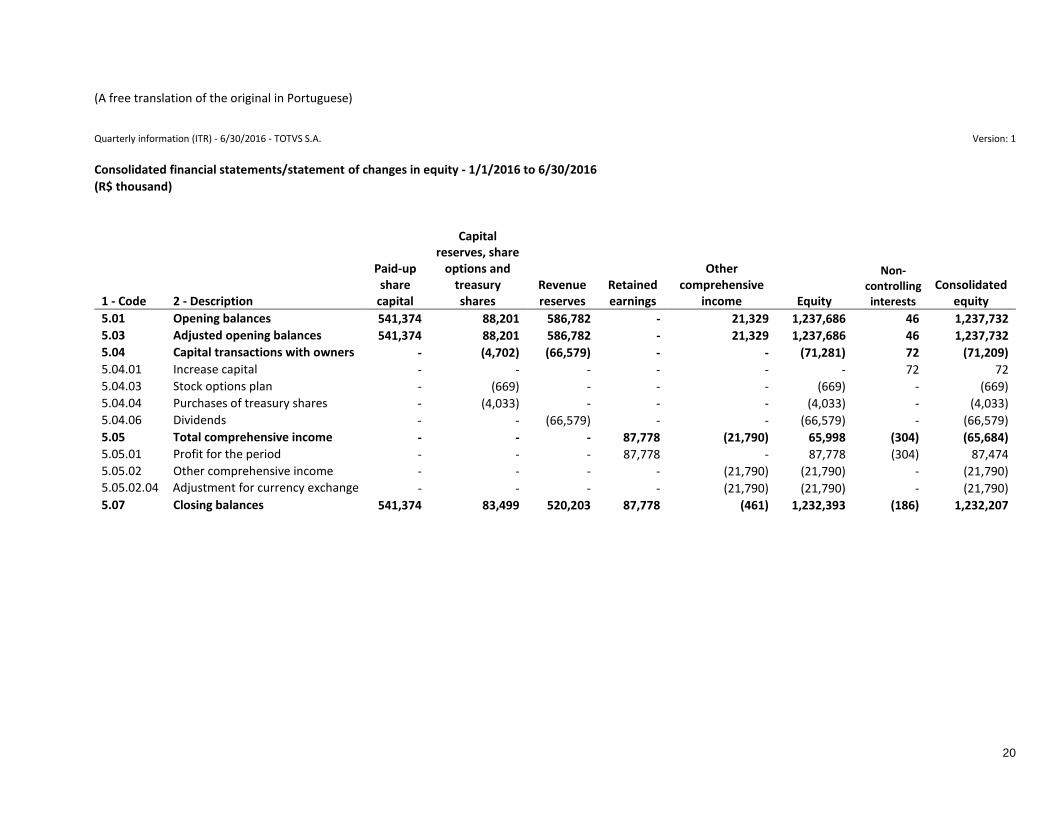
5.01 Opening balances 541,374 88,201 586,782 - 21,329 1,237,686 46 1,237,732
5.03 Adjusted opening balances 541,374 88,201 586,782 - 21,329 1,237,686 46 1,237,732
5.04 Capital transactions with owners - (4,702) (66,579) - - (71,281) 72 (71,209)
5.04.01 Increase capital - - - - - - 72 72
5.04.03 Stock options plan - (669) - - - (669) - (669)
5.04.04 Purchases of treasury shares - (4,033) - - - (4,033) - (4,033)
5.04.06 Dividends - - (66,579) - - (66,579) - (66,579)
5.05 Total comprehensive income - - - 87,778 (21,790) 65,998 (304) (65,684)
5.05.01 Profit for the period - - - 87,778 - 87,778 (304) 87,474
5.05.02 Other comprehensive income - - - - (21,790) (21,790) - (21,790) 5.05.02.04 Adjustment for currency exchange - - - - (21,790) (21,790) - (21,790)
5.07 Closing balances 541,374 83,499 520,203 87,778 (461) 1,232,393 (186) 1,232,207
(A free translation of the original in Portuguese)
21
Quarterly information (ITR) - 6/30/2016 - TOTVS S.A. Version: 1
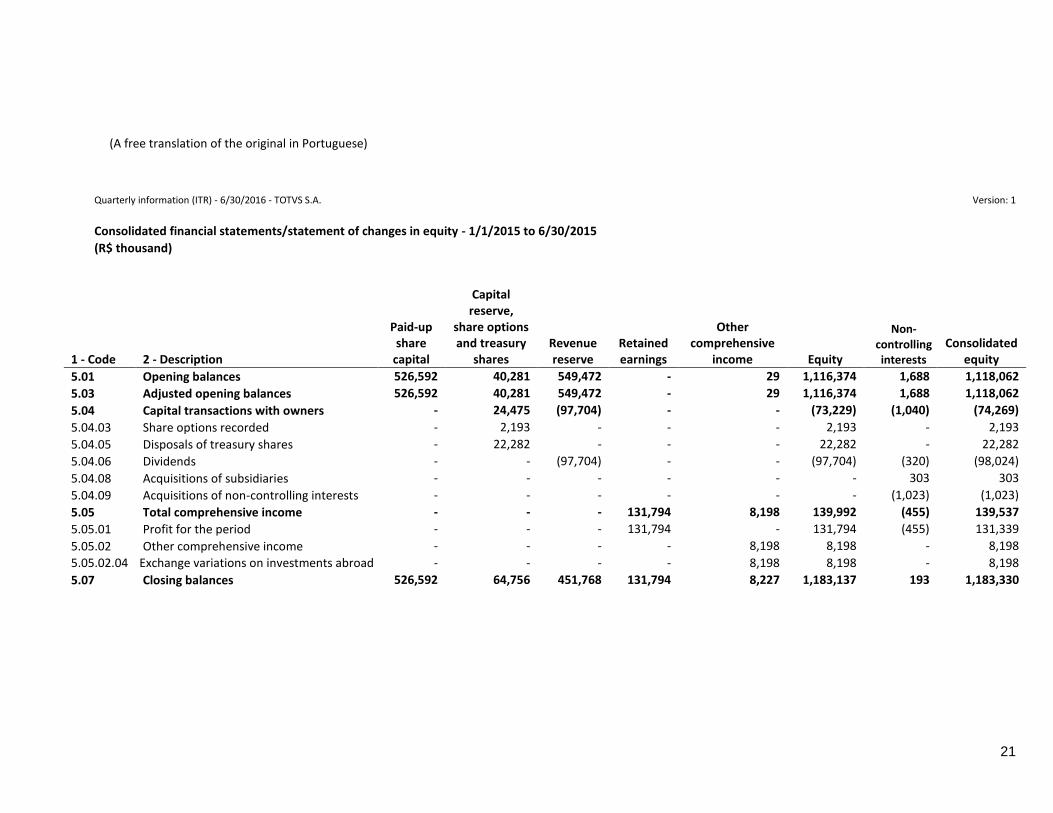
Consolidated financial statements/statement of changes in equity - 1/1/2015 to 6/30/2015
(R$ thousand)
1 - Code 2 - Description
Paid-up share
capital
Capital reserve,
share options and treasury
shares Revenue reserve
Retained earnings
Other comprehensive
income Equity
Non-controlling interests
Consolidated equity
5.01 Opening balances 526,592 40,281 549,472 - 29 1,116,374 1,688 1,118,062
5.03 Adjusted opening balances 526,592 40,281 549,472 - 29 1,116,374 1,688 1,118,062
5.04 Capital transactions with owners - 24,475 (97,704) - - (73,229) (1,040) (74,269)
5.04.03 Share options recorded - 2,193 - - - 2,193 - 2,193
5.04.05 Disposals of treasury shares - 22,282 - - - 22,282 - 22,282
5.04.06 Dividends - - (97,704) - - (97,704) (320) (98,024)
5.04.08 Acquisitions of subsidiaries - - - - - - 303 303
5.04.09 Acquisitions of non-controlling interests - - - - - - (1,023) (1,023)
5.05 Total comprehensive income - - - 131,794 8,198 139,992 (455) 139,537
5.05.01 Profit for the period - - - 131,794 - 131,794 (455) 131,339
5.05.02 Other comprehensive income - - - - 8,198 8,198 - 8,198
5.05.02.04 Exchange variations on investments abroad - - - - 8,198 8,198 - 8,198
5.07 Closing balances 526,592 64,756 451,768 131,794 8,227 1,183,137 193 1,183,330
(A free translation of the original in Portuguese)
22
Quarterly information (ITR) - 6/30/2016 - TOTVS S.A. Version: 1
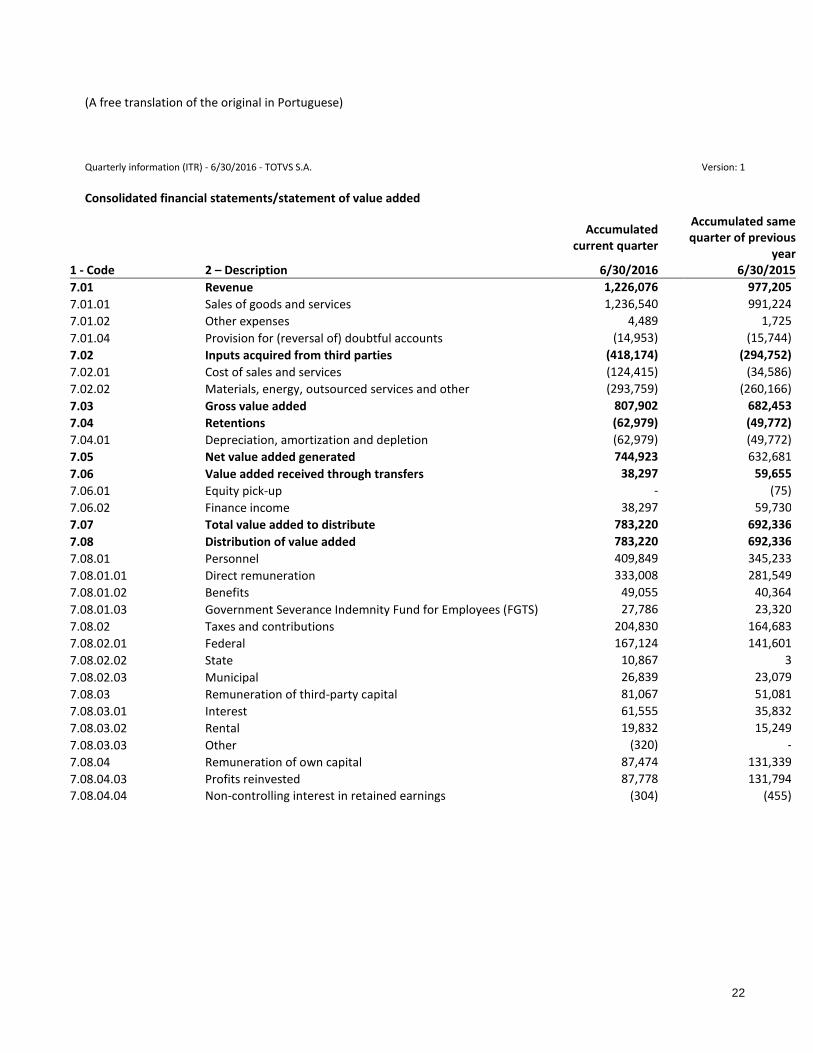
Consolidated financial statements/statement of value added
Accumulated
current quarter
Accumulated same quarter of previous
year 1 - Code 2 – Description 6/30/2016 6/30/2015
7.01 Revenue 1,226,076 977,205
7.01.01 Sales of goods and services 1,236,540 991,224
7.01.02 Other expenses 4,489 1,725
7.01.04 Provision for (reversal of) doubtful accounts (14,953) (15,744)
7.02 Inputs acquired from third parties (418,174) (294,752)
7.02.01 Cost of sales and services (124,415) (34,586)
7.02.02 Materials, energy, outsourced services and other (293,759) (260,166)
7.03 Gross value added 807,902 682,453
7.04 Retentions (62,979) (49,772)
7.04.01 Depreciation, amortization and depletion (62,979) (49,772)
7.05 Net value added generated 744,923 632,681
7.06 Value added received through transfers 38,297 59,655
7.06.01 Equity pick-up - (75)
7.06.02 Finance income 38,297 59,730
7.07 Total value added to distribute 783,220 692,336
7.08 Distribution of value added 783,220 692,336
7.08.01 Personnel 409,849 345,233
7.08.01.01 Direct remuneration 333,008 281,549
7.08.01.02 Benefits 49,055 40,364
7.08.01.03 Government Severance Indemnity Fund for Employees (FGTS) 27,786 23,320
7.08.02 Taxes and contributions 204,830 164,683
7.08.02.01 Federal 167,124 141,601
7.08.02.02 State 10,867 3
7.08.02.03 Municipal 26,839 23,079
7.08.03 Remuneration of third-party capital 81,067 51,081
7.08.03.01 Interest 61,555 35,832
7.08.03.02 Rental 19,832 15,249
7.08.03.03 Other (320) -
7.08.04 Remuneration of own capital 87,474 131,339
7.08.04.03 Profits reinvested 87,778 131,794
7.08.04.04 Non-controlling interest in retained earnings (304) (455)
(A free translation of the original in Portuguese)
23
Comments on performance Due to the corporate reorganization between TOTVS and Bematech in 2015, in addition to the comments described below, the figures for 2Q16 are impacted by the consolidation of Bematech’ s results. Net revenue totaled R$544,913 thousand in 2Q16, 20.7% growth over the previous year. This growth is mainly due to: (i) the Company's initiatives to capture the software market’s growth, including the segmentation of business solutions by industry and the fluig platform; (ii) the growth of recurring revenue from subscription; and (iii) the hardware revenue added as a result of the corporate reorganization between TOTVS and Bematech. License revenue decreased 29.5 % year on year, mainly reflecting the reduction in the number of sales and in the licensing average ticket. The reduction in license sales was mainly due to: (i) the downturn in economic activity in Brazil, which resulted in a longer period of conversion of the sales pipeline, especially among large clients; and (ii) the migration of part of the new clients sales pipeline to the subscription model, especially among smaller clients. The decrease in the average ticket was mainly due to the lower share of sales to large clients in the quarter. Service revenues grew 2.2% in 2Q16, and it was negatively affected by lower software implementation services for the period, as a result of lower sales observed in recent quarters. Subscription revenue increased 69.1% year on year and totaled R$54,289 thousand. This growth is due to the higher share of new sales to small and medium clients, especially under the TOTVS Intera commercial model. Maintenance revenue totaled R$250,214 thousand in 2Q16, a 11.2% growth over 2Q15, mainly as a result of the license sales in previous periods and the retention of maintenance contracts, annually adjusted based on inflation rates pre-defined, which in most cases is the IGP-M. Hardware revenue totaled R$59,654 thousand in 2Q16 and combined the sale of equipment and technical assistance services provided by the subsidiary Bematech. The cost of software increased 19.1% in 2Q16, when compared to the same quarter of 2015. The growth of the cost of software was mainly due to the higher share of complementary solutions provided by partners in the quarter. The cost of support grew 62.3% year on year, mainly due the investments being made in the customer service and assistance processes, involving adjustments to customer service routines, teams and systems of the Company. The cost of services increased 6.2% in 2Q16 when compared to the 2Q15. This growth, higher than the growth on net services revenue in the period, is mainly due to: (i) the lower allocation of implementation services professionals, chiefly due to the lower pace of software sales, specially licenses; and (ii) the collective wage adjustments made over the last 12 months, on average higher than those of the previous periods, due to the increase in inflation not fully passed on in software implementation projects sold.
(A free translation of the original in Portuguese)
24
The cost of hardware, which includes the cost of the equipment and technical assistance services provided by subsidiary Bematech, totaled R$39,681 thousand. It is worth mentioning that the hardware cost also includes the depreciation expense of R$857 thousand. Research and development expenses grew 25.8% on 2Q16, versus 2Q15. This growth results mainly from the collective wage adjustments made throughout the year. Advertising and marketing expenses decreased 18.2% in the quarter, when comparing year on year, and totaled R$12,026 thousand. The decrease is chiefly due to the revision of the general marketing plan of the Company, as well as the beginning of the marketing activities integration of TOTVS and Bematech. Selling expenses totaled R$52,439 thousand in 2Q16, a 55.4% growth over 2Q15, and the commissions expenses decreased 10.9% when comparing to 2Q15, totaling R$33,319 thousand. When taken together, the sum of these expenses reduced its representativeness across the total net revenue. These expenses are directly related to the sales mix through own units and franchises as well, as the net revenue mix due to the different levels of commissioning between revenue lines. General and administrative expenses increased 58.2% in 2Q16 to R$44,552 thousand. This growth is mainly due to the wage adjustments of the period, in addition to the consolidation of Bematech results already mentioned. Management fees declined 23.5% year on year, mainly due (i) to the optimization of the administrative structure of the Company; and (ii) the provision for bonus for achievement of financial and individual targets of executives in the period. Depreciation and amortization expenses in 2Q16 increased 6.5% year on year, mainly due to the purchase price allocation of the corporate reorganization with Bematech in 4Q15. Allowance for doubtful accounts in 2Q16 corresponded to 1.3%, compared to 1.7% on 2Q15. This allowance reflects the level of defaults observed in the business during the period. Considering the current level of defaults in the market, the Company will continue its credit analysis policy and its efforts to recover the debts already provisioned. The financial result (financial revenues net of financial expenses) amounted a net loss of R$12,732 thousand in 2Q16, compared to a positive result of R$9,241 thousand in 2Q15. This variation is largely due to the increase in net debt, explained by the reduction in financial income due to the payment of R$473.585 million in cash for the corporate restructuring with Bematech in 4Q15. Income tax and social contribution expenses decreased 43.8% in 2Q16, when compared to 2Q15. This reduction was mainly due to the decrease of net income before income tax and social contribution. Net income decreased 37.6% in 2Q16, largely due to: (i) the reduction of 16.3% of the earnings before financial effects and equity income; (ii) the negative financial results for the quarter; and (iii) the reduction of 43.8% in income tax and social contribution.
(A free translation of the original in Portuguese)
25
EBITDA (*) for the quarter totaled R$96,900 thousand, 9.5% lower than 2Q15. EBITDA margin (% of EBITDA over total net revenues) ended the quarter at 17.8%, compared to 23.7% in 2Q15, due to the events already described in previous reviews of each item.
(*) EBITDA ("Earnings before interest, taxes, depreciation and amortization") is a non-accounting measure used by the Company, calculated observing one of the suggestions of the CVM Circular 01/2007, consisting of the profit before taxes and contributions, the net financial result (income and interest expense), depreciation and amortization - EBITDA (Earnings before interest, taxes, depreciation and amortization).
(A free translation of the original in Portuguese)
26
Notes to the financial statements
1. Operations TOTVS S.A. (“parent company”, “TOTVS” or the “Company”) is a publicly-held corporation headquartered at Av. Braz Leme, 1631 - 2º floor, in the City and State of São Paulo, shares in which are traded on the Novo Mercado of BM&FBOVESPA – the Securities, Commodities and Futures Exchange. The Company’s business purpose is the development and sale of management software, productivity and collaboration platforms, as well as the provision of implementation, consulting, assistance and maintenance services. In 2015, with the corporate reorganization involving Bematech, the Company began to consolidate the industrialization and sale activities relating to hardware, combining specialized solutions in management systems, point of sale (POS), commercial automation, tax, e-commerce, mobility, payment methods solutions and the collaboration platform. The solutions offered by the Company and its subsidiaries are segmented according to economic sector, producing applications relevant to the business context of their clients, both in back-office processes and for the specific processes in each segment. TOTVS’ parent company and consolidated financial statements were approved at the Board of Directors’ Meeting held on August 1, 2016. All amounts presented in these interim financial statements are expressed in thousands of reais, except where otherwise indicated. Because the figures have been rounded, they may not add up precisely to their respective totals. Non-financial data included in this report, such as the number of clients, average tickets, market share, and other data items were not reviewed by our independent auditors.
2. Presentation of interim financial information and summary of accounting policies, assumptions and estimates
The principal accounting policies applied in preparing this interim financial information have been consistently applied to the periods presented. This interim financial information does not include all of the information required for annual or complete financial statements, and therefore should be read together with the Company’s complete financial statements for the year ended December 31, 2015.
2.1. Basis of preparation The financial statements were prepared using historical cost as the valuation basis, except for the valuation of certain assets and liabilities, such as financial instruments, which were measured at their fair value.
(A free translation of the original in Portuguese)
27
(a) Consolidated financial information
The consolidated financial statements were prepared in accordance with CPC 21 - R1 (IAS 34), which is applicable to the preparation of interim financial information, and in accordance with the accounting practices adopted in Brazil, including the standards issued by the Brazilian Securities Commission (CVM) applicable to ITRs. (b) Parent company financial information The parent company financial statements have been prepared in accordance with CPC 21(R1), applicable to the preparation of interim financial information, and in a manner consistent with the standards issued by the CVM applicable to ITRs, and are disclosed in conjunction with the consolidated financial statements. (c) Changes in accounting policies and disclosure requirements There are no new pronouncements or interpretations of CPCs/International Financial Reporting Standards (IFRS) effective from 2016 that could have a significant impact on the Company's interim financial information.
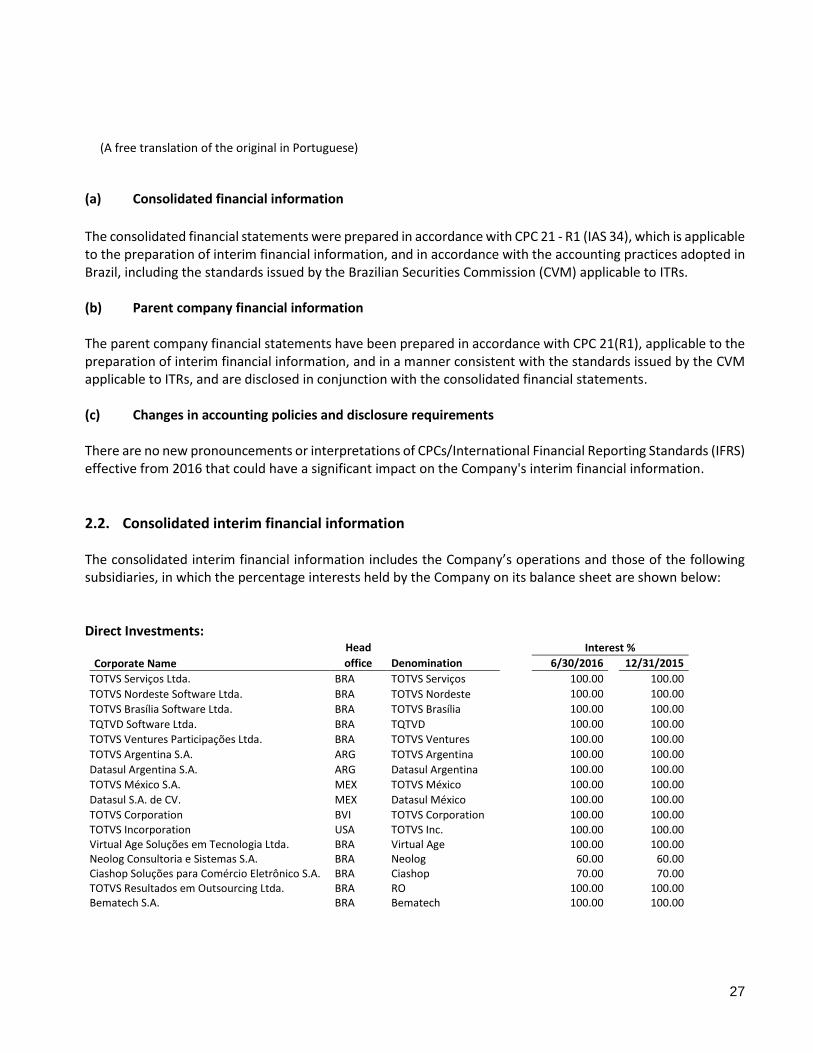
2.2. Consolidated interim financial information The consolidated interim financial information includes the Company’s operations and those of the following subsidiaries, in which the percentage interests held by the Company on its balance sheet are shown below: Direct Investments:
Head Interest %
Corporate Name office Denomination 6/30/2016 12/31/2015
TOTVS Serviços Ltda. BRA TOTVS Serviços 100.00 100.00
TOTVS Nordeste Software Ltda. BRA TOTVS Nordeste 100.00 100.00 TOTVS Brasília Software Ltda. BRA TOTVS Brasília 100.00 100.00 TQTVD Software Ltda. BRA TQTVD 100.00 100.00 TOTVS Ventures Participações Ltda. BRA TOTVS Ventures 100.00 100.00 TOTVS Argentina S.A. ARG TOTVS Argentina 100.00 100.00 Datasul Argentina S.A. ARG Datasul Argentina 100.00 100.00 TOTVS México S.A. MEX TOTVS México 100.00 100.00 Datasul S.A. de CV. MEX Datasul México 100.00 100.00 TOTVS Corporation BVI TOTVS Corporation 100.00 100.00 TOTVS Incorporation USA TOTVS Inc. 100.00 100.00 Virtual Age Soluções em Tecnologia Ltda. BRA Virtual Age 100.00 100.00 Neolog Consultoria e Sistemas S.A. BRA Neolog 60.00 60.00 Ciashop Soluções para Comércio Eletrônico S.A. BRA Ciashop 70.00 70.00 TOTVS Resultados em Outsourcing Ltda. BRA RO 100.00 100.00 Bematech S.A. BRA Bematech 100.00 100.00
(A free translation of the original in Portuguese)
28
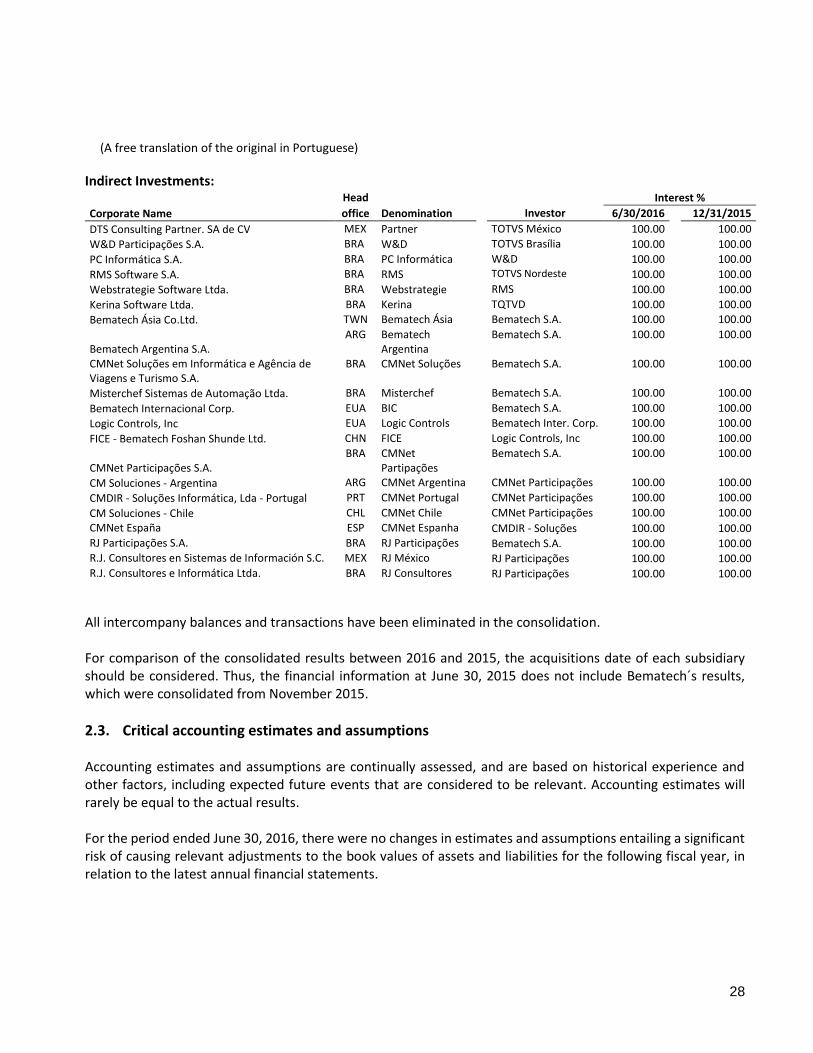
Indirect Investments: Head Interest %
Corporate Name office Denomination Investor 6/30/2016 12/31/2015
DTS Consulting Partner. SA de CV MEX Partner TOTVS México 100.00 100.00
W&D Participações S.A. BRA W&D TOTVS Brasília 100.00 100.00 PC Informática S.A. BRA PC Informática W&D 100.00 100.00 RMS Software S.A. BRA RMS TOTVS Nordeste 100.00 100.00 Webstrategie Software Ltda. BRA Webstrategie RMS 100.00 100.00 Kerina Software Ltda. BRA Kerina TQTVD 100.00 100.00
Bematech Ásia Co.Ltd. TWN Bematech Ásia Bematech S.A. 100.00 100.00
Bematech Argentina S.A. ARG Bematech
Argentina Bematech S.A. 100.00
100.00
CMNet Soluções em Informática e Agência de Viagens e Turismo S.A.
BRA CMNet Soluções Bematech S.A. 100.00
100.00
Misterchef Sistemas de Automação Ltda. BRA Misterchef Bematech S.A. 100.00 100.00 Bematech Internacional Corp. EUA BIC Bematech S.A. 100.00 100.00 Logic Controls, Inc EUA Logic Controls Bematech Inter. Corp. 100.00 100.00 FICE - Bematech Foshan Shunde Ltd. CHN FICE Logic Controls, Inc 100.00 100.00
CMNet Participações S.A. BRA CMNet
Partipações Bematech S.A. 100.00
100.00
CM Soluciones - Argentina ARG CMNet Argentina CMNet Participações 100.00 100.00 CMDIR - Soluções Informática, Lda - Portugal PRT CMNet Portugal CMNet Participações 100.00 100.00 CM Soluciones - Chile CHL CMNet Chile CMNet Participações 100.00 100.00 CMNet España ESP CMNet Espanha CMDIR - Soluções 100.00 100.00 RJ Participações S.A. BRA RJ Participações Bematech S.A. 100.00 100.00 R.J. Consultores en Sistemas de Información S.C. MEX RJ México RJ Participações 100.00 100.00 R.J. Consultores e Informática Ltda. BRA RJ Consultores RJ Participações 100.00 100.00
All intercompany balances and transactions have been eliminated in the consolidation. For comparison of the consolidated results between 2016 and 2015, the acquisitions date of each subsidiary should be considered. Thus, the financial information at June 30, 2015 does not include Bematech´s results, which were consolidated from November 2015.
2.3. Critical accounting estimates and assumptions
Accounting estimates and assumptions are continually assessed, and are based on historical experience and other factors, including expected future events that are considered to be relevant. Accounting estimates will rarely be equal to the actual results. For the period ended June 30, 2016, there were no changes in estimates and assumptions entailing a significant risk of causing relevant adjustments to the book values of assets and liabilities for the following fiscal year, in relation to the latest annual financial statements.
(A free translation of the original in Portuguese)
29
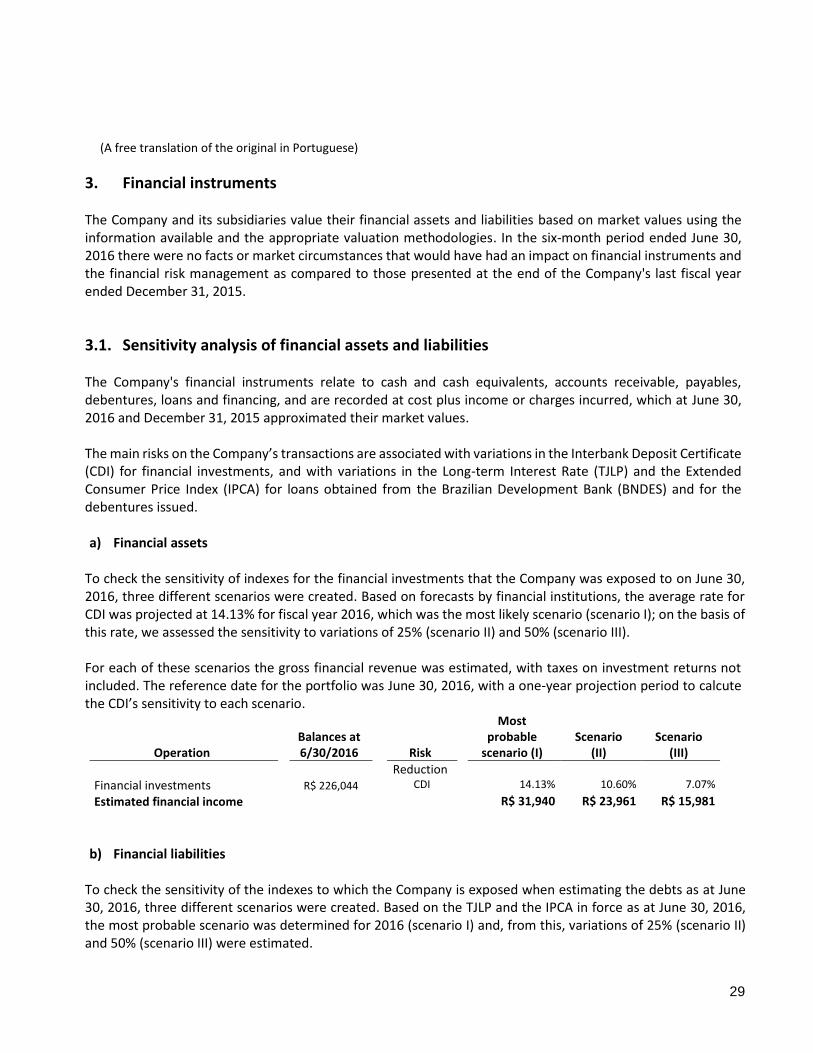
3. Financial instruments The Company and its subsidiaries value their financial assets and liabilities based on market values using the information available and the appropriate valuation methodologies. In the six-month period ended June 30, 2016 there were no facts or market circumstances that would have had an impact on financial instruments and the financial risk management as compared to those presented at the end of the Company's last fiscal year ended December 31, 2015.
3.1. Sensitivity analysis of financial assets and liabilities The Company's financial instruments relate to cash and cash equivalents, accounts receivable, payables, debentures, loans and financing, and are recorded at cost plus income or charges incurred, which at June 30, 2016 and December 31, 2015 approximated their market values. The main risks on the Company’s transactions are associated with variations in the Interbank Deposit Certificate (CDI) for financial investments, and with variations in the Long-term Interest Rate (TJLP) and the Extended Consumer Price Index (IPCA) for loans obtained from the Brazilian Development Bank (BNDES) and for the debentures issued. a) Financial assets
To check the sensitivity of indexes for the financial investments that the Company was exposed to on June 30, 2016, three different scenarios were created. Based on forecasts by financial institutions, the average rate for CDI was projected at 14.13% for fiscal year 2016, which was the most likely scenario (scenario I); on the basis of this rate, we assessed the sensitivity to variations of 25% (scenario II) and 50% (scenario III). For each of these scenarios the gross financial revenue was estimated, with taxes on investment returns not included. The reference date for the portfolio was June 30, 2016, with a one-year projection period to calcute the CDI’s sensitivity to each scenario.
Operation Balances at 6/30/2016 Risk
Most probable
scenario (I) Scenario
(II) Scenario
(III)
Reduction Financial investments R$ 226,044 CDI 14.13% 10.60% 7.07%
Estimated financial income R$ 31,940 R$ 23,961 R$ 15,981
b) Financial liabilities
To check the sensitivity of the indexes to which the Company is exposed when estimating the debts as at June 30, 2016, three different scenarios were created. Based on the TJLP and the IPCA in force as at June 30, 2016, the most probable scenario was determined for 2016 (scenario I) and, from this, variations of 25% (scenario II) and 50% (scenario III) were estimated.
(A free translation of the original in Portuguese)
30
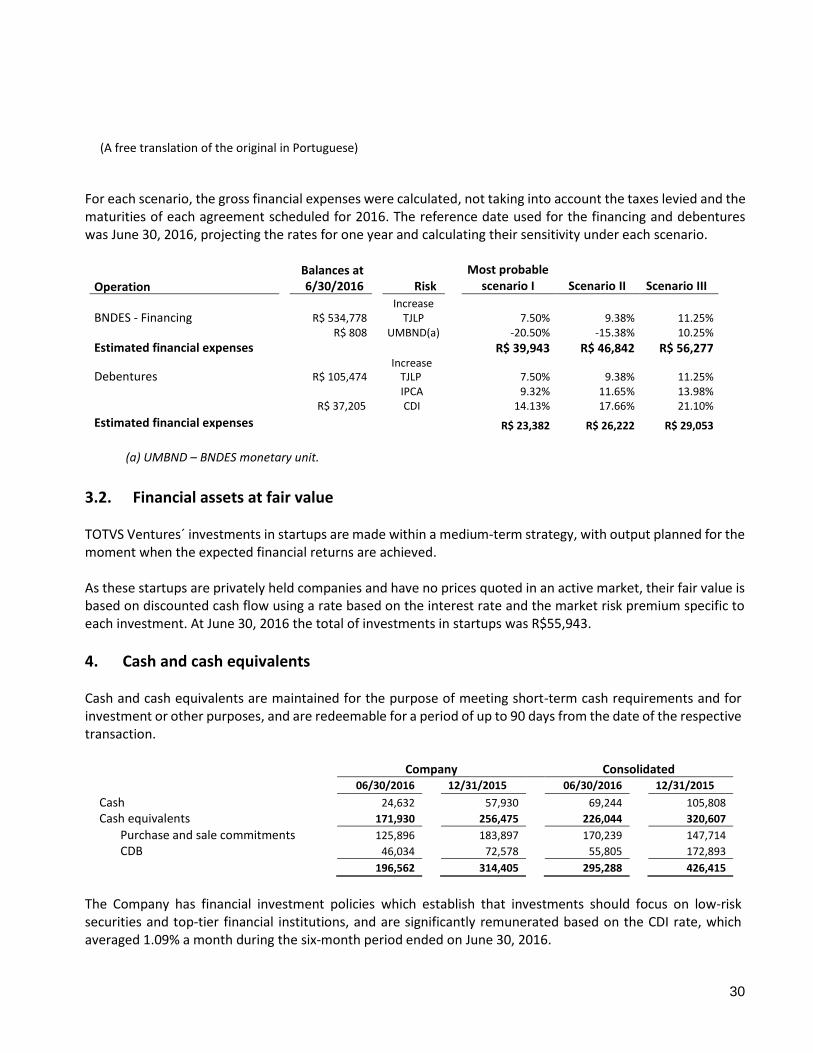
For each scenario, the gross financial expenses were calculated, not taking into account the taxes levied and the maturities of each agreement scheduled for 2016. The reference date used for the financing and debentures was June 30, 2016, projecting the rates for one year and calculating their sensitivity under each scenario.
Operation
Balances at 6/30/2016 Risk
Most probable scenario I Scenario II Scenario III
Increase BNDES - Financing R$ 534,778 TJLP 7.50% 9.38% 11.25% R$ 808 UMBND(a) -20.50% -15.38% 10.25%
Estimated financial expenses R$ 39,943 R$ 46,842 R$ 56,277 Increase Debentures R$ 105,474 TJLP 7.50% 9.38% 11.25% IPCA 9.32% 11.65% 13.98% R$ 37,205 CDI 14.13% 17.66% 21.10%
Estimated financial expenses R$ 23,382 R$ 26,222 R$ 29,053
(a) UMBND – BNDES monetary unit.
3.2. Financial assets at fair value TOTVS Ventures´ investments in startups are made within a medium-term strategy, with output planned for the moment when the expected financial returns are achieved. As these startups are privately held companies and have no prices quoted in an active market, their fair value is based on discounted cash flow using a rate based on the interest rate and the market risk premium specific to each investment. At June 30, 2016 the total of investments in startups was R$55,943.
4. Cash and cash equivalents Cash and cash equivalents are maintained for the purpose of meeting short-term cash requirements and for investment or other purposes, and are redeemable for a period of up to 90 days from the date of the respective transaction.
Company Consolidated
06/30/2016 12/31/2015 06/30/2016 12/31/2015
Cash 24,632 57,930 69,244 105,808
Cash equivalents 171,930 256,475 226,044 320,607
Purchase and sale commitments 125,896 183,897 170,239 147,714
CDB 46,034 72,578 55,805 172,893
196,562 314,405 295,288 426,415
The Company has financial investment policies which establish that investments should focus on low-risk securities and top-tier financial institutions, and are significantly remunerated based on the CDI rate, which averaged 1.09% a month during the six-month period ended on June 30, 2016.
(A free translation of the original in Portuguese)
31
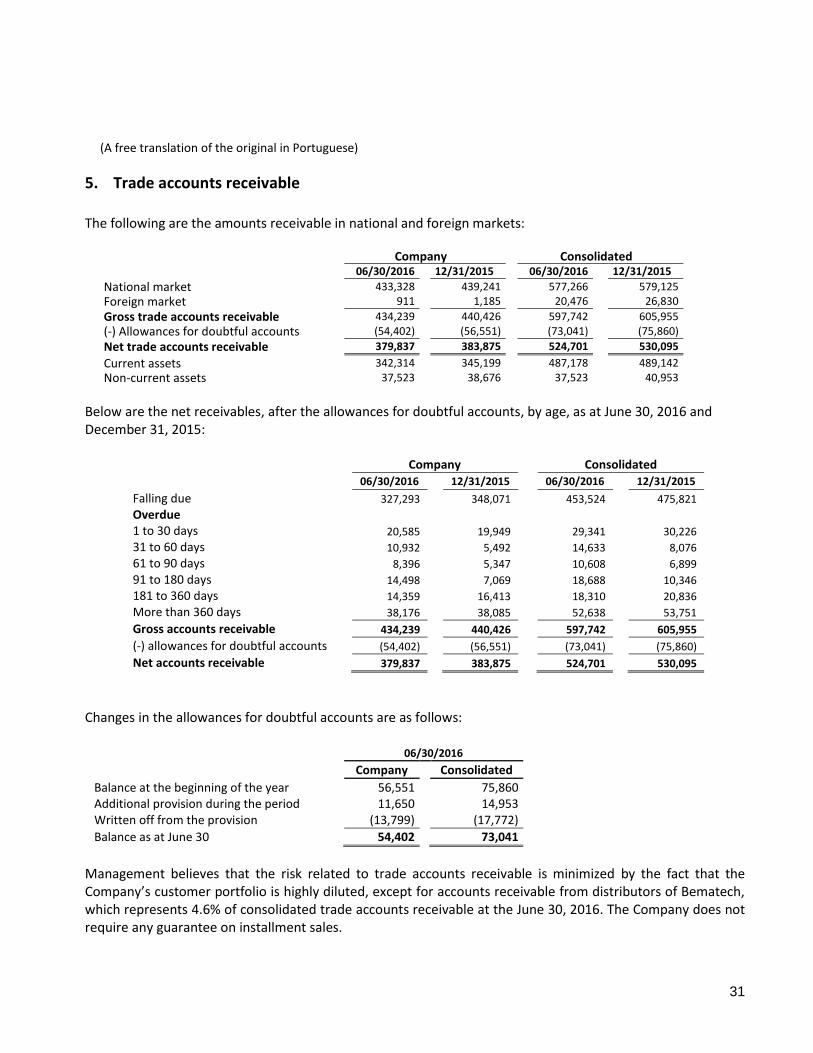
5. Trade accounts receivable
The following are the amounts receivable in national and foreign markets:
Company Consolidated 06/30/2016 12/31/2015 06/30/2016 12/31/2015
National market 433,328 439,241 577,266 579,125
Foreign market 911 1,185 20,476 26,830
Gross trade accounts receivable 434,239 440,426 597,742 605,955
(-) Allowances for doubtful accounts (54,402) (56,551) (73,041) (75,860)
Net trade accounts receivable 379,837 383,875 524,701 530,095
Current assets 342,314 345,199 487,178 489,142
Non-current assets 37,523 38,676 37,523 40,953
Below are the net receivables, after the allowances for doubtful accounts, by age, as at June 30, 2016 and December 31, 2015:
Company Consolidated
06/30/2016 12/31/2015 06/30/2016 12/31/2015
Falling due 327,293 348,071 453,524 475,821
Overdue
1 to 30 days 20,585 19,949 29,341 30,226
31 to 60 days 10,932 5,492 14,633 8,076
61 to 90 days 8,396 5,347 10,608 6,899
91 to 180 days 14,498 7,069 18,688 10,346
181 to 360 days 14,359 16,413 18,310 20,836
More than 360 days 38,176 38,085 52,638 53,751
Gross accounts receivable 434,239 440,426 597,742 605,955
(-) allowances for doubtful accounts (54,402) (56,551) (73,041) (75,860)
Net accounts receivable 379,837 383,875 524,701 530,095
Changes in the allowances for doubtful accounts are as follows:
06/30/2016
Company Consolidated
Balance at the beginning of the year 56,551 75,860 Additional provision during the period 11,650 14,953 Written off from the provision (13,799) (17,772)
Balance as at June 30 54,402 73,041
Management believes that the risk related to trade accounts receivable is minimized by the fact that the Company’s customer portfolio is highly diluted, except for accounts receivable from distributors of Bematech, which represents 4.6% of consolidated trade accounts receivable at the June 30, 2016. The Company does not require any guarantee on installment sales.
(A free translation of the original in Portuguese)
32
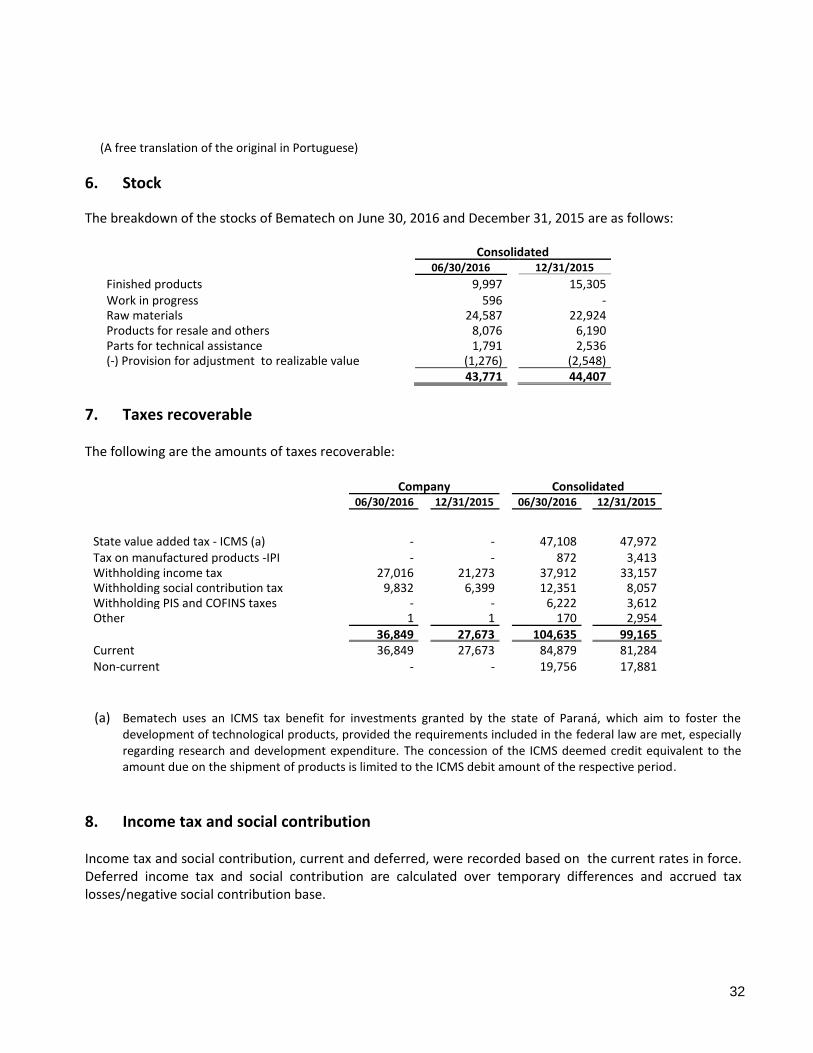
6. Stock
The breakdown of the stocks of Bematech on June 30, 2016 and December 31, 2015 are as follows:
Consolidated Consolidated 06/30/2016 12/31/2015
Finished products 9,997 15,305 Work in progress 596 - Raw materials 24,587 22,924 Products for resale and others 8,076 6,190 Parts for technical assistance 1,791 2,536 (-) Provision for adjustment to realizable value (1,276) (2,548)
43,771 44,407
7. Taxes recoverable The following are the amounts of taxes recoverable:
Company Consolidated 06/30/2016 12/31/2015 06/30/2016 12/31/2015
State value added tax - ICMS (a) - -
47,108 47,972 Tax on manufactured products -IPI - - 872 3,413 Withholding income tax 27,016 21,273 37,912
33,157
33,157 Withholding social contribution tax 9,832 6,399 12,351 8,057 Withholding PIS and COFINS taxes - - 6,222 3,612 Other 1 1 170 2,954
36,849 27,673 104,635 99,165 Current 36,849 27,673 84,879 81,284 Non-current - - 19,756 17,881
(a) Bematech uses an ICMS tax benefit for investments granted by the state of Paraná, which aim to foster the development of technological products, provided the requirements included in the federal law are met, especially regarding research and development expenditure. The concession of the ICMS deemed credit equivalent to the amount due on the shipment of products is limited to the ICMS debit amount of the respective period.
8. Income tax and social contribution Income tax and social contribution, current and deferred, were recorded based on the current rates in force. Deferred income tax and social contribution are calculated over temporary differences and accrued tax losses/negative social contribution base.
(A free translation of the original in Portuguese)
33
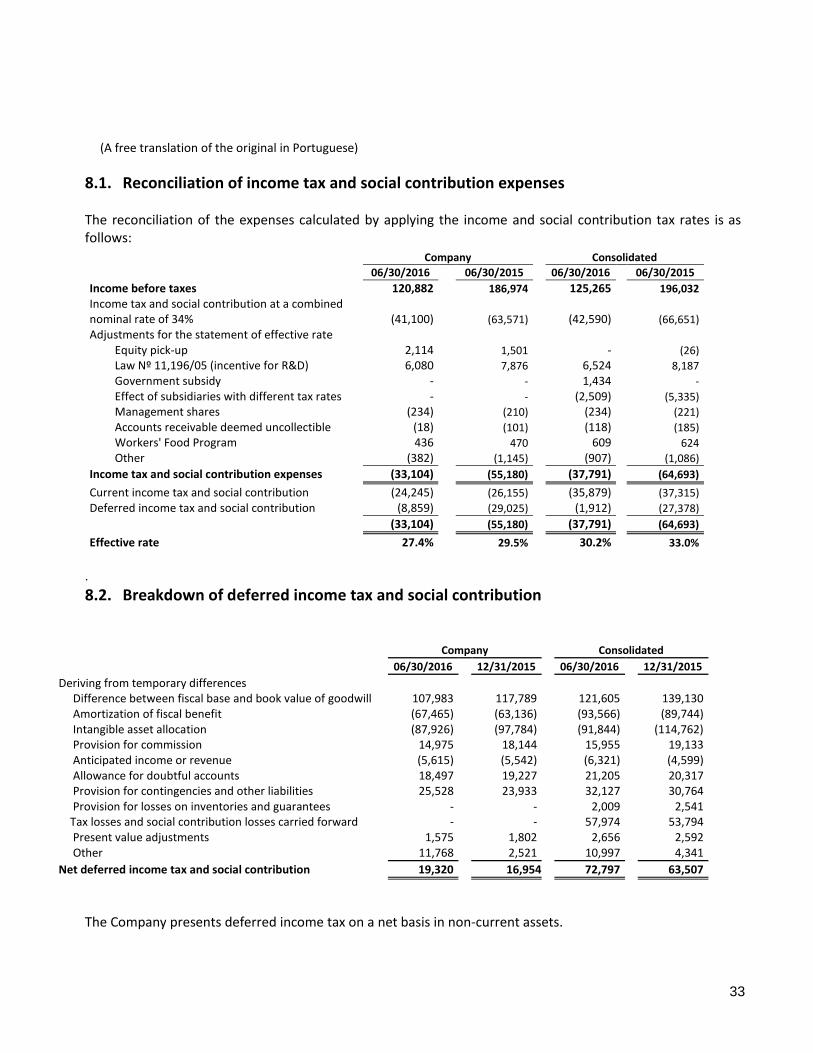
8.1. Reconciliation of income tax and social contribution expenses The reconciliation of the expenses calculated by applying the income and social contribution tax rates is as follows:
Company Consolidated
06/30/2016 06/30/2015 06/30/2016 06/30/2015
Income before taxes 120,882 186,974 125,265 196,032
Income tax and social contribution at a combined nominal rate of 34% (41,100) (63,571) (42,590) (66,651)
Adjustments for the statement of effective rate
Equity pick-up 2,114 1,501 - (26)
Law Nº 11,196/05 (incentive for R&D) 6,080 7,876 6,524 8,187
Government subsidy - - 1,434 -
Effect of subsidiaries with different tax rates - - (2,509) (5,335)
Management shares (234) (210) (234) (221)
Accounts receivable deemed uncollectible (18) (101) (118) (185)
Workers' Food Program 436 470 609 624
Other (382) (1,145) (907) (1,086)
Income tax and social contribution expenses (33,104) (55,180) (37,791) (64,693)
Current income tax and social contribution (24,245) (26,155) (35,879) (37,315)
Deferred income tax and social contribution (8,859) (29,025) (1,912) (27,378)
(33,104) (55,180) (37,791) (64,693)
Effective rate 27.4% 29.5% 30.2% 33.0%
.
8.2. Breakdown of deferred income tax and social contribution
Company Consolidated
06/30/2016 12/31/2015 06/30/2016 12/31/2015
Deriving from temporary differences Difference between fiscal base and book value of goodwill 107,983 117,789 121,605 139,130 Amortization of fiscal benefit (67,465) (63,136) (93,566) (89,744) Intangible asset allocation (87,926) (97,784) (91,844) (114,762) Provision for commission 14,975 18,144 15,955 19,133 Anticipated income or revenue (5,615) (5,542) (6,321) (4,599) Allowance for doubtful accounts 18,497 19,227 21,205 20,317 Provision for contingencies and other liabilities 25,528 23,933 32,127 30,764
Provision for losses on inventories and guarantees - - 2,009 2,541 Tax losses and social contribution losses carried forward - - 57,974 53,794 Present value adjustments 1,575 1,802 2,656 2,592 Other 11,768 2,521 10,997 4,341
Net deferred income tax and social contribution 19,320 16,954 72,797 63,507
The Company presents deferred income tax on a net basis in non-current assets.
(A free translation of the original in Portuguese)
34
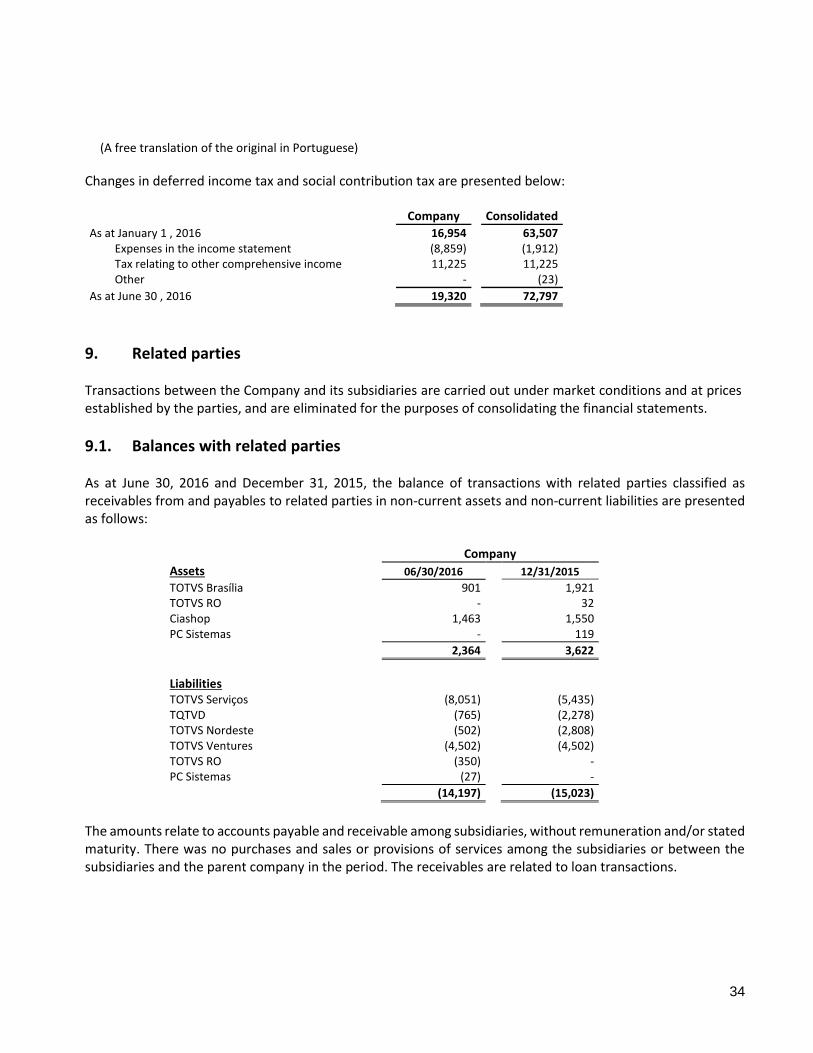
Changes in deferred income tax and social contribution tax are presented below: Company Consolidated
As at January 1 , 2016 16,954 63,507 Expenses in the income statement (8,859) (1,912) Tax relating to other comprehensive income 11,225 11,225 Other - (23)
As at June 30 , 2016 19,320 72,797
9. Related parties Transactions between the Company and its subsidiaries are carried out under market conditions and at prices established by the parties, and are eliminated for the purposes of consolidating the financial statements.
9.1. Balances with related parties As at June 30, 2016 and December 31, 2015, the balance of transactions with related parties classified as receivables from and payables to related parties in non-current assets and non-current liabilities are presented as follows:
Company
Assets 06/30/2016 12/31/2015
TOTVS Brasília 901 1,921 TOTVS RO - 32 Ciashop 1,463 1,550 PC Sistemas - 119
2,364 3,622
Liabilities
TOTVS Serviços (8,051) (5,435) TQTVD (765) (2,278) TOTVS Nordeste (502) (2,808) TOTVS Ventures (4,502) (4,502) TOTVS RO (350) - PC Sistemas (27) -
(14,197) (15,023)
The amounts relate to accounts payable and receivable among subsidiaries, without remuneration and/or stated maturity. There was no purchases and sales or provisions of services among the subsidiaries or between the subsidiaries and the parent company in the period. The receivables are related to loan transactions.
(A free translation of the original in Portuguese)
35
9.2. Transactions or relationships with shareholders and key management personnel
a) Shareholders
The Company has property lease agreements with companies, some of which are owned by shareholders of TOTVS. Rental paid was R$4,448 for the period ended June 30, 2016 (R$ 4,502 for the period ended June 30, 2015), which is in line with market rates. The rental agreements are effective for 60 months, and are adjusted by the General Price Index – Market rate every 12 months. In addition to these lease agreements, the Company signed an agreement with VIP VII – Empreendimentos e Participações Ltda., a company formed by some shareholders and also direct and indirect members of TOTVS’ Board of Directors, that is, a related party of the group, to build and lease the new head office, with the purpose of integrating the company’s facilities in the city of São Paulo, for at least ten years from the date of delivery, which is expected in March 2017. The estimated amount for the payment of rents in the first ten years is R$206,266, agreed under usual market conditions. Further information about this contract is available in the press release issued on October 16, 2013. Some of the Company’s shareholders and also directors directly or indirectly held a total of 17.6% of the Company’s shares as at June 30, 2016 (17.4% as at December 31,2015). The indirect interest is held through LC-EH Empreendimentos e Participações S.A. The Company and its subsidiary Bematech also have loans and financing operations (Note 14) and debentures (Note 15), transactions which are carried out with BNDES, which held 4.49% of the Company's capital on June 30, 2016.
b) Key management personnel
Itaú Unibanco is a related party to the Company through one of the independent members on its Board of Directors. Amounts and transactions involving the companies of the Itaú Unibanco Group on June 30, 2016 corresponded to R$21,524 (R$29,156 on December 31, 2015) of financial investments, R$821 (R$817 on June 30, 2015) related to contracts of guarantee, stock management, insurance policies and other matters, and R$3,974 (R$4,225 on June 30, 2015) related to contracts for the transfer of the rights to use systems and technical support provided by TOTVS. All contracts are in accordance with usual market conditions. The Company has a non-onerous contract relating to the management of its pension plan with Itaú Vida e Previdência S.A.
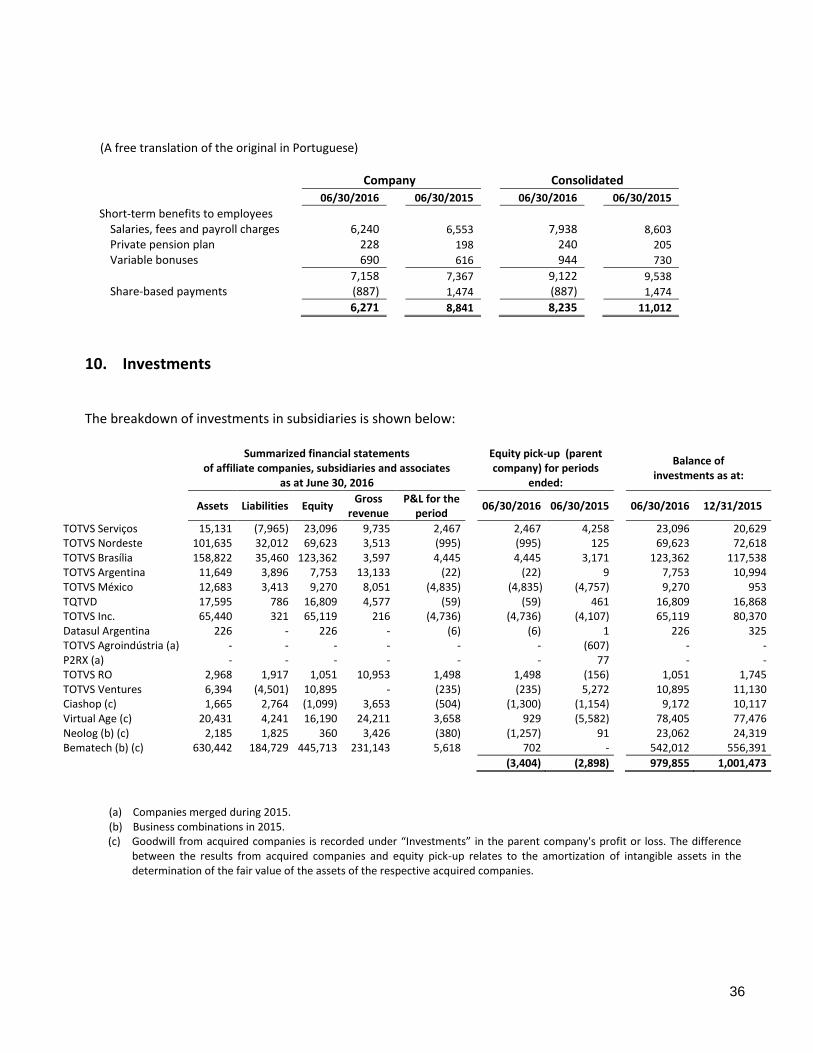
9.3. Management fees Expenses relating to the compensation of the senior executives and management of the Company and its subsidiaries are summarized below:
(A free translation of the original in Portuguese)
36
Company Consolidated
06/30/2016 06/30/2015 06/30/2016 06/30/2015
Short-term benefits to employees Salaries, fees and payroll charges 6,240 6,553 7,938 8,603
Private pension plan 228 198 240 205
Variable bonuses 690 616 944 730
7,158 7,367 9,122 9,538
Share-based payments (887) 1,474 (887) 1,474
6,271 8,841 8,235 11,012
10. Investments The breakdown of investments in subsidiaries is shown below:
Summarized financial statements of affiliate companies, subsidiaries and associates
as at June 30, 2016
Equity pick-up (parent company) for periods
ended:
Balance of investments as at:
Assets Liabilities Equity Gross
revenue P&L for the
period 06/30/2016 06/30/2015 06/30/2016 12/31/2015
TOTVS Serviços 15,131 (7,965) 23,096 9,735 2,467 2,467 4,258 23,096 20,629 TOTVS Nordeste 101,635 32,012 69,623 3,513 (995) (995) 125 69,623 72,618 TOTVS Brasília 158,822 35,460 123,362 3,597 4,445 4,445 3,171 123,362 117,538 TOTVS Argentina 11,649 3,896 7,753 13,133 (22) (22) 9 7,753 10,994 TOTVS México 12,683 3,413 9,270 8,051 (4,835) (4,835) (4,757) 9,270 953 TQTVD 17,595 786 16,809 4,577 (59) (59) 461 16,809 16,868 TOTVS Inc. 65,440 321 65,119 216 (4,736) (4,736) (4,107) 65,119 80,370 Datasul Argentina 226 - 226 - (6) (6) 1 226 325 TOTVS Agroindústria (a) - - - - - - (607) - - P2RX (a) - - - - - - 77 - - TOTVS RO 2,968 1,917 1,051 10,953 1,498 1,498 (156) 1,051 1,745 TOTVS Ventures 6,394 (4,501) 10,895 - (235) (235) 5,272 10,895 11,130 Ciashop (c) 1,665 2,764 (1,099) 3,653 (504) (1,300) (1,154) 9,172 10,117 Virtual Age (c) 20,431 4,241 16,190 24,211 3,658 929 (5,582) 78,405 77,476 Neolog (b) (c) 2,185 1,825 360 3,426 (380) (1,257) 91 23,062 24,319 Bematech (b) (c) 630,442 184,729 445,713 231,143 5,618 702 - 542,012 556,391
(3,404) (2,898) 979,855 1,001,473
(a) Companies merged during 2015. (b) Business combinations in 2015. (c) Goodwill from acquired companies is recorded under “Investments” in the parent company's profit or loss. The difference
between the results from acquired companies and equity pick-up relates to the amortization of intangible assets in the determination of the fair value of the assets of the respective acquired companies.
(A free translation of the original in Portuguese)
37
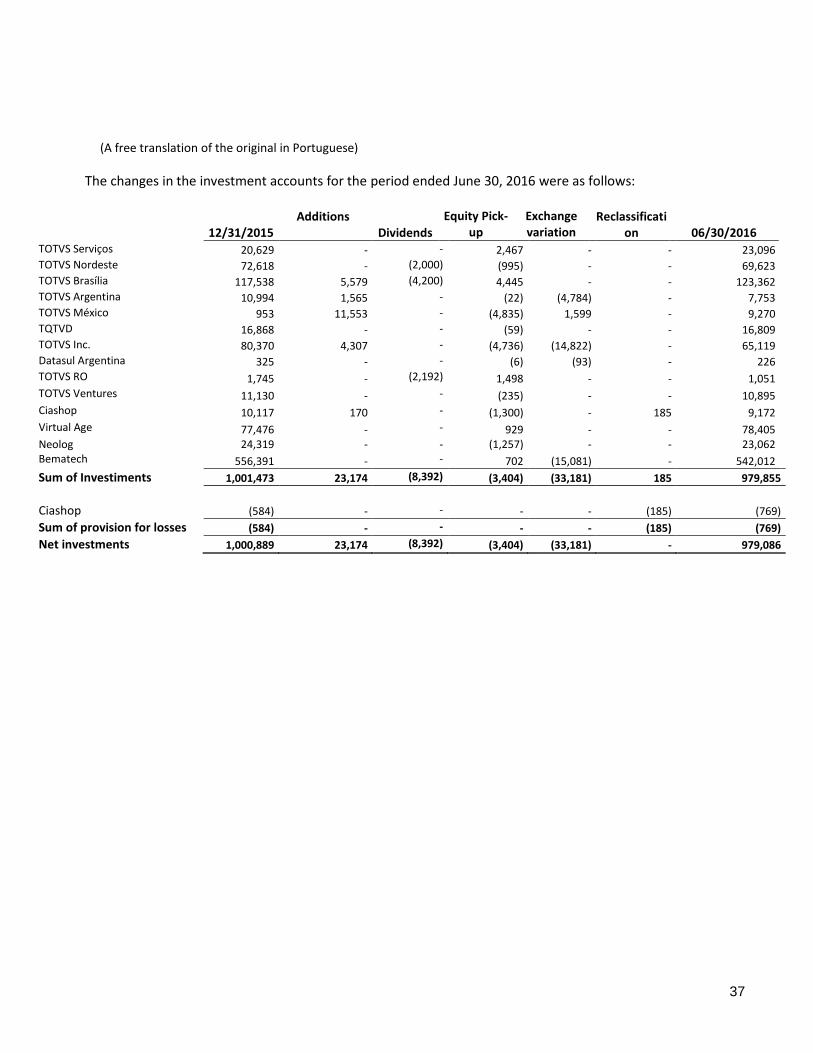
The changes in the investment accounts for the period ended June 30, 2016 were as follows:
12/31/2015
Additions Dividends
Equity Pick-up
Exchange variation
Reclassification 06/30/2016
TOTVS Serviços 20,629 - - 2,467 - - 23,096 TOTVS Nordeste 72,618 - (2,000) (995) - - 69,623 TOTVS Brasília 117,538 5,579 (4,200) 4,445 - - 123,362 TOTVS Argentina 10,994 1,565 - (22) (4,784) - 7,753 TOTVS México 953 11,553 - (4,835) 1,599 - 9,270 TQTVD 16,868 - - (59) - - 16,809 TOTVS Inc. 80,370 4,307 - (4,736) (14,822) - 65,119 Datasul Argentina 325 - - (6) (93) - 226 TOTVS RO 1,745 - (2,192) 1,498 - - 1,051 TOTVS Ventures 11,130 - - (235) - - 10,895 Ciashop 10,117 170 - (1,300) - 185 9,172 Virtual Age 77,476 - - 929 - - 78,405 Neolog 24,319 - - (1,257) - - 23,062 Bematech 556,391 - - 702 (15,081) - 542,012
Sum of Investiments 1,001,473 23,174 (8,392) (3,404) (33,181) 185 979,855
Ciashop (584) - - - - (185) (769)
Sum of provision for losses (584) - - - - (185) (769)
Net investments 1,000,889 23,174 (8,392) (3,404) (33,181) - 979,086
(A free translation of the original in Portuguese)
38
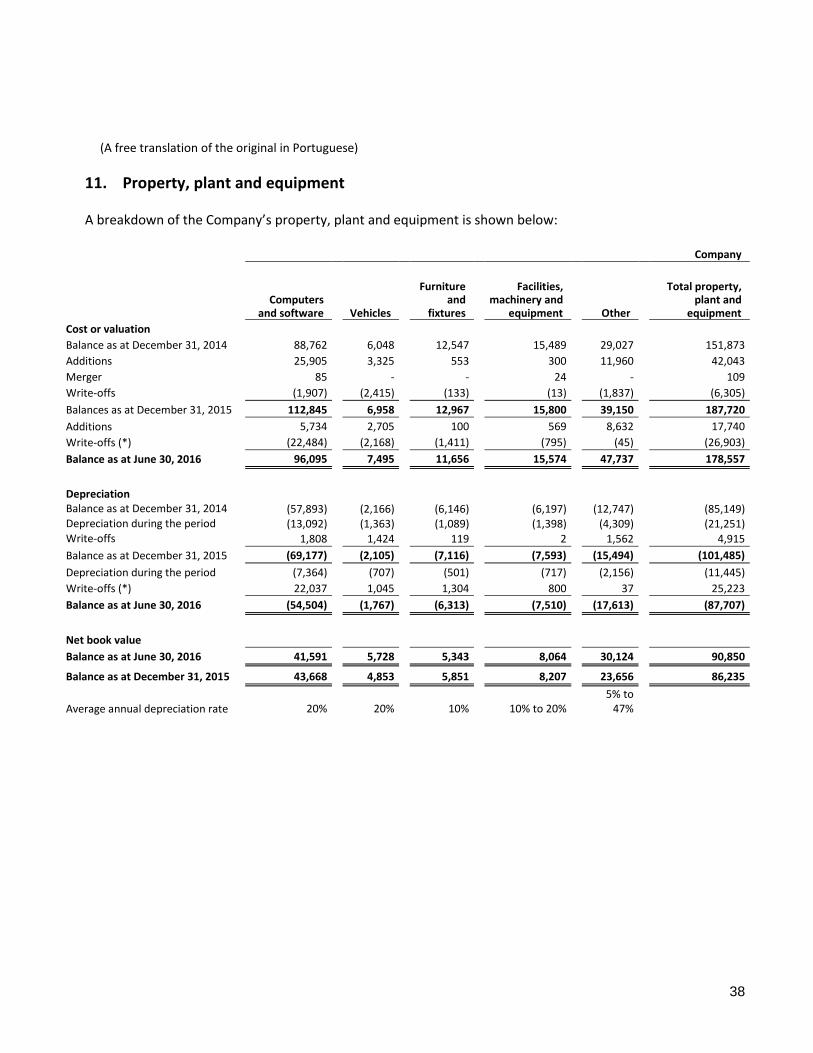
11. Property, plant and equipment A breakdown of the Company’s property, plant and equipment is shown below:
Company
Computers
and software Vehicles
Furniture and
fixtures
Facilities, machinery and
equipment Other
Total property, plant and
equipment
Cost or valuation
Balance as at December 31, 2014 88,762 6,048 12,547 15,489 29,027 151,873
Additions 25,905 3,325 553 300 11,960 42,043
Merger 85 - - 24 - 109
Write-offs (1,907) (2,415) (133) (13) (1,837) (6,305)
Balances as at December 31, 2015 112,845 6,958 12,967 15,800 39,150 187,720
Additions 5,734 2,705 100 569 8,632 17,740
Write-offs (*) (22,484) (2,168) (1,411) (795) (45) (26,903)
Balance as at June 30, 2016 96,095 7,495 11,656 15,574 47,737 178,557
Depreciation Balance as at December 31, 2014 (57,893) (2,166) (6,146) (6,197) (12,747) (85,149) Depreciation during the period (13,092) (1,363) (1,089) (1,398) (4,309) (21,251) Write-offs 1,808 1,424 119 2 1,562 4,915
Balance as at December 31, 2015 (69,177) (2,105) (7,116) (7,593) (15,494) (101,485)
Depreciation during the period (7,364) (707) (501) (717) (2,156) (11,445)
Write-offs (*) 22,037 1,045 1,304 800 37 25,223
Balance as at June 30, 2016 (54,504) (1,767) (6,313) (7,510) (17,613) (87,707)
Net book value
Balance as at June 30, 2016 41,591 5,728 5,343 8,064 30,124 90,850
Balance as at December 31, 2015 43,668 4,853 5,851 8,207 23,656 86,235
Average annual depreciation rate 20% 20% 10% 10% to 20% 5% to
47%
(A free translation of the original in Portuguese)
39
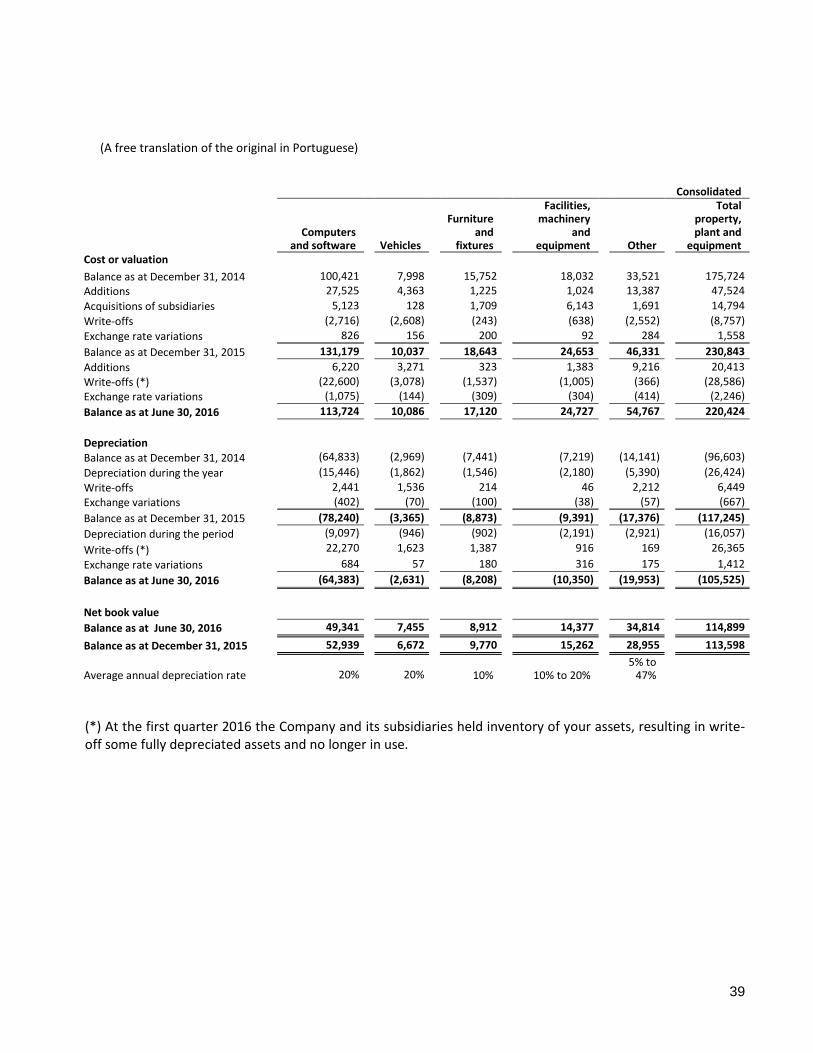
(*) At the first quarter 2016 the Company and its subsidiaries held inventory of your assets, resulting in write-off some fully depreciated assets and no longer in use.
Consolidated
Computers and software Vehicles
Furniture and
fixtures
Facilities, machinery
and equipment Other
Total property, plant and
equipment Cost or valuation
Balance as at December 31, 2014 100,421 7,998 15,752 18,032 33,521 175,724
Additions 27,525 4,363 1,225 1,024 13,387 47,524
Acquisitions of subsidiaries 5,123 128 1,709 6,143 1,691 14,794
Write-offs (2,716) (2,608) (243) (638) (2,552) (8,757)
Exchange rate variations 826 156 200 92 284 1,558
Balance as at December 31, 2015 131,179 10,037 18,643 24,653 46,331 230,843
Additions 6,220 3,271 323 1,383 9,216 20,413
Write-offs (*) (22,600) (3,078) (1,537) (1,005) (366) (28,586)
Exchange rate variations (1,075) (144) (309) (304) (414) (2,246)
Balance as at June 30, 2016 113,724 10,086 17,120 24,727 54,767 220,424
Depreciation
Balance as at December 31, 2014 (64,833) (2,969) (7,441) (7,219) (14,141) (96,603)
Depreciation during the year (15,446) (1,862) (1,546) (2,180) (5,390) (26,424)
Write-offs 2,441 1,536 214 46 2,212 6,449
Exchange variations (402) (70) (100) (38) (57) (667)
Balance as at December 31, 2015 (78,240) (3,365) (8,873) (9,391) (17,376) (117,245)
Depreciation during the period (9,097) (946) (902) (2,191) (2,921) (16,057)
Write-offs (*) 22,270 1,623 1,387 916 169 26,365
Exchange rate variations 684 57 180 316 175 1,412
Balance as at June 30, 2016 (64,383) (2,631) (8,208) (10,350) (19,953) (105,525)
Net book value
Balance as at June 30, 2016 49,341 7,455 8,912 14,377 34,814 114,899
Balance as at December 31, 2015 52,939 6,672 9,770 15,262 28,955 113,598
Average annual depreciation rate 20% 20% 10% 10% to 20% 5% to
47%
(A free translation of the original in Portuguese)
40
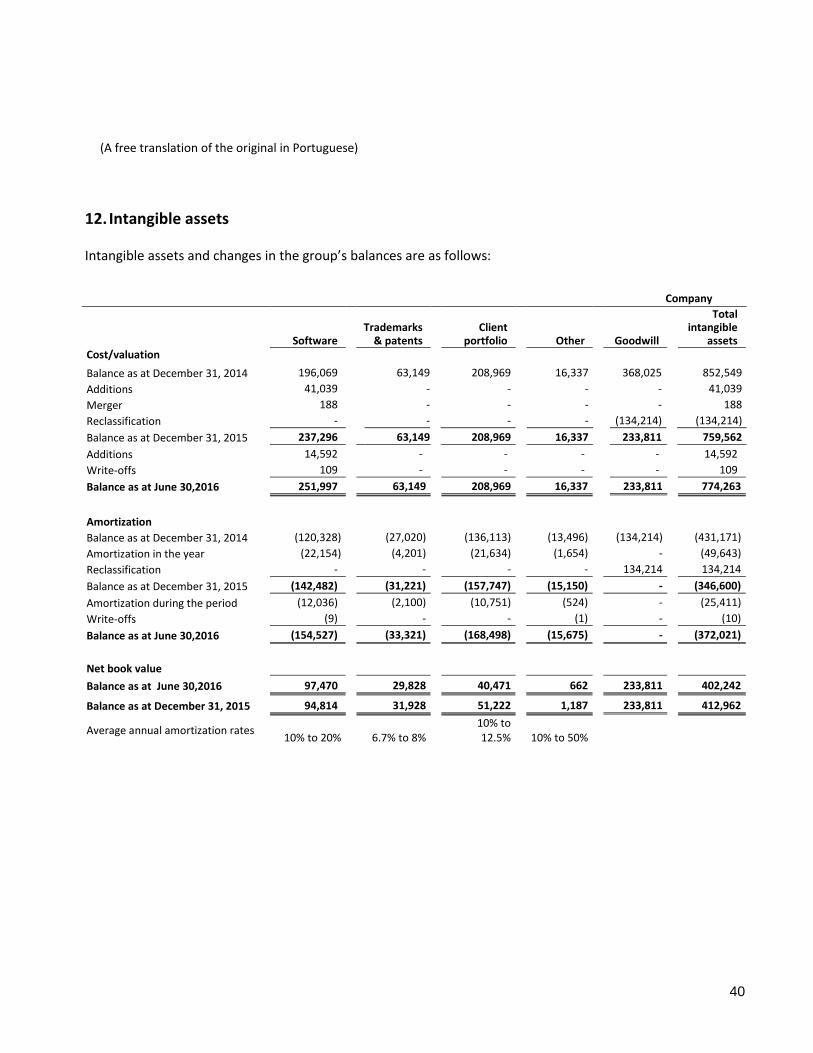
12. Intangible assets Intangible assets and changes in the group’s balances are as follows:
Company
Software Trademarks
& patents Client
portfolio Other Goodwill
Total intangible
assets Cost/valuation
Balance as at December 31, 2014 196,069 63,149 208,969 16,337 368,025 852,549
Additions 41,039 - - - - 41,039
Merger 188 - - - - 188
Reclassification - - - - (134,214) (134,214)
Balance as at December 31, 2015 237,296 63,149 208,969 16,337 233,811 759,562
Additions 14,592 - - - - 14,592
Write-offs 109 - - - - 109
Balance as at June 30,2016 251,997 63,149 208,969 16,337 233,811 774,263
Amortization
Balance as at December 31, 2014 (120,328) (27,020) (136,113) (13,496) (134,214) (431,171)
Amortization in the year (22,154) (4,201) (21,634) (1,654) - (49,643)
Reclassification - - - - 134,214 134,214
Balance as at December 31, 2015 (142,482) (31,221) (157,747) (15,150) - (346,600)
Amortization during the period (12,036) (2,100) (10,751) (524) - (25,411)
Write-offs (9) - - (1) - (10)
Balance as at June 30,2016 (154,527) (33,321) (168,498) (15,675) - (372,021)
Net book value
Balance as at June 30,2016 97,470 29,828 40,471 662 233,811 402,242
Balance as at December 31, 2015 94,814 31,928 51,222 1,187 233,811 412,962
Average annual amortization rates 10% to 20% 6.7% to 8%
10% to 12.5% 10% to 50%
(A free translation of the original in Portuguese)
41
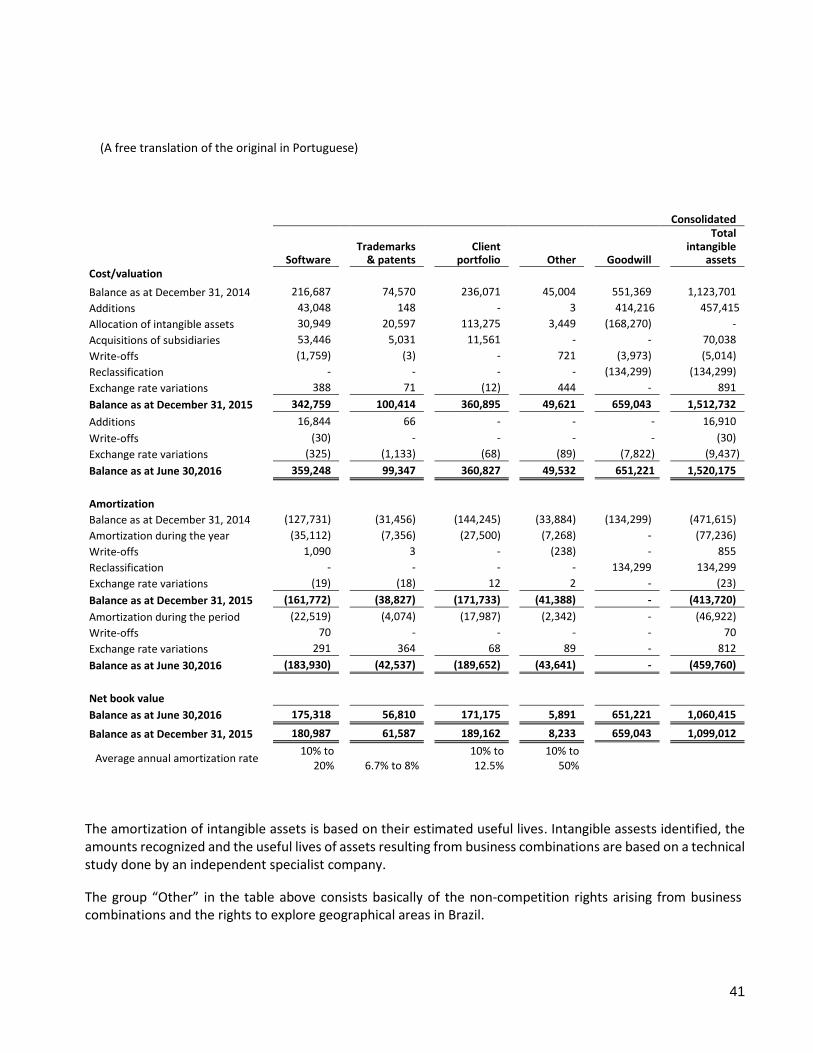
The amortization of intangible assets is based on their estimated useful lives. Intangible assests identified, the amounts recognized and the useful lives of assets resulting from business combinations are based on a technical study done by an independent specialist company.
The group “Other” in the table above consists basically of the non-competition rights arising from business combinations and the rights to explore geographical areas in Brazil.
Consolidated
Software Trademarks
& patents Client
portfolio Other Goodwill
Total intangible
assets Cost/valuation
Balance as at December 31, 2014 216,687 74,570 236,071 45,004 551,369 1,123,701
Additions 43,048 148 - 3 414,216 457,415
Allocation of intangible assets 30,949 20,597 113,275 3,449 (168,270) -
Acquisitions of subsidiaries 53,446 5,031 11,561 - - 70,038
Write-offs (1,759) (3) - 721 (3,973) (5,014)
Reclassification - - - - (134,299) (134,299)
Exchange rate variations 388 71 (12) 444 - 891
Balance as at December 31, 2015 342,759 100,414 360,895 49,621 659,043 1,512,732
Additions 16,844 66 - - - 16,910
Write-offs (30) - - - - (30)
Exchange rate variations (325) (1,133) (68) (89) (7,822) (9,437)
Balance as at June 30,2016 359,248 99,347 360,827 49,532 651,221 1,520,175
Amortization
Balance as at December 31, 2014 (127,731) (31,456) (144,245) (33,884) (134,299) (471,615)
Amortization during the year (35,112) (7,356) (27,500) (7,268) - (77,236)
Write-offs 1,090 3 - (238) - 855
Reclassification - - - - 134,299 134,299
Exchange rate variations (19) (18) 12 2 - (23)
Balance as at December 31, 2015 (161,772) (38,827) (171,733) (41,388) - (413,720)
Amortization during the period (22,519) (4,074) (17,987) (2,342) - (46,922)
Write-offs 70 - - - - 70
Exchange rate variations 291 364 68 89 - 812
Balance as at June 30,2016 (183,930) (42,537) (189,652) (43,641) - (459,760)
Net book value
Balance as at June 30,2016 175,318 56,810 171,175 5,891 651,221 1,060,415
Balance as at December 31, 2015 180,987 61,587 189,162 8,233 659,043 1,099,012
Average annual amortization rate 10% to
20% 6.7% to 8% 10% to 12.5%
10% to 50%
(A free translation of the original in Portuguese)
42
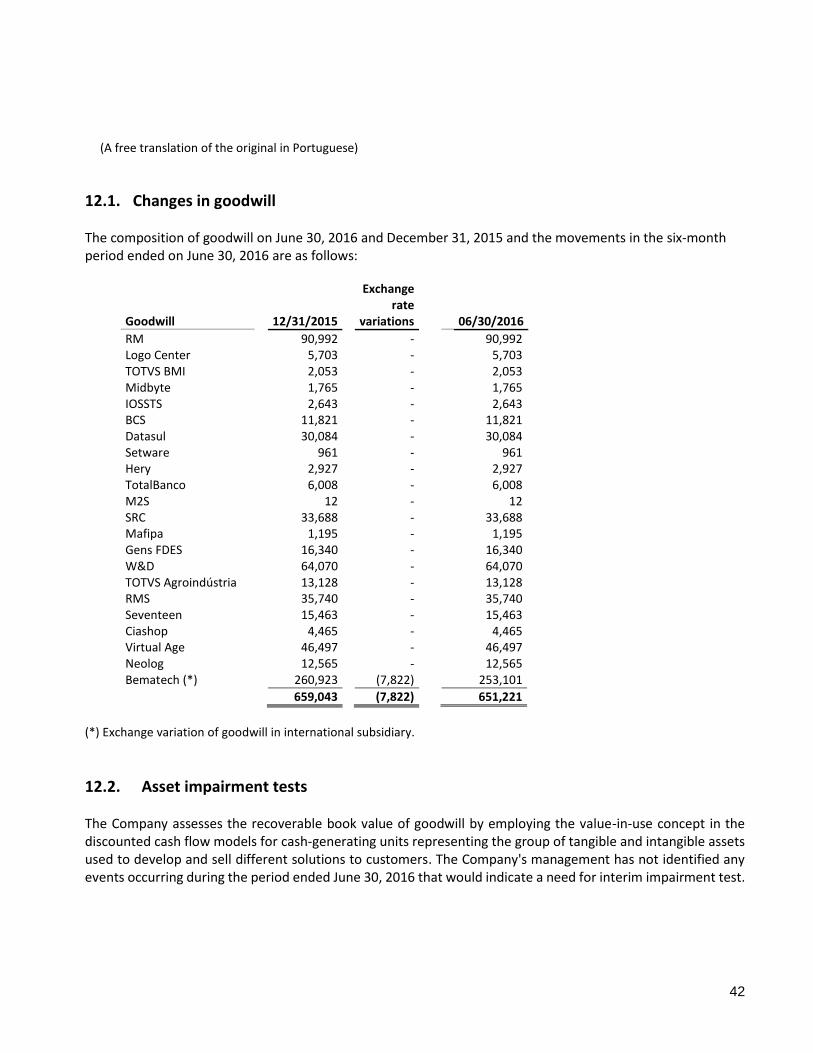
12.1. Changes in goodwill
The composition of goodwill on June 30, 2016 and December 31, 2015 and the movements in the six-month period ended on June 30, 2016 are as follows:
Goodwill 12/31/2015
Exchange rate
variations
06/30/2016
RM 90,992 - 90,992 Logo Center 5,703 - 5,703 TOTVS BMI 2,053 - 2,053 Midbyte 1,765 - 1,765 IOSSTS 2,643 - 2,643 BCS 11,821 - 11,821 Datasul 30,084 - 30,084 Setware 961 - 961 Hery 2,927 - 2,927 TotalBanco 6,008 - 6,008 M2S 12 - 12 SRC 33,688 - 33,688 Mafipa 1,195 - 1,195 Gens FDES 16,340 - 16,340 W&D 64,070 - 64,070 TOTVS Agroindústria 13,128 - 13,128 RMS 35,740 - 35,740 Seventeen 15,463 - 15,463 Ciashop 4,465 - 4,465 Virtual Age 46,497 - 46,497 Neolog 12,565 - 12,565 Bematech (*) 260,923 (7,822) 253,101
659,043 (7,822) 651,221
(*) Exchange variation of goodwill in international subsidiary.
12.2. Asset impairment tests The Company assesses the recoverable book value of goodwill by employing the value-in-use concept in the discounted cash flow models for cash-generating units representing the group of tangible and intangible assets used to develop and sell different solutions to customers. The Company's management has not identified any events occurring during the period ended June 30, 2016 that would indicate a need for interim impairment test.
(A free translation of the original in Portuguese)
43
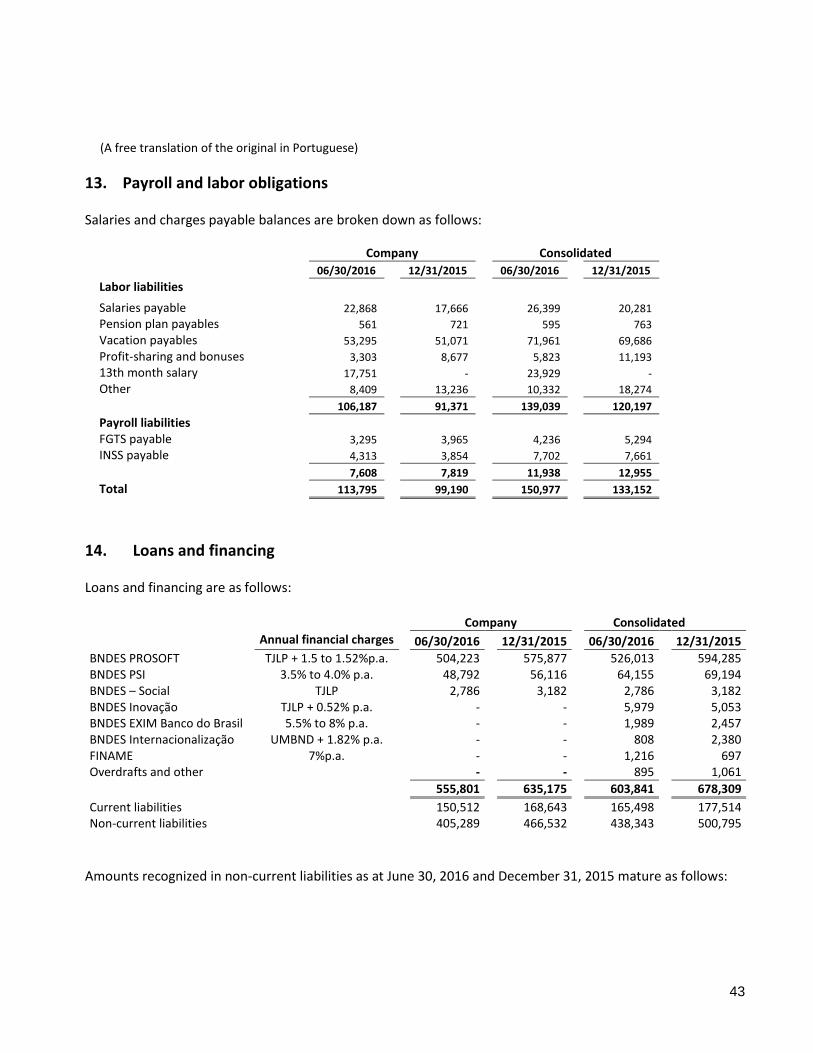
13. Payroll and labor obligations
Salaries and charges payable balances are broken down as follows:
Company Consolidated
06/30/2016 12/31/2015 06/30/2016 12/31/2015
Labor liabilities Salaries payable 22,868 17,666 26,399 20,281
Pension plan payables 561 721 595 763
Vacation payables 53,295 51,071 71,961 69,686
Profit-sharing and bonuses 3,303 8,677 5,823 11,193
13th month salary 17,751 - 23,929 -
Other 8,409 13,236 10,332 18,274
106,187 91,371 139,039 120,197
Payroll liabilities
FGTS payable 3,295 3,965 4,236 5,294
INSS payable 4,313 3,854 7,702 7,661
7,608 7,819 11,938 12,955
Total 113,795 99,190 150,977 133,152
14. Loans and financing Loans and financing are as follows: Company Consolidated
Annual financial charges 06/30/2016 12/31/2015 06/30/2016 12/31/2015
BNDES PROSOFT TJLP + 1.5 to 1.52%p.a. 504,223 575,877 526,013 594,285 BNDES PSI 3.5% to 4.0% p.a. 48,792 56,116 64,155 69,194 BNDES – Social TJLP 2,786 3,182 2,786 3,182 BNDES Inovação TJLP + 0.52% p.a. - - 5,979 5,053 BNDES EXIM Banco do Brasil 5.5% to 8% p.a. - - 1,989 2,457 BNDES Internacionalização UMBND + 1.82% p.a. - - 808 2,380 FINAME 7%p.a. - - 1,216 697 Overdrafts and other - - 895 1,061
555,801 635,175 603,841 678,309
Current liabilities 150,512 168,643 165,498 177,514 Non-current liabilities 405,289 466,532 438,343 500,795
Amounts recognized in non-current liabilities as at June 30, 2016 and December 31, 2015 mature as follows:
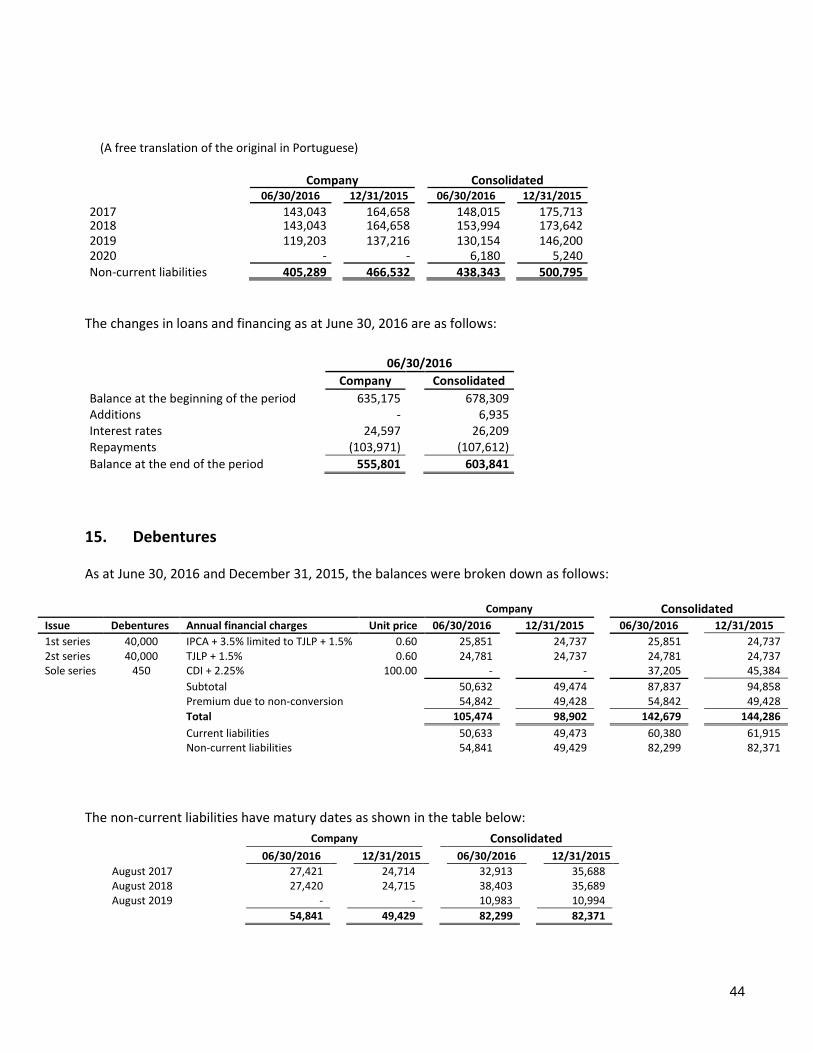
(A free translation of the original in Portuguese)
44
Company Consolidated 06/30/2016 12/31/2015 06/30/2016 12/31/2015
2017 143,043 164,658 148,015 175,713 2018 143,043 164,658 153,994 173,642 2019 119,203 137,216 130,154 146,200 2020 - - 6,180 5,240 Non-current liabilities 405,289 466,532 438,343 500,795
The changes in loans and financing as at June 30, 2016 are as follows:
06/30/2016
Company Consolidated
Balance at the beginning of the period 635,175 678,309 Additions - 6,935 Interest rates 24,597 26,209 Repayments (103,971) (107,612)
Balance at the end of the period 555,801 603,841
15. Debentures As at June 30, 2016 and December 31, 2015, the balances were broken down as follows:
Company Consolidated
Issue Debentures Annual financial charges Unit price 06/30/2016 12/31/2015 06/30/2016 12/31/2015
1st series 40,000 IPCA + 3.5% limited to TJLP + 1.5% 0.60 25,851 24,737 25,851 24,737 2st series 40,000 TJLP + 1.5% 0.60 24,781 24,737 24,781 24,737 Sole series 450 CDI + 2.25% 100.00 - - 37,205 45,384
Subtotal 50,632 49,474 87,837 94,858 Premium due to non-conversion 54,842 49,428 54,842 49,428
Total 105,474 98,902 142,679 144,286
Current liabilities 50,633 49,473 60,380 61,915 Non-current liabilities 54,841 49,429 82,299 82,371
The non-current liabilities have matury dates as shown in the table below:
Company Consolidated
06/30/2016 12/31/2015 06/30/2016 12/31/2015
August 2017 27,421 24,714 32,913 35,688 August 2018 27,420 24,715 38,403 35,689 August 2019 - - 10,983 10,994
54,841 49,429 82,299 82,371
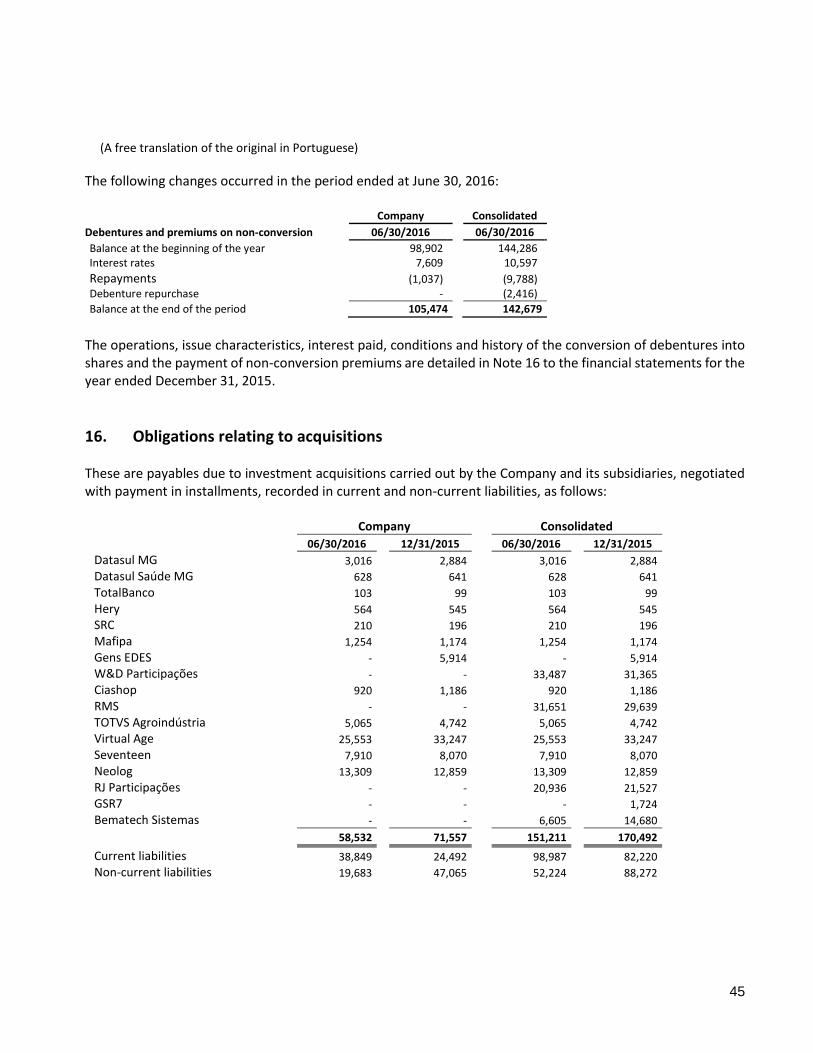
(A free translation of the original in Portuguese)
45
The following changes occurred in the period ended at June 30, 2016: Company Consolidated
Debentures and premiums on non-conversion 06/30/2016 06/30/2016
Balance at the beginning of the year 98,902 144,286 Interest rates 7,609 10,597
Repayments (1,037) (9,788) Debenture repurchase - (2,416)
Balance at the end of the period 105,474 142,679
The operations, issue characteristics, interest paid, conditions and history of the conversion of debentures into shares and the payment of non-conversion premiums are detailed in Note 16 to the financial statements for the year ended December 31, 2015.
16. Obligations relating to acquisitions These are payables due to investment acquisitions carried out by the Company and its subsidiaries, negotiated with payment in installments, recorded in current and non-current liabilities, as follows:
Company Consolidated
06/30/2016 12/31/2015 06/30/2016 12/31/2015
Datasul MG 3,016 2,884 3,016 2,884
Datasul Saúde MG 628 641 628 641
TotalBanco 103 99 103 99
Hery 564 545 564 545
SRC 210 196 210 196
Mafipa 1,254 1,174 1,254 1,174
Gens EDES - 5,914 - 5,914
W&D Participações - - 33,487 31,365
Ciashop 920 1,186 920 1,186
RMS - - 31,651 29,639
TOTVS Agroindústria 5,065 4,742 5,065 4,742
Virtual Age 25,553 33,247 25,553 33,247
Seventeen 7,910 8,070 7,910 8,070
Neolog 13,309 12,859 13,309 12,859
RJ Participações - - 20,936 21,527
GSR7 - - - 1,724
Bematech Sistemas - - 6,605 14,680
58,532 71,557 151,211 170,492
Current liabilities 38,849 24,492 98,987 82,220
Non-current liabilities 19,683 47,065 52,224 88,272
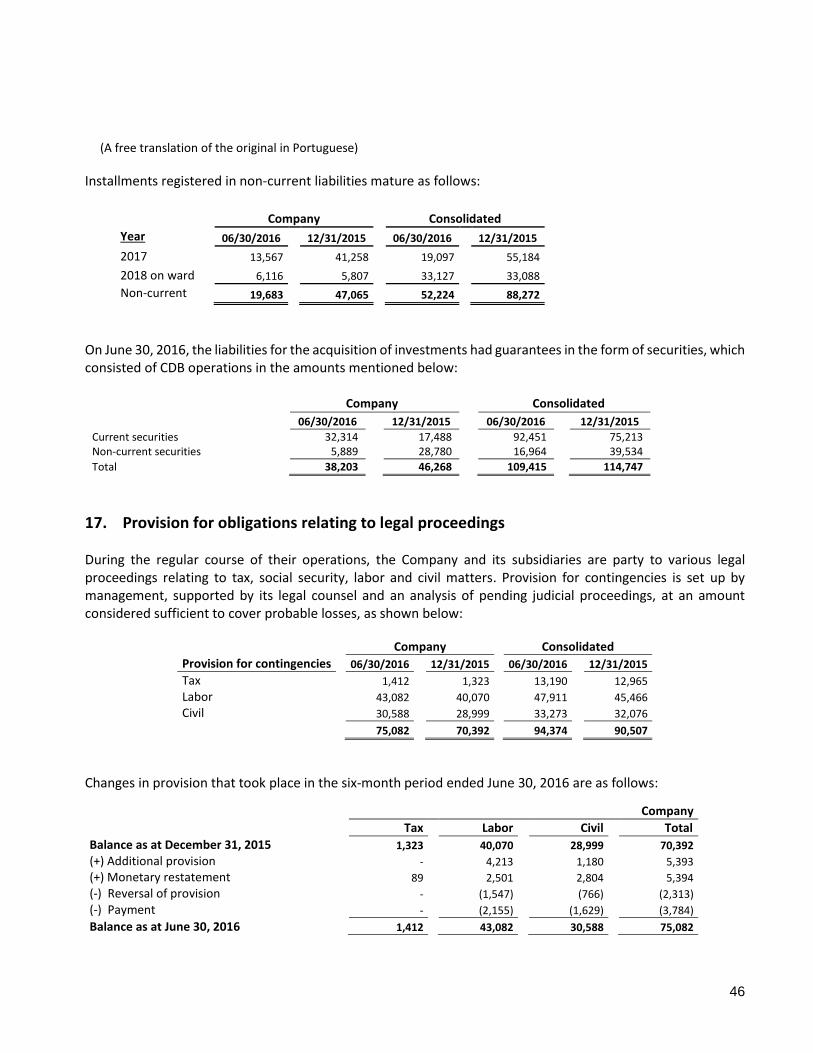
(A free translation of the original in Portuguese)
46
Installments registered in non-current liabilities mature as follows:
Company Consolidated
Year 06/30/2016 12/31/2015 06/30/2016 12/31/2015
2017 13,567 41,258 19,097 55,184
2018 on ward 6,116 5,807 33,127 33,088
Non-current liabilities
19,683 47,065 52,224 88,272
On June 30, 2016, the liabilities for the acquisition of investments had guarantees in the form of securities, which consisted of CDB operations in the amounts mentioned below:
Company Consolidated
06/30/2016 12/31/2015 06/30/2016 12/31/2015
Current securities 32,314 17,488 92,451 75,213 Non-current securities 5,889 28,780 16,964 39,534
Total 38,203 46,268 109,415 114,747
17. Provision for obligations relating to legal proceedings During the regular course of their operations, the Company and its subsidiaries are party to various legal proceedings relating to tax, social security, labor and civil matters. Provision for contingencies is set up by management, supported by its legal counsel and an analysis of pending judicial proceedings, at an amount considered sufficient to cover probable losses, as shown below:
Company Consolidated
Provision for contingencies 06/30/2016 12/31/2015 06/30/2016 12/31/2015
Tax 1,412 1,323 13,190 12,965
Labor 43,082 40,070 47,911 45,466
Civil 30,588 28,999 33,273 32,076
75,082 70,392 94,374 90,507
Changes in provision that took place in the six-month period ended June 30, 2016 are as follows:
Company
Tax Labor Civil Total
Balance as at December 31, 2015 1,323 40,070 28,999 70,392
(+) Additional provision - 4,213 1,180 5,393
(+) Monetary restatement 89 2,501 2,804 5,394
(-) Reversal of provision - (1,547) (766) (2,313)
(-) Payment - (2,155) (1,629) (3,784)
Balance as at June 30, 2016 1,412 43,082 30,588 75,082
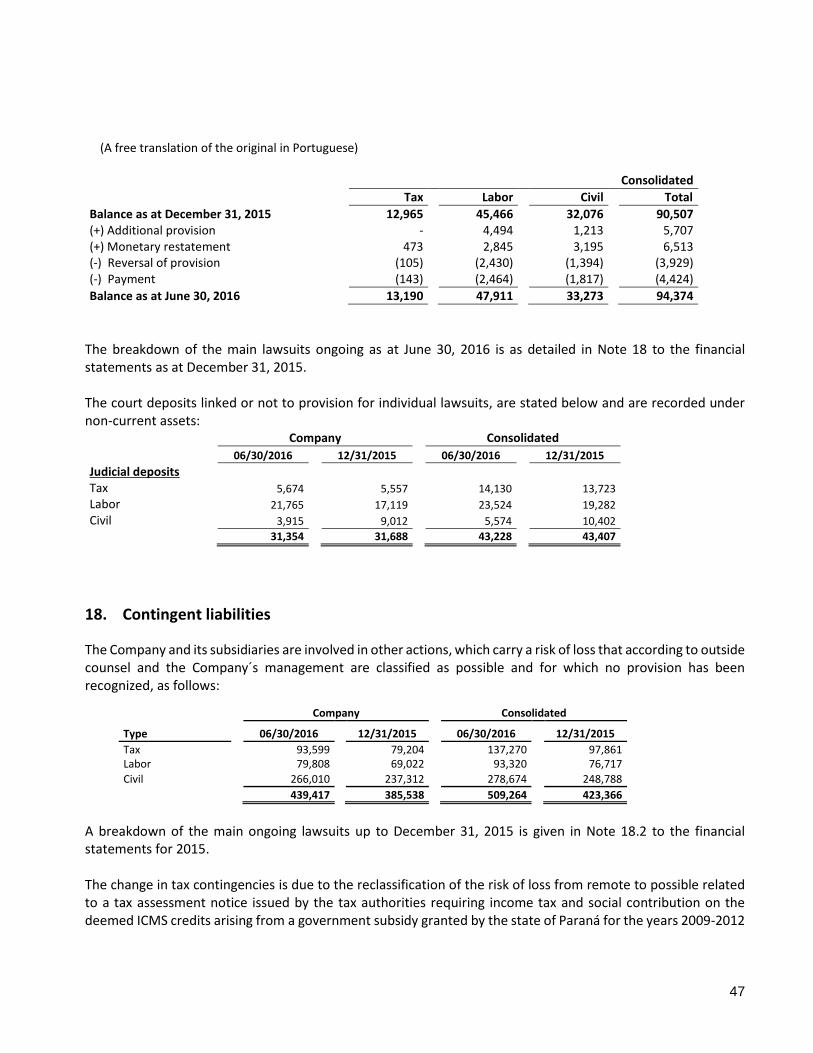
(A free translation of the original in Portuguese)
47
Consolidated
Tax Labor Civil Total
Balance as at December 31, 2015 12,965 45,466 32,076 90,507 (+) Additional provision - 4,494 1,213 5,707 (+) Monetary restatement 473 2,845 3,195 6,513 (-) Reversal of provision (105) (2,430) (1,394) (3,929) (-) Payment (143) (2,464) (1,817) (4,424)
Balance as at June 30, 2016 13,190 47,911 33,273 94,374
The breakdown of the main lawsuits ongoing as at June 30, 2016 is as detailed in Note 18 to the financial statements as at December 31, 2015. The court deposits linked or not to provision for individual lawsuits, are stated below and are recorded under non-current assets: Company Consolidated
06/30/2016 12/31/2015 06/30/2016 12/31/2015
Judicial deposits Tax 5,674 5,557 14,130 13,723
Labor 21,765 17,119 23,524 19,282
Civil 3,915 9,012 5,574 10,402
31,354 31,688 43,228 43,407
18. Contingent liabilities
The Company and its subsidiaries are involved in other actions, which carry a risk of loss that according to outside counsel and the Company´s management are classified as possible and for which no provision has been recognized, as follows:
Company Consolidated
Type 06/30/2016 12/31/2015 06/30/2016 12/31/2015
Tax 93,599 79,204 137,270 97,861 Labor 79,808 69,022 93,320 76,717
Civil 266,010 237,312 278,674 248,788
439,417 385,538 509,264 423,366
A breakdown of the main ongoing lawsuits up to December 31, 2015 is given in Note 18.2 to the financial statements for 2015. The change in tax contingencies is due to the reclassification of the risk of loss from remote to possible related to a tax assessment notice issued by the tax authorities requiring income tax and social contribution on the deemed ICMS credits arising from a government subsidy granted by the state of Paraná for the years 2009-2012
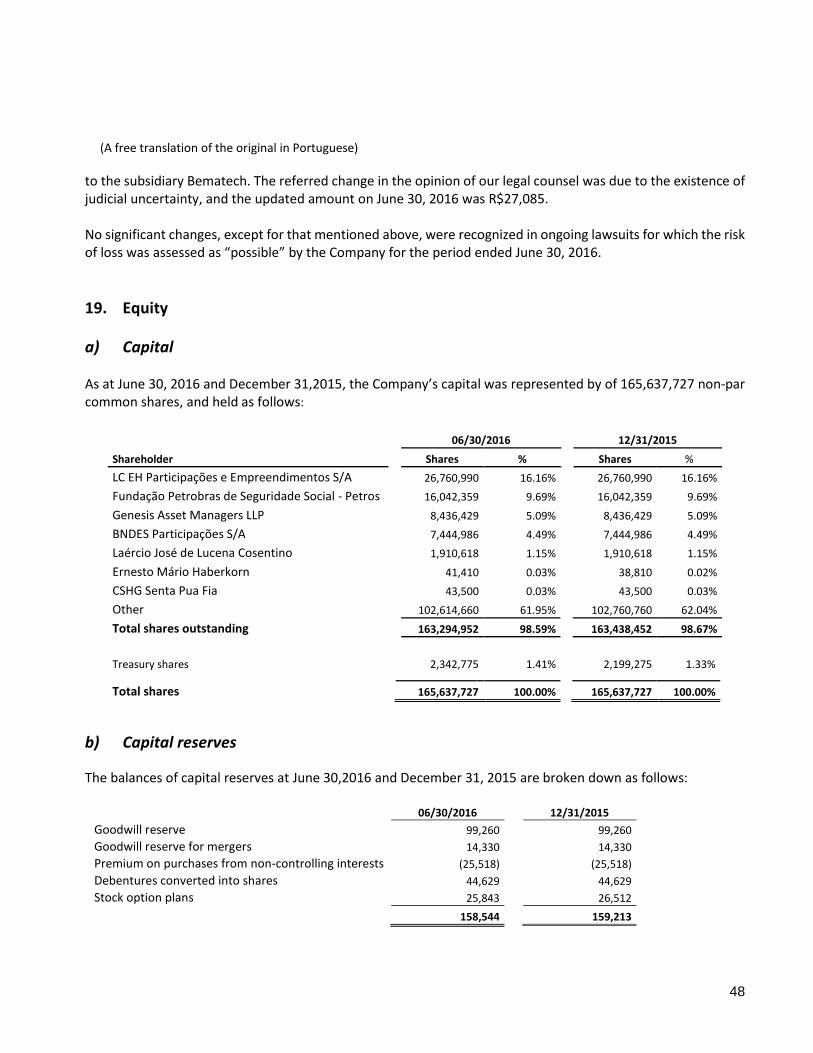
(A free translation of the original in Portuguese)
48
to the subsidiary Bematech. The referred change in the opinion of our legal counsel was due to the existence of judicial uncertainty, and the updated amount on June 30, 2016 was R$27,085. No significant changes, except for that mentioned above, were recognized in ongoing lawsuits for which the risk of loss was assessed as “possible” by the Company for the period ended June 30, 2016.
19. Equity
a) Capital As at June 30, 2016 and December 31,2015, the Company’s capital was represented by of 165,637,727 non-par common shares, and held as follows:
06/30/2016 12/31/2015
Shareholder Shares % Shares %
LC EH Participações e Empreendimentos S/A 26,760,990 16.16% 26,760,990 16.16%
Fundação Petrobras de Seguridade Social - Petros 16,042,359 9.69% 16,042,359 9.69%
Genesis Asset Managers LLP 8,436,429 5.09% 8,436,429 5.09%
BNDES Participações S/A 7,444,986 4.49% 7,444,986 4.49%
Laércio José de Lucena Cosentino 1,910,618 1.15% 1,910,618 1.15%
Ernesto Mário Haberkorn 41,410 0.03% 38,810 0.02%
CSHG Senta Pua Fia 43,500 0.03% 43,500 0.03%
Other 102,614,660 61.95% 102,760,760 62.04%
Total shares outstanding 163,294,952 98.59% 163,438,452 98.67%
Treasury shares 2,342,775 1.41% 2,199,275 1.33%
Total shares 165,637,727 100.00% 165,637,727 100.00%
b) Capital reserves
The balances of capital reserves at June 30,2016 and December 31, 2015 are broken down as follows:
06/30/2016 12/31/2015
Goodwill reserve 99,260 99,260
Goodwill reserve for mergers 14,330 14,330
Premium on purchases from non-controlling interests (25,518) (25,518)
Debentures converted into shares 44,629 44,629
Stock option plans 25,843 26,512
158,544 159,213
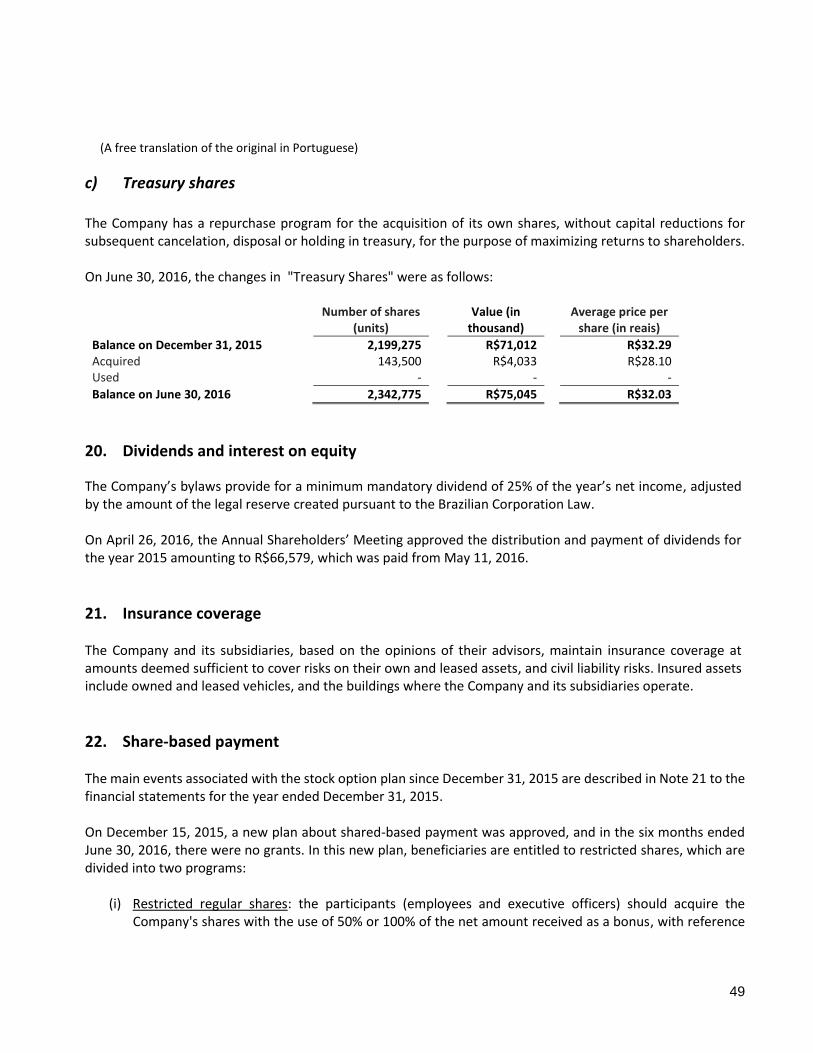
(A free translation of the original in Portuguese)
49
c) Treasury shares
The Company has a repurchase program for the acquisition of its own shares, without capital reductions for subsequent cancelation, disposal or holding in treasury, for the purpose of maximizing returns to shareholders. On June 30, 2016, the changes in "Treasury Shares" were as follows:
Number of shares (units)
Value (in
thousand)
Average price per share (in reais)
Balance on December 31, 2015 2,199,275 R$71,012 R$32.29 Acquired 143,500 R$4,033 R$28.10 Used - - -
Balance on June 30, 2016 2,342,775 R$75,045 R$32.03
20. Dividends and interest on equity
The Company’s bylaws provide for a minimum mandatory dividend of 25% of the year’s net income, adjusted by the amount of the legal reserve created pursuant to the Brazilian Corporation Law. On April 26, 2016, the Annual Shareholders’ Meeting approved the distribution and payment of dividends for the year 2015 amounting to R$66,579, which was paid from May 11, 2016.
21. Insurance coverage The Company and its subsidiaries, based on the opinions of their advisors, maintain insurance coverage at amounts deemed sufficient to cover risks on their own and leased assets, and civil liability risks. Insured assets include owned and leased vehicles, and the buildings where the Company and its subsidiaries operate.
22. Share-based payment The main events associated with the stock option plan since December 31, 2015 are described in Note 21 to the financial statements for the year ended December 31, 2015. On December 15, 2015, a new plan about shared-based payment was approved, and in the six months ended June 30, 2016, there were no grants. In this new plan, beneficiaries are entitled to restricted shares, which are divided into two programs:
(i) Restricted regular shares: the participants (employees and executive officers) should acquire the Company's shares with the use of 50% or 100% of the net amount received as a bonus, with reference
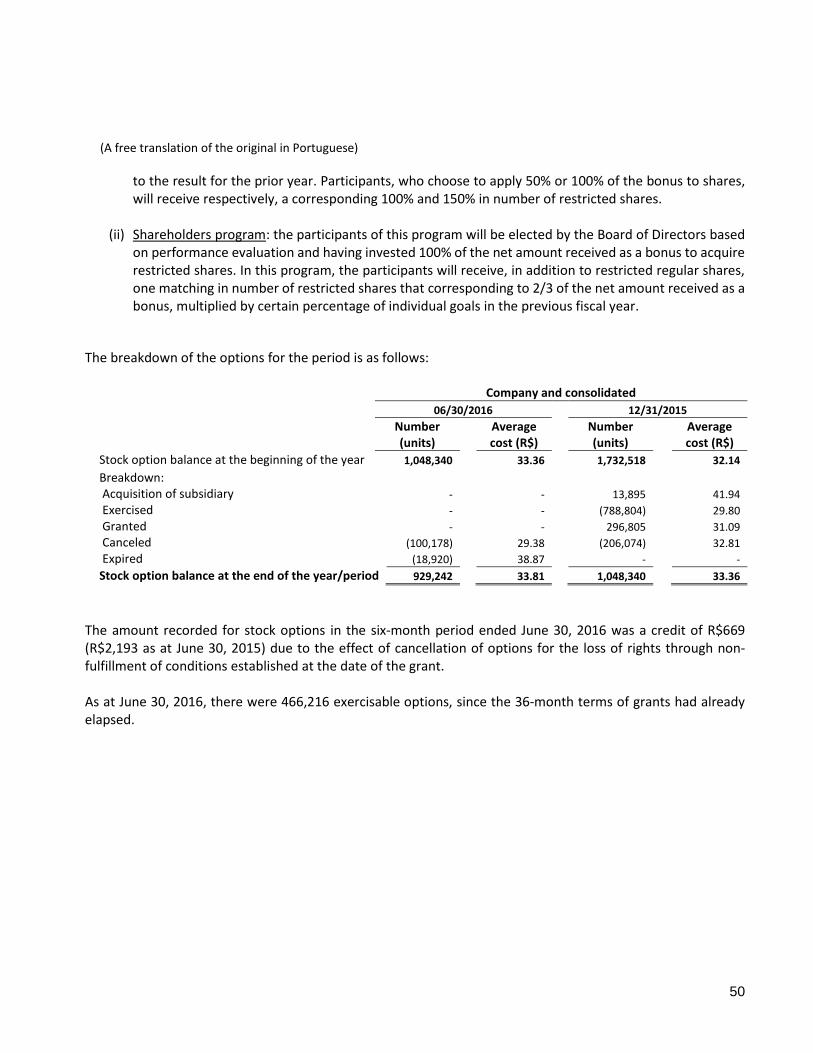
(A free translation of the original in Portuguese)
50
to the result for the prior year. Participants, who choose to apply 50% or 100% of the bonus to shares, will receive respectively, a corresponding 100% and 150% in number of restricted shares.
(ii) Shareholders program: the participants of this program will be elected by the Board of Directors based on performance evaluation and having invested 100% of the net amount received as a bonus to acquire restricted shares. In this program, the participants will receive, in addition to restricted regular shares, one matching in number of restricted shares that corresponding to 2/3 of the net amount received as a bonus, multiplied by certain percentage of individual goals in the previous fiscal year.
The breakdown of the options for the period is as follows:
Company and consolidated
06/30/2016 12/31/2015
Number (units)
Average cost (R$)
Number (units)
Average cost (R$)
Stock option balance at the beginning of the year 1,048,340 33.36 1,732,518 32.14
Breakdown:
Acquisition of subsidiary - - 13,895 41.94
Exercised - - (788,804) 29.80
Granted - - 296,805 31.09
Canceled (100,178) 29.38 (206,074) 32.81
Expired (18,920) 38.87 - -
Stock option balance at the end of the year/period 929,242 33.81 1,048,340 33.36
The amount recorded for stock options in the six-month period ended June 30, 2016 was a credit of R$669 (R$2,193 as at June 30, 2015) due to the effect of cancellation of options for the loss of rights through non-fulfillment of conditions established at the date of the grant. As at June 30, 2016, there were 466,216 exercisable options, since the 36-month terms of grants had already elapsed.
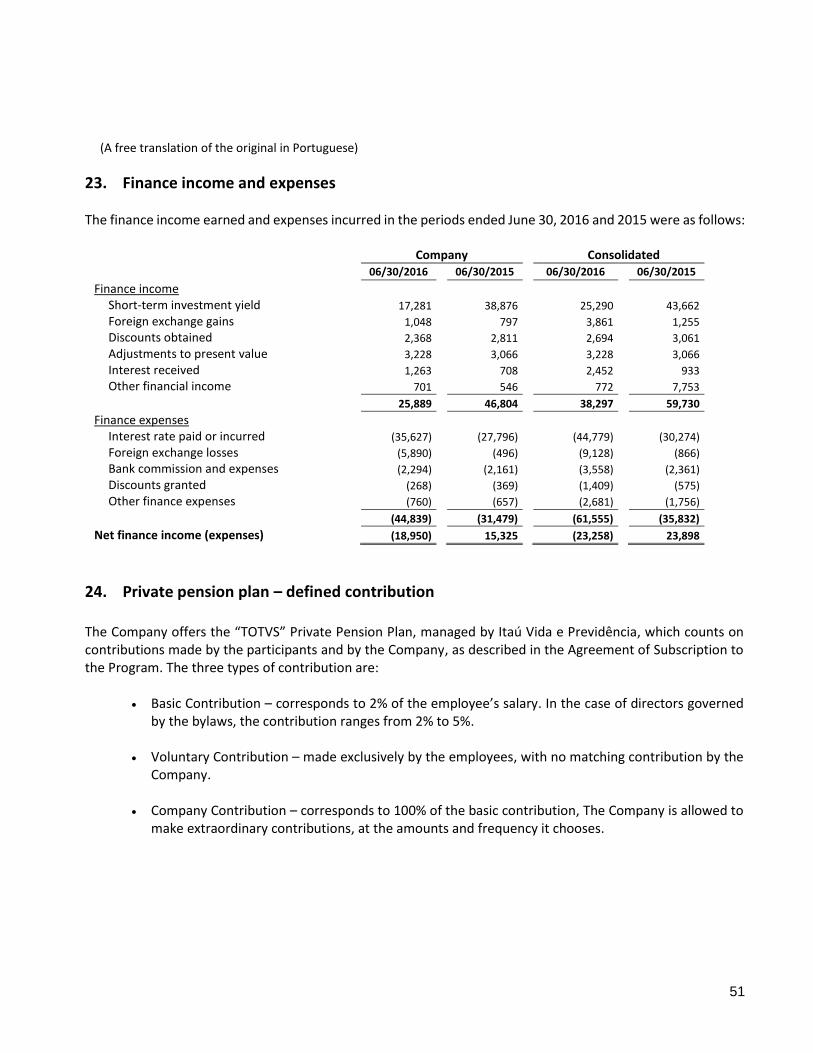
(A free translation of the original in Portuguese)
51
23. Finance income and expenses The finance income earned and expenses incurred in the periods ended June 30, 2016 and 2015 were as follows:
Company Consolidated
06/30/2016 06/30/2015 06/30/2016 06/30/2015
Finance income Short-term investment yield 17,281 38,876 25,290 43,662
Foreign exchange gains 1,048 797 3,861 1,255
Discounts obtained 2,368 2,811 2,694 3,061
Adjustments to present value 3,228 3,066 3,228 3,066
Interest received 1,263 708 2,452 933
Other financial income 701 546 772 7,753
25,889 46,804 38,297 59,730
Finance expenses
Interest rate paid or incurred (35,627) (27,796) (44,779) (30,274)
Foreign exchange losses (5,890) (496) (9,128) (866)
Bank commission and expenses (2,294) (2,161) (3,558) (2,361)
Discounts granted (268) (369) (1,409) (575)
Other finance expenses (760) (657) (2,681) (1,756)
(44,839) (31,479) (61,555) (35,832)
Net finance income (expenses) (18,950) 15,325 (23,258) 23,898
24. Private pension plan – defined contribution The Company offers the “TOTVS” Private Pension Plan, managed by Itaú Vida e Previdência, which counts on contributions made by the participants and by the Company, as described in the Agreement of Subscription to the Program. The three types of contribution are:
Basic Contribution – corresponds to 2% of the employee’s salary. In the case of directors governed by the bylaws, the contribution ranges from 2% to 5%.
Voluntary Contribution – made exclusively by the employees, with no matching contribution by the
Company. Company Contribution – corresponds to 100% of the basic contribution, The Company is allowed to
make extraordinary contributions, at the amounts and frequency it chooses.
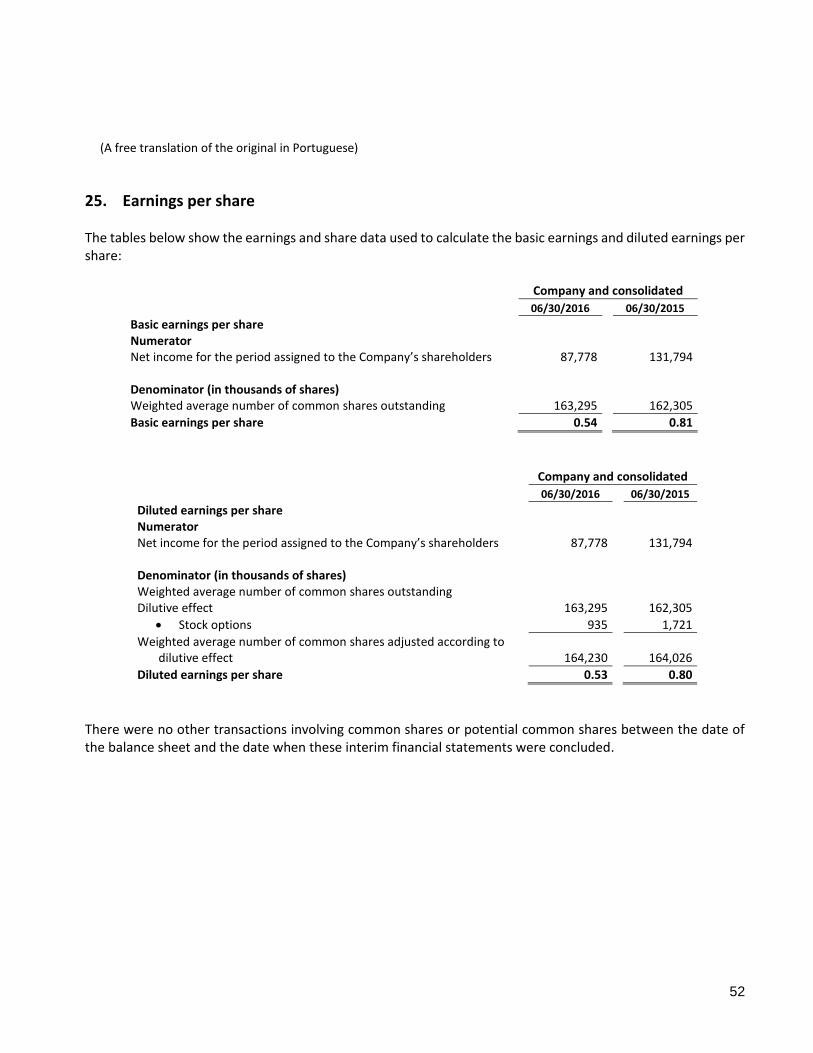
(A free translation of the original in Portuguese)
52
25. Earnings per share The tables below show the earnings and share data used to calculate the basic earnings and diluted earnings per share:
Company and consolidated
06/30/2016 06/30/2015
Basic earnings per share Numerator Net income for the period assigned to the Company’s shareholders 87,778 131,794 Denominator (in thousands of shares) Weighted average number of common shares outstanding 163,295 162,305
Basic earnings per share 0.54 0.81
Company and consolidated
06/30/2016 06/30/2015
Diluted earnings per share Numerator Net income for the period assigned to the Company’s shareholders 87,778 131,794 Denominator (in thousands of shares) Weighted average number of common shares outstanding Dilutive effect 163,295 162,305
Stock options 935 1,721
Weighted average number of common shares adjusted according to dilutive effect 164,230 164,026
Diluted earnings per share 0.53 0.80
There were no other transactions involving common shares or potential common shares between the date of the balance sheet and the date when these interim financial statements were concluded.
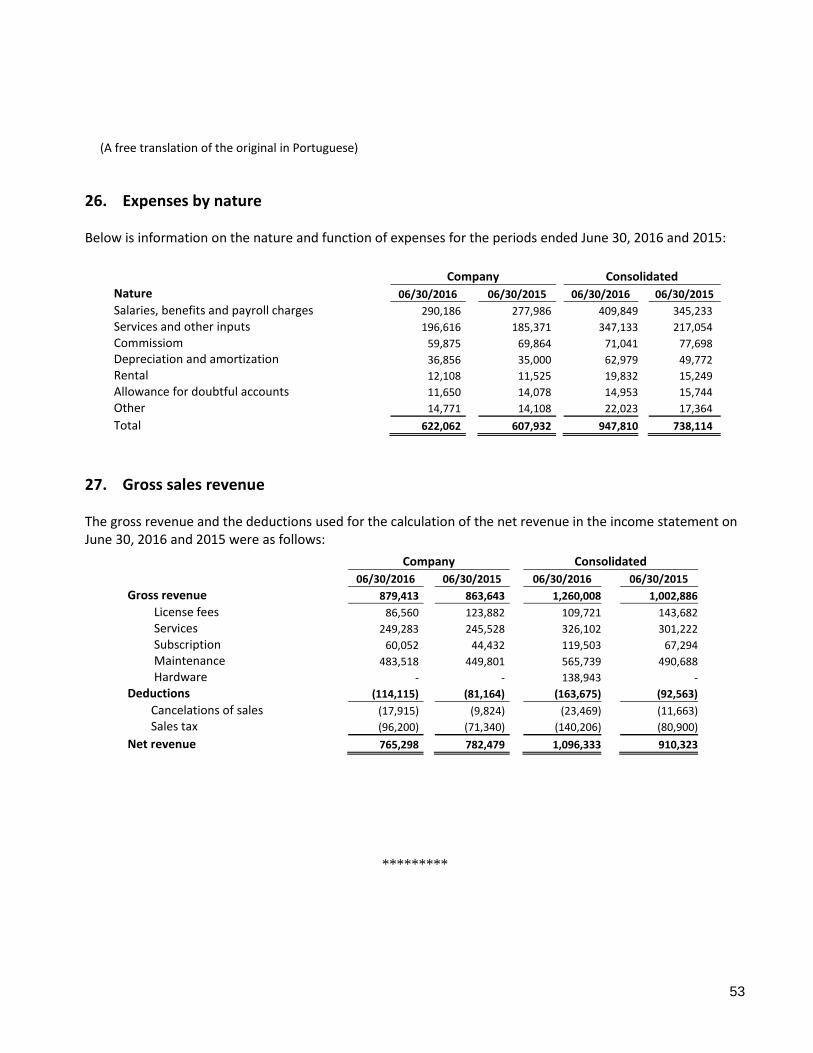
(A free translation of the original in Portuguese)
53
26. Expenses by nature Below is information on the nature and function of expenses for the periods ended June 30, 2016 and 2015:
Company Consolidated
Nature 06/30/2016 06/30/2015 06/30/2016 06/30/2015 Salaries, benefits and payroll charges 290,186 277,986 409,849 345,233
Services and other inputs 196,616 185,371 347,133 217,054
Commissiom 59,875 69,864 71,041 77,698
Depreciation and amortization 36,856 35,000 62,979 49,772
Rental 12,108 11,525 19,832 15,249
Allowance for doubtful accounts 11,650 14,078 14,953 15,744
Other 14,771 14,108 22,023 17,364
Total 622,062 607,932 947,810 738,114
27. Gross sales revenue The gross revenue and the deductions used for the calculation of the net revenue in the income statement on June 30, 2016 and 2015 were as follows:
Company Consolidated
06/30/2016 06/30/2015 06/30/2016 06/30/2015 Gross revenue 879,413 863,643 1,260,008 1,002,886
License fees 86,560 123,882 109,721 143,682
Services 249,283 245,528 326,102 301,222
Subscription 60,052 44,432 119,503 67,294
Maintenance 483,518 449,801 565,739 490,688
Hardware - - 138,943 -
Deductions (114,115) (81,164) (163,675) (92,563)
Cancelations of sales (17,915) (9,824) (23,469) (11,663)
Sales tax (96,200) (71,340) (140,206) (80,900)
Net revenue 765,298 782,479 1,096,333 910,323
*********
(A free translation of the original in Portuguese)
54
Report on review of quarterly information To the Board of Directors and Stockholders TOTVS S.A. Introduction We have reviewed the accompanying parent company and consolidated interim accounting information of TOTVS S.A. (“ Company”), included in the Quarterly Information Form (ITR) for the quarter ended June 30, 2016, comprising the balance sheet as at that date and the statements of income and comprehensive income for the quarter and six-month periods then ended, and the statements of changes in equity and cash flows for the six-month period then ended, and a summary of significant accounting policies and other explanatory information. Management is responsible for the preparation of the parent company interim accounting information in accordance with the accounting standard CPC 21, Interim Financial Reporting, of the Brazilian Accounting Pronouncements Committee (CPC), and of the consolidated interim accounting information in accordance with CPC 21 and International Accounting Standard (IAS) 34 - Interim Financial Reporting issued by the International Accounting Standards Board (IASB), as well as the presentation of this information in accordance with the standards issued by the Brazilian Securities Commission (CVM), applicable to the preparation of the Quarterly Information (ITR). Our responsibility is to express a conclusion on this interim accounting information based on our review. Scope of review We conducted our review in accordance with Brazilian and International Standards on Reviews of Interim Financial Information (NBC TR 2410 – Review of Interim Financial Information Performed by the Independent Auditor of the Entity and ISRE 2410 – Review of Interim Financial Information Performed by the Independent Auditor of the Entity, respectively). A review of interim information consists of making inquiries, primarily of persons responsible for financial and accounting matters, and applying analytical and other review procedures. A review is substantially less in scope than an audit conducted in accordance with Brazilian and International Standards on Auditing and consequently does not enable us to obtain assurance that we would become aware of all significant matters that might be identified in an audit. Accordingly, we do not express an audit opinion. Conclusion on the parent company interim information Based on our review, nothing has come to our attention that causes us to believe that the accompanying parent company interim accounting information included in the quarterly information referred to above has not been prepared, in all material respects, in accordance with CPC 21 applicable to the preparation of the Quarterly Information, and presented in accordance with the standards issued by the CVM.]
(A free translation of the original in Portuguese)
55
Conclusion on the consolidated interim information Based on our review, nothing has come to our attention that causes us to believe that the accompanying consolidated interim accounting information included in the quarterly information referred to above has not been prepared, in all material respects, in accordance with CPC 21 and IAS 34 applicable to the preparation of the Quarterly Information, and presented in accordance with the standards issued by the CVM. Other matters Statements of value added We have also reviewed the parent company and consolidated statements of value added for the six-month period ended June 30, 2016. These statements are the responsibility of the Company’s management, and are required to be presented in accordance with standards issued by the CVM applicable to the preparation of Quarterly Information (ITR) and are considered supplementary information under IFRS, which do not require the presentation of the statement of value added. These statements have been submitted to the same review procedures described above and, based on our review, nothing has come to our attention that causes us to believe that they have not been prepared, in all material respects, in a manner consistent with the parent company and consolidated interim accounting information taken as a whole. São Paulo August 1, 2016. PricewaterhouseCoopers Auditores Independentes CRC 2SP000160/O-5 Ricardo Novaes de Queiroz Contador CRC 1DF012332/O-2 "S" SP


![INDIAN INCOME TAX RETURN ACKNOWLEDGEMENT ......[Where the data of the Return of Income in Form ITR-1 (SAHAJ), ITR-2, ITR-3, ITR-4 , ITR-5, ITR-6,ITR-7 filed and verified electronically]](https://static.fdocuments.us/doc/165x107/61250246c71ac647a36c0516/indian-income-tax-return-acknowledgement-where-the-data-of-the-return-of.jpg)