Total Number of Individuals Age Structure of the Population Distribution of Individuals Sex ratio...
14
-
Upload
lisbeth-heaslip -
Category
Documents
-
view
223 -
download
3
Transcript of Total Number of Individuals Age Structure of the Population Distribution of Individuals Sex ratio...


• Total Number of Individuals
• Age Structure of the Population
• Distribution of Individuals
• Sex ratio• Density of
Individuals

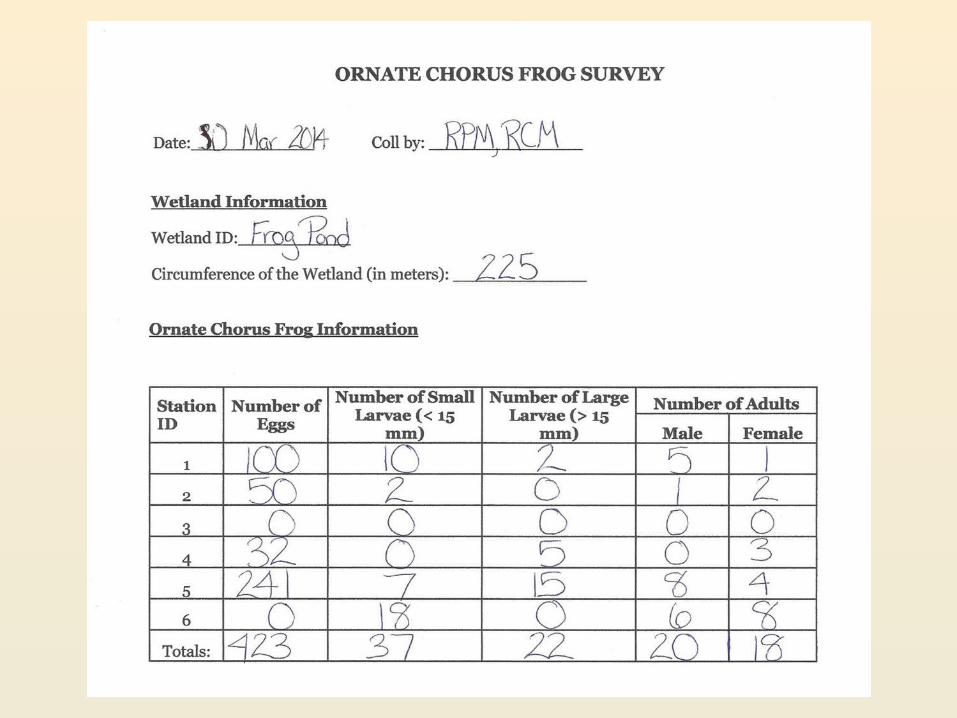
Local Population – Frog Pond
Regional Population – All the ponds in the Apalachicola National Forest
Global Population – all the ponds throughout the species’ range
Populations at Different Scales

As a biologist you record data about the frog population based on what you observed. You can then use these observations to draw
conclusions, or inferences, about the population.
What Does this Population Data Tell You?

What did you observe?
What does that information tell you (what are you
inferring)?

Are Your Inferences Valid?

Observation and Inference
Do your homework - know the biology of the animal you are studying.
You sample the wetland in August and find no ornate chorus frogs. You conclude that the population of chorus frogs at the wetland is zero. If you had done your homework you would know the ornate chorus frog lives in the uplands and only uses the wetland in the winter and spring…OOPS!

Observation and Inference
How you observe or sample makes a difference in what you find.
You used a dipnet to sample the wetland for larvae (tadpoles), you visually surveyed the wetland for eggs, you searched around the outside of the wetland for adults, and you set up traps to catch adults. Because you used different methods to target all the age classes, your conclusions (inferences) about the population will be more accurate.

Observation and Inference
There is a lot of variability in the world - with observational science or experimental science you need to repeat, repeat, repeat!
You sample Frog Pond one time and find no larvae. You conclude that the chorus frog did not breed this year. Turns out the chorus frog just hadn’t bred yet, if you had come back a few more times this year, you would have found a lot of eggs and larvae…OOPS!

Our example represents information collected during one
day at one wetland. To really understand a population, biologists will gather data throughout a year
and combine information over a number of years. Biologists will visit multiple wetlands in an area
and survey multiple areas.

BIG CONCLUSION
1. Populations can be described by various characteristics:
• Number of individuals• Age structure• Sex ratio• Density • Pattern of distribution
2. In science we draw conclusions, or inferences, based on our observations. BUT we have to be careful that we make good, comprehensive observations and that we do not draw conclusions that the data do not support.

Observation and Inference
There is a lot of variability in the world - with observational science or experimental science you need to replicate!
There were no chorus frogs at Station 3, which was the only area with a lot of leaf litter. You conclude that ornate chorus frogs don’t like leaf litter in a wetland. Your buddy has been studying a wetland on the other side of the state and found a lot of ornate chorus frogs around leaf litter. OOPS!

Photo CreditsAll photos except one are courtesy of Rebecca
Means and Ryan Means. Feel free to reuse.
This photo courtesy of Shutter Pop Photo. Please be sure to credit.