Total Ionizing Dose (TID) Radiation Testing of the … · TID Report 11-350 111103 R1.3 An ISO...
81
TID Report 11-350 111103 R1.3 An ISO 9001:2008 and DSCC Certified Company 1 Radiation Assured Devices 5017 N. 30th Street Colorado Springs, CO 80919 (719) 531-0800 Total Ionizing Dose (TID) Radiation Testing of the RH118W Op-Amp for Linear Technology Customer: Linear Technology, PO# 60225L RAD Job Number: 11-350 Part Type Tested: RH118W Op-Amp, RH118 Datasheet Traceability Information: Fab Lot#: WP1240.3 Wfr#: 8, Assembly Lot#: 475879.1 See photograph of unit under test in Appendix A. Quantity of Units: 12 units received, 5 units for biased irradiation, 5 units for unbiased irradiation and 2 units for control. Serial numbers 347, 352, 353, 355, and 357 were biased during irradiation, serial numbers 359, 361, 368, 372, and 378 were unbiased during irradiation and serial numbers 410 and 413 were used as control. See Appendix B for the radiation bias connection table. Radiation and Electrical Test Increments: 50 to 300rad(Si)/s ionizing radiation with electrical test increments: pre-irradiation, 5krad(Si), 10krad(Si), 20krad(Si), 30krad(Si) and 50krad(Si). Pre-Irradiation Burn-In: Burn-In performed by Linear Technology prior to receipt by RAD. Overtest and Post-Irradiation Anneal: No overtest. 24-hour room temperature anneal followed by a 168-hour 100°C anneal. Both anneals shall be performed in the same electrical bias condition as the irradiations. Electrical measurements shall be made following each anneal increment. Radiation Test Standard: MIL-STD-750E TM1019 and/or MIL-STD-883H TM1019 Condition A and Linear Technology RH118 Datasheet. Test Hardware and Software: LTS2020 Automated Tester, Entity ID TS03, Calibration Date: 04-28- 11, Calibration Due 04-28-12. LTS2101 Family Board, Entity ID FB02. LTS0600 Test Fixture, Entity ID TF03. BGSS 040408 RH118 DUT Board. Test Program: RH118LT.SRC Facility and Radiation Source: Radiation Assured Devices' Longmire Laboratories, Colorado Springs, CO. Gamma rays provided by JLSA 81-24 Co60 source. Dosimetry performed by Air Ionization Chamber (AIC) traceable to NIST. RAD's dosimetry has been audited by DSCC and RAD has been awarded Laboratory Suitability for MIL-STD-750 and MIL-STD-883 TM 1019. Irradiation and Test Temperature: Room temperature controlled to 24°C±6°C per MIL-STD-883 and MIL-STD-750. Special Procedures: Interim data reports are to be generated and delivered to the customer at the 5krad(Si) and 10krad(Si) increments. High Dose Rate Test Result: PASSED the total ionizing dose characterization test to the maximum tested dose level of 50krad(Si) with all parameters remaining within their datasheet specifications. Further the units do not exhibit ELDRS as defined in the current test method.
Transcript of Total Ionizing Dose (TID) Radiation Testing of the … · TID Report 11-350 111103 R1.3 An ISO...

TID Report
11-350 111103 R1.3
An ISO 9001:2008 and DSCC Certified Company
1
Radiation Assured Devices 5017 N. 30th Street Colorado Springs, CO 80919 (719) 531-0800
Total Ionizing Dose (TID) Radiation Testing of the RH118W Op-Amp for Linear Technology
Customer: Linear Technology, PO# 60225L
RAD Job Number: 11-350
Part Type Tested: RH118W Op-Amp, RH118 Datasheet
Traceability Information: Fab Lot#: WP1240.3 Wfr#: 8, Assembly Lot#: 475879.1 See photograph of
unit under test in Appendix A.
Quantity of Units: 12 units received, 5 units for biased irradiation, 5 units for unbiased irradiation and 2
units for control. Serial numbers 347, 352, 353, 355, and 357 were biased during irradiation, serial
numbers 359, 361, 368, 372, and 378 were unbiased during irradiation and serial numbers 410 and 413
were used as control. See Appendix B for the radiation bias connection table.
Radiation and Electrical Test Increments: 50 to 300rad(Si)/s ionizing radiation with electrical test
increments: pre-irradiation, 5krad(Si), 10krad(Si), 20krad(Si), 30krad(Si) and 50krad(Si).
Pre-Irradiation Burn-In: Burn-In performed by Linear Technology prior to receipt by RAD.
Overtest and Post-Irradiation Anneal: No overtest. 24-hour room temperature anneal followed by a
168-hour 100°C anneal. Both anneals shall be performed in the same electrical bias condition as the
irradiations. Electrical measurements shall be made following each anneal increment.
Radiation Test Standard: MIL-STD-750E TM1019 and/or MIL-STD-883H TM1019 Condition A and
Linear Technology RH118 Datasheet.
Test Hardware and Software: LTS2020 Automated Tester, Entity ID TS03, Calibration Date: 04-28-
11, Calibration Due 04-28-12. LTS2101 Family Board, Entity ID FB02. LTS0600 Test Fixture, Entity
ID TF03. BGSS 040408 RH118 DUT Board. Test Program: RH118LT.SRC
Facility and Radiation Source: Radiation Assured Devices' Longmire Laboratories, Colorado Springs,
CO. Gamma rays provided by JLSA 81-24 Co60 source. Dosimetry performed by Air Ionization
Chamber (AIC) traceable to NIST. RAD's dosimetry has been audited by DSCC and RAD has been
awarded Laboratory Suitability for MIL-STD-750 and MIL-STD-883 TM 1019.
Irradiation and Test Temperature: Room temperature controlled to 24°C±6°C per MIL-STD-883 and
MIL-STD-750.
Special Procedures: Interim data reports are to be generated and delivered to the customer at the
5krad(Si) and 10krad(Si) increments.
High Dose Rate Test Result: PASSED the total ionizing dose characterization test to the maximum tested dose level of 50krad(Si) with all parameters
remaining within their datasheet specifications. Further the units do not exhibit ELDRS as defined in the current test method.

TID Report
11-350 111103 R1.3
An ISO 9001:2008 and DSCC Certified Company
2
Radiation Assured Devices 5017 N. 30th Street Colorado Springs, CO 80919 (719) 531-0800
1.0. Overview and Background
It is well known that total dose ionizing radiation can cause parametric degradation and ultimately
functional failure in electronic devices. The damage occurs via electron-hole pair production, transport
and trapping in the dielectric and interface regions. In discrete devices the bulk of the damage is
frequently manifested as a reduction in the gain and/or breakdown voltage of the device. The damage
will usually anneal with time following the end of the radiation exposure. Due to this annealing, and to
ensure a worst-case test condition MIL-STD-883 TM1019.8 calls out a dose rate of 50 to 300rad(Si)/s as
Condition A and further specifies that the time from the end of an incremental radiation exposure and
electrical testing shall be 1-hour or less and the total time from the end of one incremental irradiation to
the beginning of the next incremental radiation step should be 2-hours or less. The work described in
this report was performed to meet MIL-STD-883 TM1019.8 Condition A.
2.0. Radiation Test Apparatus
The total ionizing dose testing described in this final report was performed using the facilities at
Aeroflex RAD's Longmire Laboratories in Colorado Springs, CO. The high dose rate total ionizing dose
(TID) source is a JLSA 81-24 irradiator modified to provide a panoramic exposure. The Co-60 rods are
held in the base of the irradiator heavily shielded by lead. During the radiation exposures the rod is
raised by an electronic timer/controller and the exposure is performed in air. The dose rate for this
irradiator in this configuration ranges from <1rad(Si)/s to a maximum of approximately 120rad(Si)/s,
determined by the distance from the source. For high-dose rate experiments the bias boards are placed in
a radial fashion equidistant from the raised Co-60 rods with the distance adjusted to provide the required
dose rate. The irradiator calibration is maintained by Aeroflex RAD Longmire Laboratories using air
ionization chamber (AIC) equipment calibrated with traceability to the National Institute of Standards
and Technology (NIST). Figure 2.1 shows a photograph of the JLSA 81-24 Co-60 irradiator at
Aeroflex RAD's Longmire Laboratory facility.
Aeroflex RAD is currently certified by the Defense Supply Center Columbus (DSCC) for Laboratory
Suitability under MIL STD 750 and MIL-STD-883. Additional details regarding Aeroflex RAD
dosimetry for TM1019 Condition A testing are available in Aeroflex RAD's report to DSCC entitled:
"Dose Rate Mapping of the J.L. Shepherd and Associates Model 81 Irradiator Installed by Radiation
Assured Devices".
TID Report
11-350 111103 R1.3
An ISO 9001:2008 and DSCC Certified Company
3
Radiation Assured Devices 5017 N. 30th Street Colorado Springs, CO 80919 (719) 531-0800
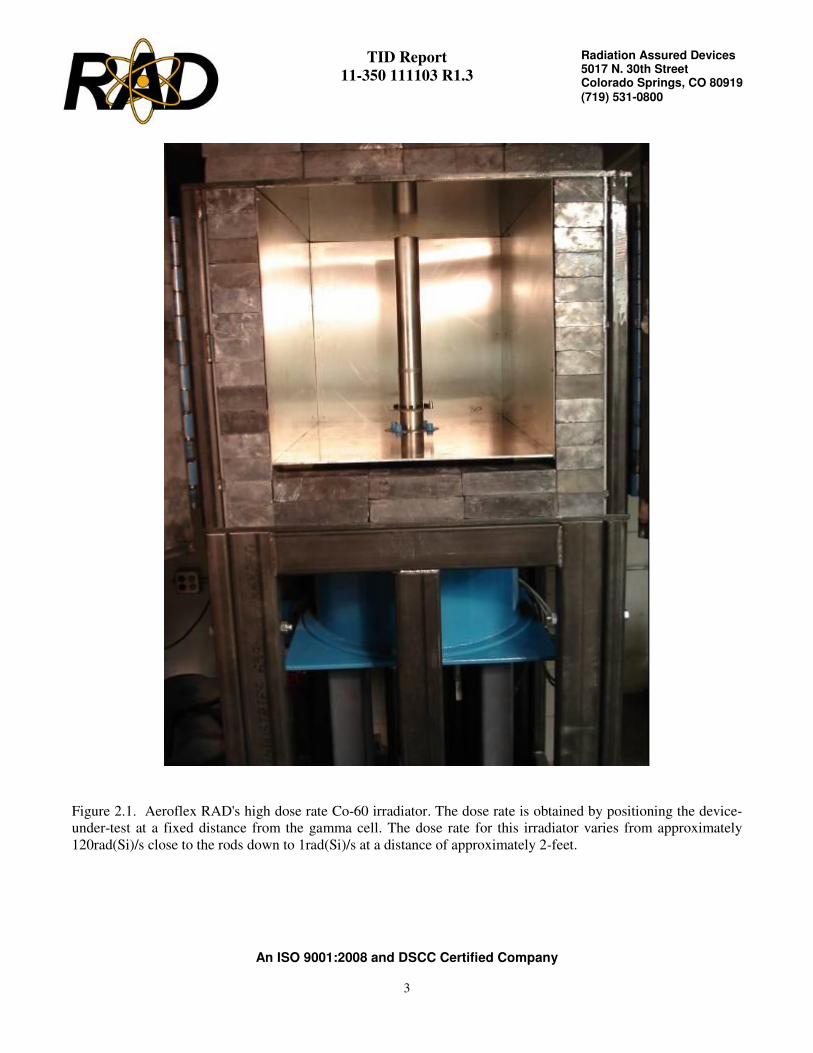
Figure 2.1. Aeroflex RAD's high dose rate Co-60 irradiator. The dose rate is obtained by positioning the device-
under-test at a fixed distance from the gamma cell. The dose rate for this irradiator varies from approximately
120rad(Si)/s close to the rods down to 1rad(Si)/s at a distance of approximately 2-feet.
TID Report
11-350 111103 R1.3
An ISO 9001:2008 and DSCC Certified Company
4
Radiation Assured Devices 5017 N. 30th Street Colorado Springs, CO 80919 (719) 531-0800
3.0. Radiation Test Conditions
The RH118W Op-Amp described in this final report were irradiated using a split 15V supply and with
all pins tied to ground, that is biased and unbiased. See the TID Bias Table in Appendix B for the full
bias circuits. In our opinion, this bias circuit satisfies the requirements of MIL-STD-883H TM1019.8
Section 3.9.3 Bias and Loading Conditions which states "The bias applied to the test devices shall be
selected to produce the greatest radiation induced damage or the worst-case damage for the intended
application, if known. While maximum voltage is often worst case some bipolar linear device
parameters (e.g. input bias current or maximum output load current) exhibit more degradation with 0 V
bias."
The devices were irradiated to a maximum total ionizing dose level of 50krad(Si) with incremental
readings at 5krad(Si), 10krad(Si), 20krad(Si) and 30krad(Si). Electrical testing occurred within one hour
following the end of each irradiation segment. For intermediate irradiations, the parts were tested and
returned to total dose exposure within two hours from the end of the previous radiation increment.
The TID bias board was positioned in the Co-60 cell to provide the required minimum of 50rad(Si)/s
and was located inside a lead-aluminum enclosure. The lead-aluminum enclosure is required under MIL-
STD-883H TM1019.8 Section 3.4 that reads as follows: "Lead/Aluminum (Pb/Al) container. Test
specimens shall be enclosed in a Pb/Al container to minimize dose enhancement effects caused by low-
energy, scattered radiation. A minimum of 1.5 mm Pb, surrounding an inner shield of at least 0.7 mm
Al, is required. This Pb/Al container produces an approximate charged particle equilibrium for Si and
for TLDs such as CaF2. The radiation field intensity shall be measured inside the Pb/Al container (1)
initially, (2) when the source is changed, or (3) when the orientation or configuration of the source,
container, or test-fixture is changed. This measurement shall be performed by placing a dosimeter (e.g.,
a TLD) in the device-irradiation container at the approximate test-device position. If it can be
demonstrated that low energy scattered radiation is small enough that it will not cause dosimetry errors
due to dose enhancement, the Pb/Al container may be omitted."
The final dose rate within the high dose rate lead-aluminum enclosure was determined using calibration
calculations based on air ionization chamber (AIC) dosimetry performed just prior to beginning the total
dose irradiations. The final dose rate for this work was 51.73rad(Si)/s with a precision of ±5%.

TID Report
11-350 111103 R1.3
An ISO 9001:2008 and DSCC Certified Company
5
Radiation Assured Devices 5017 N. 30th Street Colorado Springs, CO 80919 (719) 531-0800
4.0. Tested Parameters
During the total ionizing dose characterization testing the following electrical parameters were measured
pre- and post-irradiation:
1. Positive Supply Current @ +5V 2. Negative Supply Current @ -5V 3. Positive Supply Current @ +20V 4. Negative Supply Current @ -20V 5. Input Offset Voltage @ +/-20V VCM=0V 6. Input Offset Current @ +/-20V VCM=0V 7. Positive Input Bias Current @ +/-20V VCM=0V 8. Negative Input Bias Current @ +/-20V VCM=0V 9. Input Offset Voltage @ +/-15V VCM=0V 10. Input Offset Current @ +/-15V VCM=0V 11. Positive Input Bias Current @ +/-15V VCM=0V 12. Negative Input Bias Current @ +/-15V VCM=0V 13. Input Offset Voltage @ +/-20V VCM=16.5V 14. Input Offset Current @ +/-20V VCM=16.5V 15. Positive Input Bias Current @ +/-20V VCM=16.5V 16. Negative Input Bias Current @ +/-20V VCM=16.5V 17. Input Offset Voltage @ +/-20V VCM=-16.5V 18. Input Offset Current @ +/-20V VCM=-16.5V 19. Positive Input Bias Current @ +/-20V VCM=-16.5V 20. Negative Input Bias Current @ +/-20V VCM=-16.5V 21. Input Offset Voltage @ +/-5V VCM=1V 22. Input Offset Current @ +/-5V VCM=1V 23. Positive Input Bias Current @ +/-5V VCM=1V 24. Negative Input Bias Current @ +/-5V VCM=1V 25. Input Offset Voltage @ +/-5V VCM=-1V 26. Input Offset Current @ +/-5V VCM=-1V 27. Positive Input Bias Current @ +/-5V VCM=-1V 28. Negative Input Bias Current @ +/-5V VCM=-1V 29. Common Mode Rejection Ratio @ +/-20V VCM=+/-16.5V 30. Power Supply Rejection Ratio @ V+/-=+/-5V TO +/-20V 31. Large Signal Voltage Gain @ +/-15V VO=+/-10V RL=2K 32. Positive Output Voltage Swing @ +/-15V RL=2K (AL) 33. Negative Output Voltage Swing @ +/-15V RL=2K (AL)
Appendix C details the measured parameters, test conditions, pre-irradiation specification and
measurement resolution for each of the measurements.
TID Report
11-350 111103 R1.3
An ISO 9001:2008 and DSCC Certified Company
6
Radiation Assured Devices 5017 N. 30th Street Colorado Springs, CO 80919 (719) 531-0800
The parametric data was obtained as "read and record" and all the raw data plus an attributes summary
are contained in this report as well as in a separate Excel file. The attributes data contains the average,
standard deviation and the average with the KTL values applied. The KTL value used in this work is
2.742 per MIL-HDBK-814 using one sided tolerance limits of 90/90 and a 5-piece sample size. The
90/90 KTL values were selected to match the statistical levels specified in the MIL-PRF-38535
sampling plan for the qualification of a radiation hardness assured (RHA) component. Note that the
following criteria must be met for a device to pass the total ionizing dose test: following the radiation
exposure each of the 5 pieces irradiated under electrical bias shall pass the specification value. The units
irradiated without electrical bias and the KTL statistics are included in this report for reference only. If
any of the 5 pieces irradiated under electrical bias exceed the device post radiation data sheet
specification limits, then the lot could be logged as a failure.
Further, MIL-STD-883H, TM 1019.8 Section 3.13.1.1 Characterization test to determine if a part
exhibits ELDRS' states the following: Select a minimum random sample of 21 devices from a
population representative of recent production runs. Smaller sample sizes may be used if agreed upon
between the parties to the test. All of the selected devices shall have undergone appropriate elevated
temperature reliability screens, e.g. burn-in and high temperature storage life. Divide the samples into
four groups of 5 each and use the remaining part for a control. Perform pre-irradiation electrical
characterization on all parts assuring that they meet the Group A electrical tests. Irradiate 5 samples
under a 0 volt bias and another 5 under the irradiation bias given in the acquisition specification at 50-
300 rad(Si)/s and room temperature. Irradiate 5 samples under a 0 volt bias and another 5 under
irradiation bias given in the acquisition specification at < 10mrad(Si)/s and room temperature. Irradiate
all samples to the same dose levels, including 0.5 and 1.0 times the anticipated specification dose, and
repeat the electrical characterization on each part at each dose level. Post irradiation electrical
measurements shall be performed per paragraph 3.10 where the low dose rate test is considered
Condition D. Calculate the radiation induced change in each electrical parameter (∆para) for each
sample at each radiation level. Calculate the ratio of the median ∆para at low dose rate to the median
∆para at high dose rate for each irradiation bias group at each total dose level. If this ratio exceeds 1.5
for any of the most sensitive parameters then the part is considered to be ELDRS susceptible. This test
does not apply to parameters which exhibit changes that are within experimental error or whose values
are below the pre-irradiation electrical specification limits at low dose rate at the specification dose.
Therefore, the data in this report can be analyzed along with the low dose rate report titled "Enhanced
Low Dose Rate Sensitivity (ELDRS) Radiation Testing of the RH118W Op-Amp for Linear
Technology" to demonstrate that these parts do not exhibit ELDRS as defined in the current test method.

TID Report
11-350 111103 R1.3
An ISO 9001:2008 and DSCC Certified Company
7
Radiation Assured Devices 5017 N. 30th Street Colorado Springs, CO 80919 (719) 531-0800
5.0. Total Ionizing Dose Test Results
Based on this criterion the RH118W Op-Amp (from the lot traceability information provided on the first
page of this test report) PASSED the total ionizing dose test to the maximum tested dose level of
50krad(Si) with all parameters remaining within their datasheet specifications.
Figures 5.1 through 5.33 show plots of all the measured parameters versus total ionizing dose while
Tables 5.1 - 5.33 show the corresponding raw data for each of these parameters. In the data plots the
solid diamonds are the average of the measured data points for the sample irradiated under electrical bias
while the shaded diamonds are the average of the measured data points for the units irradiated with all
pins tied to ground. The black lines (solid or dashed) are the average of the data points after application
of the KTL statistics on the sample irradiated in the biased condition while the shaded lines (solid or
dashed) are the average of the data points after application of the KTL statistics on the sample irradiated
in the unbiased condition. The red dotted line(s) are the pre- and/or post-irradiation minimum and/or
maximum specification value as defined in the datasheet and/or test plan.
In addition to the radiation test results, the data plots and tables described above contain anneal data.
The anneals are performed to better understand the underlying physical mechanisms responsible for
radiation-induced parametric shifts and are not part of the criteria used to establish whether or not the lot
passes or fails the low dose rate test. In all cases the parts either improved or exhibited no change during
the anneal.
The control units, as expected, show no significant changes to any of the parameters. Therefore we can
conclude that the electrical testing remained in control throughout the duration of the tests and the
observed degradation was due to the radiation exposure. Appendix D lists the figures used in this section
to facilitate the location of a particular parameter.

TID Report
11-350 111103 R1.3
An ISO 9001:2008 and DSCC Certified Company
8
Radiation Assured Devices 5017 N. 30th Street Colorado Springs, CO 80919 (719) 531-0800
0.00E+00
1.00E-03
2.00E-03
3.00E-03
4.00E-03
5.00E-03
6.00E-03
7.00E-03
8.00E-03
9.00E-03
0 20 40 60 80 100
Total Dose (krad(Si))
Po
sit
ive
Su
pp
ly C
urr
en
t @
+5
V
Average Biased Average Un-Biased Ps90%/90% (+KTL) Biased
Ps90%/90% (+KTL) Un-Biased Specif ication MAX
24-hr 168-hr
Anneal Anneal
Figure 5.1. Plot of Positive Supply Current @ +5V versus total dose. The solid diamonds are the average of the
measured data points for the samples irradiated under electrical bias while the shaded diamonds are the average of
the measured data points for the samples irradiated with all pins tied to ground. The black lines (solid and/or
dashed) are the average of the data points after application of the KTL statistics on the samples irradiated under
electrical bias while the gray lines (solid and/or dashed) are the average of the data points after application of the
KTL statistics on the samples irradiated in the unbiased condition. The red dotted line(s) are the pre- and/or post-
irradiation minimum and/or maximum specification value as defined in the datasheet and/or test plan.
TID Report
11-350 111103 R1.3
An ISO 9001:2008 and DSCC Certified Company
9
Radiation Assured Devices 5017 N. 30th Street Colorado Springs, CO 80919 (719) 531-0800
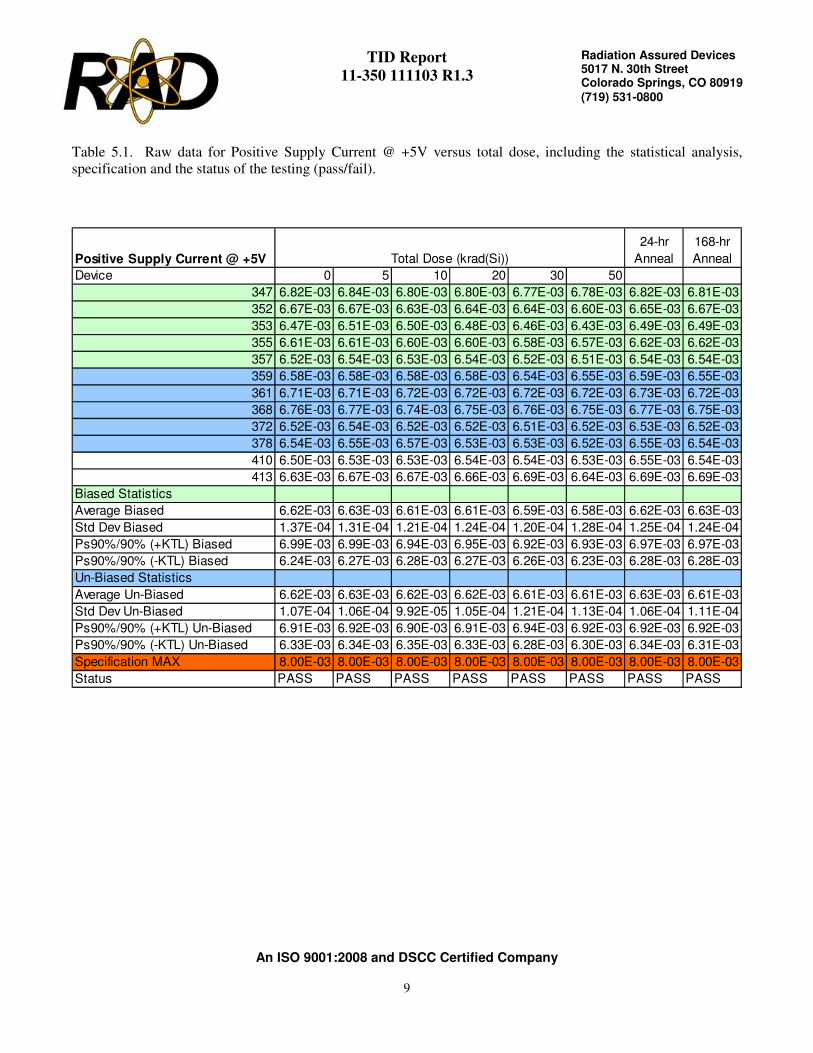
Table 5.1. Raw data for Positive Supply Current @ +5V versus total dose, including the statistical analysis,
specification and the status of the testing (pass/fail).
Positive Supply Current @ +5V
24-hr
Anneal
168-hr
Anneal
Device 0 5 10 20 30 50 80 100
347 6.82E-03 6.84E-03 6.80E-03 6.80E-03 6.77E-03 6.78E-03 6.82E-03 6.81E-03
352 6.67E-03 6.67E-03 6.63E-03 6.64E-03 6.64E-03 6.60E-03 6.65E-03 6.67E-03
353 6.47E-03 6.51E-03 6.50E-03 6.48E-03 6.46E-03 6.43E-03 6.49E-03 6.49E-03
355 6.61E-03 6.61E-03 6.60E-03 6.60E-03 6.58E-03 6.57E-03 6.62E-03 6.62E-03
357 6.52E-03 6.54E-03 6.53E-03 6.54E-03 6.52E-03 6.51E-03 6.54E-03 6.54E-03
359 6.58E-03 6.58E-03 6.58E-03 6.58E-03 6.54E-03 6.55E-03 6.59E-03 6.55E-03
361 6.71E-03 6.71E-03 6.72E-03 6.72E-03 6.72E-03 6.72E-03 6.73E-03 6.72E-03
368 6.76E-03 6.77E-03 6.74E-03 6.75E-03 6.76E-03 6.75E-03 6.77E-03 6.75E-03
372 6.52E-03 6.54E-03 6.52E-03 6.52E-03 6.51E-03 6.52E-03 6.53E-03 6.52E-03
378 6.54E-03 6.55E-03 6.57E-03 6.53E-03 6.53E-03 6.52E-03 6.55E-03 6.54E-03
410 6.50E-03 6.53E-03 6.53E-03 6.54E-03 6.54E-03 6.53E-03 6.55E-03 6.54E-03
413 6.63E-03 6.67E-03 6.67E-03 6.66E-03 6.69E-03 6.64E-03 6.69E-03 6.69E-03
Biased Statistics
Average Biased 6.62E-03 6.63E-03 6.61E-03 6.61E-03 6.59E-03 6.58E-03 6.62E-03 6.63E-03
Std Dev Biased 1.37E-04 1.31E-04 1.21E-04 1.24E-04 1.20E-04 1.28E-04 1.25E-04 1.24E-04
Ps90%/90% (+KTL) Biased 6.99E-03 6.99E-03 6.94E-03 6.95E-03 6.92E-03 6.93E-03 6.97E-03 6.97E-03
Ps90%/90% (-KTL) Biased 6.24E-03 6.27E-03 6.28E-03 6.27E-03 6.26E-03 6.23E-03 6.28E-03 6.28E-03
Un-Biased Statistics
Average Un-Biased 6.62E-03 6.63E-03 6.62E-03 6.62E-03 6.61E-03 6.61E-03 6.63E-03 6.61E-03
Std Dev Un-Biased 1.07E-04 1.06E-04 9.92E-05 1.05E-04 1.21E-04 1.13E-04 1.06E-04 1.11E-04
Ps90%/90% (+KTL) Un-Biased 6.91E-03 6.92E-03 6.90E-03 6.91E-03 6.94E-03 6.92E-03 6.92E-03 6.92E-03
Ps90%/90% (-KTL) Un-Biased 6.33E-03 6.34E-03 6.35E-03 6.33E-03 6.28E-03 6.30E-03 6.34E-03 6.31E-03
Specification MAX 8.00E-03 8.00E-03 8.00E-03 8.00E-03 8.00E-03 8.00E-03 8.00E-03 8.00E-03
Status PASS PASS PASS PASS PASS PASS PASS PASS
Total Dose (krad(Si))
TID Report
11-350 111103 R1.3
An ISO 9001:2008 and DSCC Certified Company
10
Radiation Assured Devices 5017 N. 30th Street Colorado Springs, CO 80919 (719) 531-0800
-9.00E-03
-8.00E-03
-7.00E-03
-6.00E-03
-5.00E-03
-4.00E-03
-3.00E-03
-2.00E-03
-1.00E-03
0.00E+00
0 20 40 60 80 100
Total Dose (krad(Si))
Ne
ga
tiv
e S
up
ply
Cu
rre
nt
@ -
5V
Average Biased Average Un-Biased Ps90%/90% (-KTL) Biased
Ps90%/90% (-KTL) Un-Biased Specif ication MIN
24-hr 168-hr
Anneal Anneal
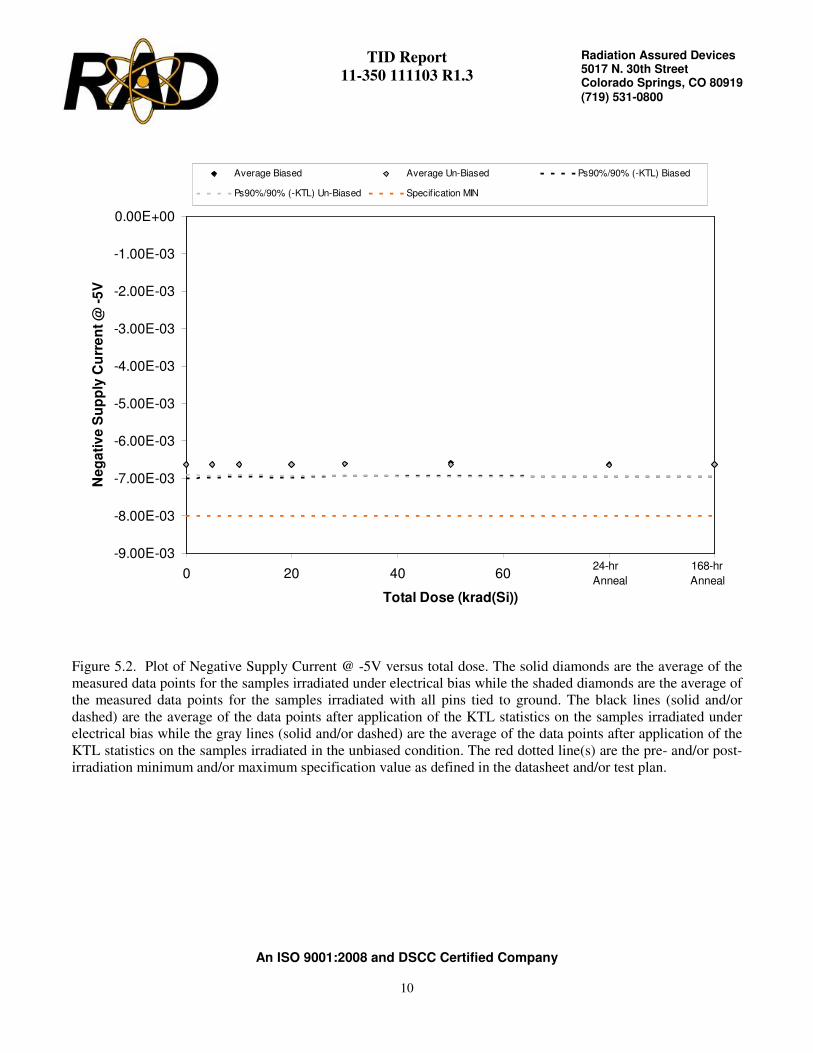
Figure 5.2. Plot of Negative Supply Current @ -5V versus total dose. The solid diamonds are the average of the
measured data points for the samples irradiated under electrical bias while the shaded diamonds are the average of
the measured data points for the samples irradiated with all pins tied to ground. The black lines (solid and/or
dashed) are the average of the data points after application of the KTL statistics on the samples irradiated under
electrical bias while the gray lines (solid and/or dashed) are the average of the data points after application of the
KTL statistics on the samples irradiated in the unbiased condition. The red dotted line(s) are the pre- and/or post-
irradiation minimum and/or maximum specification value as defined in the datasheet and/or test plan.

TID Report
11-350 111103 R1.3
An ISO 9001:2008 and DSCC Certified Company
11
Radiation Assured Devices 5017 N. 30th Street Colorado Springs, CO 80919 (719) 531-0800
Table 5.2. Raw data for Negative Supply Current @ -5V versus total dose, including the statistical analysis,
specification and the status of the testing (pass/fail).
Negative Supply Current @ -5V
24-hr
Anneal
168-hr
Anneal
Device 0 5 10 20 30 50 80 100
347 -6.83E-03 -6.84E-03 -6.80E-03 -6.83E-03 -6.78E-03 -6.76E-03 -6.82E-03 -6.81E-03
352 -6.68E-03 -6.66E-03 -6.67E-03 -6.64E-03 -6.62E-03 -6.62E-03 -6.64E-03 -6.66E-03
353 -6.47E-03 -6.51E-03 -6.49E-03 -6.48E-03 -6.47E-03 -6.44E-03 -6.50E-03 -6.49E-03
355 -6.60E-03 -6.62E-03 -6.62E-03 -6.61E-03 -6.60E-03 -6.58E-03 -6.61E-03 -6.61E-03
357 -6.53E-03 -6.56E-03 -6.55E-03 -6.54E-03 -6.52E-03 -6.51E-03 -6.56E-03 -6.57E-03
359 -6.57E-03 -6.58E-03 -6.58E-03 -6.56E-03 -6.56E-03 -6.54E-03 -6.61E-03 -6.57E-03
361 -6.72E-03 -6.72E-03 -6.72E-03 -6.74E-03 -6.73E-03 -6.75E-03 -6.75E-03 -6.74E-03
368 -6.75E-03 -6.77E-03 -6.76E-03 -6.76E-03 -6.75E-03 -6.75E-03 -6.78E-03 -6.78E-03
372 -6.52E-03 -6.53E-03 -6.53E-03 -6.51E-03 -6.51E-03 -6.51E-03 -6.53E-03 -6.50E-03
378 -6.54E-03 -6.56E-03 -6.59E-03 -6.55E-03 -6.54E-03 -6.54E-03 -6.57E-03 -6.55E-03
410 -6.51E-03 -6.54E-03 -6.51E-03 -6.54E-03 -6.55E-03 -6.54E-03 -6.55E-03 -6.55E-03
413 -6.64E-03 -6.69E-03 -6.67E-03 -6.67E-03 -6.68E-03 -6.66E-03 -6.69E-03 -6.68E-03
Biased Statistics
Average Biased -6.62E-03 -6.64E-03 -6.62E-03 -6.62E-03 -6.60E-03 -6.58E-03 -6.62E-03 -6.63E-03
Std Dev Biased 1.38E-04 1.27E-04 1.18E-04 1.30E-04 1.20E-04 1.23E-04 1.22E-04 1.17E-04
Ps90%/90% (+KTL) Biased -6.24E-03 -6.29E-03 -6.30E-03 -6.26E-03 -6.27E-03 -6.24E-03 -6.29E-03 -6.31E-03
Ps90%/90% (-KTL) Biased -7.00E-03 -6.98E-03 -6.95E-03 -6.98E-03 -6.93E-03 -6.92E-03 -6.96E-03 -6.95E-03
Un-Biased Statistics
Average Un-Biased -6.62E-03 -6.63E-03 -6.63E-03 -6.62E-03 -6.62E-03 -6.62E-03 -6.64E-03 -6.63E-03
Std Dev Un-Biased 1.07E-04 1.08E-04 1.00E-04 1.14E-04 1.15E-04 1.22E-04 1.11E-04 1.23E-04
Ps90%/90% (+KTL) Un-Biased -6.32E-03 -6.33E-03 -6.36E-03 -6.31E-03 -6.30E-03 -6.28E-03 -6.34E-03 -6.29E-03
Ps90%/90% (-KTL) Un-Biased -6.91E-03 -6.93E-03 -6.91E-03 -6.94E-03 -6.93E-03 -6.95E-03 -6.95E-03 -6.96E-03
Specification MIN -8.00E-03 -8.00E-03 -8.00E-03 -8.00E-03 -8.00E-03 -8.00E-03 -8.00E-03 -8.00E-03
Status PASS PASS PASS PASS PASS PASS PASS PASS
Total Dose (krad(Si))

TID Report
11-350 111103 R1.3
An ISO 9001:2008 and DSCC Certified Company
12
Radiation Assured Devices 5017 N. 30th Street Colorado Springs, CO 80919 (719) 531-0800
7.00E-03
7.20E-03
7.40E-03
7.60E-03
7.80E-03
8.00E-03
8.20E-03
0 20 40 60 80 100
Total Dose (krad(Si))
Po
sit
ive
Su
pp
ly C
urr
en
t @
+2
0V
Average Biased Average Un-Biased Ps90%/90% (+KTL) Biased
Ps90%/90% (+KTL) Un-Biased Specif ication MAX
24-hr 168-hr
Anneal Anneal
Figure 5.3. Plot of Positive Supply Current @ +20V versus total dose. The solid diamonds are the average of the
measured data points for the samples irradiated under electrical bias while the shaded diamonds are the average of
the measured data points for the samples irradiated with all pins tied to ground. The black lines (solid and/or
dashed) are the average of the data points after application of the KTL statistics on the samples irradiated under
electrical bias while the gray lines (solid and/or dashed) are the average of the data points after application of the
KTL statistics on the samples irradiated in the unbiased condition. The red dotted line(s) are the pre- and/or post-
irradiation minimum and/or maximum specification value as defined in the datasheet and/or test plan.

TID Report
11-350 111103 R1.3
An ISO 9001:2008 and DSCC Certified Company
13
Radiation Assured Devices 5017 N. 30th Street Colorado Springs, CO 80919 (719) 531-0800
Table 5.3. Raw data for Positive Supply Current @ +20V versus total dose, including the statistical analysis,
specification and the status of the testing (pass/fail).
Positive Supply Current @ +20V
24-hr
Anneal
168-hr
Anneal
Device 0 5 10 20 30 50 80 100
347 7.27E-03 7.29E-03 7.28E-03 7.29E-03 7.25E-03 7.26E-03 7.29E-03 7.28E-03
352 7.13E-03 7.12E-03 7.10E-03 7.11E-03 7.10E-03 7.09E-03 7.13E-03 7.14E-03
353 6.90E-03 6.95E-03 6.94E-03 6.93E-03 6.92E-03 6.91E-03 6.94E-03 6.96E-03
355 7.05E-03 7.07E-03 7.07E-03 7.06E-03 7.05E-03 7.05E-03 7.09E-03 7.08E-03
357 6.97E-03 7.00E-03 7.02E-03 6.99E-03 6.99E-03 6.98E-03 7.02E-03 7.01E-03
359 6.99E-03 7.00E-03 7.00E-03 7.00E-03 7.00E-03 6.99E-03 7.03E-03 7.01E-03
361 7.18E-03 7.21E-03 7.20E-03 7.21E-03 7.22E-03 7.23E-03 7.24E-03 7.23E-03
368 7.21E-03 7.22E-03 7.21E-03 7.22E-03 7.23E-03 7.20E-03 7.25E-03 7.22E-03
372 6.95E-03 6.95E-03 6.97E-03 6.95E-03 6.95E-03 6.95E-03 6.97E-03 6.96E-03
378 6.98E-03 7.00E-03 6.99E-03 6.98E-03 6.98E-03 6.99E-03 7.00E-03 6.97E-03
410 6.94E-03 6.97E-03 6.97E-03 6.97E-03 6.97E-03 6.96E-03 6.98E-03 6.97E-03
413 7.09E-03 7.12E-03 7.12E-03 7.10E-03 7.12E-03 7.13E-03 7.14E-03 7.13E-03
Biased Statistics
Average Biased 7.07E-03 7.08E-03 7.08E-03 7.08E-03 7.06E-03 7.06E-03 7.09E-03 7.10E-03
Std Dev Biased 1.43E-04 1.33E-04 1.26E-04 1.38E-04 1.25E-04 1.31E-04 1.34E-04 1.26E-04
Ps90%/90% (+KTL) Biased 7.46E-03 7.45E-03 7.43E-03 7.46E-03 7.40E-03 7.42E-03 7.46E-03 7.44E-03
Ps90%/90% (-KTL) Biased 6.67E-03 6.72E-03 6.74E-03 6.70E-03 6.72E-03 6.70E-03 6.73E-03 6.75E-03
Un-Biased Statistics
Average Un-Biased 7.06E-03 7.08E-03 7.07E-03 7.07E-03 7.07E-03 7.07E-03 7.10E-03 7.08E-03
Std Dev Un-Biased 1.25E-04 1.26E-04 1.21E-04 1.34E-04 1.38E-04 1.33E-04 1.37E-04 1.35E-04
Ps90%/90% (+KTL) Un-Biased 7.40E-03 7.42E-03 7.41E-03 7.44E-03 7.45E-03 7.44E-03 7.47E-03 7.45E-03
Ps90%/90% (-KTL) Un-Biased 6.72E-03 6.73E-03 6.74E-03 6.70E-03 6.70E-03 6.71E-03 6.72E-03 6.71E-03
Specification MAX 8.00E-03 8.00E-03 8.00E-03 8.00E-03 8.00E-03 8.00E-03 8.00E-03 8.00E-03
Status PASS PASS PASS PASS PASS PASS PASS PASS
Total Dose (krad(Si))

TID Report
11-350 111103 R1.3
An ISO 9001:2008 and DSCC Certified Company
14
Radiation Assured Devices 5017 N. 30th Street Colorado Springs, CO 80919 (719) 531-0800
-8.20E-03
-8.00E-03
-7.80E-03
-7.60E-03
-7.40E-03
-7.20E-03
-7.00E-03
-6.80E-03
0 20 40 60 80 100
Total Dose (krad(Si))
Ne
ga
tiv
e S
up
ply
Cu
rre
nt
@ -
20
V
Average Biased Average Un-Biased Ps90%/90% (-KTL) Biased
Ps90%/90% (-KTL) Un-Biased Specif ication MIN
24-hr 168-hr
Anneal Anneal
Figure 5.4. Plot of Negative Supply Current @ -20V versus total dose. The solid diamonds are the average of the
measured data points for the samples irradiated under electrical bias while the shaded diamonds are the average of
the measured data points for the samples irradiated with all pins tied to ground. The black lines (solid and/or
dashed) are the average of the data points after application of the KTL statistics on the samples irradiated under
electrical bias while the gray lines (solid and/or dashed) are the average of the data points after application of the
KTL statistics on the samples irradiated in the unbiased condition. The red dotted line(s) are the pre- and/or post-
irradiation minimum and/or maximum specification value as defined in the datasheet and/or test plan.

TID Report
11-350 111103 R1.3
An ISO 9001:2008 and DSCC Certified Company
15
Radiation Assured Devices 5017 N. 30th Street Colorado Springs, CO 80919 (719) 531-0800
Table 5.4. Raw data for Negative Supply Current @ -20V versus total dose, including the statistical analysis,
specification and the status of the testing (pass/fail).
Negative Supply Current @ -20V
24-hr
Anneal
168-hr
Anneal
Device 0 5 10 20 30 50 80 100
347 -7.26E-03 -7.27E-03 -7.23E-03 -7.25E-03 -7.24E-03 -7.25E-03 -7.30E-03 -7.27E-03
352 -7.11E-03 -7.12E-03 -7.12E-03 -7.09E-03 -7.08E-03 -7.09E-03 -7.11E-03 -7.13E-03
353 -6.89E-03 -6.92E-03 -6.93E-03 -6.92E-03 -6.91E-03 -6.89E-03 -6.93E-03 -6.95E-03
355 -7.04E-03 -7.07E-03 -7.06E-03 -7.06E-03 -7.04E-03 -7.02E-03 -7.08E-03 -7.08E-03
357 -6.96E-03 -6.98E-03 -7.00E-03 -6.96E-03 -6.96E-03 -6.98E-03 -6.99E-03 -6.99E-03
359 -6.99E-03 -7.00E-03 -7.00E-03 -6.99E-03 -6.98E-03 -6.99E-03 -7.01E-03 -6.99E-03
361 -7.17E-03 -7.19E-03 -7.20E-03 -7.22E-03 -7.21E-03 -7.23E-03 -7.24E-03 -7.23E-03
368 -7.20E-03 -7.22E-03 -7.21E-03 -7.20E-03 -7.21E-03 -7.21E-03 -7.22E-03 -7.21E-03
372 -6.94E-03 -6.93E-03 -6.95E-03 -6.94E-03 -6.95E-03 -6.95E-03 -6.96E-03 -6.95E-03
378 -6.97E-03 -6.99E-03 -6.97E-03 -6.97E-03 -6.98E-03 -6.97E-03 -7.00E-03 -6.96E-03
410 -6.93E-03 -6.95E-03 -6.94E-03 -6.96E-03 -6.96E-03 -6.95E-03 -6.98E-03 -6.98E-03
413 -7.08E-03 -7.10E-03 -7.10E-03 -7.09E-03 -7.12E-03 -7.10E-03 -7.12E-03 -7.12E-03
Biased Statistics
Average Biased -7.05E-03 -7.07E-03 -7.07E-03 -7.06E-03 -7.04E-03 -7.05E-03 -7.08E-03 -7.08E-03
Std Dev Biased 1.43E-04 1.34E-04 1.16E-04 1.27E-04 1.29E-04 1.34E-04 1.42E-04 1.28E-04
Ps90%/90% (+KTL) Biased -6.66E-03 -6.70E-03 -6.75E-03 -6.71E-03 -6.69E-03 -6.68E-03 -6.69E-03 -6.73E-03
Ps90%/90% (-KTL) Biased -7.45E-03 -7.44E-03 -7.39E-03 -7.40E-03 -7.40E-03 -7.41E-03 -7.47E-03 -7.43E-03
Un-Biased Statistics
Average Un-Biased -7.05E-03 -7.07E-03 -7.07E-03 -7.07E-03 -7.06E-03 -7.07E-03 -7.09E-03 -7.07E-03
Std Dev Un-Biased 1.23E-04 1.30E-04 1.28E-04 1.37E-04 1.32E-04 1.37E-04 1.29E-04 1.41E-04
Ps90%/90% (+KTL) Un-Biased -6.72E-03 -6.71E-03 -6.71E-03 -6.69E-03 -6.70E-03 -6.69E-03 -6.73E-03 -6.68E-03
Ps90%/90% (-KTL) Un-Biased -7.39E-03 -7.42E-03 -7.42E-03 -7.44E-03 -7.43E-03 -7.45E-03 -7.44E-03 -7.45E-03
Specification MIN -8.00E-03 -8.00E-03 -8.00E-03 -8.00E-03 -8.00E-03 -8.00E-03 -8.00E-03 -8.00E-03
Status PASS PASS PASS PASS PASS PASS PASS PASS
Total Dose (krad(Si))

TID Report
11-350 111103 R1.3
An ISO 9001:2008 and DSCC Certified Company
16
Radiation Assured Devices 5017 N. 30th Street Colorado Springs, CO 80919 (719) 531-0800
-5.00E-03
-4.00E-03
-3.00E-03
-2.00E-03
-1.00E-03
0.00E+00
1.00E-03
2.00E-03
3.00E-03
4.00E-03
5.00E-03
0 20 40 60 80 100
Total Dose (krad(Si))
Inp
ut
Off
se
t V
olt
ag
e @
+/-
20
V V
CM
=0
V
Average Biased Average Un-Biased Ps90%/90% (-KTL) Biased
Ps90%/90% (-KTL) Un-Biased Ps90%/90% (+KTL) Biased Ps90%/90% (+KTL) Un-Biased
Specif ication MIN Specif ication MAX
24-hr 168-hr
Anneal Anneal
Figure 5.5. Plot of Input Offset Voltage @ +/-20V VCM=0V versus total dose. The solid diamonds are the
average of the measured data points for the samples irradiated under electrical bias while the shaded diamonds are
the average of the measured data points for the samples irradiated with all pins tied to ground. The black lines
(solid and/or dashed) are the average of the data points after application of the KTL statistics on the samples
irradiated under electrical bias while the gray lines (solid and/or dashed) are the average of the data points after
application of the KTL statistics on the samples irradiated in the unbiased condition. The red dotted line(s) are the
pre- and/or post-irradiation minimum and/or maximum specification value as defined in the datasheet and/or test
plan.

TID Report
11-350 111103 R1.3
An ISO 9001:2008 and DSCC Certified Company
17
Radiation Assured Devices 5017 N. 30th Street Colorado Springs, CO 80919 (719) 531-0800
Table 5.5. Raw data for Input Offset Voltage @ +/-20V VCM=0V versus total dose, including the statistical
analysis, specification and the status of the testing (pass/fail).
Input Offset Voltage @ +/-20V VCM=0V
24-hr
Anneal
168-hr
Anneal
Device 0 5 10 20 30 50 80 100
347 5.55E-04 -1.78E-04 -8.20E-05 7.70E-05 1.85E-04 -3.20E-05 2.91E-04 5.30E-05
352 2.14E-04 2.00E-05 1.24E-04 2.53E-04 2.92E-04 -6.20E-04 2.92E-04 1.85E-04
353 6.57E-04 -3.89E-04 -2.78E-04 -1.22E-04 -2.29E-04 -2.74E-03 -1.72E-04 -6.00E-06
355 -2.27E-04 4.80E-04 5.94E-04 7.45E-04 8.01E-04 -9.40E-05 8.69E-04 6.13E-04
357 -8.12E-04 1.07E-03 1.18E-03 1.33E-03 1.38E-03 1.57E-04 1.45E-03 1.37E-03
359 -1.95E-03 2.07E-03 2.19E-03 2.33E-03 2.44E-03 2.59E-03 2.57E-03 2.39E-03
361 -1.02E-03 1.18E-03 1.28E-03 1.44E-03 1.54E-03 1.66E-03 1.67E-03 1.51E-03
368 1.67E-04 -6.80E-05 4.00E-05 1.77E-04 2.68E-04 3.90E-04 4.02E-04 2.02E-04
372 6.90E-05 5.90E-05 1.75E-04 3.26E-04 4.43E-04 5.94E-04 5.93E-04 4.10E-04
378 -4.29E-04 5.49E-04 6.55E-04 7.97E-04 9.11E-04 1.02E-03 1.02E-03 8.69E-04
410 -3.90E-04 4.18E-04 4.26E-04 4.28E-04 4.27E-04 4.21E-04 4.43E-04 4.26E-04
413 -1.52E-03 1.48E-03 1.49E-03 1.50E-03 1.48E-03 1.49E-03 1.48E-03 1.48E-03
Biased Statistics
Average Biased 7.74E-05 2.00E-04 3.08E-04 4.57E-04 4.86E-04 -6.66E-04 5.47E-04 4.43E-04
Std Dev Biased 6.05E-04 5.81E-04 5.87E-04 5.84E-04 6.21E-04 1.19E-03 6.27E-04 5.72E-04
Ps90%/90% (+KTL) Biased 1.74E-03 1.79E-03 1.92E-03 2.06E-03 2.19E-03 2.61E-03 2.27E-03 2.01E-03
Ps90%/90% (-KTL) Biased -1.58E-03 -1.39E-03 -1.30E-03 -1.15E-03 -1.22E-03 -3.94E-03 -1.17E-03 -1.13E-03
Un-Biased Statistics
Average Un-Biased -6.34E-04 7.58E-04 8.68E-04 1.01E-03 1.12E-03 1.25E-03 1.25E-03 1.08E-03
Std Dev Un-Biased 8.76E-04 8.82E-04 8.83E-04 8.85E-04 8.85E-04 8.91E-04 8.84E-04 8.90E-04
Ps90%/90% (+KTL) Un-Biased 1.77E-03 3.17E-03 3.29E-03 3.44E-03 3.54E-03 3.69E-03 3.68E-03 3.52E-03
Ps90%/90% (-KTL) Un-Biased -3.04E-03 -1.66E-03 -1.55E-03 -1.41E-03 -1.31E-03 -1.19E-03 -1.17E-03 -1.36E-03
Specification MIN -4.00E-03 -4.00E-03 -4.00E-03 -4.00E-03 -4.00E-03 -4.00E-03 -4.00E-03 -4.00E-03
Status PASS PASS PASS PASS PASS PASS PASS PASS
Specification MAX 4.00E-03 4.00E-03 4.00E-03 4.00E-03 4.00E-03 4.00E-03 4.00E-03 4.00E-03
Status PASS PASS PASS PASS PASS PASS PASS PASS
Total Dose (krad(Si))

TID Report
11-350 111103 R1.3
An ISO 9001:2008 and DSCC Certified Company
18
Radiation Assured Devices 5017 N. 30th Street Colorado Springs, CO 80919 (719) 531-0800
-6.00E-08
-4.00E-08
-2.00E-08
0.00E+00
2.00E-08
4.00E-08
6.00E-08
0 20 40 60 80 100
Total Dose (krad(Si))
Inp
ut
Off
se
t C
urr
en
t @
+/-
20
V V
CM
=0
V
Average Biased Average Un-Biased Ps90%/90% (-KTL) Biased
Ps90%/90% (-KTL) Un-Biased Ps90%/90% (+KTL) Biased Ps90%/90% (+KTL) Un-Biased
Specif ication MIN Specif ication MAX
24-hr 168-hr
Anneal Anneal
Figure 5.6. Plot of Input Offset Current @ +/-20V VCM=0V versus total dose. The solid diamonds are the
average of the measured data points for the samples irradiated under electrical bias while the shaded diamonds are
the average of the measured data points for the samples irradiated with all pins tied to ground. The black lines
(solid and/or dashed) are the average of the data points after application of the KTL statistics on the samples
irradiated under electrical bias while the gray lines (solid and/or dashed) are the average of the data points after
application of the KTL statistics on the samples irradiated in the unbiased condition. The red dotted line(s) are the
pre- and/or post-irradiation minimum and/or maximum specification value as defined in the datasheet and/or test
plan.

TID Report
11-350 111103 R1.3
An ISO 9001:2008 and DSCC Certified Company
19
Radiation Assured Devices 5017 N. 30th Street Colorado Springs, CO 80919 (719) 531-0800
Table 5.6. Raw data for Input Offset Current @ +/-20V VCM=0V versus total dose, including the statistical
analysis, specification and the status of the testing (pass/fail).
Input Offset Current @ +/-20V VCM=0V
24-hr
Anneal
168-hr
Anneal
Device 0 5 10 20 30 50 80 100
347 3.78E-09 -2.81E-09 -2.62E-09 -2.48E-09 -1.88E-09 -1.66E-09 -2.17E-09 -2.52E-09
352 -2.80E-10 -8.90E-10 -8.50E-10 -2.60E-10 -2.40E-10 -3.40E-10 -4.90E-10 -1.48E-09
353 -2.08E-09 2.24E-09 2.37E-09 2.91E-09 3.16E-09 3.62E-09 3.40E-09 2.05E-09
355 -1.29E-09 6.00E-11 2.20E-10 1.80E-10 4.40E-10 5.30E-10 4.40E-10 4.60E-10
357 -1.02E-09 9.20E-10 1.39E-09 1.57E-09 2.06E-09 1.87E-09 1.42E-09 3.90E-10
359 -4.80E-10 -6.70E-10 -3.50E-10 -8.00E-11 2.90E-10 6.40E-10 3.70E-10 -4.80E-10
361 1.00E-09 -1.31E-09 -1.28E-09 -8.70E-10 -9.10E-10 -3.80E-10 -4.60E-10 -1.25E-09
368 -1.25E-09 -1.49E-09 -1.20E-09 -1.03E-09 -7.30E-10 0.00E+00 -2.10E-10 -1.13E-09
372 -1.00E-11 -7.90E-10 -6.00E-10 -1.90E-10 3.00E-11 3.40E-10 4.30E-10 1.20E-10
378 -1.50E-10 -6.30E-10 -3.20E-10 -3.90E-10 2.10E-10 -2.40E-10 -1.30E-10 -4.10E-10
410 -1.19E-09 1.13E-09 1.14E-09 1.16E-09 1.19E-09 1.24E-09 1.20E-09 1.27E-09
413 -1.16E-09 1.09E-09 1.11E-09 1.04E-09 1.05E-09 1.20E-09 1.01E-09 1.02E-09
Biased Statistics
Average Biased -1.78E-10 -9.60E-11 1.02E-10 3.84E-10 7.08E-10 8.04E-10 5.20E-10 -2.20E-10
Std Dev Biased 2.30E-09 1.90E-09 1.95E-09 2.03E-09 1.97E-09 2.03E-09 2.08E-09 1.79E-09
Ps90%/90% (+KTL) Biased 6.14E-09 5.13E-09 5.44E-09 5.94E-09 6.11E-09 6.38E-09 6.23E-09 4.70E-09
Ps90%/90% (-KTL) Biased -6.50E-09 -5.32E-09 -5.23E-09 -5.18E-09 -4.69E-09 -4.77E-09 -5.19E-09 -5.14E-09
Un-Biased Statistics
Average Un-Biased -1.78E-10 -9.78E-10 -7.50E-10 -5.12E-10 -2.22E-10 7.20E-11 5.17E-27 -6.30E-10
Std Dev Un-Biased 8.15E-10 3.95E-10 4.61E-10 4.19E-10 5.58E-10 4.19E-10 3.85E-10 5.63E-10
Ps90%/90% (+KTL) Un-Biased 2.06E-09 1.05E-10 5.15E-10 6.36E-10 1.31E-09 1.22E-09 1.06E-09 9.14E-10
Ps90%/90% (-KTL) Un-Biased -2.41E-09 -2.06E-09 -2.01E-09 -1.66E-09 -1.75E-09 -1.08E-09 -1.06E-09 -2.17E-09
Specification MIN -5.00E-08 -5.00E-08 -5.00E-08 -5.00E-08 -5.00E-08 -5.00E-08 -5.00E-08 -5.00E-08
Status PASS PASS PASS PASS PASS PASS PASS PASS
Specification MAX 5.00E-08 5.00E-08 5.00E-08 5.00E-08 5.00E-08 5.00E-08 5.00E-08 5.00E-08
Status PASS PASS PASS PASS PASS PASS PASS PASS
Total Dose (krad(Si))

TID Report
11-350 111103 R1.3
An ISO 9001:2008 and DSCC Certified Company
20
Radiation Assured Devices 5017 N. 30th Street Colorado Springs, CO 80919 (719) 531-0800
-3.00E-07
-2.00E-07
-1.00E-07
0.00E+00
1.00E-07
2.00E-07
3.00E-07
0 20 40 60 80 100
Total Dose (krad(Si))
Po
sit
ive
In
pu
t B
ias
Cu
rre
nt
@ +
/-2
0V
VC
M=
0V
Average Biased Average Un-Biased
Ps90%/90% (-KTL) Biased Ps90%/90% (-KTL) Un-Biased
Ps90%/90% (+KTL) Biased Ps90%/90% (+KTL) Un-Biased
Specif ication MIN Specif ication MAX
24-hr 168-hr
Anneal Anneal
Figure 5.7. Plot of Positive Input Bias Current @ +/-20V VCM=0V versus total dose. The solid diamonds are the
average of the measured data points for the samples irradiated under electrical bias while the shaded diamonds are
the average of the measured data points for the samples irradiated with all pins tied to ground. The black lines
(solid and/or dashed) are the average of the data points after application of the KTL statistics on the samples
irradiated under electrical bias while the gray lines (solid and/or dashed) are the average of the data points after
application of the KTL statistics on the samples irradiated in the unbiased condition. The red dotted line(s) are the
pre- and/or post-irradiation minimum and/or maximum specification value as defined in the datasheet and/or test
plan.

TID Report
11-350 111103 R1.3
An ISO 9001:2008 and DSCC Certified Company
21
Radiation Assured Devices 5017 N. 30th Street Colorado Springs, CO 80919 (719) 531-0800
Table 5.7. Raw data for Positive Input Bias Current @ +/-20V VCM=0V versus total dose, including the
statistical analysis, specification and the status of the testing (pass/fail).
Positive Input Bias Current @ +/-20V VCM=0V
24-hr
Anneal
168-hr
Anneal
Device 0 5 10 20 30 50 80 100
347 -1.17E-07 1.18E-07 1.22E-07 1.29E-07 1.34E-07 1.42E-07 1.37E-07 1.29E-07
352 -1.00E-07 1.02E-07 1.06E-07 1.12E-07 1.17E-07 1.24E-07 1.18E-07 1.12E-07
353 -9.75E-08 1.00E-07 1.04E-07 1.11E-07 1.16E-07 1.23E-07 1.18E-07 1.10E-07
355 -9.76E-08 9.98E-08 1.04E-07 1.10E-07 1.14E-07 1.21E-07 1.16E-07 1.11E-07
357 -9.73E-08 9.98E-08 1.04E-07 1.10E-07 1.14E-07 1.21E-07 1.16E-07 1.09E-07
359 -9.89E-08 1.05E-07 1.10E-07 1.19E-07 1.26E-07 1.38E-07 1.34E-07 1.23E-07
361 -7.88E-08 8.53E-08 8.93E-08 9.69E-08 1.03E-07 1.13E-07 1.09E-07 9.97E-08
368 -9.90E-08 1.06E-07 1.11E-07 1.20E-07 1.26E-07 1.38E-07 1.35E-07 1.24E-07
372 -9.20E-08 9.87E-08 1.04E-07 1.12E-07 1.18E-07 1.30E-07 1.26E-07 1.16E-07
378 -1.00E-07 1.07E-07 1.12E-07 1.21E-07 1.28E-07 1.40E-07 1.36E-07 1.25E-07
410 -9.54E-08 9.58E-08 9.59E-08 9.59E-08 9.58E-08 9.58E-08 9.61E-08 9.60E-08
413 -1.02E-07 1.03E-07 1.02E-07 1.02E-07 1.03E-07 1.02E-07 1.03E-07 1.03E-07
Biased Statistics
Average Biased -1.02E-07 1.04E-07 1.08E-07 1.14E-07 1.19E-07 1.26E-07 1.21E-07 1.14E-07
Std Dev Biased 8.74E-09 7.89E-09 8.07E-09 8.37E-09 8.46E-09 9.05E-09 8.87E-09 8.56E-09
Ps90%/90% (+KTL) Biased -7.80E-08 1.26E-07 1.30E-07 1.37E-07 1.42E-07 1.51E-07 1.45E-07 1.38E-07
Ps90%/90% (-KTL) Biased -1.26E-07 8.23E-08 8.58E-08 9.14E-08 9.57E-08 1.01E-07 9.67E-08 9.08E-08
Un-Biased Statistics
Average Un-Biased -9.37E-08 1.00E-07 1.05E-07 1.14E-07 1.20E-07 1.32E-07 1.28E-07 1.18E-07
Std Dev Un-Biased 8.99E-09 9.04E-09 9.62E-09 1.00E-08 1.04E-08 1.13E-08 1.13E-08 1.06E-08
Ps90%/90% (+KTL) Un-Biased -6.91E-08 1.25E-07 1.32E-07 1.41E-07 1.49E-07 1.63E-07 1.59E-07 1.47E-07
Ps90%/90% (-KTL) Un-Biased -1.18E-07 7.56E-08 7.91E-08 8.62E-08 9.19E-08 1.01E-07 9.71E-08 8.84E-08
Specification MIN -2.50E-07 -2.50E-07 -2.50E-07 -2.50E-07 -2.50E-07 -2.50E-07 -2.50E-07 -2.50E-07
Status PASS PASS PASS PASS PASS PASS PASS PASS
Specification MAX 2.50E-07 2.50E-07 2.50E-07 2.50E-07 2.50E-07 2.50E-07 2.50E-07 2.50E-07
Status PASS PASS PASS PASS PASS PASS PASS PASS
Total Dose (krad(Si))
TID Report
11-350 111103 R1.3
An ISO 9001:2008 and DSCC Certified Company
22
Radiation Assured Devices 5017 N. 30th Street Colorado Springs, CO 80919 (719) 531-0800
-3.00E-07
-2.00E-07
-1.00E-07
0.00E+00
1.00E-07
2.00E-07
3.00E-07
0 20 40 60 80 100
Total Dose (krad(Si))
Ne
ga
tiv
e In
pu
t B
ias
Cu
rre
nt
@ +
/-2
0V
VC
M=
0V
Average Biased Average Un-Biased
Ps90%/90% (-KTL) Biased Ps90%/90% (-KTL) Un-Biased
Ps90%/90% (+KTL) Biased Ps90%/90% (+KTL) Un-Biased
Specif ication MIN Specif ication MAX
24-hr 168-hr
Anneal Anneal
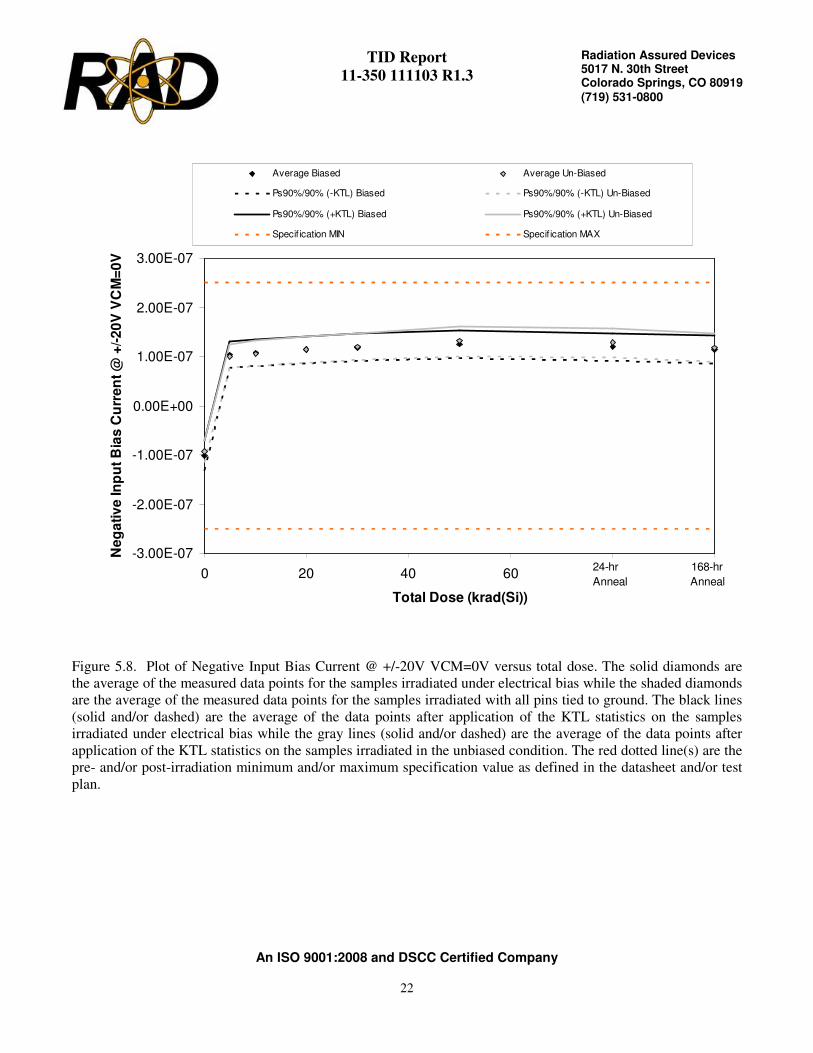
Figure 5.8. Plot of Negative Input Bias Current @ +/-20V VCM=0V versus total dose. The solid diamonds are
the average of the measured data points for the samples irradiated under electrical bias while the shaded diamonds
are the average of the measured data points for the samples irradiated with all pins tied to ground. The black lines
(solid and/or dashed) are the average of the data points after application of the KTL statistics on the samples
irradiated under electrical bias while the gray lines (solid and/or dashed) are the average of the data points after
application of the KTL statistics on the samples irradiated in the unbiased condition. The red dotted line(s) are the
pre- and/or post-irradiation minimum and/or maximum specification value as defined in the datasheet and/or test
plan.

TID Report
11-350 111103 R1.3
An ISO 9001:2008 and DSCC Certified Company
23
Radiation Assured Devices 5017 N. 30th Street Colorado Springs, CO 80919 (719) 531-0800
Table 5.8. Raw data for Negative Input Bias Current @ +/-20V VCM=0V versus total dose, including the
statistical analysis, specification and the status of the testing (pass/fail).
Negative Input Bias Current @ +/-20V VCM=0V
24-hr
Anneal
168-hr
Anneal
Device 0 5 10 20 30 50 80 100
347 -1.21E-07 1.20E-07 1.24E-07 1.31E-07 1.35E-07 1.43E-07 1.38E-07 1.32E-07
352 -9.95E-08 1.02E-07 1.06E-07 1.12E-07 1.16E-07 1.23E-07 1.18E-07 1.13E-07
353 -9.50E-08 9.78E-08 1.01E-07 1.07E-07 1.12E-07 1.19E-07 1.14E-07 1.07E-07
355 -9.60E-08 9.92E-08 1.03E-07 1.09E-07 1.13E-07 1.20E-07 1.15E-07 1.10E-07
357 -9.59E-08 9.85E-08 1.02E-07 1.08E-07 1.12E-07 1.19E-07 1.14E-07 1.08E-07
359 -9.80E-08 1.05E-07 1.11E-07 1.19E-07 1.25E-07 1.37E-07 1.33E-07 1.23E-07
361 -7.94E-08 8.60E-08 9.03E-08 9.74E-08 1.04E-07 1.12E-07 1.09E-07 1.01E-07
368 -9.75E-08 1.07E-07 1.12E-07 1.20E-07 1.27E-07 1.38E-07 1.34E-07 1.24E-07
372 -9.17E-08 9.90E-08 1.04E-07 1.12E-07 1.18E-07 1.29E-07 1.25E-07 1.15E-07
378 -9.97E-08 1.07E-07 1.12E-07 1.21E-07 1.28E-07 1.40E-07 1.36E-07 1.25E-07
410 -9.38E-08 9.42E-08 9.42E-08 9.44E-08 9.42E-08 9.43E-08 9.46E-08 9.44E-08
413 -1.00E-07 1.01E-07 1.01E-07 1.01E-07 1.01E-07 1.01E-07 1.01E-07 1.01E-07
Biased Statistics
Average Biased -1.01E-07 1.04E-07 1.07E-07 1.14E-07 1.18E-07 1.25E-07 1.20E-07 1.14E-07
Std Dev Biased 1.10E-08 9.52E-09 9.68E-09 1.00E-08 1.00E-08 1.05E-08 1.04E-08 1.01E-08
Ps90%/90% (+KTL) Biased -7.13E-08 1.30E-07 1.34E-07 1.41E-07 1.45E-07 1.54E-07 1.49E-07 1.42E-07
Ps90%/90% (-KTL) Biased -1.32E-07 7.75E-08 8.09E-08 8.61E-08 9.04E-08 9.61E-08 9.15E-08 8.65E-08
Un-Biased Statistics
Average Un-Biased -9.32E-08 1.01E-07 1.06E-07 1.14E-07 1.20E-07 1.31E-07 1.28E-07 1.18E-07
Std Dev Un-Biased 8.28E-09 8.90E-09 9.32E-09 9.84E-09 9.98E-09 1.12E-08 1.09E-08 1.04E-08
Ps90%/90% (+KTL) Un-Biased -7.05E-08 1.25E-07 1.31E-07 1.41E-07 1.48E-07 1.62E-07 1.57E-07 1.46E-07
Ps90%/90% (-KTL) Un-Biased -1.16E-07 7.65E-08 8.03E-08 8.68E-08 9.28E-08 1.00E-07 9.76E-08 8.92E-08
Specification MIN -2.50E-07 -2.50E-07 -2.50E-07 -2.50E-07 -2.50E-07 -2.50E-07 -2.50E-07 -2.50E-07
Status PASS PASS PASS PASS PASS PASS PASS PASS
Specification MAX 2.50E-07 2.50E-07 2.50E-07 2.50E-07 2.50E-07 2.50E-07 2.50E-07 2.50E-07
Status PASS PASS PASS PASS PASS PASS PASS PASS
Total Dose (krad(Si))

TID Report
11-350 111103 R1.3
An ISO 9001:2008 and DSCC Certified Company
24
Radiation Assured Devices 5017 N. 30th Street Colorado Springs, CO 80919 (719) 531-0800
-5.00E-03
-4.00E-03
-3.00E-03
-2.00E-03
-1.00E-03
0.00E+00
1.00E-03
2.00E-03
3.00E-03
4.00E-03
5.00E-03
0 20 40 60 80 100
Total Dose (krad(Si))
Inp
ut
Off
se
t V
olt
ag
e @
+/-
15
V V
CM
=0
V
Average Biased Average Un-Biased Ps90%/90% (-KTL) Biased
Ps90%/90% (-KTL) Un-Biased Ps90%/90% (+KTL) Biased Ps90%/90% (+KTL) Un-Biased
Specif ication MIN Specif ication MAX
24-hr 168-hr
Anneal Anneal
Figure 5.9. Plot of Input Offset Voltage @ +/-15V VCM=0V versus total dose. The solid diamonds are the
average of the measured data points for the samples irradiated under electrical bias while the shaded diamonds are
the average of the measured data points for the samples irradiated with all pins tied to ground. The black lines
(solid and/or dashed) are the average of the data points after application of the KTL statistics on the samples
irradiated under electrical bias while the gray lines (solid and/or dashed) are the average of the data points after
application of the KTL statistics on the samples irradiated in the unbiased condition. The red dotted line(s) are the
pre- and/or post-irradiation minimum and/or maximum specification value as defined in the datasheet and/or test
plan.

TID Report
11-350 111103 R1.3
An ISO 9001:2008 and DSCC Certified Company
25
Radiation Assured Devices 5017 N. 30th Street Colorado Springs, CO 80919 (719) 531-0800
Table 5.9. Raw data for Input Offset Voltage @ +/-15V VCM=0V versus total dose, including the statistical
analysis, specification and the status of the testing (pass/fail).
Input Offset Voltage @ +/-15V VCM=0V
24-hr
Anneal
168-hr
Anneal
Device 0 5 10 20 30 50 80 100
347 6.40E-04 -2.51E-04 -1.55E-04 -2.00E-06 1.14E-04 2.36E-04 2.36E-04 -2.30E-05
352 2.89E-04 -5.70E-05 5.50E-05 1.81E-04 2.43E-04 1.81E-04 2.64E-04 1.17E-04
353 7.42E-04 -4.80E-04 -3.55E-04 -2.02E-04 -1.09E-04 -5.41E-04 8.00E-06 -8.70E-05
355 -1.51E-04 4.04E-04 5.20E-04 6.73E-04 7.49E-04 7.40E-04 8.39E-04 5.29E-04
357 -7.38E-04 9.91E-04 1.11E-03 1.26E-03 1.36E-03 1.28E-03 1.47E-03 1.30E-03
359 -1.87E-03 1.99E-03 2.11E-03 2.25E-03 2.36E-03 2.50E-03 2.50E-03 2.31E-03
361 -9.59E-04 1.11E-03 1.22E-03 1.38E-03 1.47E-03 1.59E-03 1.60E-03 1.45E-03
368 2.31E-04 -1.32E-04 -2.20E-05 1.09E-04 1.99E-04 3.33E-04 3.35E-04 1.40E-04
372 1.40E-04 -1.20E-05 1.09E-04 2.59E-04 3.81E-04 5.24E-04 5.32E-04 3.48E-04
378 -3.50E-04 4.70E-04 5.88E-04 7.29E-04 8.35E-04 9.47E-04 9.42E-04 7.96E-04
410 -3.12E-04 3.49E-04 3.53E-04 3.46E-04 3.42E-04 3.46E-04 3.70E-04 3.53E-04
413 -1.46E-03 1.42E-03 1.43E-03 1.43E-03 1.42E-03 1.42E-03 1.41E-03 1.42E-03
Biased Statistics
Average Biased 1.56E-04 1.21E-04 2.35E-04 3.81E-04 4.71E-04 3.80E-04 5.63E-04 3.68E-04
Std Dev Biased 6.10E-04 5.85E-04 5.87E-04 5.87E-04 5.88E-04 6.80E-04 5.92E-04 5.75E-04
Ps90%/90% (+KTL) Biased 1.83E-03 1.73E-03 1.85E-03 1.99E-03 2.08E-03 2.25E-03 2.18E-03 1.94E-03
Ps90%/90% (-KTL) Biased -1.52E-03 -1.48E-03 -1.38E-03 -1.23E-03 -1.14E-03 -1.49E-03 -1.06E-03 -1.21E-03
Un-Biased Statistics
Average Un-Biased -5.62E-04 6.85E-04 8.01E-04 9.46E-04 1.05E-03 1.18E-03 1.18E-03 1.01E-03
Std Dev Un-Biased 8.71E-04 8.77E-04 8.79E-04 8.82E-04 8.81E-04 8.82E-04 8.81E-04 8.85E-04
Ps90%/90% (+KTL) Un-Biased 1.83E-03 3.09E-03 3.21E-03 3.36E-03 3.47E-03 3.60E-03 3.60E-03 3.43E-03
Ps90%/90% (-KTL) Un-Biased -2.95E-03 -1.72E-03 -1.61E-03 -1.47E-03 -1.37E-03 -1.24E-03 -1.23E-03 -1.42E-03
Specification MIN -4.00E-03 -4.00E-03 -4.00E-03 -4.00E-03 -4.00E-03 -4.00E-03 -4.00E-03 -4.00E-03
Status PASS PASS PASS PASS PASS PASS PASS PASS
Specification MAX 4.00E-03 4.00E-03 4.00E-03 4.00E-03 4.00E-03 4.00E-03 4.00E-03 4.00E-03
Status PASS PASS PASS PASS PASS PASS PASS PASS
Total Dose (krad(Si))

TID Report
11-350 111103 R1.3
An ISO 9001:2008 and DSCC Certified Company
26
Radiation Assured Devices 5017 N. 30th Street Colorado Springs, CO 80919 (719) 531-0800
-6.00E-08
-4.00E-08
-2.00E-08
0.00E+00
2.00E-08
4.00E-08
6.00E-08
0 20 40 60 80 100
Total Dose (krad(Si))
Inp
ut
Off
se
t C
urr
en
t @
+/-
15
V V
CM
=0
V
Average Biased Average Un-Biased Ps90%/90% (-KTL) Biased
Ps90%/90% (-KTL) Un-Biased Ps90%/90% (+KTL) Biased Ps90%/90% (+KTL) Un-Biased
Specif ication MIN Specif ication MAX
24-hr 168-hr
Anneal Anneal
Figure 5.10. Plot of Input Offset Current @ +/-15V VCM=0V versus total dose. The solid diamonds are the
average of the measured data points for the samples irradiated under electrical bias while the shaded diamonds are
the average of the measured data points for the samples irradiated with all pins tied to ground. The black lines
(solid and/or dashed) are the average of the data points after application of the KTL statistics on the samples
irradiated under electrical bias while the gray lines (solid and/or dashed) are the average of the data points after
application of the KTL statistics on the samples irradiated in the unbiased condition. The red dotted line(s) are the
pre- and/or post-irradiation minimum and/or maximum specification value as defined in the datasheet and/or test
plan.

TID Report
11-350 111103 R1.3
An ISO 9001:2008 and DSCC Certified Company
27
Radiation Assured Devices 5017 N. 30th Street Colorado Springs, CO 80919 (719) 531-0800
Table 5.10. Raw data for Input Offset Current @ +/-15V VCM=0V versus total dose, including the statistical
analysis, specification and the status of the testing (pass/fail).
Input Offset Current @ +/-15V VCM=0V
24-hr
Anneal
168-hr
Anneal
Device 0 5 10 20 30 50 80 100
347 3.79E-09 -2.87E-09 -2.64E-09 -2.49E-09 -1.81E-09 -1.63E-09 -2.21E-09 -2.54E-09
352 -3.30E-10 -8.70E-10 -7.70E-10 -2.90E-10 -1.20E-10 -3.10E-10 -4.20E-10 -1.49E-09
353 -2.22E-09 2.24E-09 2.45E-09 2.99E-09 3.28E-09 4.01E-09 3.56E-09 2.17E-09
355 -1.24E-09 1.50E-10 2.30E-10 2.60E-10 5.50E-10 6.70E-10 6.50E-10 6.20E-10
357 -1.00E-09 9.80E-10 1.44E-09 1.60E-09 2.10E-09 1.94E-09 1.37E-09 4.50E-10
359 -5.70E-10 -6.40E-10 -4.40E-10 -9.00E-11 3.80E-10 8.20E-10 6.50E-10 -5.10E-10
361 1.05E-09 -1.13E-09 -1.23E-09 -8.30E-10 -8.20E-10 -1.70E-10 -4.00E-10 -1.16E-09
368 -1.27E-09 -1.34E-09 -1.09E-09 -9.80E-10 -5.90E-10 2.00E-11 1.30E-10 -9.80E-10
372 -1.00E-11 -7.50E-10 -6.90E-10 -3.00E-11 -2.10E-10 1.80E-10 4.90E-10 1.10E-10
378 -7.00E-11 -5.40E-10 -3.30E-10 -2.60E-10 2.40E-10 -2.00E-10 -1.50E-10 -4.20E-10
410 -1.34E-09 1.21E-09 1.19E-09 1.26E-09 1.31E-09 1.33E-09 1.24E-09 1.35E-09
413 -1.20E-09 1.07E-09 9.90E-10 1.14E-09 1.20E-09 1.13E-09 1.04E-09 1.01E-09
Biased Statistics
Average Biased -2.00E-10 -7.40E-11 1.42E-10 4.14E-10 8.00E-10 9.36E-10 5.90E-10 -1.58E-10
Std Dev Biased 2.33E-09 1.93E-09 1.97E-09 2.06E-09 1.97E-09 2.16E-09 2.14E-09 1.86E-09
Ps90%/90% (+KTL) Biased 6.19E-09 5.23E-09 5.56E-09 6.07E-09 6.21E-09 6.86E-09 6.45E-09 4.94E-09
Ps90%/90% (-KTL) Biased -6.59E-09 -5.38E-09 -5.27E-09 -5.24E-09 -4.61E-09 -4.99E-09 -5.27E-09 -5.26E-09
Un-Biased Statistics
Average Un-Biased -1.74E-10 -8.80E-10 -7.56E-10 -4.38E-10 -2.00E-10 1.30E-10 1.44E-10 -5.92E-10
Std Dev Un-Biased 8.51E-10 3.41E-10 3.94E-10 4.38E-10 5.16E-10 4.15E-10 4.35E-10 5.01E-10
Ps90%/90% (+KTL) Un-Biased 2.16E-09 5.41E-11 3.25E-10 7.62E-10 1.22E-09 1.27E-09 1.34E-09 7.81E-10
Ps90%/90% (-KTL) Un-Biased -2.51E-09 -1.81E-09 -1.84E-09 -1.64E-09 -1.62E-09 -1.01E-09 -1.05E-09 -1.96E-09
Specification MIN -5.00E-08 -5.00E-08 -5.00E-08 -5.00E-08 -5.00E-08 -5.00E-08 -5.00E-08 -5.00E-08
Status PASS PASS PASS PASS PASS PASS PASS PASS
Specification MAX 5.00E-08 5.00E-08 5.00E-08 5.00E-08 5.00E-08 5.00E-08 5.00E-08 5.00E-08
Status PASS PASS PASS PASS PASS PASS PASS PASS
Total Dose (krad(Si))

TID Report
11-350 111103 R1.3
An ISO 9001:2008 and DSCC Certified Company
28
Radiation Assured Devices 5017 N. 30th Street Colorado Springs, CO 80919 (719) 531-0800
-3.00E-07
-2.00E-07
-1.00E-07
0.00E+00
1.00E-07
2.00E-07
3.00E-07
0 20 40 60 80 100
Total Dose (krad(Si))
Po
sit
ive
In
pu
t B
ias
Cu
rre
nt
@ +
/-1
5V
VC
M=
0V
Average Biased Average Un-Biased
Ps90%/90% (-KTL) Biased Ps90%/90% (-KTL) Un-Biased
Ps90%/90% (+KTL) Biased Ps90%/90% (+KTL) Un-Biased
Specif ication MIN Specif ication MAX
24-hr 168-hr
Anneal Anneal
Figure 5.11. Plot of Positive Input Bias Current @ +/-15V VCM=0V versus total dose. The solid diamonds are
the average of the measured data points for the samples irradiated under electrical bias while the shaded diamonds
are the average of the measured data points for the samples irradiated with all pins tied to ground. The black lines
(solid and/or dashed) are the average of the data points after application of the KTL statistics on the samples
irradiated under electrical bias while the gray lines (solid and/or dashed) are the average of the data points after
application of the KTL statistics on the samples irradiated in the unbiased condition. The red dotted line(s) are the
pre- and/or post-irradiation minimum and/or maximum specification value as defined in the datasheet and/or test
plan.
TID Report
11-350 111103 R1.3
An ISO 9001:2008 and DSCC Certified Company
29
Radiation Assured Devices 5017 N. 30th Street Colorado Springs, CO 80919 (719) 531-0800
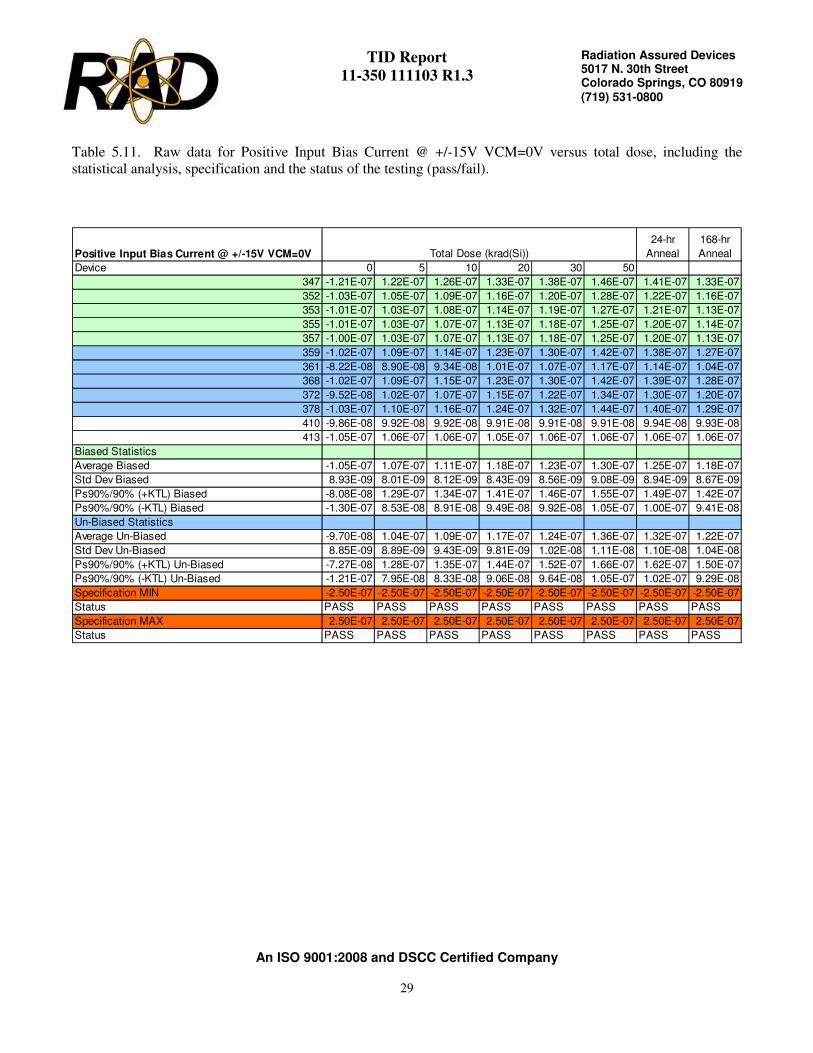
Table 5.11. Raw data for Positive Input Bias Current @ +/-15V VCM=0V versus total dose, including the
statistical analysis, specification and the status of the testing (pass/fail).
Positive Input Bias Current @ +/-15V VCM=0V
24-hr
Anneal
168-hr
Anneal
Device 0 5 10 20 30 50 80 100
347 -1.21E-07 1.22E-07 1.26E-07 1.33E-07 1.38E-07 1.46E-07 1.41E-07 1.33E-07
352 -1.03E-07 1.05E-07 1.09E-07 1.16E-07 1.20E-07 1.28E-07 1.22E-07 1.16E-07
353 -1.01E-07 1.03E-07 1.08E-07 1.14E-07 1.19E-07 1.27E-07 1.21E-07 1.13E-07
355 -1.01E-07 1.03E-07 1.07E-07 1.13E-07 1.18E-07 1.25E-07 1.20E-07 1.14E-07
357 -1.00E-07 1.03E-07 1.07E-07 1.13E-07 1.18E-07 1.25E-07 1.20E-07 1.13E-07
359 -1.02E-07 1.09E-07 1.14E-07 1.23E-07 1.30E-07 1.42E-07 1.38E-07 1.27E-07
361 -8.22E-08 8.90E-08 9.34E-08 1.01E-07 1.07E-07 1.17E-07 1.14E-07 1.04E-07
368 -1.02E-07 1.09E-07 1.15E-07 1.23E-07 1.30E-07 1.42E-07 1.39E-07 1.28E-07
372 -9.52E-08 1.02E-07 1.07E-07 1.15E-07 1.22E-07 1.34E-07 1.30E-07 1.20E-07
378 -1.03E-07 1.10E-07 1.16E-07 1.24E-07 1.32E-07 1.44E-07 1.40E-07 1.29E-07
410 -9.86E-08 9.92E-08 9.92E-08 9.91E-08 9.91E-08 9.91E-08 9.94E-08 9.93E-08
413 -1.05E-07 1.06E-07 1.06E-07 1.05E-07 1.06E-07 1.06E-07 1.06E-07 1.06E-07
Biased Statistics
Average Biased -1.05E-07 1.07E-07 1.11E-07 1.18E-07 1.23E-07 1.30E-07 1.25E-07 1.18E-07
Std Dev Biased 8.93E-09 8.01E-09 8.12E-09 8.43E-09 8.56E-09 9.08E-09 8.94E-09 8.67E-09
Ps90%/90% (+KTL) Biased -8.08E-08 1.29E-07 1.34E-07 1.41E-07 1.46E-07 1.55E-07 1.49E-07 1.42E-07
Ps90%/90% (-KTL) Biased -1.30E-07 8.53E-08 8.91E-08 9.49E-08 9.92E-08 1.05E-07 1.00E-07 9.41E-08
Un-Biased Statistics
Average Un-Biased -9.70E-08 1.04E-07 1.09E-07 1.17E-07 1.24E-07 1.36E-07 1.32E-07 1.22E-07
Std Dev Un-Biased 8.85E-09 8.89E-09 9.43E-09 9.81E-09 1.02E-08 1.11E-08 1.10E-08 1.04E-08
Ps90%/90% (+KTL) Un-Biased -7.27E-08 1.28E-07 1.35E-07 1.44E-07 1.52E-07 1.66E-07 1.62E-07 1.50E-07
Ps90%/90% (-KTL) Un-Biased -1.21E-07 7.95E-08 8.33E-08 9.06E-08 9.64E-08 1.05E-07 1.02E-07 9.29E-08
Specification MIN -2.50E-07 -2.50E-07 -2.50E-07 -2.50E-07 -2.50E-07 -2.50E-07 -2.50E-07 -2.50E-07
Status PASS PASS PASS PASS PASS PASS PASS PASS
Specification MAX 2.50E-07 2.50E-07 2.50E-07 2.50E-07 2.50E-07 2.50E-07 2.50E-07 2.50E-07
Status PASS PASS PASS PASS PASS PASS PASS PASS
Total Dose (krad(Si))

TID Report
11-350 111103 R1.3
An ISO 9001:2008 and DSCC Certified Company
30
Radiation Assured Devices 5017 N. 30th Street Colorado Springs, CO 80919 (719) 531-0800
-3.00E-07
-2.00E-07
-1.00E-07
0.00E+00
1.00E-07
2.00E-07
3.00E-07
0 20 40 60 80 100
Total Dose (krad(Si))
Ne
ga
tiv
e In
pu
t B
ias
Cu
rre
nt
@ +
/-1
5V
VC
M=
0V
Average Biased Average Un-Biased
Ps90%/90% (-KTL) Biased Ps90%/90% (-KTL) Un-Biased
Ps90%/90% (+KTL) Biased Ps90%/90% (+KTL) Un-Biased
Specif ication MIN Specif ication MAX
24-hr 168-hr
Anneal Anneal
Figure 5.12. Plot of Negative Input Bias Current @ +/-15V VCM=0V versus total dose. The solid diamonds are
the average of the measured data points for the samples irradiated under electrical bias while the shaded diamonds
are the average of the measured data points for the samples irradiated with all pins tied to ground. The black lines
(solid and/or dashed) are the average of the data points after application of the KTL statistics on the samples
irradiated under electrical bias while the gray lines (solid and/or dashed) are the average of the data points after
application of the KTL statistics on the samples irradiated in the unbiased condition. The red dotted line(s) are the
pre- and/or post-irradiation minimum and/or maximum specification value as defined in the datasheet and/or test
plan.

TID Report
11-350 111103 R1.3
An ISO 9001:2008 and DSCC Certified Company
31
Radiation Assured Devices 5017 N. 30th Street Colorado Springs, CO 80919 (719) 531-0800
Table 5.12. Raw data for Negative Input Bias Current @ +/-15V VCM=0V versus total dose, including the
statistical analysis, specification and the status of the testing (pass/fail).
Negative Input Bias Current @ +/-15V VCM=0V
24-hr
Anneal
168-hr
Anneal
Device 0 5 10 20 30 50 80 100
347 -1.24E-07 1.24E-07 1.28E-07 1.35E-07 1.39E-07 1.48E-07 1.43E-07 1.36E-07
352 -1.03E-07 1.06E-07 1.10E-07 1.16E-07 1.20E-07 1.27E-07 1.22E-07 1.17E-07
353 -9.82E-08 1.01E-07 1.05E-07 1.11E-07 1.16E-07 1.22E-07 1.17E-07 1.11E-07
355 -9.92E-08 1.03E-07 1.07E-07 1.13E-07 1.17E-07 1.24E-07 1.19E-07 1.13E-07
357 -9.92E-08 1.02E-07 1.06E-07 1.11E-07 1.16E-07 1.23E-07 1.18E-07 1.12E-07
359 -1.01E-07 1.09E-07 1.14E-07 1.23E-07 1.29E-07 1.40E-07 1.37E-07 1.27E-07
361 -8.32E-08 9.00E-08 9.44E-08 1.02E-07 1.08E-07 1.17E-07 1.14E-07 1.05E-07
368 -1.01E-07 1.10E-07 1.16E-07 1.24E-07 1.31E-07 1.42E-07 1.38E-07 1.29E-07
372 -9.48E-08 1.02E-07 1.07E-07 1.15E-07 1.22E-07 1.33E-07 1.29E-07 1.19E-07
378 -1.03E-07 1.10E-07 1.16E-07 1.24E-07 1.32E-07 1.44E-07 1.40E-07 1.29E-07
410 -9.70E-08 9.75E-08 9.76E-08 9.76E-08 9.74E-08 9.74E-08 9.77E-08 9.76E-08
413 -1.04E-07 1.04E-07 1.04E-07 1.04E-07 1.04E-07 1.04E-07 1.05E-07 1.05E-07
Biased Statistics
Average Biased -1.05E-07 1.07E-07 1.11E-07 1.17E-07 1.22E-07 1.29E-07 1.24E-07 1.18E-07
Std Dev Biased 1.11E-08 9.67E-09 9.81E-09 1.02E-08 1.02E-08 1.06E-08 1.06E-08 1.02E-08
Ps90%/90% (+KTL) Biased -7.43E-08 1.34E-07 1.38E-07 1.45E-07 1.49E-07 1.58E-07 1.53E-07 1.46E-07
Ps90%/90% (-KTL) Biased -1.35E-07 8.05E-08 8.40E-08 8.93E-08 9.37E-08 9.97E-08 9.48E-08 9.00E-08
Un-Biased Statistics
Average Un-Biased -9.66E-08 1.04E-07 1.10E-07 1.18E-07 1.24E-07 1.35E-07 1.32E-07 1.22E-07
Std Dev Un-Biased 8.07E-09 8.73E-09 9.13E-09 9.58E-09 9.80E-09 1.09E-08 1.08E-08 1.02E-08
Ps90%/90% (+KTL) Un-Biased -7.45E-08 1.28E-07 1.35E-07 1.44E-07 1.51E-07 1.65E-07 1.61E-07 1.50E-07
Ps90%/90% (-KTL) Un-Biased -1.19E-07 8.05E-08 8.45E-08 9.13E-08 9.74E-08 1.05E-07 1.02E-07 9.38E-08
Specification MIN -2.50E-07 -2.50E-07 -2.50E-07 -2.50E-07 -2.50E-07 -2.50E-07 -2.50E-07 -2.50E-07
Status PASS PASS PASS PASS PASS PASS PASS PASS
Specification MAX 2.50E-07 2.50E-07 2.50E-07 2.50E-07 2.50E-07 2.50E-07 2.50E-07 2.50E-07
Status PASS PASS PASS PASS PASS PASS PASS PASS
Total Dose (krad(Si))

TID Report
11-350 111103 R1.3
An ISO 9001:2008 and DSCC Certified Company
32
Radiation Assured Devices 5017 N. 30th Street Colorado Springs, CO 80919 (719) 531-0800
-5.00E-03
-4.00E-03
-3.00E-03
-2.00E-03
-1.00E-03
0.00E+00
1.00E-03
2.00E-03
3.00E-03
4.00E-03
5.00E-03
0 20 40 60 80 100
Total Dose (krad(Si))
Inp
ut
Off
se
t V
olt
ag
e @
+/-
20
V V
CM
=1
6.5
V
Average Biased Average Un-Biased
Ps90%/90% (-KTL) Biased Ps90%/90% (-KTL) Un-Biased
Ps90%/90% (+KTL) Biased Ps90%/90% (+KTL) Un-Biased
Specif ication MIN Specif ication MAX
24-hr 168-hr
Anneal Anneal
Figure 5.13. Plot of Input Offset Voltage @ +/-20V VCM=16.5V versus total dose. The solid diamonds are the
average of the measured data points for the samples irradiated under electrical bias while the shaded diamonds are
the average of the measured data points for the samples irradiated with all pins tied to ground. The black lines
(solid and/or dashed) are the average of the data points after application of the KTL statistics on the samples
irradiated under electrical bias while the gray lines (solid and/or dashed) are the average of the data points after
application of the KTL statistics on the samples irradiated in the unbiased condition. The red dotted line(s) are the
pre- and/or post-irradiation minimum and/or maximum specification value as defined in the datasheet and/or test
plan.
TID Report
11-350 111103 R1.3
An ISO 9001:2008 and DSCC Certified Company
33
Radiation Assured Devices 5017 N. 30th Street Colorado Springs, CO 80919 (719) 531-0800
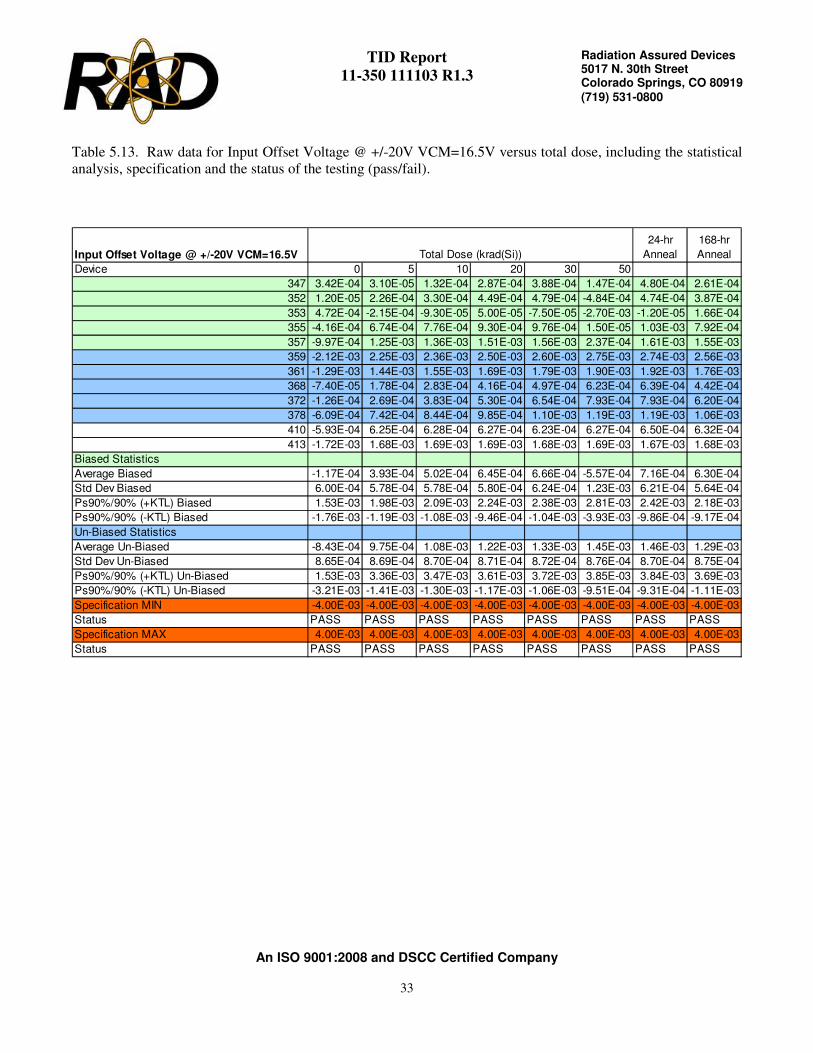
Table 5.13. Raw data for Input Offset Voltage @ +/-20V VCM=16.5V versus total dose, including the statistical
analysis, specification and the status of the testing (pass/fail).
Input Offset Voltage @ +/-20V VCM=16.5V
24-hr
Anneal
168-hr
Anneal
Device 0 5 10 20 30 50 80 100
347 3.42E-04 3.10E-05 1.32E-04 2.87E-04 3.88E-04 1.47E-04 4.80E-04 2.61E-04
352 1.20E-05 2.26E-04 3.30E-04 4.49E-04 4.79E-04 -4.84E-04 4.74E-04 3.87E-04
353 4.72E-04 -2.15E-04 -9.30E-05 5.00E-05 -7.50E-05 -2.70E-03 -1.20E-05 1.66E-04
355 -4.16E-04 6.74E-04 7.76E-04 9.30E-04 9.76E-04 1.50E-05 1.03E-03 7.92E-04
357 -9.97E-04 1.25E-03 1.36E-03 1.51E-03 1.56E-03 2.37E-04 1.61E-03 1.55E-03
359 -2.12E-03 2.25E-03 2.36E-03 2.50E-03 2.60E-03 2.75E-03 2.74E-03 2.56E-03
361 -1.29E-03 1.44E-03 1.55E-03 1.69E-03 1.79E-03 1.90E-03 1.92E-03 1.76E-03
368 -7.40E-05 1.78E-04 2.83E-04 4.16E-04 4.97E-04 6.23E-04 6.39E-04 4.42E-04
372 -1.26E-04 2.69E-04 3.83E-04 5.30E-04 6.54E-04 7.93E-04 7.93E-04 6.20E-04
378 -6.09E-04 7.42E-04 8.44E-04 9.85E-04 1.10E-03 1.19E-03 1.19E-03 1.06E-03
410 -5.93E-04 6.25E-04 6.28E-04 6.27E-04 6.23E-04 6.27E-04 6.50E-04 6.32E-04
413 -1.72E-03 1.68E-03 1.69E-03 1.69E-03 1.68E-03 1.69E-03 1.67E-03 1.68E-03
Biased Statistics
Average Biased -1.17E-04 3.93E-04 5.02E-04 6.45E-04 6.66E-04 -5.57E-04 7.16E-04 6.30E-04
Std Dev Biased 6.00E-04 5.78E-04 5.78E-04 5.80E-04 6.24E-04 1.23E-03 6.21E-04 5.64E-04
Ps90%/90% (+KTL) Biased 1.53E-03 1.98E-03 2.09E-03 2.24E-03 2.38E-03 2.81E-03 2.42E-03 2.18E-03
Ps90%/90% (-KTL) Biased -1.76E-03 -1.19E-03 -1.08E-03 -9.46E-04 -1.04E-03 -3.93E-03 -9.86E-04 -9.17E-04
Un-Biased Statistics
Average Un-Biased -8.43E-04 9.75E-04 1.08E-03 1.22E-03 1.33E-03 1.45E-03 1.46E-03 1.29E-03
Std Dev Un-Biased 8.65E-04 8.69E-04 8.70E-04 8.71E-04 8.72E-04 8.76E-04 8.70E-04 8.75E-04
Ps90%/90% (+KTL) Un-Biased 1.53E-03 3.36E-03 3.47E-03 3.61E-03 3.72E-03 3.85E-03 3.84E-03 3.69E-03
Ps90%/90% (-KTL) Un-Biased -3.21E-03 -1.41E-03 -1.30E-03 -1.17E-03 -1.06E-03 -9.51E-04 -9.31E-04 -1.11E-03
Specification MIN -4.00E-03 -4.00E-03 -4.00E-03 -4.00E-03 -4.00E-03 -4.00E-03 -4.00E-03 -4.00E-03
Status PASS PASS PASS PASS PASS PASS PASS PASS
Specification MAX 4.00E-03 4.00E-03 4.00E-03 4.00E-03 4.00E-03 4.00E-03 4.00E-03 4.00E-03
Status PASS PASS PASS PASS PASS PASS PASS PASS
Total Dose (krad(Si))

TID Report
11-350 111103 R1.3
An ISO 9001:2008 and DSCC Certified Company
34
Radiation Assured Devices 5017 N. 30th Street Colorado Springs, CO 80919 (719) 531-0800
-6.00E-08
-4.00E-08
-2.00E-08
0.00E+00
2.00E-08
4.00E-08
6.00E-08
0 20 40 60 80 100
Total Dose (krad(Si))
Inp
ut
Off
se
t C
urr
en
t @
+/-
20
V V
CM
=1
6.5
V
Average Biased Average Un-Biased
Ps90%/90% (-KTL) Biased Ps90%/90% (-KTL) Un-Biased
Ps90%/90% (+KTL) Biased Ps90%/90% (+KTL) Un-Biased
Specif ication MIN Specif ication MAX
24-hr 168-hr
Anneal Anneal
Figure 5.14. Plot of Input Offset Current @ +/-20V VCM=16.5V versus total dose. The solid diamonds are the
average of the measured data points for the samples irradiated under electrical bias while the shaded diamonds are
the average of the measured data points for the samples irradiated with all pins tied to ground. The black lines
(solid and/or dashed) are the average of the data points after application of the KTL statistics on the samples
irradiated under electrical bias while the gray lines (solid and/or dashed) are the average of the data points after
application of the KTL statistics on the samples irradiated in the unbiased condition. The red dotted line(s) are the
pre- and/or post-irradiation minimum and/or maximum specification value as defined in the datasheet and/or test
plan.

TID Report
11-350 111103 R1.3
An ISO 9001:2008 and DSCC Certified Company
35
Radiation Assured Devices 5017 N. 30th Street Colorado Springs, CO 80919 (719) 531-0800
Table 5.14. Raw data for Input Offset Current @ +/-20V VCM=16.5V versus total dose, including the statistical
analysis, specification and the status of the testing (pass/fail).
Input Offset Current @ +/-20V VCM=16.5V
24-hr
Anneal
168-hr
Anneal
Device 0 5 10 20 30 50 80 100
347 3.58E-09 -2.75E-09 -2.42E-09 -2.16E-09 -1.65E-09 -1.28E-09 -1.89E-09 -2.38E-09
352 -5.80E-10 -7.00E-10 -6.70E-10 -9.00E-11 1.10E-10 -1.90E-10 -2.40E-10 -1.32E-09
353 -2.31E-09 2.42E-09 2.67E-09 3.21E-09 3.65E-09 4.00E-09 3.79E-09 2.33E-09
355 -1.42E-09 2.70E-10 5.20E-10 4.70E-10 7.60E-10 8.80E-10 8.50E-10 7.90E-10
357 -1.10E-09 1.12E-09 1.51E-09 1.85E-09 2.28E-09 1.95E-09 1.66E-09 6.50E-10
359 -7.60E-10 -3.20E-10 -2.60E-10 2.20E-10 5.60E-10 1.08E-09 8.50E-10 -2.40E-10
361 9.60E-10 -1.09E-09 -1.11E-09 -8.30E-10 -6.50E-10 1.60E-10 -2.10E-10 -1.08E-09
368 -1.51E-09 -1.26E-09 -8.80E-10 -7.00E-10 -4.80E-10 3.00E-10 2.80E-10 -9.30E-10
372 -1.60E-10 -6.50E-10 -4.40E-10 3.00E-11 -6.00E-11 2.80E-10 5.50E-10 2.90E-10
378 -2.70E-10 -2.60E-10 -9.00E-11 -8.00E-11 3.70E-10 2.10E-10 2.90E-10 -2.40E-10
410 -1.52E-09 1.50E-09 1.48E-09 1.55E-09 1.49E-09 1.53E-09 1.51E-09 1.55E-09
413 -1.38E-09 1.33E-09 1.30E-09 1.32E-09 1.25E-09 1.25E-09 1.29E-09 1.28E-09
Biased Statistics
Average Biased -3.66E-10 7.20E-11 3.22E-10 6.56E-10 1.03E-09 1.07E-09 8.34E-10 1.40E-11
Std Dev Biased 2.29E-09 1.95E-09 1.97E-09 2.03E-09 2.03E-09 2.03E-09 2.12E-09 1.86E-09
Ps90%/90% (+KTL) Biased 5.92E-09 5.42E-09 5.71E-09 6.22E-09 6.60E-09 6.64E-09 6.65E-09 5.12E-09
Ps90%/90% (-KTL) Biased -6.66E-09 -5.27E-09 -5.07E-09 -4.91E-09 -4.54E-09 -4.50E-09 -4.98E-09 -5.09E-09
Un-Biased Statistics
Average Un-Biased -3.48E-10 -7.16E-10 -5.56E-10 -2.72E-10 -5.20E-11 4.06E-10 3.52E-10 -4.40E-10
Std Dev Un-Biased 9.04E-10 4.49E-10 4.27E-10 4.65E-10 5.23E-10 3.81E-10 3.91E-10 5.62E-10
Ps90%/90% (+KTL) Un-Biased 2.13E-09 5.14E-10 6.15E-10 1.00E-09 1.38E-09 1.45E-09 1.42E-09 1.10E-09
Ps90%/90% (-KTL) Un-Biased -2.83E-09 -1.95E-09 -1.73E-09 -1.55E-09 -1.49E-09 -6.38E-10 -7.21E-10 -1.98E-09
Specification MIN -5.00E-08 -5.00E-08 -5.00E-08 -5.00E-08 -5.00E-08 -5.00E-08 -5.00E-08 -5.00E-08
Status PASS PASS PASS PASS PASS PASS PASS PASS
Specification MAX 5.00E-08 5.00E-08 5.00E-08 5.00E-08 5.00E-08 5.00E-08 5.00E-08 5.00E-08
Status PASS PASS PASS PASS PASS PASS PASS PASS
Total Dose (krad(Si))

TID Report
11-350 111103 R1.3
An ISO 9001:2008 and DSCC Certified Company
36
Radiation Assured Devices 5017 N. 30th Street Colorado Springs, CO 80919 (719) 531-0800
-3.00E-07
-2.00E-07
-1.00E-07
0.00E+00
1.00E-07
2.00E-07
3.00E-07
0 20 40 60 80 100
Total Dose (krad(Si))
Po
sit
ive
In
pu
t B
ias
Cu
rre
nt
@ +
/-2
0V
VC
M=
16
.5V
Average Biased Average Un-Biased
Ps90%/90% (-KTL) Biased Ps90%/90% (-KTL) Un-Biased
Ps90%/90% (+KTL) Biased Ps90%/90% (+KTL) Un-Biased
Specif ication MIN Specif ication MAX
24-hr 168-hr
Anneal Anneal
Figure 5.15. Plot of Positive Input Bias Current @ +/-20V VCM=16.5V versus total dose. The solid diamonds
are the average of the measured data points for the samples irradiated under electrical bias while the shaded
diamonds are the average of the measured data points for the samples irradiated with all pins tied to ground. The
black lines (solid and/or dashed) are the average of the data points after application of the KTL statistics on the
samples irradiated under electrical bias while the gray lines (solid and/or dashed) are the average of the data
points after application of the KTL statistics on the samples irradiated in the unbiased condition. The red dotted
line(s) are the pre- and/or post-irradiation minimum and/or maximum specification value as defined in the
datasheet and/or test plan.

TID Report
11-350 111103 R1.3
An ISO 9001:2008 and DSCC Certified Company
37
Radiation Assured Devices 5017 N. 30th Street Colorado Springs, CO 80919 (719) 531-0800
Table 5.15. Raw data for Positive Input Bias Current @ +/-20V VCM=16.5V versus total dose, including the
statistical analysis, specification and the status of the testing (pass/fail).
Positive Input Bias Current @ +/-20V VCM=16.5V
24-hr
Anneal
168-hr
Anneal
Device 0 5 10 20 30 50 80 100
347 -1.23E-07 1.24E-07 1.29E-07 1.36E-07 1.41E-07 1.50E-07 1.44E-07 1.36E-07
352 -1.07E-07 1.09E-07 1.13E-07 1.20E-07 1.25E-07 1.32E-07 1.27E-07 1.20E-07
353 -1.04E-07 1.07E-07 1.12E-07 1.18E-07 1.24E-07 1.31E-07 1.26E-07 1.17E-07
355 -1.04E-07 1.07E-07 1.11E-07 1.18E-07 1.22E-07 1.30E-07 1.25E-07 1.18E-07
357 -1.04E-07 1.07E-07 1.12E-07 1.18E-07 1.23E-07 1.30E-07 1.25E-07 1.17E-07
359 -1.05E-07 1.12E-07 1.18E-07 1.27E-07 1.34E-07 1.46E-07 1.42E-07 1.31E-07
361 -8.88E-08 9.59E-08 1.01E-07 1.09E-07 1.16E-07 1.26E-07 1.22E-07 1.12E-07
368 -1.06E-07 1.13E-07 1.19E-07 1.28E-07 1.35E-07 1.48E-07 1.44E-07 1.33E-07
372 -9.91E-08 1.06E-07 1.12E-07 1.20E-07 1.27E-07 1.39E-07 1.36E-07 1.25E-07
378 -1.07E-07 1.14E-07 1.19E-07 1.28E-07 1.36E-07 1.48E-07 1.45E-07 1.33E-07
410 -1.03E-07 1.03E-07 1.03E-07 1.03E-07 1.03E-07 1.03E-07 1.03E-07 1.03E-07
413 -1.09E-07 1.09E-07 1.09E-07 1.09E-07 1.09E-07 1.09E-07 1.09E-07 1.09E-07
Biased Statistics
Average Biased -1.09E-07 1.11E-07 1.15E-07 1.22E-07 1.27E-07 1.35E-07 1.29E-07 1.22E-07
Std Dev Biased 8.30E-09 7.34E-09 7.52E-09 7.74E-09 7.82E-09 8.43E-09 8.27E-09 7.97E-09
Ps90%/90% (+KTL) Biased -8.59E-08 1.31E-07 1.36E-07 1.43E-07 1.48E-07 1.58E-07 1.52E-07 1.44E-07
Ps90%/90% (-KTL) Biased -1.31E-07 9.08E-08 9.46E-08 1.01E-07 1.05E-07 1.12E-07 1.06E-07 1.00E-07
Un-Biased Statistics
Average Un-Biased -1.01E-07 1.08E-07 1.14E-07 1.22E-07 1.30E-07 1.41E-07 1.38E-07 1.27E-07
Std Dev Un-Biased 7.51E-09 7.51E-09 7.97E-09 8.23E-09 8.52E-09 9.31E-09 9.37E-09 8.87E-09
Ps90%/90% (+KTL) Un-Biased -8.06E-08 1.29E-07 1.36E-07 1.45E-07 1.53E-07 1.67E-07 1.63E-07 1.51E-07
Ps90%/90% (-KTL) Un-Biased -1.22E-07 8.77E-08 9.18E-08 9.99E-08 1.06E-07 1.16E-07 1.12E-07 1.02E-07
Specification MIN -2.50E-07 -2.50E-07 -2.50E-07 -2.50E-07 -2.50E-07 -2.50E-07 -2.50E-07 -2.50E-07
Status PASS PASS PASS PASS PASS PASS PASS PASS
Specification MAX 2.50E-07 2.50E-07 2.50E-07 2.50E-07 2.50E-07 2.50E-07 2.50E-07 2.50E-07
Status PASS PASS PASS PASS PASS PASS PASS PASS
Total Dose (krad(Si))

TID Report
11-350 111103 R1.3
An ISO 9001:2008 and DSCC Certified Company
38
Radiation Assured Devices 5017 N. 30th Street Colorado Springs, CO 80919 (719) 531-0800
-3.00E-07
-2.00E-07
-1.00E-07
0.00E+00
1.00E-07
2.00E-07
3.00E-07
0 20 40 60 80 100
Total Dose (krad(Si))
Ne
ga
tiv
e In
pu
t B
ias
Cu
rre
nt
@ +
/-2
0V
VC
M=
16
.5V
Average Biased Average Un-Biased
Ps90%/90% (-KTL) Biased Ps90%/90% (-KTL) Un-Biased
Ps90%/90% (+KTL) Biased Ps90%/90% (+KTL) Un-Biased
Specif ication MIN Specif ication MAX
24-hr 168-hr
Anneal Anneal
Figure 5.16. Plot of Negative Input Bias Current @ +/-20V VCM=16.5V versus total dose. The solid diamonds
are the average of the measured data points for the samples irradiated under electrical bias while the shaded
diamonds are the average of the measured data points for the samples irradiated with all pins tied to ground. The
black lines (solid and/or dashed) are the average of the data points after application of the KTL statistics on the
samples irradiated under electrical bias while the gray lines (solid and/or dashed) are the average of the data
points after application of the KTL statistics on the samples irradiated in the unbiased condition. The red dotted
line(s) are the pre- and/or post-irradiation minimum and/or maximum specification value as defined in the
datasheet and/or test plan.
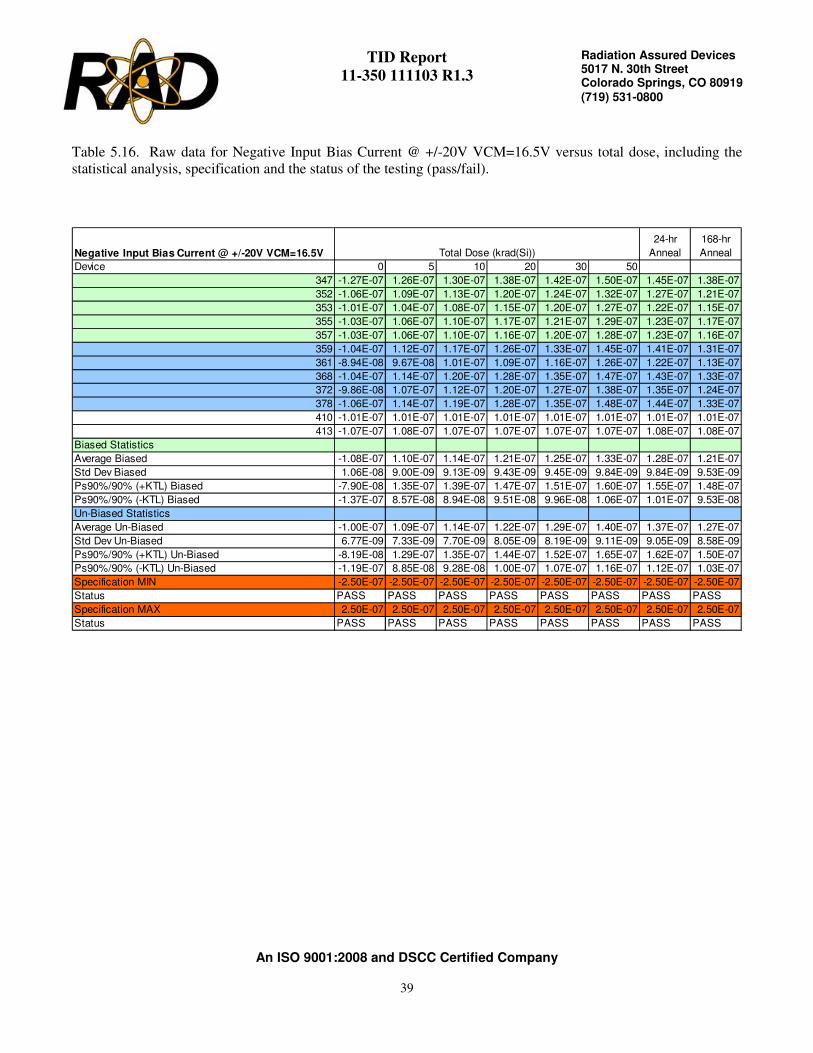
TID Report
11-350 111103 R1.3
An ISO 9001:2008 and DSCC Certified Company
39
Radiation Assured Devices 5017 N. 30th Street Colorado Springs, CO 80919 (719) 531-0800
Table 5.16. Raw data for Negative Input Bias Current @ +/-20V VCM=16.5V versus total dose, including the
statistical analysis, specification and the status of the testing (pass/fail).
Negative Input Bias Current @ +/-20V VCM=16.5V
24-hr
Anneal
168-hr
Anneal
Device 0 5 10 20 30 50 80 100
347 -1.27E-07 1.26E-07 1.30E-07 1.38E-07 1.42E-07 1.50E-07 1.45E-07 1.38E-07
352 -1.06E-07 1.09E-07 1.13E-07 1.20E-07 1.24E-07 1.32E-07 1.27E-07 1.21E-07
353 -1.01E-07 1.04E-07 1.08E-07 1.15E-07 1.20E-07 1.27E-07 1.22E-07 1.15E-07
355 -1.03E-07 1.06E-07 1.10E-07 1.17E-07 1.21E-07 1.29E-07 1.23E-07 1.17E-07
357 -1.03E-07 1.06E-07 1.10E-07 1.16E-07 1.20E-07 1.28E-07 1.23E-07 1.16E-07
359 -1.04E-07 1.12E-07 1.17E-07 1.26E-07 1.33E-07 1.45E-07 1.41E-07 1.31E-07
361 -8.94E-08 9.67E-08 1.01E-07 1.09E-07 1.16E-07 1.26E-07 1.22E-07 1.13E-07
368 -1.04E-07 1.14E-07 1.20E-07 1.28E-07 1.35E-07 1.47E-07 1.43E-07 1.33E-07
372 -9.86E-08 1.07E-07 1.12E-07 1.20E-07 1.27E-07 1.38E-07 1.35E-07 1.24E-07
378 -1.06E-07 1.14E-07 1.19E-07 1.28E-07 1.35E-07 1.48E-07 1.44E-07 1.33E-07
410 -1.01E-07 1.01E-07 1.01E-07 1.01E-07 1.01E-07 1.01E-07 1.01E-07 1.01E-07
413 -1.07E-07 1.08E-07 1.07E-07 1.07E-07 1.07E-07 1.07E-07 1.08E-07 1.08E-07
Biased Statistics
Average Biased -1.08E-07 1.10E-07 1.14E-07 1.21E-07 1.25E-07 1.33E-07 1.28E-07 1.21E-07
Std Dev Biased 1.06E-08 9.00E-09 9.13E-09 9.43E-09 9.45E-09 9.84E-09 9.84E-09 9.53E-09
Ps90%/90% (+KTL) Biased -7.90E-08 1.35E-07 1.39E-07 1.47E-07 1.51E-07 1.60E-07 1.55E-07 1.48E-07
Ps90%/90% (-KTL) Biased -1.37E-07 8.57E-08 8.94E-08 9.51E-08 9.96E-08 1.06E-07 1.01E-07 9.53E-08
Un-Biased Statistics
Average Un-Biased -1.00E-07 1.09E-07 1.14E-07 1.22E-07 1.29E-07 1.40E-07 1.37E-07 1.27E-07
Std Dev Un-Biased 6.77E-09 7.33E-09 7.70E-09 8.05E-09 8.19E-09 9.11E-09 9.05E-09 8.58E-09
Ps90%/90% (+KTL) Un-Biased -8.19E-08 1.29E-07 1.35E-07 1.44E-07 1.52E-07 1.65E-07 1.62E-07 1.50E-07
Ps90%/90% (-KTL) Un-Biased -1.19E-07 8.85E-08 9.28E-08 1.00E-07 1.07E-07 1.16E-07 1.12E-07 1.03E-07
Specification MIN -2.50E-07 -2.50E-07 -2.50E-07 -2.50E-07 -2.50E-07 -2.50E-07 -2.50E-07 -2.50E-07
Status PASS PASS PASS PASS PASS PASS PASS PASS
Specification MAX 2.50E-07 2.50E-07 2.50E-07 2.50E-07 2.50E-07 2.50E-07 2.50E-07 2.50E-07
Status PASS PASS PASS PASS PASS PASS PASS PASS
Total Dose (krad(Si))
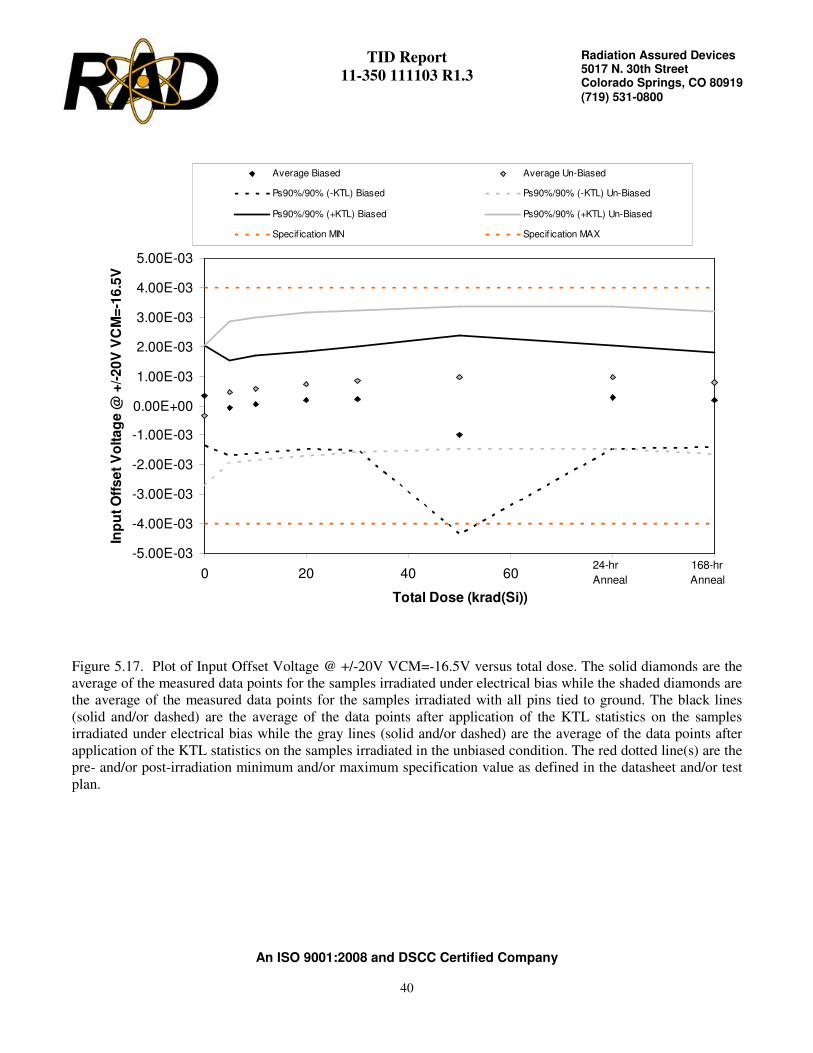
TID Report
11-350 111103 R1.3
An ISO 9001:2008 and DSCC Certified Company
40
Radiation Assured Devices 5017 N. 30th Street Colorado Springs, CO 80919 (719) 531-0800
-5.00E-03
-4.00E-03
-3.00E-03
-2.00E-03
-1.00E-03
0.00E+00
1.00E-03
2.00E-03
3.00E-03
4.00E-03
5.00E-03
0 20 40 60 80 100
Total Dose (krad(Si))
Inp
ut
Off
se
t V
olt
ag
e @
+/-
20
V V
CM
=-1
6.5
V
Average Biased Average Un-Biased
Ps90%/90% (-KTL) Biased Ps90%/90% (-KTL) Un-Biased
Ps90%/90% (+KTL) Biased Ps90%/90% (+KTL) Un-Biased
Specif ication MIN Specif ication MAX
24-hr 168-hr
Anneal Anneal
Figure 5.17. Plot of Input Offset Voltage @ +/-20V VCM=-16.5V versus total dose. The solid diamonds are the
average of the measured data points for the samples irradiated under electrical bias while the shaded diamonds are
the average of the measured data points for the samples irradiated with all pins tied to ground. The black lines
(solid and/or dashed) are the average of the data points after application of the KTL statistics on the samples
irradiated under electrical bias while the gray lines (solid and/or dashed) are the average of the data points after
application of the KTL statistics on the samples irradiated in the unbiased condition. The red dotted line(s) are the
pre- and/or post-irradiation minimum and/or maximum specification value as defined in the datasheet and/or test
plan.

TID Report
11-350 111103 R1.3
An ISO 9001:2008 and DSCC Certified Company
41
Radiation Assured Devices 5017 N. 30th Street Colorado Springs, CO 80919 (719) 531-0800
Table 5.17. Raw data for Input Offset Voltage @ +/-20V VCM=-16.5V versus total dose, including the statistical
analysis, specification and the status of the testing (pass/fail).
Input Offset Voltage @ +/-20V VCM=-16.5V
24-hr
Anneal
168-hr
Anneal
Device 0 5 10 20 30 50 80 100
347 8.36E-04 -4.63E-04 -3.63E-04 -1.99E-04 -8.60E-05 -3.21E-04 2.40E-05 -2.10E-04
352 4.91E-04 -2.51E-04 -1.52E-04 -2.50E-05 2.20E-05 -9.46E-04 2.80E-05 -7.00E-05
353 9.25E-04 -6.66E-04 -5.46E-04 -3.95E-04 -5.15E-04 -3.12E-03 -4.39E-04 -2.68E-04
355 3.60E-05 2.20E-04 3.28E-04 4.90E-04 5.40E-04 -4.14E-04 6.10E-04 3.59E-04
357 -5.73E-04 8.16E-04 9.39E-04 1.09E-03 1.15E-03 -1.57E-04 1.22E-03 1.14E-03
359 -1.67E-03 1.78E-03 1.91E-03 2.05E-03 2.16E-03 2.31E-03 2.31E-03 2.12E-03
361 -6.77E-04 8.29E-04 9.38E-04 1.08E-03 1.19E-03 1.31E-03 1.33E-03 1.16E-03
368 4.70E-04 -3.68E-04 -2.64E-04 -1.27E-04 -3.20E-05 1.05E-04 1.09E-04 -9.20E-05
372 3.42E-04 -2.14E-04 -1.00E-04 5.10E-05 1.82E-04 3.37E-04 3.33E-04 1.43E-04
378 -1.72E-04 2.83E-04 3.96E-04 5.43E-04 6.56E-04 7.64E-04 7.68E-04 6.10E-04
410 -7.80E-05 1.22E-04 1.19E-04 1.18E-04 1.13E-04 1.17E-04 1.43E-04 1.26E-04
413 -1.31E-03 1.28E-03 1.29E-03 1.29E-03 1.28E-03 1.29E-03 1.28E-03 1.28E-03
Biased Statistics
Average Biased 3.43E-04 -6.88E-05 4.12E-05 1.92E-04 2.22E-04 -9.91E-04 2.88E-04 1.90E-04
Std Dev Biased 6.20E-04 5.94E-04 5.99E-04 6.00E-04 6.40E-04 1.23E-03 6.39E-04 5.84E-04
Ps90%/90% (+KTL) Biased 2.04E-03 1.56E-03 1.68E-03 1.84E-03 1.98E-03 2.37E-03 2.04E-03 1.79E-03
Ps90%/90% (-KTL) Biased -1.36E-03 -1.70E-03 -1.60E-03 -1.45E-03 -1.53E-03 -4.35E-03 -1.46E-03 -1.41E-03
Un-Biased Statistics
Average Un-Biased -3.42E-04 4.63E-04 5.76E-04 7.20E-04 8.30E-04 9.66E-04 9.70E-04 7.88E-04
Std Dev Un-Biased 8.72E-04 8.75E-04 8.80E-04 8.80E-04 8.78E-04 8.82E-04 8.82E-04 8.85E-04
Ps90%/90% (+KTL) Un-Biased 2.05E-03 2.86E-03 2.99E-03 3.13E-03 3.24E-03 3.38E-03 3.39E-03 3.22E-03
Ps90%/90% (-KTL) Un-Biased -2.73E-03 -1.94E-03 -1.84E-03 -1.69E-03 -1.58E-03 -1.45E-03 -1.45E-03 -1.64E-03
Specification MIN -4.00E-03 -4.00E-03 -4.00E-03 -4.00E-03 -4.00E-03 -4.00E-03 -4.00E-03 -4.00E-03
Status PASS PASS PASS PASS PASS PASS PASS PASS
Specification MAX 4.00E-03 4.00E-03 4.00E-03 4.00E-03 4.00E-03 4.00E-03 4.00E-03 4.00E-03
Status PASS PASS PASS PASS PASS PASS PASS PASS
Total Dose (krad(Si))

TID Report
11-350 111103 R1.3
An ISO 9001:2008 and DSCC Certified Company
42
Radiation Assured Devices 5017 N. 30th Street Colorado Springs, CO 80919 (719) 531-0800
-6.00E-08
-4.00E-08
-2.00E-08
0.00E+00
2.00E-08
4.00E-08
6.00E-08
0 20 40 60 80 100
Total Dose (krad(Si))
Inp
ut
Off
se
t C
urr
en
t @
+/-
20
V V
CM
=-1
6.5
V
Average Biased Average Un-Biased
Ps90%/90% (-KTL) Biased Ps90%/90% (-KTL) Un-Biased
Ps90%/90% (+KTL) Biased Ps90%/90% (+KTL) Un-Biased
Specif ication MIN Specif ication MAX
24-hr 168-hr
Anneal Anneal
Figure 5.18. Plot of Input Offset Current @ +/-20V VCM=-16.5V versus total dose. The solid diamonds are the
average of the measured data points for the samples irradiated under electrical bias while the shaded diamonds are
the average of the measured data points for the samples irradiated with all pins tied to ground. The black lines
(solid and/or dashed) are the average of the data points after application of the KTL statistics on the samples
irradiated under electrical bias while the gray lines (solid and/or dashed) are the average of the data points after
application of the KTL statistics on the samples irradiated in the unbiased condition. The red dotted line(s) are the
pre- and/or post-irradiation minimum and/or maximum specification value as defined in the datasheet and/or test
plan.

TID Report
11-350 111103 R1.3
An ISO 9001:2008 and DSCC Certified Company
43
Radiation Assured Devices 5017 N. 30th Street Colorado Springs, CO 80919 (719) 531-0800
Table 5.18. Raw data for Input Offset Current @ +/-20V VCM=-16.5V versus total dose, including the statistical
analysis, specification and the status of the testing (pass/fail).
Input Offset Current @ +/-20V VCM=-16.5V
24-hr
Anneal
168-hr
Anneal
Device 0 5 10 20 30 50 80 100
347 3.84E-09 -3.08E-09 -2.76E-09 -2.64E-09 -2.06E-09 -1.89E-09 -2.37E-09 -2.86E-09
352 -1.80E-10 -9.90E-10 -9.80E-10 -4.40E-10 -3.30E-10 -4.70E-10 -6.60E-10 -1.69E-09
353 -1.92E-09 1.91E-09 2.21E-09 2.67E-09 3.05E-09 3.46E-09 3.21E-09 1.89E-09
355 -1.02E-09 -2.00E-11 1.50E-10 1.20E-10 2.60E-10 4.30E-10 3.20E-10 3.00E-10
357 -8.20E-10 7.60E-10 1.34E-09 1.56E-09 2.01E-09 1.71E-09 1.31E-09 4.10E-10
359 -4.60E-10 -7.10E-10 -5.60E-10 -2.00E-10 2.00E-10 6.40E-10 4.90E-10 -4.30E-10
361 1.11E-09 -1.22E-09 -1.23E-09 -9.70E-10 -9.30E-10 -3.40E-10 -4.70E-10 -1.18E-09
368 -1.09E-09 -1.47E-09 -1.35E-09 -1.09E-09 -8.80E-10 1.00E-10 -7.00E-11 -1.22E-09
372 0.00E+00 -7.30E-10 -5.80E-10 -1.40E-10 -7.00E-11 8.00E-11 4.00E-10 1.00E-10
378 8.00E-11 -7.30E-10 -4.70E-10 -5.60E-10 1.00E-10 -3.10E-10 -2.60E-10 -6.60E-10
410 -1.12E-09 1.04E-09 1.00E-09 1.13E-09 1.08E-09 1.07E-09 1.03E-09 1.11E-09
413 -9.40E-10 8.60E-10 9.50E-10 8.10E-10 8.30E-10 9.00E-10 8.60E-10 7.80E-10
Biased Statistics
Average Biased -2.00E-11 -2.84E-10 -8.00E-12 2.54E-10 5.86E-10 6.48E-10 3.62E-10 -3.90E-10
Std Dev Biased 2.25E-09 1.89E-09 1.95E-09 2.03E-09 2.00E-09 2.05E-09 2.09E-09 1.88E-09
Ps90%/90% (+KTL) Biased 6.14E-09 4.90E-09 5.35E-09 5.81E-09 6.08E-09 6.26E-09 6.10E-09 4.76E-09
Ps90%/90% (-KTL) Biased -6.18E-09 -5.47E-09 -5.37E-09 -5.30E-09 -4.91E-09 -4.97E-09 -5.38E-09 -5.54E-09
Un-Biased Statistics
Average Un-Biased -7.20E-11 -9.72E-10 -8.38E-10 -5.92E-10 -3.16E-10 3.40E-11 1.80E-11 -6.78E-10
Std Dev Un-Biased 8.08E-10 3.52E-10 4.17E-10 4.33E-10 5.47E-10 3.97E-10 4.16E-10 5.51E-10
Ps90%/90% (+KTL) Un-Biased 2.14E-09 -7.14E-12 3.05E-10 5.95E-10 1.18E-09 1.12E-09 1.16E-09 8.32E-10
Ps90%/90% (-KTL) Un-Biased -2.29E-09 -1.94E-09 -1.98E-09 -1.78E-09 -1.81E-09 -1.06E-09 -1.12E-09 -2.19E-09
Specification MIN -5.00E-08 -5.00E-08 -5.00E-08 -5.00E-08 -5.00E-08 -5.00E-08 -5.00E-08 -5.00E-08
Status PASS PASS PASS PASS PASS PASS PASS PASS
Specification MAX 5.00E-08 5.00E-08 5.00E-08 5.00E-08 5.00E-08 5.00E-08 5.00E-08 5.00E-08
Status PASS PASS PASS PASS PASS PASS PASS PASS
Total Dose (krad(Si))

TID Report
11-350 111103 R1.3
An ISO 9001:2008 and DSCC Certified Company
44
Radiation Assured Devices 5017 N. 30th Street Colorado Springs, CO 80919 (719) 531-0800
-3.00E-07
-2.00E-07
-1.00E-07
0.00E+00
1.00E-07
2.00E-07
3.00E-07
0 20 40 60 80 100
Total Dose (krad(Si))
Po
sit
ive
In
pu
t B
ias
Cu
rre
nt
@ +
/-2
0V
VC
M=
-16
.5V
Average Biased Average Un-Biased
Ps90%/90% (-KTL) Biased Ps90%/90% (-KTL) Un-Biased
Ps90%/90% (+KTL) Biased Ps90%/90% (+KTL) Un-Biased
Specif ication MIN Specif ication MAX
24-hr 168-hr
Anneal Anneal
Figure 5.19. Plot of Positive Input Bias Current @ +/-20V VCM=-16.5V versus total dose. The solid diamonds
are the average of the measured data points for the samples irradiated under electrical bias while the shaded
diamonds are the average of the measured data points for the samples irradiated with all pins tied to ground. The
black lines (solid and/or dashed) are the average of the data points after application of the KTL statistics on the
samples irradiated under electrical bias while the gray lines (solid and/or dashed) are the average of the data
points after application of the KTL statistics on the samples irradiated in the unbiased condition. The red dotted
line(s) are the pre- and/or post-irradiation minimum and/or maximum specification value as defined in the
datasheet and/or test plan.
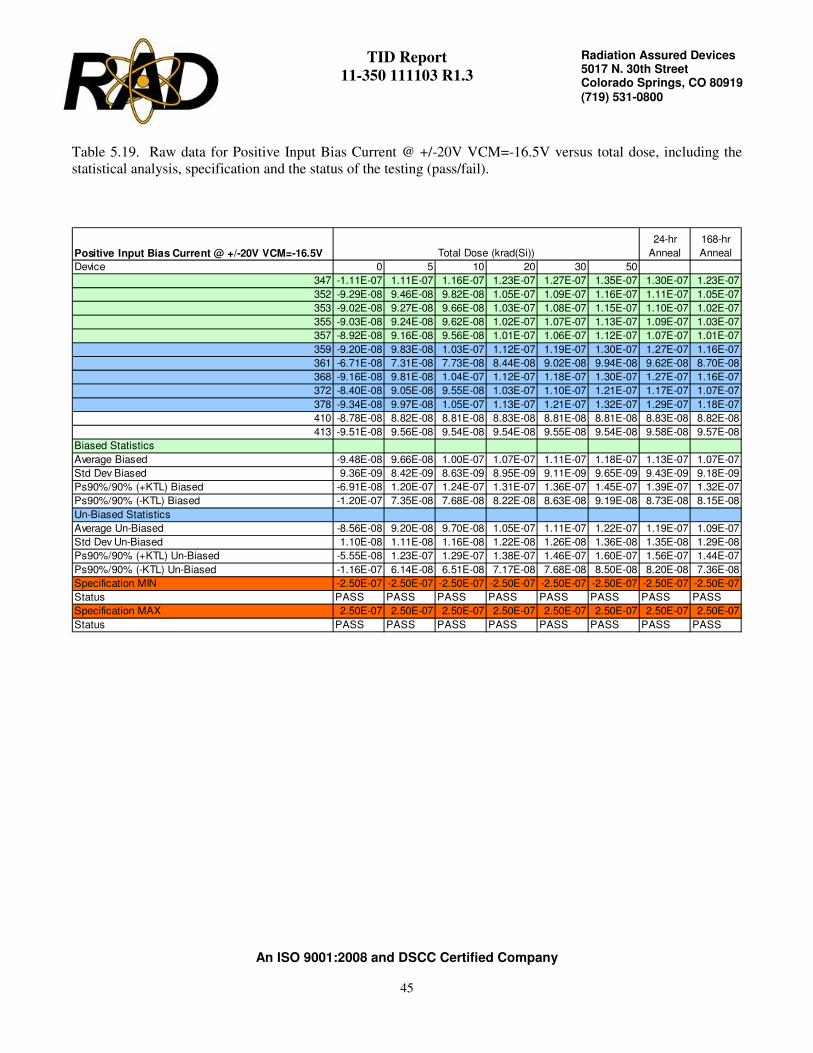
TID Report
11-350 111103 R1.3
An ISO 9001:2008 and DSCC Certified Company
45
Radiation Assured Devices 5017 N. 30th Street Colorado Springs, CO 80919 (719) 531-0800
Table 5.19. Raw data for Positive Input Bias Current @ +/-20V VCM=-16.5V versus total dose, including the
statistical analysis, specification and the status of the testing (pass/fail).
Positive Input Bias Current @ +/-20V VCM=-16.5V
24-hr
Anneal
168-hr
Anneal
Device 0 5 10 20 30 50 80 100
347 -1.11E-07 1.11E-07 1.16E-07 1.23E-07 1.27E-07 1.35E-07 1.30E-07 1.23E-07
352 -9.29E-08 9.46E-08 9.82E-08 1.05E-07 1.09E-07 1.16E-07 1.11E-07 1.05E-07
353 -9.02E-08 9.27E-08 9.66E-08 1.03E-07 1.08E-07 1.15E-07 1.10E-07 1.02E-07
355 -9.03E-08 9.24E-08 9.62E-08 1.02E-07 1.07E-07 1.13E-07 1.09E-07 1.03E-07
357 -8.92E-08 9.16E-08 9.56E-08 1.01E-07 1.06E-07 1.12E-07 1.07E-07 1.01E-07
359 -9.20E-08 9.83E-08 1.03E-07 1.12E-07 1.19E-07 1.30E-07 1.27E-07 1.16E-07
361 -6.71E-08 7.31E-08 7.73E-08 8.44E-08 9.02E-08 9.94E-08 9.62E-08 8.70E-08
368 -9.16E-08 9.81E-08 1.04E-07 1.12E-07 1.18E-07 1.30E-07 1.27E-07 1.16E-07
372 -8.40E-08 9.05E-08 9.55E-08 1.03E-07 1.10E-07 1.21E-07 1.17E-07 1.07E-07
378 -9.34E-08 9.97E-08 1.05E-07 1.13E-07 1.21E-07 1.32E-07 1.29E-07 1.18E-07
410 -8.78E-08 8.82E-08 8.81E-08 8.83E-08 8.81E-08 8.81E-08 8.83E-08 8.82E-08
413 -9.51E-08 9.56E-08 9.54E-08 9.54E-08 9.55E-08 9.54E-08 9.58E-08 9.57E-08
Biased Statistics
Average Biased -9.48E-08 9.66E-08 1.00E-07 1.07E-07 1.11E-07 1.18E-07 1.13E-07 1.07E-07
Std Dev Biased 9.36E-09 8.42E-09 8.63E-09 8.95E-09 9.11E-09 9.65E-09 9.43E-09 9.18E-09
Ps90%/90% (+KTL) Biased -6.91E-08 1.20E-07 1.24E-07 1.31E-07 1.36E-07 1.45E-07 1.39E-07 1.32E-07
Ps90%/90% (-KTL) Biased -1.20E-07 7.35E-08 7.68E-08 8.22E-08 8.63E-08 9.19E-08 8.73E-08 8.15E-08
Un-Biased Statistics
Average Un-Biased -8.56E-08 9.20E-08 9.70E-08 1.05E-07 1.11E-07 1.22E-07 1.19E-07 1.09E-07
Std Dev Un-Biased 1.10E-08 1.11E-08 1.16E-08 1.22E-08 1.26E-08 1.36E-08 1.35E-08 1.29E-08
Ps90%/90% (+KTL) Un-Biased -5.55E-08 1.23E-07 1.29E-07 1.38E-07 1.46E-07 1.60E-07 1.56E-07 1.44E-07
Ps90%/90% (-KTL) Un-Biased -1.16E-07 6.14E-08 6.51E-08 7.17E-08 7.68E-08 8.50E-08 8.20E-08 7.36E-08
Specification MIN -2.50E-07 -2.50E-07 -2.50E-07 -2.50E-07 -2.50E-07 -2.50E-07 -2.50E-07 -2.50E-07
Status PASS PASS PASS PASS PASS PASS PASS PASS
Specification MAX 2.50E-07 2.50E-07 2.50E-07 2.50E-07 2.50E-07 2.50E-07 2.50E-07 2.50E-07
Status PASS PASS PASS PASS PASS PASS PASS PASS
Total Dose (krad(Si))
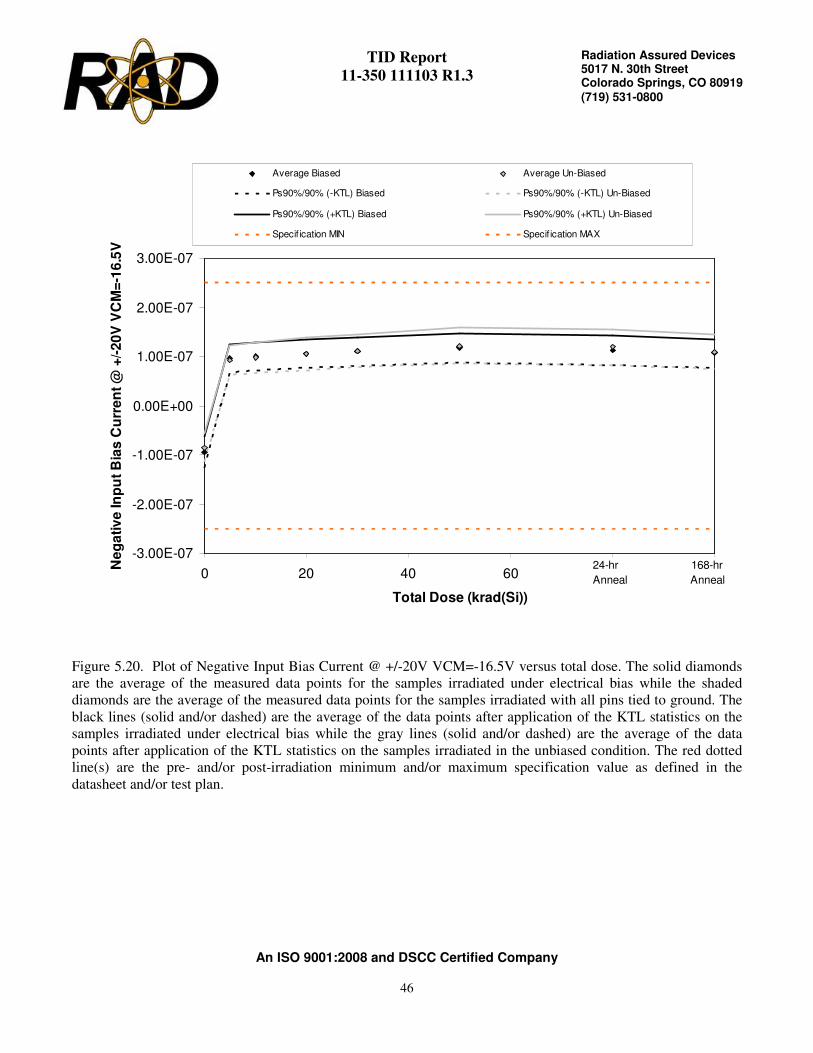
TID Report
11-350 111103 R1.3
An ISO 9001:2008 and DSCC Certified Company
46
Radiation Assured Devices 5017 N. 30th Street Colorado Springs, CO 80919 (719) 531-0800
-3.00E-07
-2.00E-07
-1.00E-07
0.00E+00
1.00E-07
2.00E-07
3.00E-07
0 20 40 60 80 100
Total Dose (krad(Si))
Ne
ga
tiv
e In
pu
t B
ias
Cu
rre
nt
@ +
/-2
0V
VC
M=
-16
.5V
Average Biased Average Un-Biased
Ps90%/90% (-KTL) Biased Ps90%/90% (-KTL) Un-Biased
Ps90%/90% (+KTL) Biased Ps90%/90% (+KTL) Un-Biased
Specif ication MIN Specif ication MAX
24-hr 168-hr
Anneal Anneal
Figure 5.20. Plot of Negative Input Bias Current @ +/-20V VCM=-16.5V versus total dose. The solid diamonds
are the average of the measured data points for the samples irradiated under electrical bias while the shaded
diamonds are the average of the measured data points for the samples irradiated with all pins tied to ground. The
black lines (solid and/or dashed) are the average of the data points after application of the KTL statistics on the
samples irradiated under electrical bias while the gray lines (solid and/or dashed) are the average of the data
points after application of the KTL statistics on the samples irradiated in the unbiased condition. The red dotted
line(s) are the pre- and/or post-irradiation minimum and/or maximum specification value as defined in the
datasheet and/or test plan.

TID Report
11-350 111103 R1.3
An ISO 9001:2008 and DSCC Certified Company
47
Radiation Assured Devices 5017 N. 30th Street Colorado Springs, CO 80919 (719) 531-0800
Table 5.20. Raw data for Negative Input Bias Current @ +/-20V VCM=-16.5V versus total dose, including the
statistical analysis, specification and the status of the testing (pass/fail).
Negative Input Bias Current @ +/-20V VCM=-16.5V
24-hr
Anneal
168-hr
Anneal
Device 0 5 10 20 30 50 80 100
347 -1.15E-07 1.14E-07 1.18E-07 1.25E-07 1.29E-07 1.37E-07 1.32E-07 1.25E-07
352 -9.24E-08 9.52E-08 9.89E-08 1.05E-07 1.09E-07 1.16E-07 1.11E-07 1.06E-07
353 -8.80E-08 9.04E-08 9.41E-08 1.00E-07 1.04E-07 1.11E-07 1.06E-07 9.99E-08
355 -8.90E-08 9.23E-08 9.58E-08 1.02E-07 1.06E-07 1.13E-07 1.08E-07 1.02E-07
357 -8.81E-08 9.04E-08 9.40E-08 9.95E-08 1.04E-07 1.10E-07 1.06E-07 1.00E-07
359 -9.13E-08 9.88E-08 1.04E-07 1.12E-07 1.18E-07 1.29E-07 1.26E-07 1.16E-07
361 -6.80E-08 7.41E-08 7.82E-08 8.49E-08 9.09E-08 9.93E-08 9.65E-08 8.79E-08
368 -9.02E-08 9.94E-08 1.04E-07 1.12E-07 1.19E-07 1.29E-07 1.26E-07 1.17E-07
372 -8.38E-08 9.10E-08 9.56E-08 1.03E-07 1.10E-07 1.20E-07 1.17E-07 1.07E-07
378 -9.31E-08 1.00E-07 1.05E-07 1.14E-07 1.20E-07 1.32E-07 1.29E-07 1.18E-07
410 -8.63E-08 8.68E-08 8.68E-08 8.67E-08 8.67E-08 8.67E-08 8.70E-08 8.69E-08
413 -9.38E-08 9.44E-08 9.42E-08 9.41E-08 9.44E-08 9.42E-08 9.45E-08 9.45E-08
Biased Statistics
Average Biased -9.44E-08 9.65E-08 1.00E-07 1.06E-07 1.10E-07 1.17E-07 1.13E-07 1.07E-07
Std Dev Biased 1.15E-08 1.01E-08 1.02E-08 1.06E-08 1.07E-08 1.12E-08 1.10E-08 1.07E-08
Ps90%/90% (+KTL) Biased -6.28E-08 1.24E-07 1.28E-07 1.35E-07 1.40E-07 1.48E-07 1.43E-07 1.36E-07
Ps90%/90% (-KTL) Biased -1.26E-07 6.89E-08 7.21E-08 7.71E-08 8.11E-08 8.68E-08 8.23E-08 7.74E-08
Un-Biased Statistics
Average Un-Biased -8.53E-08 9.26E-08 9.75E-08 1.05E-07 1.11E-07 1.22E-07 1.19E-07 1.09E-07
Std Dev Un-Biased 1.03E-08 1.10E-08 1.14E-08 1.21E-08 1.22E-08 1.34E-08 1.32E-08 1.27E-08
Ps90%/90% (+KTL) Un-Biased -5.70E-08 1.23E-07 1.29E-07 1.38E-07 1.45E-07 1.59E-07 1.55E-07 1.44E-07
Ps90%/90% (-KTL) Un-Biased -1.13E-07 6.24E-08 6.61E-08 7.21E-08 7.80E-08 8.52E-08 8.25E-08 7.45E-08
Specification MIN -2.50E-07 -2.50E-07 -2.50E-07 -2.50E-07 -2.50E-07 -2.50E-07 -2.50E-07 -2.50E-07
Status PASS PASS PASS PASS PASS PASS PASS PASS
Specification MAX 2.50E-07 2.50E-07 2.50E-07 2.50E-07 2.50E-07 2.50E-07 2.50E-07 2.50E-07
Status PASS PASS PASS PASS PASS PASS PASS PASS
Total Dose (krad(Si))

TID Report
11-350 111103 R1.3
An ISO 9001:2008 and DSCC Certified Company
48
Radiation Assured Devices 5017 N. 30th Street Colorado Springs, CO 80919 (719) 531-0800
-5.00E-03
-4.00E-03
-3.00E-03
-2.00E-03
-1.00E-03
0.00E+00
1.00E-03
2.00E-03
3.00E-03
4.00E-03
5.00E-03
0 20 40 60 80 100
Total Dose (krad(Si))
Inp
ut
Off
se
t V
olt
ag
e @
+/-
5V
VC
M=
1V
Average Biased Average Un-Biased Ps90%/90% (-KTL) Biased
Ps90%/90% (-KTL) Un-Biased Ps90%/90% (+KTL) Biased Ps90%/90% (+KTL) Un-Biased
Specif ication MIN Specif ication MAX
24-hr 168-hr
Anneal Anneal
Figure 5.21. Plot of Input Offset Voltage @ +/-5V VCM=1V versus total dose. The solid diamonds are the
average of the measured data points for the samples irradiated under electrical bias while the shaded diamonds are
the average of the measured data points for the samples irradiated with all pins tied to ground. The black lines
(solid and/or dashed) are the average of the data points after application of the KTL statistics on the samples
irradiated under electrical bias while the gray lines (solid and/or dashed) are the average of the data points after
application of the KTL statistics on the samples irradiated in the unbiased condition. The red dotted line(s) are the
pre- and/or post-irradiation minimum and/or maximum specification value as defined in the datasheet and/or test
plan.

TID Report
11-350 111103 R1.3
An ISO 9001:2008 and DSCC Certified Company
49
Radiation Assured Devices 5017 N. 30th Street Colorado Springs, CO 80919 (719) 531-0800
Table 5.21. Raw data for Input Offset Voltage @ +/-5V VCM=1V versus total dose, including the statistical
analysis, specification and the status of the testing (pass/fail).
Input Offset Voltage @ +/-5V VCM=1V
24-hr
Anneal
168-hr
Anneal
Device 0 5 10 20 30 50 80 100
347 7.26E-04 -3.64E-04 -2.72E-04 -1.25E-04 -6.00E-06 1.20E-04 1.05E-04 -1.31E-04
352 3.83E-04 -1.63E-04 -6.00E-05 6.20E-05 1.17E-04 1.86E-04 1.43E-04 4.00E-06
353 8.23E-04 -5.73E-04 -4.55E-04 -3.01E-04 -2.03E-04 -5.80E-05 -8.30E-05 -1.90E-04
355 -1.30E-05 2.54E-04 3.57E-04 5.06E-04 5.93E-04 7.06E-04 6.74E-04 3.85E-04
357 -6.17E-04 8.50E-04 9.62E-04 1.11E-03 1.21E-03 1.33E-03 1.31E-03 1.14E-03
359 -1.65E-03 1.77E-03 1.89E-03 2.02E-03 2.12E-03 2.26E-03 2.25E-03 2.08E-03
361 -8.34E-04 9.90E-04 1.09E-03 1.24E-03 1.33E-03 1.43E-03 1.46E-03 1.31E-03
368 3.26E-04 -2.23E-04 -1.21E-04 9.00E-06 9.50E-05 2.15E-04 2.31E-04 4.90E-05
372 2.32E-04 -1.01E-04 1.10E-05 1.49E-04 2.75E-04 4.15E-04 4.10E-04 2.38E-04
378 -2.26E-04 3.51E-04 4.54E-04 5.93E-04 6.98E-04 7.94E-04 7.97E-04 6.61E-04
410 -1.88E-04 2.20E-04 2.26E-04 2.18E-04 2.19E-04 2.19E-04 2.40E-04 2.26E-04
413 -1.28E-03 1.24E-03 1.26E-03 1.26E-03 1.25E-03 1.25E-03 1.24E-03 1.25E-03
Biased Statistics
Average Biased 2.60E-04 8.00E-07 1.06E-04 2.49E-04 3.41E-04 4.57E-04 4.30E-04 2.42E-04
Std Dev Biased 5.90E-04 5.64E-04 5.66E-04 5.65E-04 5.65E-04 5.65E-04 5.66E-04 5.51E-04
Ps90%/90% (+KTL) Biased 1.88E-03 1.55E-03 1.66E-03 1.80E-03 1.89E-03 2.01E-03 1.98E-03 1.75E-03
Ps90%/90% (-KTL) Biased -1.36E-03 -1.55E-03 -1.45E-03 -1.30E-03 -1.21E-03 -1.09E-03 -1.12E-03 -1.27E-03
Un-Biased Statistics
Average Un-Biased -4.29E-04 5.58E-04 6.64E-04 8.02E-04 9.02E-04 1.02E-03 1.03E-03 8.67E-04
Std Dev Un-Biased 8.20E-04 8.28E-04 8.31E-04 8.33E-04 8.28E-04 8.31E-04 8.29E-04 8.32E-04
Ps90%/90% (+KTL) Un-Biased 1.82E-03 2.83E-03 2.94E-03 3.09E-03 3.17E-03 3.30E-03 3.30E-03 3.15E-03
Ps90%/90% (-KTL) Un-Biased -2.68E-03 -1.71E-03 -1.61E-03 -1.48E-03 -1.37E-03 -1.26E-03 -1.24E-03 -1.41E-03
Specification MIN -4.00E-03 -4.00E-03 -4.00E-03 -4.00E-03 -4.00E-03 -4.00E-03 -4.00E-03 -4.00E-03
Status PASS PASS PASS PASS PASS PASS PASS PASS
Specification MAX 4.00E-03 4.00E-03 4.00E-03 4.00E-03 4.00E-03 4.00E-03 4.00E-03 4.00E-03
Status PASS PASS PASS PASS PASS PASS PASS PASS
Total Dose (krad(Si))

TID Report
11-350 111103 R1.3
An ISO 9001:2008 and DSCC Certified Company
50
Radiation Assured Devices 5017 N. 30th Street Colorado Springs, CO 80919 (719) 531-0800
-6.00E-08
-4.00E-08
-2.00E-08
0.00E+00
2.00E-08
4.00E-08
6.00E-08
0 20 40 60 80 100
Total Dose (krad(Si))
Inp
ut
Off
se
t C
urr
en
t @
+/-
5V
VC
M=
1V
Average Biased Average Un-Biased Ps90%/90% (-KTL) Biased
Ps90%/90% (-KTL) Un-Biased Ps90%/90% (+KTL) Biased Ps90%/90% (+KTL) Un-Biased
Specif ication MIN Specif ication MAX
24-hr 168-hr
Anneal Anneal
Figure 5.22. Plot of Input Offset Current @ +/-5V VCM=1V versus total dose. The solid diamonds are the
average of the measured data points for the samples irradiated under electrical bias while the shaded diamonds are
the average of the measured data points for the samples irradiated with all pins tied to ground. The black lines
(solid and/or dashed) are the average of the data points after application of the KTL statistics on the samples
irradiated under electrical bias while the gray lines (solid and/or dashed) are the average of the data points after
application of the KTL statistics on the samples irradiated in the unbiased condition. The red dotted line(s) are the
pre- and/or post-irradiation minimum and/or maximum specification value as defined in the datasheet and/or test
plan.
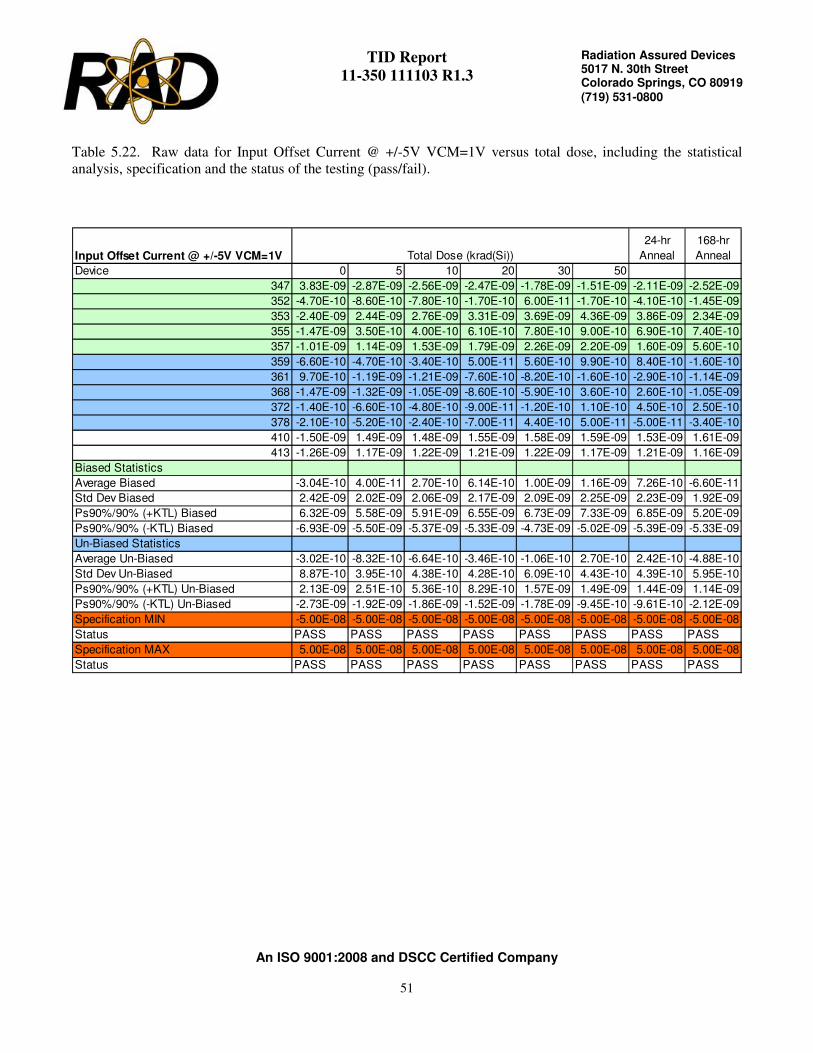
TID Report
11-350 111103 R1.3
An ISO 9001:2008 and DSCC Certified Company
51
Radiation Assured Devices 5017 N. 30th Street Colorado Springs, CO 80919 (719) 531-0800
Table 5.22. Raw data for Input Offset Current @ +/-5V VCM=1V versus total dose, including the statistical
analysis, specification and the status of the testing (pass/fail).
Input Offset Current @ +/-5V VCM=1V
24-hr
Anneal
168-hr
Anneal
Device 0 5 10 20 30 50 80 100
347 3.83E-09 -2.87E-09 -2.56E-09 -2.47E-09 -1.78E-09 -1.51E-09 -2.11E-09 -2.52E-09
352 -4.70E-10 -8.60E-10 -7.80E-10 -1.70E-10 6.00E-11 -1.70E-10 -4.10E-10 -1.45E-09
353 -2.40E-09 2.44E-09 2.76E-09 3.31E-09 3.69E-09 4.36E-09 3.86E-09 2.34E-09
355 -1.47E-09 3.50E-10 4.00E-10 6.10E-10 7.80E-10 9.00E-10 6.90E-10 7.40E-10
357 -1.01E-09 1.14E-09 1.53E-09 1.79E-09 2.26E-09 2.20E-09 1.60E-09 5.60E-10
359 -6.60E-10 -4.70E-10 -3.40E-10 5.00E-11 5.60E-10 9.90E-10 8.40E-10 -1.60E-10
361 9.70E-10 -1.19E-09 -1.21E-09 -7.60E-10 -8.20E-10 -1.60E-10 -2.90E-10 -1.14E-09
368 -1.47E-09 -1.32E-09 -1.05E-09 -8.60E-10 -5.90E-10 3.60E-10 2.60E-10 -1.05E-09
372 -1.40E-10 -6.60E-10 -4.80E-10 -9.00E-11 -1.20E-10 1.10E-10 4.50E-10 2.50E-10
378 -2.10E-10 -5.20E-10 -2.40E-10 -7.00E-11 4.40E-10 5.00E-11 -5.00E-11 -3.40E-10
410 -1.50E-09 1.49E-09 1.48E-09 1.55E-09 1.58E-09 1.59E-09 1.53E-09 1.61E-09
413 -1.26E-09 1.17E-09 1.22E-09 1.21E-09 1.22E-09 1.17E-09 1.21E-09 1.16E-09
Biased Statistics
Average Biased -3.04E-10 4.00E-11 2.70E-10 6.14E-10 1.00E-09 1.16E-09 7.26E-10 -6.60E-11
Std Dev Biased 2.42E-09 2.02E-09 2.06E-09 2.17E-09 2.09E-09 2.25E-09 2.23E-09 1.92E-09
Ps90%/90% (+KTL) Biased 6.32E-09 5.58E-09 5.91E-09 6.55E-09 6.73E-09 7.33E-09 6.85E-09 5.20E-09
Ps90%/90% (-KTL) Biased -6.93E-09 -5.50E-09 -5.37E-09 -5.33E-09 -4.73E-09 -5.02E-09 -5.39E-09 -5.33E-09
Un-Biased Statistics
Average Un-Biased -3.02E-10 -8.32E-10 -6.64E-10 -3.46E-10 -1.06E-10 2.70E-10 2.42E-10 -4.88E-10
Std Dev Un-Biased 8.87E-10 3.95E-10 4.38E-10 4.28E-10 6.09E-10 4.43E-10 4.39E-10 5.95E-10
Ps90%/90% (+KTL) Un-Biased 2.13E-09 2.51E-10 5.36E-10 8.29E-10 1.57E-09 1.49E-09 1.44E-09 1.14E-09
Ps90%/90% (-KTL) Un-Biased -2.73E-09 -1.92E-09 -1.86E-09 -1.52E-09 -1.78E-09 -9.45E-10 -9.61E-10 -2.12E-09
Specification MIN -5.00E-08 -5.00E-08 -5.00E-08 -5.00E-08 -5.00E-08 -5.00E-08 -5.00E-08 -5.00E-08
Status PASS PASS PASS PASS PASS PASS PASS PASS
Specification MAX 5.00E-08 5.00E-08 5.00E-08 5.00E-08 5.00E-08 5.00E-08 5.00E-08 5.00E-08
Status PASS PASS PASS PASS PASS PASS PASS PASS
Total Dose (krad(Si))
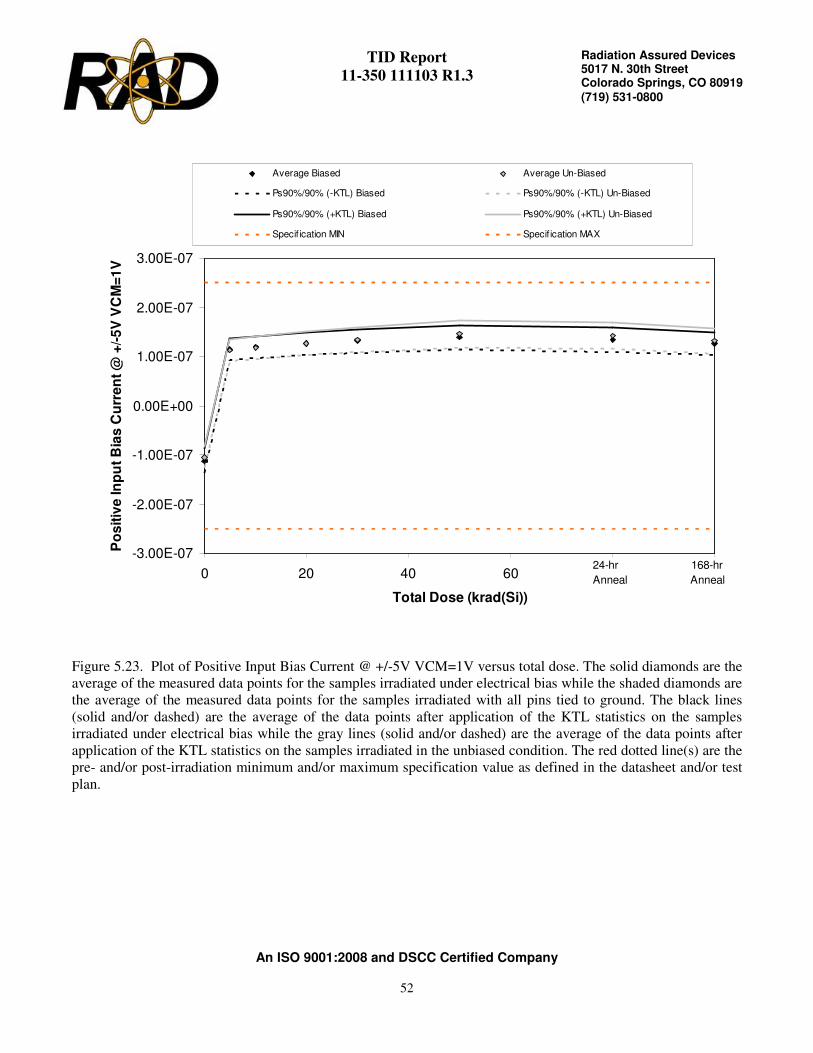
TID Report
11-350 111103 R1.3
An ISO 9001:2008 and DSCC Certified Company
52
Radiation Assured Devices 5017 N. 30th Street Colorado Springs, CO 80919 (719) 531-0800
-3.00E-07
-2.00E-07
-1.00E-07
0.00E+00
1.00E-07
2.00E-07
3.00E-07
0 20 40 60 80 100
Total Dose (krad(Si))
Po
sit
ive
In
pu
t B
ias
Cu
rre
nt
@ +
/-5
V V
CM
=1
V
Average Biased Average Un-Biased
Ps90%/90% (-KTL) Biased Ps90%/90% (-KTL) Un-Biased
Ps90%/90% (+KTL) Biased Ps90%/90% (+KTL) Un-Biased
Specif ication MIN Specif ication MAX
24-hr 168-hr
Anneal Anneal
Figure 5.23. Plot of Positive Input Bias Current @ +/-5V VCM=1V versus total dose. The solid diamonds are the
average of the measured data points for the samples irradiated under electrical bias while the shaded diamonds are
the average of the measured data points for the samples irradiated with all pins tied to ground. The black lines
(solid and/or dashed) are the average of the data points after application of the KTL statistics on the samples
irradiated under electrical bias while the gray lines (solid and/or dashed) are the average of the data points after
application of the KTL statistics on the samples irradiated in the unbiased condition. The red dotted line(s) are the
pre- and/or post-irradiation minimum and/or maximum specification value as defined in the datasheet and/or test
plan.

TID Report
11-350 111103 R1.3
An ISO 9001:2008 and DSCC Certified Company
53
Radiation Assured Devices 5017 N. 30th Street Colorado Springs, CO 80919 (719) 531-0800
Table 5.23. Raw data for Positive Input Bias Current @ +/-5V VCM=1V versus total dose, including the
statistical analysis, specification and the status of the testing (pass/fail).
Positive Input Bias Current @ +/-5V VCM=1V
24-hr
Anneal
168-hr
Anneal
Device 0 5 10 20 30 50 80 100
347 -1.29E-07 1.29E-07 1.34E-07 1.41E-07 1.46E-07 1.55E-07 1.49E-07 1.41E-07
352 -1.12E-07 1.13E-07 1.17E-07 1.24E-07 1.29E-07 1.37E-07 1.31E-07 1.25E-07
353 -1.08E-07 1.11E-07 1.15E-07 1.22E-07 1.27E-07 1.35E-07 1.30E-07 1.21E-07
355 -1.09E-07 1.11E-07 1.15E-07 1.22E-07 1.27E-07 1.34E-07 1.29E-07 1.23E-07
357 -1.08E-07 1.11E-07 1.15E-07 1.22E-07 1.26E-07 1.34E-07 1.28E-07 1.21E-07
359 -1.09E-07 1.16E-07 1.22E-07 1.32E-07 1.39E-07 1.51E-07 1.47E-07 1.36E-07
361 -9.19E-08 9.92E-08 1.04E-07 1.12E-07 1.19E-07 1.29E-07 1.26E-07 1.15E-07
368 -1.11E-07 1.18E-07 1.24E-07 1.33E-07 1.40E-07 1.52E-07 1.49E-07 1.37E-07
372 -1.03E-07 1.10E-07 1.16E-07 1.24E-07 1.31E-07 1.43E-07 1.40E-07 1.29E-07
378 -1.11E-07 1.18E-07 1.24E-07 1.33E-07 1.41E-07 1.53E-07 1.49E-07 1.37E-07
410 -1.06E-07 1.07E-07 1.07E-07 1.07E-07 1.07E-07 1.07E-07 1.07E-07 1.07E-07
413 -1.13E-07 1.14E-07 1.13E-07 1.13E-07 1.14E-07 1.13E-07 1.14E-07 1.14E-07
Biased Statistics
Average Biased -1.13E-07 1.15E-07 1.19E-07 1.26E-07 1.31E-07 1.39E-07 1.33E-07 1.26E-07
Std Dev Biased 8.98E-09 7.92E-09 8.09E-09 8.39E-09 8.50E-09 8.99E-09 8.89E-09 8.60E-09
Ps90%/90% (+KTL) Biased -8.85E-08 1.37E-07 1.42E-07 1.49E-07 1.54E-07 1.64E-07 1.58E-07 1.50E-07
Ps90%/90% (-KTL) Biased -1.38E-07 9.33E-08 9.71E-08 1.03E-07 1.08E-07 1.14E-07 1.09E-07 1.03E-07
Un-Biased Statistics
Average Un-Biased -1.05E-07 1.12E-07 1.18E-07 1.27E-07 1.34E-07 1.46E-07 1.42E-07 1.31E-07
Std Dev Un-Biased 8.03E-09 8.00E-09 8.45E-09 8.73E-09 9.06E-09 9.95E-09 9.86E-09 9.37E-09
Ps90%/90% (+KTL) Un-Biased -8.31E-08 1.34E-07 1.41E-07 1.51E-07 1.59E-07 1.73E-07 1.69E-07 1.57E-07
Ps90%/90% (-KTL) Un-Biased -1.27E-07 9.03E-08 9.47E-08 1.03E-07 1.09E-07 1.19E-07 1.15E-07 1.05E-07
Specification MIN -2.50E-07 -2.50E-07 -2.50E-07 -2.50E-07 -2.50E-07 -2.50E-07 -2.50E-07 -2.50E-07
Status PASS PASS PASS PASS PASS PASS PASS PASS
Specification MAX 2.50E-07 2.50E-07 2.50E-07 2.50E-07 2.50E-07 2.50E-07 2.50E-07 2.50E-07
Status PASS PASS PASS PASS PASS PASS PASS PASS
Total Dose (krad(Si))

TID Report
11-350 111103 R1.3
An ISO 9001:2008 and DSCC Certified Company
54
Radiation Assured Devices 5017 N. 30th Street Colorado Springs, CO 80919 (719) 531-0800
-3.00E-07
-2.00E-07
-1.00E-07
0.00E+00
1.00E-07
2.00E-07
3.00E-07
0 20 40 60 80 100
Total Dose (krad(Si))
Ne
ga
tiv
e In
pu
t B
ias
Cu
rre
nt
@ +
/-5
V V
CM
=1
V
Average Biased Average Un-Biased
Ps90%/90% (-KTL) Biased Ps90%/90% (-KTL) Un-Biased
Ps90%/90% (+KTL) Biased Ps90%/90% (+KTL) Un-Biased
Specif ication MIN Specif ication MAX
24-hr 168-hr
Anneal Anneal
Figure 5.24. Plot of Negative Input Bias Current @ +/-5V VCM=1V versus total dose. The solid diamonds are
the average of the measured data points for the samples irradiated under electrical bias while the shaded diamonds
are the average of the measured data points for the samples irradiated with all pins tied to ground. The black lines
(solid and/or dashed) are the average of the data points after application of the KTL statistics on the samples
irradiated under electrical bias while the gray lines (solid and/or dashed) are the average of the data points after
application of the KTL statistics on the samples irradiated in the unbiased condition. The red dotted line(s) are the
pre- and/or post-irradiation minimum and/or maximum specification value as defined in the datasheet and/or test
plan.
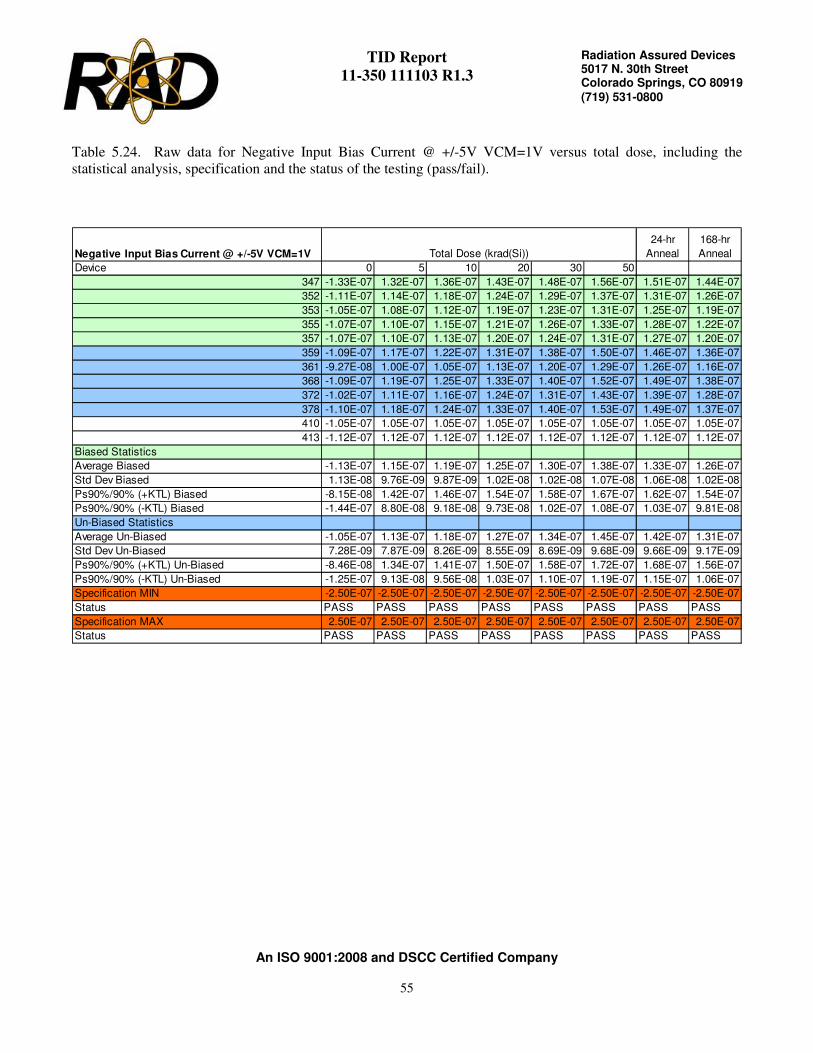
TID Report
11-350 111103 R1.3
An ISO 9001:2008 and DSCC Certified Company
55
Radiation Assured Devices 5017 N. 30th Street Colorado Springs, CO 80919 (719) 531-0800
Table 5.24. Raw data for Negative Input Bias Current @ +/-5V VCM=1V versus total dose, including the
statistical analysis, specification and the status of the testing (pass/fail).
Negative Input Bias Current @ +/-5V VCM=1V
24-hr
Anneal
168-hr
Anneal
Device 0 5 10 20 30 50 80 100
347 -1.33E-07 1.32E-07 1.36E-07 1.43E-07 1.48E-07 1.56E-07 1.51E-07 1.44E-07
352 -1.11E-07 1.14E-07 1.18E-07 1.24E-07 1.29E-07 1.37E-07 1.31E-07 1.26E-07
353 -1.05E-07 1.08E-07 1.12E-07 1.19E-07 1.23E-07 1.31E-07 1.25E-07 1.19E-07
355 -1.07E-07 1.10E-07 1.15E-07 1.21E-07 1.26E-07 1.33E-07 1.28E-07 1.22E-07
357 -1.07E-07 1.10E-07 1.13E-07 1.20E-07 1.24E-07 1.31E-07 1.27E-07 1.20E-07
359 -1.09E-07 1.17E-07 1.22E-07 1.31E-07 1.38E-07 1.50E-07 1.46E-07 1.36E-07
361 -9.27E-08 1.00E-07 1.05E-07 1.13E-07 1.20E-07 1.29E-07 1.26E-07 1.16E-07
368 -1.09E-07 1.19E-07 1.25E-07 1.33E-07 1.40E-07 1.52E-07 1.49E-07 1.38E-07
372 -1.02E-07 1.11E-07 1.16E-07 1.24E-07 1.31E-07 1.43E-07 1.39E-07 1.28E-07
378 -1.10E-07 1.18E-07 1.24E-07 1.33E-07 1.40E-07 1.53E-07 1.49E-07 1.37E-07
410 -1.05E-07 1.05E-07 1.05E-07 1.05E-07 1.05E-07 1.05E-07 1.05E-07 1.05E-07
413 -1.12E-07 1.12E-07 1.12E-07 1.12E-07 1.12E-07 1.12E-07 1.12E-07 1.12E-07
Biased Statistics
Average Biased -1.13E-07 1.15E-07 1.19E-07 1.25E-07 1.30E-07 1.38E-07 1.33E-07 1.26E-07
Std Dev Biased 1.13E-08 9.76E-09 9.87E-09 1.02E-08 1.02E-08 1.07E-08 1.06E-08 1.02E-08
Ps90%/90% (+KTL) Biased -8.15E-08 1.42E-07 1.46E-07 1.54E-07 1.58E-07 1.67E-07 1.62E-07 1.54E-07
Ps90%/90% (-KTL) Biased -1.44E-07 8.80E-08 9.18E-08 9.73E-08 1.02E-07 1.08E-07 1.03E-07 9.81E-08
Un-Biased Statistics
Average Un-Biased -1.05E-07 1.13E-07 1.18E-07 1.27E-07 1.34E-07 1.45E-07 1.42E-07 1.31E-07
Std Dev Un-Biased 7.28E-09 7.87E-09 8.26E-09 8.55E-09 8.69E-09 9.68E-09 9.66E-09 9.17E-09
Ps90%/90% (+KTL) Un-Biased -8.46E-08 1.34E-07 1.41E-07 1.50E-07 1.58E-07 1.72E-07 1.68E-07 1.56E-07
Ps90%/90% (-KTL) Un-Biased -1.25E-07 9.13E-08 9.56E-08 1.03E-07 1.10E-07 1.19E-07 1.15E-07 1.06E-07
Specification MIN -2.50E-07 -2.50E-07 -2.50E-07 -2.50E-07 -2.50E-07 -2.50E-07 -2.50E-07 -2.50E-07
Status PASS PASS PASS PASS PASS PASS PASS PASS
Specification MAX 2.50E-07 2.50E-07 2.50E-07 2.50E-07 2.50E-07 2.50E-07 2.50E-07 2.50E-07
Status PASS PASS PASS PASS PASS PASS PASS PASS
Total Dose (krad(Si))

TID Report
11-350 111103 R1.3
An ISO 9001:2008 and DSCC Certified Company
56
Radiation Assured Devices 5017 N. 30th Street Colorado Springs, CO 80919 (719) 531-0800
-5.00E-03
-4.00E-03
-3.00E-03
-2.00E-03
-1.00E-03
0.00E+00
1.00E-03
2.00E-03
3.00E-03
4.00E-03
5.00E-03
0 20 40 60 80 100
Total Dose (krad(Si))
Inp
ut
Off
se
t V
olt
ag
e @
+/-
5V
VC
M=
-1V
Average Biased Average Un-Biased Ps90%/90% (-KTL) Biased
Ps90%/90% (-KTL) Un-Biased Ps90%/90% (+KTL) Biased Ps90%/90% (+KTL) Un-Biased
Specif ication MIN Specif ication MAX
24-hr 168-hr
Anneal Anneal
Figure 5.25. Plot of Input Offset Voltage @ +/-5V VCM=-1V versus total dose. The solid diamonds are the
average of the measured data points for the samples irradiated under electrical bias while the shaded diamonds are
the average of the measured data points for the samples irradiated with all pins tied to ground. The black lines
(solid and/or dashed) are the average of the data points after application of the KTL statistics on the samples
irradiated under electrical bias while the gray lines (solid and/or dashed) are the average of the data points after
application of the KTL statistics on the samples irradiated in the unbiased condition. The red dotted line(s) are the
pre- and/or post-irradiation minimum and/or maximum specification value as defined in the datasheet and/or test
plan.

TID Report
11-350 111103 R1.3
An ISO 9001:2008 and DSCC Certified Company
57
Radiation Assured Devices 5017 N. 30th Street Colorado Springs, CO 80919 (719) 531-0800
Table 5.25. Raw data for Input Offset Voltage @ +/-5V VCM=-1V versus total dose, including the statistical
analysis, specification and the status of the testing (pass/fail).
Input Offset Voltage @ +/-5V VCM=-1V
24-hr
Anneal
168-hr
Anneal
Device 0 5 10 20 30 50 80 100
347 7.20E-04 -3.67E-04 -2.77E-04 -1.21E-04 -1.60E-05 1.34E-04 1.09E-04 -1.29E-04
352 3.89E-04 -1.59E-04 -5.60E-05 6.10E-05 1.30E-04 1.98E-04 1.58E-04 1.90E-05
353 8.03E-04 -5.44E-04 -4.31E-04 -2.85E-04 -1.81E-04 -3.60E-05 -6.20E-05 -1.72E-04
355 -2.10E-05 2.64E-04 3.72E-04 5.16E-04 5.95E-04 7.23E-04 6.74E-04 3.87E-04
357 -6.21E-04 8.54E-04 9.67E-04 1.11E-03 1.21E-03 1.34E-03 1.31E-03 1.16E-03
359 -1.67E-03 1.79E-03 1.90E-03 2.04E-03 2.13E-03 2.28E-03 2.27E-03 2.10E-03
361 -8.52E-04 1.00E-03 1.11E-03 1.25E-03 1.34E-03 1.44E-03 1.47E-03 1.32E-03
368 3.28E-04 -2.20E-04 -1.22E-04 3.00E-06 9.60E-05 2.19E-04 2.33E-04 4.80E-05
372 2.31E-04 -9.30E-05 1.60E-05 1.59E-04 2.79E-04 4.29E-04 4.22E-04 2.46E-04
378 -2.35E-04 3.57E-04 4.64E-04 6.03E-04 7.05E-04 8.03E-04 8.03E-04 6.62E-04
410 -2.06E-04 2.41E-04 2.39E-04 2.35E-04 2.30E-04 2.37E-04 2.53E-04 2.41E-04
413 -1.26E-03 1.23E-03 1.24E-03 1.24E-03 1.24E-03 1.23E-03 1.22E-03 1.23E-03
Biased Statistics
Average Biased 2.54E-04 9.60E-06 1.15E-04 2.55E-04 3.47E-04 4.73E-04 4.38E-04 2.52E-04
Std Dev Biased 5.87E-04 5.60E-04 5.64E-04 5.62E-04 5.61E-04 5.64E-04 5.60E-04 5.51E-04
Ps90%/90% (+KTL) Biased 1.86E-03 1.55E-03 1.66E-03 1.79E-03 1.89E-03 2.02E-03 1.97E-03 1.76E-03
Ps90%/90% (-KTL) Biased -1.36E-03 -1.53E-03 -1.43E-03 -1.28E-03 -1.19E-03 -1.07E-03 -1.10E-03 -1.26E-03
Un-Biased Statistics
Average Un-Biased -4.40E-04 5.67E-04 6.73E-04 8.10E-04 9.10E-04 1.04E-03 1.04E-03 8.75E-04
Std Dev Un-Biased 8.31E-04 8.34E-04 8.38E-04 8.39E-04 8.34E-04 8.38E-04 8.36E-04 8.39E-04
Ps90%/90% (+KTL) Un-Biased 1.84E-03 2.85E-03 2.97E-03 3.11E-03 3.20E-03 3.33E-03 3.33E-03 3.17E-03
Ps90%/90% (-KTL) Un-Biased -2.72E-03 -1.72E-03 -1.62E-03 -1.49E-03 -1.38E-03 -1.26E-03 -1.25E-03 -1.43E-03
Specification MIN -4.00E-03 -4.00E-03 -4.00E-03 -4.00E-03 -4.00E-03 -4.00E-03 -4.00E-03 -4.00E-03
Status PASS PASS PASS PASS PASS PASS PASS PASS
Specification MAX 4.00E-03 4.00E-03 4.00E-03 4.00E-03 4.00E-03 4.00E-03 4.00E-03 4.00E-03
Status PASS PASS PASS PASS PASS PASS PASS PASS
Total Dose (krad(Si))
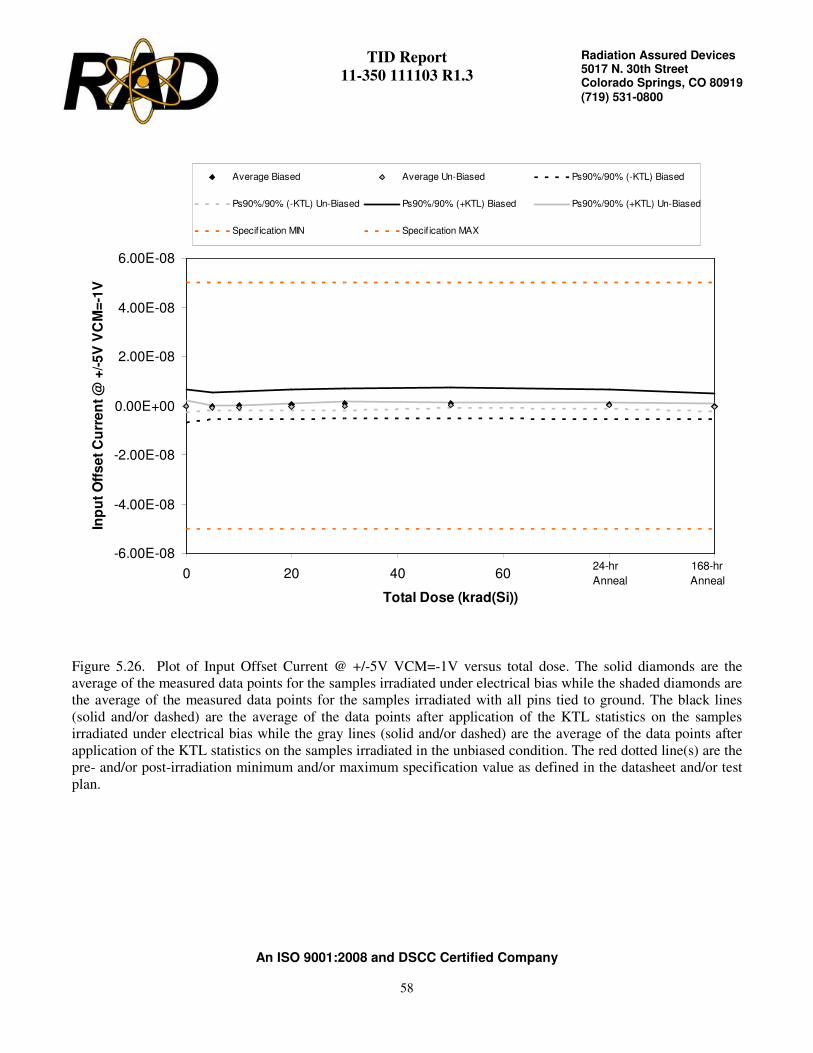
TID Report
11-350 111103 R1.3
An ISO 9001:2008 and DSCC Certified Company
58
Radiation Assured Devices 5017 N. 30th Street Colorado Springs, CO 80919 (719) 531-0800
-6.00E-08
-4.00E-08
-2.00E-08
0.00E+00
2.00E-08
4.00E-08
6.00E-08
0 20 40 60 80 100
Total Dose (krad(Si))
Inp
ut
Off
se
t C
urr
en
t @
+/-
5V
VC
M=
-1V
Average Biased Average Un-Biased Ps90%/90% (-KTL) Biased
Ps90%/90% (-KTL) Un-Biased Ps90%/90% (+KTL) Biased Ps90%/90% (+KTL) Un-Biased
Specif ication MIN Specif ication MAX
24-hr 168-hr
Anneal Anneal
Figure 5.26. Plot of Input Offset Current @ +/-5V VCM=-1V versus total dose. The solid diamonds are the
average of the measured data points for the samples irradiated under electrical bias while the shaded diamonds are
the average of the measured data points for the samples irradiated with all pins tied to ground. The black lines
(solid and/or dashed) are the average of the data points after application of the KTL statistics on the samples
irradiated under electrical bias while the gray lines (solid and/or dashed) are the average of the data points after
application of the KTL statistics on the samples irradiated in the unbiased condition. The red dotted line(s) are the
pre- and/or post-irradiation minimum and/or maximum specification value as defined in the datasheet and/or test
plan.

TID Report
11-350 111103 R1.3
An ISO 9001:2008 and DSCC Certified Company
59
Radiation Assured Devices 5017 N. 30th Street Colorado Springs, CO 80919 (719) 531-0800
Table 5.26. Raw data for Input Offset Current @ +/-5V VCM=-1V versus total dose, including the statistical
analysis, specification and the status of the testing (pass/fail).
Input Offset Current @ +/-5V VCM=-1V
24-hr
Anneal
168-hr
Anneal
Device 0 5 10 20 30 50 80 100
347 3.90E-09 -2.93E-09 -2.67E-09 -2.51E-09 -1.94E-09 -1.59E-09 -2.19E-09 -2.64E-09
352 -3.60E-10 -8.50E-10 -9.70E-10 -1.60E-10 -4.00E-11 -2.80E-10 -4.80E-10 -1.60E-09
353 -2.33E-09 2.38E-09 2.70E-09 3.28E-09 3.67E-09 4.19E-09 3.68E-09 2.28E-09
355 -1.26E-09 1.50E-10 3.10E-10 4.50E-10 6.30E-10 7.90E-10 5.90E-10 5.20E-10
357 -9.60E-10 1.01E-09 1.52E-09 1.68E-09 2.13E-09 2.12E-09 1.56E-09 5.10E-10
359 -5.80E-10 -6.00E-10 -4.90E-10 7.00E-11 4.50E-10 7.40E-10 7.00E-10 -3.00E-10
361 1.04E-09 -1.17E-09 -1.16E-09 -1.02E-09 -9.70E-10 -2.20E-10 -4.80E-10 -1.26E-09
368 -1.43E-09 -1.41E-09 -1.17E-09 -9.60E-10 -7.20E-10 3.40E-10 2.60E-10 -1.10E-09
372 -7.00E-11 -8.60E-10 -6.30E-10 -2.80E-10 -2.70E-10 1.80E-10 2.80E-10 2.00E-10
378 -3.00E-11 -5.30E-10 -3.60E-10 -2.90E-10 2.90E-10 3.00E-11 -9.00E-11 -4.90E-10
410 -1.46E-09 1.41E-09 1.39E-09 1.47E-09 1.40E-09 1.47E-09 1.36E-09 1.51E-09
413 -1.14E-09 1.19E-09 1.19E-09 1.25E-09 1.15E-09 1.17E-09 1.14E-09 1.04E-09
Biased Statistics
Average Biased -2.02E-10 -4.80E-11 1.78E-10 5.48E-10 8.90E-10 1.05E-09 6.32E-10 -1.86E-10
Std Dev Biased 2.40E-09 2.00E-09 2.10E-09 2.16E-09 2.13E-09 2.23E-09 2.20E-09 1.94E-09
Ps90%/90% (+KTL) Biased 6.38E-09 5.44E-09 5.93E-09 6.46E-09 6.74E-09 7.15E-09 6.66E-09 5.14E-09
Ps90%/90% (-KTL) Biased -6.79E-09 -5.53E-09 -5.57E-09 -5.37E-09 -4.96E-09 -5.06E-09 -5.40E-09 -5.51E-09
Un-Biased Statistics
Average Un-Biased -2.14E-10 -9.14E-10 -7.62E-10 -4.96E-10 -2.44E-10 2.14E-10 1.34E-10 -5.90E-10
Std Dev Un-Biased 9.00E-10 3.74E-10 3.80E-10 4.74E-10 6.17E-10 3.59E-10 4.43E-10 5.97E-10
Ps90%/90% (+KTL) Un-Biased 2.25E-09 1.12E-10 2.80E-10 8.04E-10 1.45E-09 1.20E-09 1.35E-09 1.05E-09
Ps90%/90% (-KTL) Un-Biased -2.68E-09 -1.94E-09 -1.80E-09 -1.80E-09 -1.93E-09 -7.71E-10 -1.08E-09 -2.23E-09
Specification MIN -5.00E-08 -5.00E-08 -5.00E-08 -5.00E-08 -5.00E-08 -5.00E-08 -5.00E-08 -5.00E-08
Status PASS PASS PASS PASS PASS PASS PASS PASS
Specification MAX 5.00E-08 5.00E-08 5.00E-08 5.00E-08 5.00E-08 5.00E-08 5.00E-08 5.00E-08
Status PASS PASS PASS PASS PASS PASS PASS PASS
Total Dose (krad(Si))

TID Report
11-350 111103 R1.3
An ISO 9001:2008 and DSCC Certified Company
60
Radiation Assured Devices 5017 N. 30th Street Colorado Springs, CO 80919 (719) 531-0800
-3.00E-07
-2.00E-07
-1.00E-07
0.00E+00
1.00E-07
2.00E-07
3.00E-07
0 20 40 60 80 100
Total Dose (krad(Si))
Po
sit
ive
In
pu
t B
ias
Cu
rre
nt
@ +
/-5
V V
CM
=-1
V
Average Biased Average Un-Biased
Ps90%/90% (-KTL) Biased Ps90%/90% (-KTL) Un-Biased
Ps90%/90% (+KTL) Biased Ps90%/90% (+KTL) Un-Biased
Specif ication MIN Specif ication MAX
24-hr 168-hr
Anneal Anneal
Figure 5.27. Plot of Positive Input Bias Current @ +/-5V VCM=-1V versus total dose. The solid diamonds are
the average of the measured data points for the samples irradiated under electrical bias while the shaded diamonds
are the average of the measured data points for the samples irradiated with all pins tied to ground. The black lines
(solid and/or dashed) are the average of the data points after application of the KTL statistics on the samples
irradiated under electrical bias while the gray lines (solid and/or dashed) are the average of the data points after
application of the KTL statistics on the samples irradiated in the unbiased condition. The red dotted line(s) are the
pre- and/or post-irradiation minimum and/or maximum specification value as defined in the datasheet and/or test
plan.

TID Report
11-350 111103 R1.3
An ISO 9001:2008 and DSCC Certified Company
61
Radiation Assured Devices 5017 N. 30th Street Colorado Springs, CO 80919 (719) 531-0800
Table 5.27. Raw data for Positive Input Bias Current @ +/-5V VCM=-1V versus total dose, including the
statistical analysis, specification and the status of the testing (pass/fail).
Positive Input Bias Current @ +/-5V VCM=-1V
24-hr
Anneal
168-hr
Anneal
Device 0 5 10 20 30 50 80 100
347 -1.29E-07 1.29E-07 1.33E-07 1.41E-07 1.46E-07 1.54E-07 1.49E-07 1.41E-07
352 -1.11E-07 1.13E-07 1.17E-07 1.24E-07 1.28E-07 1.36E-07 1.30E-07 1.24E-07
353 -1.07E-07 1.10E-07 1.14E-07 1.21E-07 1.26E-07 1.34E-07 1.28E-07 1.20E-07
355 -1.08E-07 1.10E-07 1.14E-07 1.21E-07 1.26E-07 1.33E-07 1.28E-07 1.22E-07
357 -1.07E-07 1.10E-07 1.14E-07 1.20E-07 1.25E-07 1.32E-07 1.27E-07 1.20E-07
359 -1.09E-07 1.16E-07 1.21E-07 1.31E-07 1.38E-07 1.50E-07 1.46E-07 1.35E-07
361 -9.04E-08 9.75E-08 1.02E-07 1.10E-07 1.17E-07 1.27E-07 1.24E-07 1.14E-07
368 -1.10E-07 1.17E-07 1.23E-07 1.32E-07 1.39E-07 1.51E-07 1.48E-07 1.36E-07
372 -1.02E-07 1.09E-07 1.14E-07 1.23E-07 1.30E-07 1.42E-07 1.38E-07 1.28E-07
378 -1.10E-07 1.17E-07 1.23E-07 1.32E-07 1.40E-07 1.52E-07 1.49E-07 1.36E-07
410 -1.05E-07 1.06E-07 1.06E-07 1.06E-07 1.06E-07 1.06E-07 1.06E-07 1.06E-07
413 -1.12E-07 1.13E-07 1.13E-07 1.13E-07 1.13E-07 1.13E-07 1.13E-07 1.13E-07
Biased Statistics
Average Biased -1.12E-07 1.14E-07 1.19E-07 1.25E-07 1.30E-07 1.38E-07 1.33E-07 1.25E-07
Std Dev Biased 9.17E-09 8.13E-09 8.30E-09 8.59E-09 8.67E-09 9.25E-09 9.11E-09 8.87E-09
Ps90%/90% (+KTL) Biased -8.72E-08 1.37E-07 1.41E-07 1.49E-07 1.54E-07 1.63E-07 1.58E-07 1.50E-07
Ps90%/90% (-KTL) Biased -1.38E-07 9.20E-08 9.57E-08 1.02E-07 1.06E-07 1.13E-07 1.08E-07 1.01E-07
Un-Biased Statistics
Average Un-Biased -1.04E-07 1.11E-07 1.17E-07 1.25E-07 1.33E-07 1.44E-07 1.41E-07 1.30E-07
Std Dev Un-Biased 8.38E-09 8.37E-09 8.83E-09 9.21E-09 9.57E-09 1.04E-08 1.04E-08 9.78E-09
Ps90%/90% (+KTL) Un-Biased -8.11E-08 1.34E-07 1.41E-07 1.51E-07 1.59E-07 1.73E-07 1.69E-07 1.57E-07
Ps90%/90% (-KTL) Un-Biased -1.27E-07 8.83E-08 9.25E-08 1.00E-07 1.06E-07 1.16E-07 1.13E-07 1.03E-07
Specification MIN -2.50E-07 -2.50E-07 -2.50E-07 -2.50E-07 -2.50E-07 -2.50E-07 -2.50E-07 -2.50E-07
Status PASS PASS PASS PASS PASS PASS PASS PASS
Specification MAX 2.50E-07 2.50E-07 2.50E-07 2.50E-07 2.50E-07 2.50E-07 2.50E-07 2.50E-07
Status PASS PASS PASS PASS PASS PASS PASS PASS
Total Dose (krad(Si))

TID Report
11-350 111103 R1.3
An ISO 9001:2008 and DSCC Certified Company
62
Radiation Assured Devices 5017 N. 30th Street Colorado Springs, CO 80919 (719) 531-0800
-3.00E-07
-2.00E-07
-1.00E-07
0.00E+00
1.00E-07
2.00E-07
3.00E-07
0 20 40 60 80 100
Total Dose (krad(Si))
Ne
ga
tiv
e In
pu
t B
ias
Cu
rre
nt
@ +
/-5
V V
CM
=-1
V
Average Biased Average Un-Biased
Ps90%/90% (-KTL) Biased Ps90%/90% (-KTL) Un-Biased
Ps90%/90% (+KTL) Biased Ps90%/90% (+KTL) Un-Biased
Specif ication MIN Specif ication MAX
24-hr 168-hr
Anneal Anneal
Figure 5.28. Plot of Negative Input Bias Current @ +/-5V VCM=-1V versus total dose. The solid diamonds are
the average of the measured data points for the samples irradiated under electrical bias while the shaded diamonds
are the average of the measured data points for the samples irradiated with all pins tied to ground. The black lines
(solid and/or dashed) are the average of the data points after application of the KTL statistics on the samples
irradiated under electrical bias while the gray lines (solid and/or dashed) are the average of the data points after
application of the KTL statistics on the samples irradiated in the unbiased condition. The red dotted line(s) are the
pre- and/or post-irradiation minimum and/or maximum specification value as defined in the datasheet and/or test
plan.

TID Report
11-350 111103 R1.3
An ISO 9001:2008 and DSCC Certified Company
63
Radiation Assured Devices 5017 N. 30th Street Colorado Springs, CO 80919 (719) 531-0800
Table 5.28. Raw data for Negative Input Bias Current @ +/-5V VCM=-1V versus total dose, including the
statistical analysis, specification and the status of the testing (pass/fail).
Negative Input Bias Current @ +/-5V VCM=-1V
24-hr
Anneal
168-hr
Anneal
Device 0 5 10 20 30 50 80 100
347 -1.32E-07 1.31E-07 1.36E-07 1.43E-07 1.47E-07 1.56E-07 1.50E-07 1.43E-07
352 -1.10E-07 1.13E-07 1.17E-07 1.23E-07 1.28E-07 1.36E-07 1.30E-07 1.25E-07
353 -1.05E-07 1.07E-07 1.11E-07 1.18E-07 1.22E-07 1.29E-07 1.24E-07 1.18E-07
355 -1.06E-07 1.10E-07 1.14E-07 1.20E-07 1.25E-07 1.32E-07 1.27E-07 1.21E-07
357 -1.06E-07 1.09E-07 1.12E-07 1.18E-07 1.23E-07 1.30E-07 1.25E-07 1.19E-07
359 -1.08E-07 1.16E-07 1.21E-07 1.30E-07 1.37E-07 1.49E-07 1.45E-07 1.35E-07
361 -9.12E-08 9.85E-08 1.03E-07 1.11E-07 1.18E-07 1.27E-07 1.24E-07 1.14E-07
368 -1.08E-07 1.18E-07 1.24E-07 1.32E-07 1.39E-07 1.51E-07 1.47E-07 1.37E-07
372 -1.01E-07 1.10E-07 1.15E-07 1.23E-07 1.30E-07 1.41E-07 1.38E-07 1.27E-07
378 -1.10E-07 1.17E-07 1.23E-07 1.32E-07 1.39E-07 1.52E-07 1.48E-07 1.37E-07
410 -1.04E-07 1.04E-07 1.04E-07 1.04E-07 1.04E-07 1.04E-07 1.05E-07 1.04E-07
413 -1.11E-07 1.12E-07 1.11E-07 1.11E-07 1.11E-07 1.11E-07 1.12E-07 1.12E-07
Biased Statistics
Average Biased -1.12E-07 1.14E-07 1.18E-07 1.25E-07 1.29E-07 1.37E-07 1.32E-07 1.25E-07
Std Dev Biased 1.15E-08 9.90E-09 1.00E-08 1.04E-08 1.05E-08 1.09E-08 1.08E-08 1.04E-08
Ps90%/90% (+KTL) Biased -8.02E-08 1.41E-07 1.46E-07 1.53E-07 1.58E-07 1.67E-07 1.61E-07 1.54E-07
Ps90%/90% (-KTL) Biased -1.43E-07 8.68E-08 9.06E-08 9.59E-08 1.00E-07 1.07E-07 1.02E-07 9.67E-08
Un-Biased Statistics
Average Un-Biased -1.04E-07 1.12E-07 1.17E-07 1.26E-07 1.32E-07 1.44E-07 1.41E-07 1.30E-07
Std Dev Un-Biased 7.61E-09 8.18E-09 8.64E-09 8.96E-09 9.13E-09 1.02E-08 1.00E-08 9.58E-09
Ps90%/90% (+KTL) Un-Biased -8.28E-08 1.34E-07 1.41E-07 1.50E-07 1.57E-07 1.72E-07 1.68E-07 1.56E-07
Ps90%/90% (-KTL) Un-Biased -1.24E-07 8.95E-08 9.35E-08 1.01E-07 1.07E-07 1.16E-07 1.13E-07 1.04E-07
Specification MIN -2.50E-07 -2.50E-07 -2.50E-07 -2.50E-07 -2.50E-07 -2.50E-07 -2.50E-07 -2.50E-07
Status PASS PASS PASS PASS PASS PASS PASS PASS
Specification MAX 2.50E-07 2.50E-07 2.50E-07 2.50E-07 2.50E-07 2.50E-07 2.50E-07 2.50E-07
Status PASS PASS PASS PASS PASS PASS PASS PASS
Total Dose (krad(Si))

TID Report
11-350 111103 R1.3
An ISO 9001:2008 and DSCC Certified Company
64
Radiation Assured Devices 5017 N. 30th Street Colorado Springs, CO 80919 (719) 531-0800
0.00E+00
2.00E+01
4.00E+01
6.00E+01
8.00E+01
1.00E+02
1.20E+02
1.40E+02
0 20 40 60 80 100
Total Dose (krad(Si))
Co
mm
on
Mo
de
Re
jec
tio
n R
ati
o @
+/-
20
V V
CM
=+
/-1
6.5
V
Average Biased Average Un-Biased Ps90%/90% (-KTL) Biased
Ps90%/90% (-KTL) Un-Biased Specif ication MIN
24-hr 168-hr
Anneal Anneal
Figure 5.29. Plot of CMRR @ +/-20V VCM=+/-16.5V versus total dose. The solid diamonds are the average of
the measured data points for the samples irradiated under electrical bias while the shaded diamonds are the
average of the measured data points for the samples irradiated with all pins tied to ground. The black lines (solid
and/or dashed) are the average of the data points after application of the KTL statistics on the samples irradiated
under electrical bias while the gray lines (solid and/or dashed) are the average of the data points after application
of the KTL statistics on the samples irradiated in the unbiased condition. The red dotted line(s) are the pre- and/or
post-irradiation minimum and/or maximum specification value as defined in the datasheet and/or test plan.
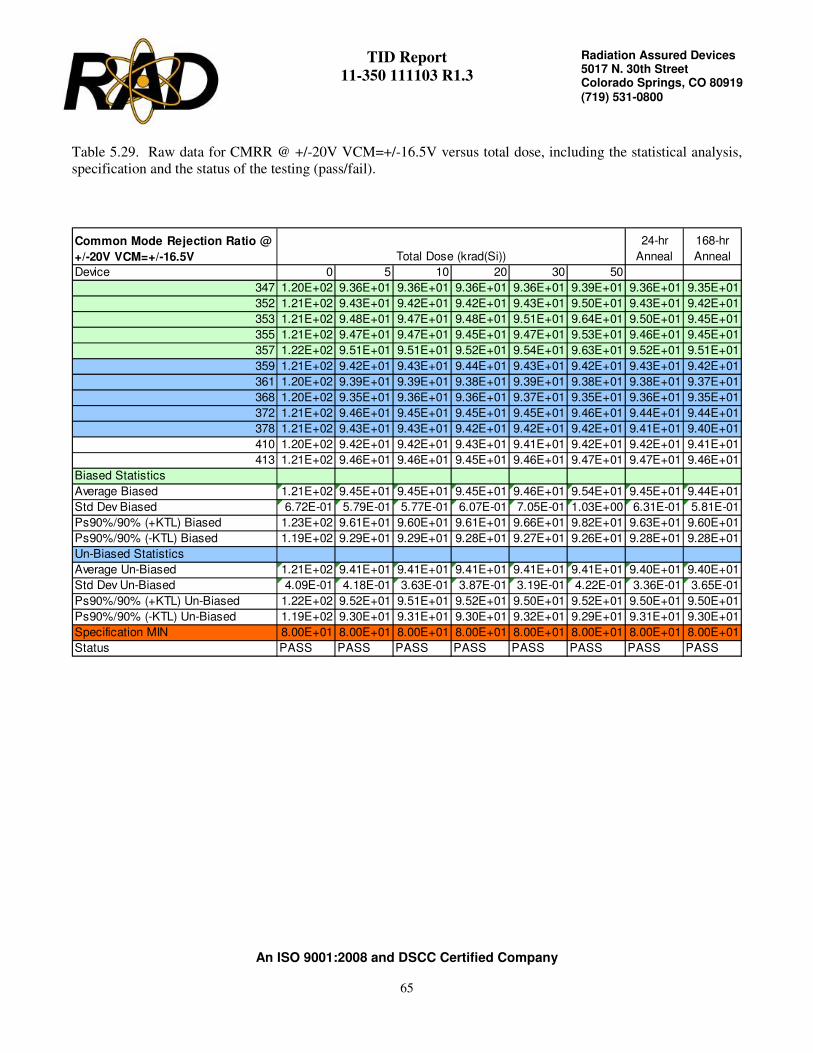
TID Report
11-350 111103 R1.3
An ISO 9001:2008 and DSCC Certified Company
65
Radiation Assured Devices 5017 N. 30th Street Colorado Springs, CO 80919 (719) 531-0800
Table 5.29. Raw data for CMRR @ +/-20V VCM=+/-16.5V versus total dose, including the statistical analysis,
specification and the status of the testing (pass/fail).
Common Mode Rejection Ratio @
+/-20V VCM=+/-16.5V
24-hr
Anneal
168-hr
Anneal
Device 0 5 10 20 30 50 80 100
347 1.20E+02 9.36E+01 9.36E+01 9.36E+01 9.36E+01 9.39E+01 9.36E+01 9.35E+01
352 1.21E+02 9.43E+01 9.42E+01 9.42E+01 9.43E+01 9.50E+01 9.43E+01 9.42E+01
353 1.21E+02 9.48E+01 9.47E+01 9.48E+01 9.51E+01 9.64E+01 9.50E+01 9.45E+01
355 1.21E+02 9.47E+01 9.47E+01 9.45E+01 9.47E+01 9.53E+01 9.46E+01 9.45E+01
357 1.22E+02 9.51E+01 9.51E+01 9.52E+01 9.54E+01 9.63E+01 9.52E+01 9.51E+01
359 1.21E+02 9.42E+01 9.43E+01 9.44E+01 9.43E+01 9.42E+01 9.43E+01 9.42E+01
361 1.20E+02 9.39E+01 9.39E+01 9.38E+01 9.39E+01 9.38E+01 9.38E+01 9.37E+01
368 1.20E+02 9.35E+01 9.36E+01 9.36E+01 9.37E+01 9.35E+01 9.36E+01 9.35E+01
372 1.21E+02 9.46E+01 9.45E+01 9.45E+01 9.45E+01 9.46E+01 9.44E+01 9.44E+01
378 1.21E+02 9.43E+01 9.43E+01 9.42E+01 9.42E+01 9.42E+01 9.41E+01 9.40E+01
410 1.20E+02 9.42E+01 9.42E+01 9.43E+01 9.41E+01 9.42E+01 9.42E+01 9.41E+01
413 1.21E+02 9.46E+01 9.46E+01 9.45E+01 9.46E+01 9.47E+01 9.47E+01 9.46E+01
Biased Statistics
Average Biased 1.21E+02 9.45E+01 9.45E+01 9.45E+01 9.46E+01 9.54E+01 9.45E+01 9.44E+01
Std Dev Biased 6.72E-01 5.79E-01 5.77E-01 6.07E-01 7.05E-01 1.03E+00 6.31E-01 5.81E-01
Ps90%/90% (+KTL) Biased 1.23E+02 9.61E+01 9.60E+01 9.61E+01 9.66E+01 9.82E+01 9.63E+01 9.60E+01
Ps90%/90% (-KTL) Biased 1.19E+02 9.29E+01 9.29E+01 9.28E+01 9.27E+01 9.26E+01 9.28E+01 9.28E+01
Un-Biased Statistics
Average Un-Biased 1.21E+02 9.41E+01 9.41E+01 9.41E+01 9.41E+01 9.41E+01 9.40E+01 9.40E+01
Std Dev Un-Biased 4.09E-01 4.18E-01 3.63E-01 3.87E-01 3.19E-01 4.22E-01 3.36E-01 3.65E-01
Ps90%/90% (+KTL) Un-Biased 1.22E+02 9.52E+01 9.51E+01 9.52E+01 9.50E+01 9.52E+01 9.50E+01 9.50E+01
Ps90%/90% (-KTL) Un-Biased 1.19E+02 9.30E+01 9.31E+01 9.30E+01 9.32E+01 9.29E+01 9.31E+01 9.30E+01
Specification MIN 8.00E+01 8.00E+01 8.00E+01 8.00E+01 8.00E+01 8.00E+01 8.00E+01 8.00E+01
Status PASS PASS PASS PASS PASS PASS PASS PASS
Total Dose (krad(Si))

TID Report
11-350 111103 R1.3
An ISO 9001:2008 and DSCC Certified Company
66
Radiation Assured Devices 5017 N. 30th Street Colorado Springs, CO 80919 (719) 531-0800
0.00E+00
2.00E+01
4.00E+01
6.00E+01
8.00E+01
1.00E+02
1.20E+02
0 20 40 60 80 100
Total Dose (krad(Si))
Po
we
r S
up
ply
Re
jec
tio
n R
ati
o @
V+
/-=
+/-
5V
TO
+/-
20
V
Average Biased Average Un-Biased Ps90%/90% (-KTL) Biased
Ps90%/90% (-KTL) Un-Biased Specif ication MIN
24-hr 168-hr
Anneal Anneal
Figure 5.30. Plot of PSRR @ V+/-=+/-5V TO +/-20V versus total dose. The solid diamonds are the average of
the measured data points for the samples irradiated under electrical bias while the shaded diamonds are the
average of the measured data points for the samples irradiated with all pins tied to ground. The black lines (solid
and/or dashed) are the average of the data points after application of the KTL statistics on the samples irradiated
under electrical bias while the gray lines (solid and/or dashed) are the average of the data points after application
of the KTL statistics on the samples irradiated in the unbiased condition. The red dotted line(s) are the pre- and/or
post-irradiation minimum and/or maximum specification value as defined in the datasheet and/or test plan.

TID Report
11-350 111103 R1.3
An ISO 9001:2008 and DSCC Certified Company
67
Radiation Assured Devices 5017 N. 30th Street Colorado Springs, CO 80919 (719) 531-0800
Table 5.30. Raw data for PSRR @ V+/-=+/-5V TO +/-20V versus total dose, including the statistical analysis,
specification and the status of the testing (pass/fail).
Power Supply Rejection Ratio @
V+/-=+/-5V TO +/-20V
24-hr
Anneal
168-hr
Anneal
Device 0 5 10 20 30 50 80 100
347 1.06E+02 1.05E+02 1.04E+02 1.04E+02 1.04E+02 1.03E+02 1.05E+02 1.05E+02
352 1.05E+02 1.05E+02 1.05E+02 1.04E+02 1.06E+02 9.02E+01 1.08E+02 1.05E+02
353 1.07E+02 1.07E+02 1.06E+02 1.06E+02 1.10E+02 8.02E+01 1.06E+02 1.06E+02
355 1.03E+02 1.03E+02 1.03E+02 1.03E+02 1.04E+02 9.01E+01 1.05E+02 1.03E+02
357 1.04E+02 1.03E+02 1.03E+02 1.03E+02 1.05E+02 8.71E+01 1.07E+02 1.03E+02
359 1.01E+02 1.01E+02 1.01E+02 1.01E+02 1.01E+02 1.00E+02 1.00E+02 1.01E+02
361 1.06E+02 1.06E+02 1.06E+02 1.05E+02 1.05E+02 1.05E+02 1.05E+02 1.05E+02
368 1.06E+02 1.07E+02 1.07E+02 1.07E+02 1.06E+02 1.06E+02 1.05E+02 1.07E+02
372 1.06E+02 1.06E+02 1.06E+02 1.05E+02 1.05E+02 1.05E+02 1.05E+02 1.06E+02
378 1.04E+02 1.05E+02 1.04E+02 1.04E+02 1.04E+02 1.04E+02 1.03E+02 1.04E+02
410 1.05E+02 1.06E+02 1.06E+02 1.05E+02 1.06E+02 1.06E+02 1.05E+02 1.06E+02
413 1.01E+02 1.01E+02 1.01E+02 1.00E+02 1.00E+02 1.00E+02 1.01E+02 1.01E+02
Biased Statistics
Average Biased 1.05E+02 1.04E+02 1.04E+02 1.04E+02 1.06E+02 9.01E+01 1.06E+02 1.04E+02
Std Dev Biased 1.43E+00 1.52E+00 1.27E+00 1.52E+00 2.35E+00 8.31E+00 1.29E+00 1.45E+00
Ps90%/90% (+KTL) Biased 1.09E+02 1.09E+02 1.08E+02 1.08E+02 1.12E+02 1.13E+02 1.10E+02 1.08E+02
Ps90%/90% (-KTL) Biased 1.01E+02 1.00E+02 1.01E+02 9.99E+01 9.94E+01 6.74E+01 1.03E+02 1.00E+02
Un-Biased Statistics
Average Un-Biased 1.05E+02 1.05E+02 1.05E+02 1.04E+02 1.04E+02 1.04E+02 1.04E+02 1.04E+02
Std Dev Un-Biased 2.17E+00 2.28E+00 2.23E+00 2.14E+00 1.99E+00 2.09E+00 2.04E+00 2.26E+00
Ps90%/90% (+KTL) Un-Biased 1.11E+02 1.11E+02 1.11E+02 1.10E+02 1.10E+02 1.10E+02 1.09E+02 1.11E+02
Ps90%/90% (-KTL) Un-Biased 9.87E+01 9.88E+01 9.86E+01 9.85E+01 9.86E+01 9.82E+01 9.81E+01 9.83E+01
Specification MIN 7.00E+01 7.00E+01 7.00E+01 7.00E+01 7.00E+01 7.00E+01 7.00E+01 7.00E+01
Status PASS PASS PASS PASS PASS PASS PASS PASS
Total Dose (krad(Si))

TID Report
11-350 111103 R1.3
An ISO 9001:2008 and DSCC Certified Company
68
Radiation Assured Devices 5017 N. 30th Street Colorado Springs, CO 80919 (719) 531-0800
-1.40E+03
-1.20E+03
-1.00E+03
-8.00E+02
-6.00E+02
-4.00E+02
-2.00E+02
0.00E+00
2.00E+02
4.00E+02
6.00E+02
8.00E+02
0 20 40 60 80 100
Total Dose (krad(Si))
La
rge
Sig
na
l V
olt
ag
e G
ain
@ +
/-1
5V
VO
=+
/-1
0V
RL
=2
K
Average Biased Average Un-Biased Ps90%/90% (-KTL) Biased
Ps90%/90% (-KTL) Un-Biased Specif ication MIN
24-hr 168-hr
Anneal Anneal
Figure 5.31. Plot of Large Signal Voltage Gain @ +/-15V VO=+/-10V RL=2K versus total dose. The solid
diamonds are the average of the measured data points for the samples irradiated under electrical bias while the
shaded diamonds are the average of the measured data points for the samples irradiated with all pins tied to
ground. The black lines (solid and/or dashed) are the average of the data points after application of the KTL
statistics on the samples irradiated under electrical bias while the gray lines (solid and/or dashed) are the average
of the data points after application of the KTL statistics on the samples irradiated in the unbiased condition. The
red dotted line(s) are the pre- and/or post-irradiation minimum and/or maximum specification value as defined in
the datasheet and/or test plan.
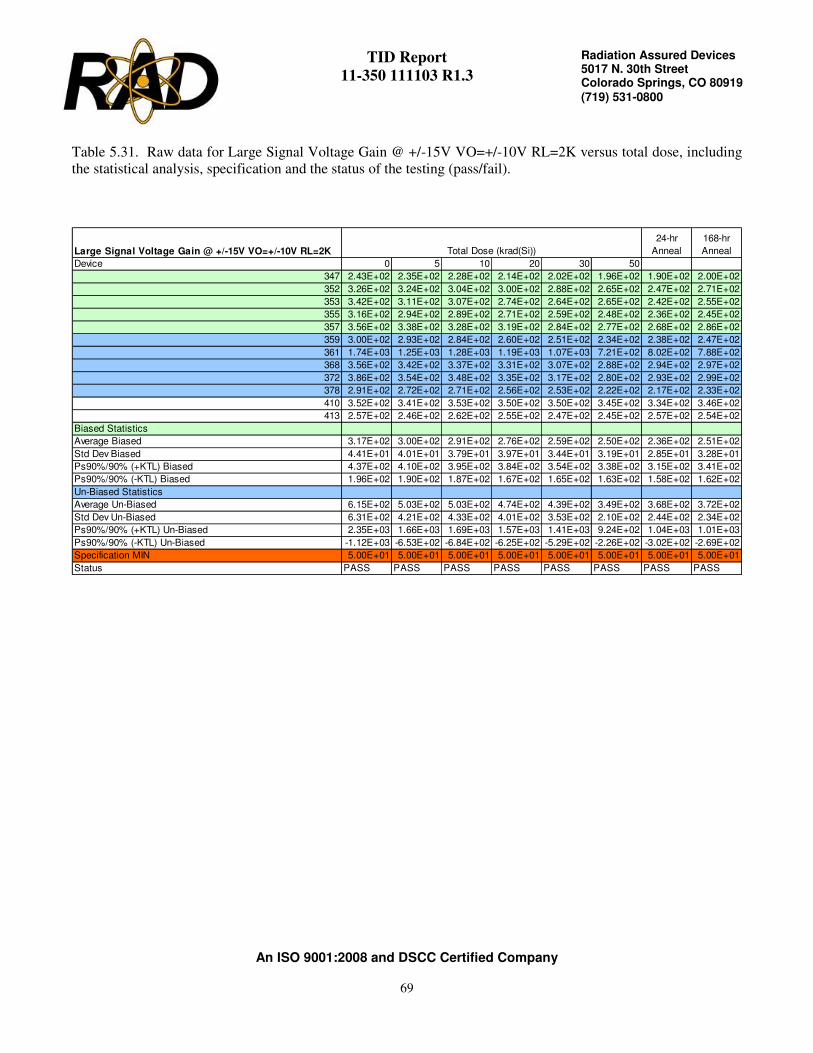
TID Report
11-350 111103 R1.3
An ISO 9001:2008 and DSCC Certified Company
69
Radiation Assured Devices 5017 N. 30th Street Colorado Springs, CO 80919 (719) 531-0800
Table 5.31. Raw data for Large Signal Voltage Gain @ +/-15V VO=+/-10V RL=2K versus total dose, including
the statistical analysis, specification and the status of the testing (pass/fail).
Large Signal Voltage Gain @ +/-15V VO=+/-10V RL=2K
24-hr
Anneal
168-hr
Anneal
Device 0 5 10 20 30 50 80 100
347 2.43E+02 2.35E+02 2.28E+02 2.14E+02 2.02E+02 1.96E+02 1.90E+02 2.00E+02
352 3.26E+02 3.24E+02 3.04E+02 3.00E+02 2.88E+02 2.65E+02 2.47E+02 2.71E+02
353 3.42E+02 3.11E+02 3.07E+02 2.74E+02 2.64E+02 2.65E+02 2.42E+02 2.55E+02
355 3.16E+02 2.94E+02 2.89E+02 2.71E+02 2.59E+02 2.48E+02 2.36E+02 2.45E+02
357 3.56E+02 3.38E+02 3.28E+02 3.19E+02 2.84E+02 2.77E+02 2.68E+02 2.86E+02
359 3.00E+02 2.93E+02 2.84E+02 2.60E+02 2.51E+02 2.34E+02 2.38E+02 2.47E+02
361 1.74E+03 1.25E+03 1.28E+03 1.19E+03 1.07E+03 7.21E+02 8.02E+02 7.88E+02
368 3.56E+02 3.42E+02 3.37E+02 3.31E+02 3.07E+02 2.88E+02 2.94E+02 2.97E+02
372 3.86E+02 3.54E+02 3.48E+02 3.35E+02 3.17E+02 2.80E+02 2.93E+02 2.99E+02
378 2.91E+02 2.72E+02 2.71E+02 2.56E+02 2.53E+02 2.22E+02 2.17E+02 2.33E+02
410 3.52E+02 3.41E+02 3.53E+02 3.50E+02 3.50E+02 3.45E+02 3.34E+02 3.46E+02
413 2.57E+02 2.46E+02 2.62E+02 2.55E+02 2.47E+02 2.45E+02 2.57E+02 2.54E+02
Biased Statistics
Average Biased 3.17E+02 3.00E+02 2.91E+02 2.76E+02 2.59E+02 2.50E+02 2.36E+02 2.51E+02
Std Dev Biased 4.41E+01 4.01E+01 3.79E+01 3.97E+01 3.44E+01 3.19E+01 2.85E+01 3.28E+01
Ps90%/90% (+KTL) Biased 4.37E+02 4.10E+02 3.95E+02 3.84E+02 3.54E+02 3.38E+02 3.15E+02 3.41E+02
Ps90%/90% (-KTL) Biased 1.96E+02 1.90E+02 1.87E+02 1.67E+02 1.65E+02 1.63E+02 1.58E+02 1.62E+02
Un-Biased Statistics
Average Un-Biased 6.15E+02 5.03E+02 5.03E+02 4.74E+02 4.39E+02 3.49E+02 3.68E+02 3.72E+02
Std Dev Un-Biased 6.31E+02 4.21E+02 4.33E+02 4.01E+02 3.53E+02 2.10E+02 2.44E+02 2.34E+02
Ps90%/90% (+KTL) Un-Biased 2.35E+03 1.66E+03 1.69E+03 1.57E+03 1.41E+03 9.24E+02 1.04E+03 1.01E+03
Ps90%/90% (-KTL) Un-Biased -1.12E+03 -6.53E+02 -6.84E+02 -6.25E+02 -5.29E+02 -2.26E+02 -3.02E+02 -2.69E+02
Specification MIN 5.00E+01 5.00E+01 5.00E+01 5.00E+01 5.00E+01 5.00E+01 5.00E+01 5.00E+01
Status PASS PASS PASS PASS PASS PASS PASS PASS
Total Dose (krad(Si))

TID Report
11-350 111103 R1.3
An ISO 9001:2008 and DSCC Certified Company
70
Radiation Assured Devices 5017 N. 30th Street Colorado Springs, CO 80919 (719) 531-0800
1.18E+01
1.20E+01
1.22E+01
1.24E+01
1.26E+01
1.28E+01
1.30E+01
1.32E+01
1.34E+01
1.36E+01
1.38E+01
0 20 40 60 80 100
Total Dose (krad(Si))
Po
sit
ive
Ou
tpu
t V
olt
ag
e S
win
g @
+/-
15
V R
L=
2K
(A
L)
Average Biased Average Un-Biased Ps90%/90% (-KTL) Biased
Ps90%/90% (-KTL) Un-Biased Specif ication MIN
24-hr 168-hr
Anneal Anneal
Figure 5.32. Plot of Positive Output Voltage Swing @ +/-15V RL=2K (AL) versus total dose. The solid
diamonds are the average of the measured data points for the samples irradiated under electrical bias while the
shaded diamonds are the average of the measured data points for the samples irradiated with all pins tied to
ground. The black lines (solid and/or dashed) are the average of the data points after application of the KTL
statistics on the samples irradiated under electrical bias while the gray lines (solid and/or dashed) are the average
of the data points after application of the KTL statistics on the samples irradiated in the unbiased condition. The
red dotted line(s) are the pre- and/or post-irradiation minimum and/or maximum specification value as defined in
the datasheet and/or test plan.

TID Report
11-350 111103 R1.3
An ISO 9001:2008 and DSCC Certified Company
71
Radiation Assured Devices 5017 N. 30th Street Colorado Springs, CO 80919 (719) 531-0800
Table 5.32. Raw data for Positive Output Voltage Swing @ +/-15V RL=2K (AL) versus total dose, including the
statistical analysis, specification and the status of the testing (pass/fail).
Positive Output Voltage Swing @ +/-15V RL=2K (AL)
24-hr
Anneal
168-hr
Anneal
Device 0 5 10 20 30 50 80 100
347 1.37E+01 1.37E+01 1.37E+01 1.37E+01 1.37E+01 1.37E+01 1.37E+01 1.37E+01
352 1.37E+01 1.37E+01 1.37E+01 1.37E+01 1.37E+01 1.37E+01 1.37E+01 1.37E+01
353 1.37E+01 1.37E+01 1.37E+01 1.37E+01 1.37E+01 1.37E+01 1.37E+01 1.37E+01
355 1.37E+01 1.37E+01 1.37E+01 1.37E+01 1.37E+01 1.37E+01 1.37E+01 1.37E+01
357 1.37E+01 1.37E+01 1.37E+01 1.37E+01 1.37E+01 1.37E+01 1.37E+01 1.37E+01
359 1.37E+01 1.37E+01 1.37E+01 1.37E+01 1.37E+01 1.37E+01 1.37E+01 1.37E+01
361 1.37E+01 1.37E+01 1.37E+01 1.37E+01 1.37E+01 1.37E+01 1.37E+01 1.37E+01
368 1.37E+01 1.37E+01 1.37E+01 1.37E+01 1.37E+01 1.37E+01 1.37E+01 1.37E+01
372 1.37E+01 1.37E+01 1.37E+01 1.37E+01 1.37E+01 1.37E+01 1.37E+01 1.37E+01
378 1.37E+01 1.37E+01 1.37E+01 1.37E+01 1.37E+01 1.37E+01 1.37E+01 1.37E+01
410 1.37E+01 1.37E+01 1.37E+01 1.37E+01 1.37E+01 1.37E+01 1.37E+01 1.37E+01
413 1.37E+01 1.37E+01 1.37E+01 1.37E+01 1.37E+01 1.37E+01 1.37E+01 1.37E+01
Biased Statistics
Average Biased 1.37E+01 1.37E+01 1.37E+01 1.37E+01 1.37E+01 1.37E+01 1.37E+01 1.37E+01
Std Dev Biased 7.80E-03 9.45E-03 9.50E-03 9.45E-03 9.50E-03 9.10E-03 7.82E-03 8.85E-03
Ps90%/90% (+KTL) Biased 1.37E+01 1.37E+01 1.37E+01 1.37E+01 1.37E+01 1.37E+01 1.37E+01 1.37E+01
Ps90%/90% (-KTL) Biased 1.37E+01 1.37E+01 1.37E+01 1.37E+01 1.37E+01 1.37E+01 1.37E+01 1.37E+01
Un-Biased Statistics
Average Un-Biased 1.37E+01 1.37E+01 1.37E+01 1.37E+01 1.37E+01 1.37E+01 1.37E+01 1.37E+01
Std Dev Un-Biased 5.27E-03 5.76E-03 6.00E-03 5.76E-03 6.00E-03 5.37E-03 6.16E-03 5.89E-03
Ps90%/90% (+KTL) Un-Biased 1.37E+01 1.37E+01 1.37E+01 1.37E+01 1.37E+01 1.37E+01 1.37E+01 1.37E+01
Ps90%/90% (-KTL) Un-Biased 1.37E+01 1.37E+01 1.37E+01 1.37E+01 1.37E+01 1.37E+01 1.37E+01 1.37E+01
Specification MIN 1.20E+01 1.20E+01 1.20E+01 1.20E+01 1.20E+01 1.20E+01 1.20E+01 1.20E+01
Status PASS PASS PASS PASS PASS PASS PASS PASS
Total Dose (krad(Si))

TID Report
11-350 111103 R1.3
An ISO 9001:2008 and DSCC Certified Company
72
Radiation Assured Devices 5017 N. 30th Street Colorado Springs, CO 80919 (719) 531-0800
-1.34E+01
-1.32E+01
-1.30E+01
-1.28E+01
-1.26E+01
-1.24E+01
-1.22E+01
-1.20E+01
-1.18E+01
0 20 40 60 80 100
Total Dose (krad(Si))
Ne
ga
tiv
e O
utp
ut
Vo
lta
ge
Sw
ing
@ +
/-1
5V
RL
=2
K (
AL
)
Average Biased Average Un-Biased
Ps90%/90% (+KTL) Biased Ps90%/90% (+KTL) Un-Biased
Specif ication MAX
24-hr 168-hr
Anneal Anneal
Figure 5.33. Plot of Negative Output Voltage Swing @ +/-15V RL=2K (AL) versus total dose. The solid
diamonds are the average of the measured data points for the samples irradiated under electrical bias while the
shaded diamonds are the average of the measured data points for the samples irradiated with all pins tied to
ground. The black lines (solid and/or dashed) are the average of the data points after application of the KTL
statistics on the samples irradiated under electrical bias while the gray lines (solid and/or dashed) are the average
of the data points after application of the KTL statistics on the samples irradiated in the unbiased condition. The
red dotted line(s) are the pre- and/or post-irradiation minimum and/or maximum specification value as defined in
the datasheet and/or test plan.

TID Report
11-350 111103 R1.3
An ISO 9001:2008 and DSCC Certified Company
73
Radiation Assured Devices 5017 N. 30th Street Colorado Springs, CO 80919 (719) 531-0800
Table 5.33. Raw data for Negative Output Voltage Swing @ +/-15V RL=2K (AL) versus total dose, including
the statistical analysis, specification and the status of the testing (pass/fail).
Negative Output Voltage Swing @ +/-15V RL=2K (AL)
24-hr
Anneal
168-hr
Anneal
Device 0 5 10 20 30 50 80 100
347 -1.33E+01 -1.33E+01 -1.33E+01 -1.33E+01 -1.33E+01 -1.33E+01 -1.32E+01 -1.33E+01
352 -1.33E+01 -1.33E+01 -1.33E+01 -1.33E+01 -1.33E+01 -1.33E+01 -1.33E+01 -1.33E+01
353 -1.33E+01 -1.33E+01 -1.33E+01 -1.33E+01 -1.33E+01 -1.33E+01 -1.32E+01 -1.32E+01
355 -1.33E+01 -1.33E+01 -1.33E+01 -1.33E+01 -1.33E+01 -1.33E+01 -1.33E+01 -1.33E+01
357 -1.33E+01 -1.33E+01 -1.33E+01 -1.33E+01 -1.33E+01 -1.32E+01 -1.32E+01 -1.32E+01
359 -1.33E+01 -1.33E+01 -1.33E+01 -1.33E+01 -1.33E+01 -1.33E+01 -1.32E+01 -1.33E+01
361 -1.33E+01 -1.33E+01 -1.33E+01 -1.33E+01 -1.33E+01 -1.33E+01 -1.33E+01 -1.33E+01
368 -1.33E+01 -1.33E+01 -1.33E+01 -1.33E+01 -1.33E+01 -1.33E+01 -1.33E+01 -1.33E+01
372 -1.33E+01 -1.33E+01 -1.33E+01 -1.33E+01 -1.33E+01 -1.33E+01 -1.32E+01 -1.33E+01
378 -1.33E+01 -1.33E+01 -1.32E+01 -1.32E+01 -1.32E+01 -1.32E+01 -1.32E+01 -1.32E+01
410 -1.33E+01 -1.33E+01 -1.33E+01 -1.33E+01 -1.33E+01 -1.33E+01 -1.32E+01 -1.33E+01
413 -1.33E+01 -1.33E+01 -1.33E+01 -1.33E+01 -1.33E+01 -1.33E+01 -1.33E+01 -1.33E+01
Biased Statistics
Average Biased -1.33E+01 -1.33E+01 -1.33E+01 -1.33E+01 -1.33E+01 -1.33E+01 -1.32E+01 -1.33E+01
Std Dev Biased 5.02E-03 9.18E-03 9.49E-03 7.33E-03 9.18E-03 1.02E-02 1.04E-02 7.82E-03
Ps90%/90% (+KTL) Biased -1.33E+01 -1.32E+01 -1.32E+01 -1.32E+01 -1.32E+01 -1.32E+01 -1.32E+01 -1.32E+01
Ps90%/90% (-KTL) Biased -1.33E+01 -1.33E+01 -1.33E+01 -1.33E+01 -1.33E+01 -1.33E+01 -1.33E+01 -1.33E+01
Un-Biased Statistics
Average Un-Biased -1.33E+01 -1.33E+01 -1.33E+01 -1.33E+01 -1.33E+01 -1.33E+01 -1.33E+01 -1.33E+01
Std Dev Un-Biased 1.97E-02 1.93E-02 2.09E-02 1.95E-02 1.94E-02 1.97E-02 1.97E-02 1.91E-02
Ps90%/90% (+KTL) Un-Biased -1.32E+01 -1.32E+01 -1.32E+01 -1.32E+01 -1.32E+01 -1.32E+01 -1.32E+01 -1.32E+01
Ps90%/90% (-KTL) Un-Biased -1.33E+01 -1.33E+01 -1.33E+01 -1.33E+01 -1.33E+01 -1.33E+01 -1.33E+01 -1.33E+01
Specification MAX -1.20E+01 -1.20E+01 -1.20E+01 -1.20E+01 -1.20E+01 -1.20E+01 -1.20E+01 -1.20E+01
Status PASS PASS PASS PASS PASS PASS PASS PASS
Total Dose (krad(Si))
TID Report
11-350 111103 R1.3
An ISO 9001:2008 and DSCC Certified Company
74
Radiation Assured Devices 5017 N. 30th Street Colorado Springs, CO 80919 (719) 531-0800
6.0. Summary / Conclusions
The total ionizing dose testing described in this final report was performed using the facilities at
Aeroflex RAD's Longmire Laboratories in Colorado Springs, CO. The high dose rate total ionizing dose
(TID) source is a JLSA 81-24 irradiator modified to provide a panoramic exposure. The Co-60 rods are
held in the base of the irradiator heavily shielded by lead, during the radiation exposures the rod is raised
by an electronic timer/controller and the exposure is performed in air. The dose rate for this irradiator in
this configuration ranges from <1rad(Si)/s to a maximum of approximately 120rad(Si)/s, determined by
the distance from the source.
The parametric data was obtained as "read and record" and all the raw data plus an attributes summary
are contained in this report as well as in a separate Excel file. The attributes data contains the average,
standard deviation and the average with the KTL values applied. The KTL value used in this work is
2.742 per MIL-HDBK-814 using one sided tolerance limits of 90/90 and a 5-piece sample size. The
90/90 KTL values were selected to match the statistical levels specified in the MIL-PRF-38535
sampling plan for the qualification of a radiation hardness assured (RHA) component. Note that the
following criteria must be met for a device to pass the total ionizing dose test: following the radiation
exposure each of the 5 pieces irradiated under electrical bias shall pass the specification value. The units
irradiated without electrical bias and the KTL statistics are included in this report for reference only. If
any of the 5 pieces irradiated under electrical bias exceed the device post radiation data sheet
specification limits, then the lot could be logged as a failure.
Based on this criterion the RH118W Op-Amp (from the lot date code identified on the first page of this
test report) PASSED the total ionizing dose test to the maximum tested dose level of 50krad(Si) with all
parameters remaining within their datasheet specifications. Further, the data in this report can be
analyzed along with the low dose rate report titled "Enhanced Low Dose Rate Sensitivity (ELDRS)
Radiation Testing of the RH118W Op-Amp for Linear Technology" to demonstrate that these parts do
not exhibit ELDRS as defined in the current test method.
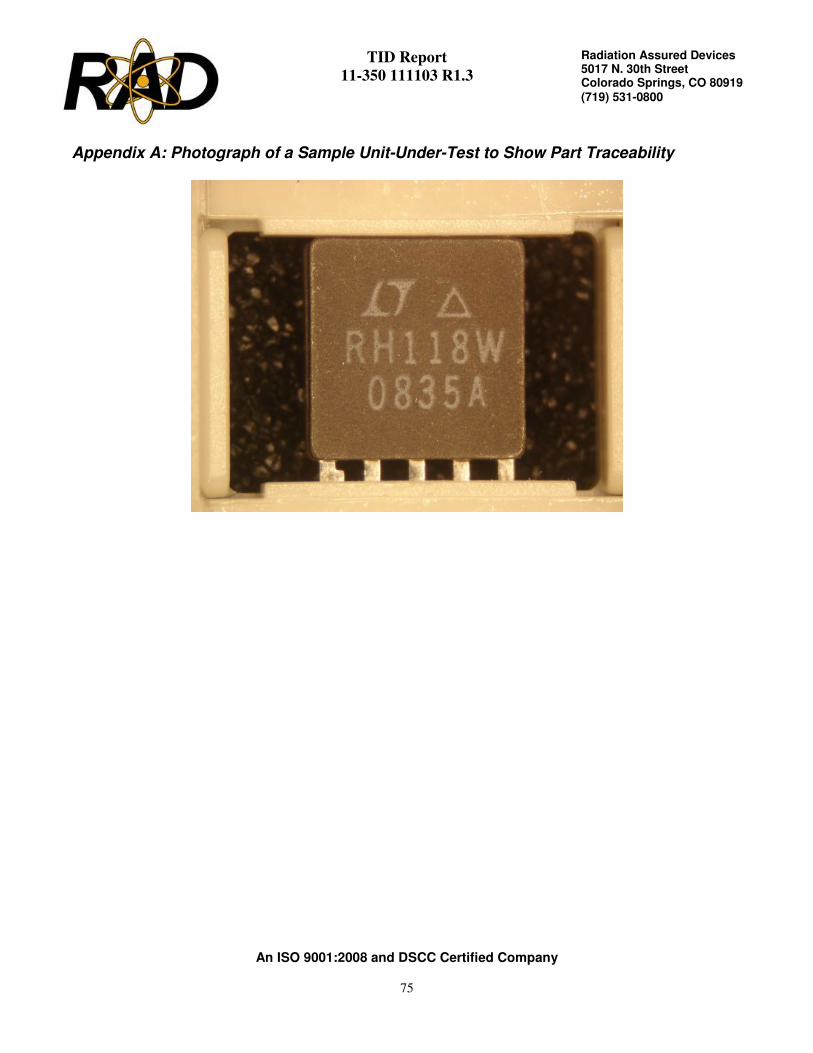
TID Report
11-350 111103 R1.3
An ISO 9001:2008 and DSCC Certified Company
75
Radiation Assured Devices 5017 N. 30th Street Colorado Springs, CO 80919 (719) 531-0800
Appendix A: Photograph of a Sample Unit-Under-Test to Show Part Traceability

TID Report
11-350 111103 R1.3
An ISO 9001:2008 and DSCC Certified Company
76
Radiation Assured Devices 5017 N. 30th Street Colorado Springs, CO 80919 (719) 531-0800
Appendix B: Radiation Bias Connections
TID Radiation Biased Conditions: Extracted from Linear Technology RH118 Datasheet.
Pin Function Connection / Bias
1 NC NC
2 COMP1 NC
3 -INPUT To pin 7 via 10kΩ
4 +INPUT +8V via 10kΩ
5 V- -15V, 0.1µF decoupling
6 COMP3 NC
7 OUTPUT To pin 3 via 10kΩ
8 V+ +15V, 0.1µF decoupling
9 COMP2 NC
10 NC NC
+8V derived from +15V via resistive voltage divider reflecting best industry practices.
Figure B.1. Irradiation bias circuit. This figure was extracted from Linear Technology RH118 Datasheet and
modified to match the W package tested here.

TID Report
11-350 111103 R1.3
An ISO 9001:2008 and DSCC Certified Company
77
Radiation Assured Devices 5017 N. 30th Street Colorado Springs, CO 80919 (719) 531-0800
TID Radiation Unbiased Conditions:
Pin Function Connection / Bias
1 NC GND
2 COMP1 GND
3 -INPUT GND
4 +INPUT GND
5 V- GND
6 COMP3 GND
7 OUTPUT GND
8 V+ GND
9 COMP2 GND
10 NC GND
Absolute Maximum Rating:
Parameter Max Rating
Supply Voltage ±20V
Differential Input Current ±10mA
Input Voltage ±20V

TID Report
11-350 111103 R1.3
An ISO 9001:2008 and DSCC Certified Company
78
Radiation Assured Devices 5017 N. 30th Street Colorado Springs, CO 80919 (719) 531-0800
Appendix C: Electrical Test Parameters and Conditions
The expected ranges of values as well as the measurement conditions are taken from Linear Technology
RH118 Datasheet. All electrical tests for this device are performed on one of Radiation Assured Device's
LTS2020 Test Systems. The LTS2020 Test System is a programmable parametric tester that provides
parameter measurements for a variety of digital, analog and mixed signal products including voltage
regulators, voltage comparators, D to A and A to D converters. The LTS2020 Test System achieves
accuracy and sensitivity through the use of software self-calibration and an internal relay matrix with
separate family boards and custom personality adapter boards. The tester uses this relay matrix to
connect the required test circuits, select the appropriate voltage / current sources and establish the
needed measurement loops for all the tests performed. The measured parameters and test conditions are
shown in Table C.1.
A listing of the measurement precision/resolution for each parameter is shown in Table C.2. The
precision/resolution values were obtained from test data or from the DAC resolution of the LTS-2020
for the particular test shown, whichever is greater. To generate the precision/resolution shown in Table
C.2, one of the units-under-test was tested repetitively (a total of 10-times with re-insertion between
tests) to obtain the average test value and standard deviation. Using this test data MIL-HDBK-814 90/90
KTL statistics were applied to the measured standard deviation to generate the final measurement range.
This value encompasses the precision/resolution of all aspects of the test system, including the LTS2020
mainframe, family board, socket assembly and DUT board as well as insertion error. In some cases, the
measurement resolution is limited by the internal DACs, which results in a measured standard deviation
of zero. In these instances the precision/resolution will be reported back as the LSB of the DAC.
Note that the testing and statistics used in this document are based on an “analysis of variables”
technique, which relies on small sample sizes to qualify much larger lot sizes (see MIL-HDBK-814, p.
91 for a discussion of statistical treatments). Not all measured parameters are well suited to this
approach due to inherent large variations. If necessary, larger samples sizes could be used to qualify
these parameters using an “attributes” approach.

TID Report
11-350 111103 R1.3
An ISO 9001:2008 and DSCC Certified Company
79
Radiation Assured Devices 5017 N. 30th Street Colorado Springs, CO 80919 (719) 531-0800
Table C.1. Measured parameters and test conditions for the RH118W Op-Amp.
Parameter Symbol Test Conditions
Positive Supply Current Is+ V+/V- = ±5V
V+/V- = ±20V
Negative Supply Current Is- V+/V- = ±5V
V+/V- = ±20V
Input Offset Voltage VOS
V+/V- = ±20V VCM=0V
V+/V- = ±15V VCM=0V
V+/V- = ±20V VCM=16.5V
V+/V- = ±20V VCM=-16.5V
V+/V- = ±5V VCM=1V
V+/V- = ±5V VCM=-1V
Input Offset Current IOS
V+/V- = ±20V VCM=0V
V+/V- = ±15V VCM=0V
V+/V- = ±20V VCM=16.5V
V+/V- = ±20V VCM=-16.5V
V+/V- = ±5V VCM=1V
V+/V- = ±5V VCM=-1V
Positive Input Bias Current IB+
V+/V- = ±20V VCM=0V
V+/V- = ±15V VCM=0V
V+/V- = ±20V VCM=16.5V
V+/V- = ±20V VCM=-16.5V
V+/V- = ±5V VCM=1V
V+/V- = ±5V VCM=-1V
Negative Input Bias Current IB-
V+/V- = ±20V VCM=0V
V+/V- = ±15V VCM=0V
V+/V- = ±20V VCM=16.5V
V+/V- = ±20V VCM=-16.5V
V+/V- = ±5V VCM=1V
V+/V- = ±5V VCM=-1V
Common Mode Rejection Ratio CMRR V+/V- = ±20V VCM=±16.5V
Power Supply Rejection Ratio PSRR V+/V- = ±5V TO ±20V
Large Signal Voltage Gain AOL V+/V- = ±15V VO=±10V RL=2K
Positive Output Voltage Gain VOUT+ V+/V- = ±15V RL=2K
Negative Output Voltage Gain VOUT- V+/V- = ±15V RL=2K

TID Report
11-350 111103 R1.3
An ISO 9001:2008 and DSCC Certified Company
80
Radiation Assured Devices 5017 N. 30th Street Colorado Springs, CO 80919 (719) 531-0800
Table C.2. Measured parameters, pre-irradiation specifications and measurement precision for the RH118W Op-
Amp.
Pre-Irradiation Specification Parameter
MIN MAX Measurement Precision/Resolution
POSITIVE SUPPLY CURRENT 8.00E-03 ±5.16E-05
NEGATIVE SUPPLY CURRENT -8.00E-03 ±4.78E-05
VOS -4.00E-03 4.00E-03 ±4.19E-05
IOS -5.00E-08 5.00E-08 ±1.20E-10
IB+ -2.50E-07 2.50E-07 ±9.29E-10
IB- -2.50E-07 2.50E-07 ±9.40E-10
CMRR 8.00E+01 ±1.44E-01
PSRR 7.00E+01 ±3.43E-01
AOL 5.00E+01 ±1.01E+01
VOUT+ 1.20E+01 ±5.53E-03
VOUT- -1.20E+01 ±1.29E-02
TID Report
11-350 111103 R1.3
An ISO 9001:2008 and DSCC Certified Company
81
Radiation Assured Devices 5017 N. 30th Street Colorado Springs, CO 80919 (719) 531-0800
Appendix D: List of Figures Used in the Results Section (Section 5)
5.1. Positive Supply Current @ +5V
5.2. Negative Supply Current @ -5V
5.3. Positive Supply Current @ +20V
5.4. Negative Supply Current @ -20V
5.5. Input Offset Voltage @ +/-20V VCM=0V
5.6. Input Offset Current @ +/-20V VCM=0V
5.7. Positive Input Bias Current @ +/-20V VCM=0V
5.8. Negative Input Bias Current @ +/-20V VCM=0V
5.9. Input Offset Voltage @ +/-15V VCM=0V
5.10. Input Offset Current @ +/-15V VCM=0V
5.11. Positive Input Bias Current @ +/-15V VCM=0V
5.12. Negative Input Bias Current @ +/-15V VCM=0V
5.13. Input Offset Voltage @ +/-20V VCM=16.5V
5.14. Input Offset Current @ +/-20V VCM=16.5V
5.15. Positive Input Bias Current @ +/-20V VCM=16.5V
5.16. Negative Input Bias Current @ +/-20V VCM=16.5V
5.17. Input Offset Voltage @ +/-20V VCM=-16.5V
5.18. Input Offset Current @ +/-20V VCM=-16.5V
5.19. Positive Input Bias Current @ +/-20V VCM=-16.5V
5.20. Negative Input Bias Current @ +/-20V VCM=-16.5V
5.21. Input Offset Voltage @ +/-5V VCM=1V
5.22. Input Offset Current @ +/-5V VCM=1V
5.23. Positive Input Bias Current @ +/-5V VCM=1V
5.24. Negative Input Bias Current @ +/-5V VCM=1V
5.25. Input Offset Voltage @ +/-5V VCM=-1V
5.26. Input Offset Current @ +/-5V VCM=-1V
5.27. Positive Input Bias Current @ +/-5V VCM=-1V
5.28. Negative Input Bias Current @ +/-5V VCM=-1V
5.29. Common Mode Rejection Ratio @ +/-20V VCM=+/-16.5V
5.30. Power Supply Rejection Ratio @ V+/-=+/-5V TO +/-20V
5.31. Large Signal Voltage Gain @ +/-15V VO=+/-10V RL=2K
5.32. Positive Output Voltage Swing @ +/-15V RL=2K (AL)
5.33. Negative Output Voltage Swing @ +/-15V RL=2K (AL)