TOROPARU GOLD PROJECT - Sandspring Resources · TSX-V: SSP | OTC: SSPXF INVESTOR HIGHLIGHTS...
38
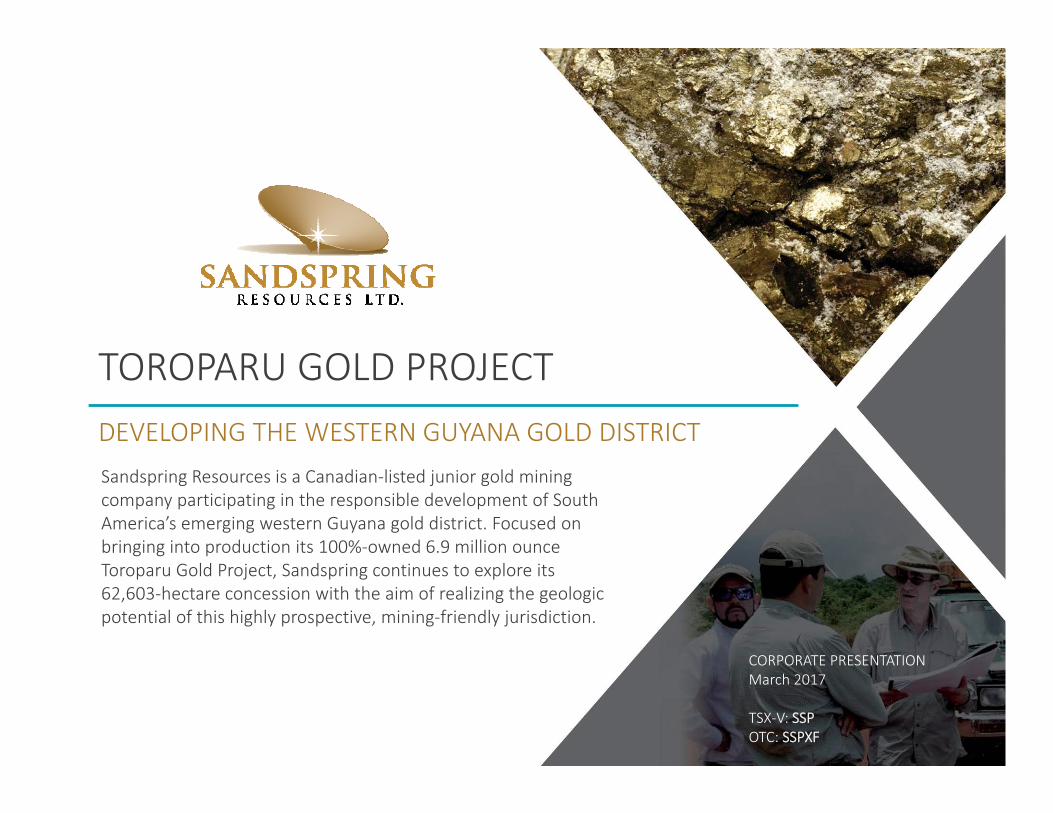
TOROPARU GOLD PROJECT DEVELOPING THE WESTERN GUYANA GOLD DISTRICT Sandspring Resources is a Canadian‐listed junior gold mining company participating in the responsible development of South America’s emerging western Guyana gold district. Focused on bringing into production its 100%‐owned 6.9 million ounce Toroparu Gold Project, Sandspring continues to explore its 62,603‐hectare concession with the aim of realizing the geologic potential of this highly prospective, mining‐friendly jurisdiction. CORPORATE PRESENTATION March 2017 TSX‐V: SSP OTC: SSPXF
Transcript of TOROPARU GOLD PROJECT - Sandspring Resources · TSX-V: SSP | OTC: SSPXF INVESTOR HIGHLIGHTS...
TOROPARU GOLD PROJECT DEVELOPING THE WESTERN GUYANA GOLD DISTRICTSandspring Resources is a Canadian‐listed junior gold mining company participating in the responsible development of South America’s emerging western Guyana gold district. Focused on bringing into production its 100%‐owned 6.9 million ounce Toroparu Gold Project, Sandspring continues to explore its 62,603‐hectare concession with the aim of realizing the geologic potential of this highly prospective, mining‐friendly jurisdiction.
CORPORATE PRESENTATIONMarch 2017
TSX‐V: SSPOTC: SSPXF
TSX-V: SSP | OTC: SSPXF
Forward‐looking StatementsCautionary Note Regarding Forward‐Looking Information: Except for statements of historical fact relating to Sandspring Resources Ltd. (the “Company” or “Sandspring”), certain information contained inthis presentation constitutes “forward‐looking information” under Canadian and U.S. securities legislation. Forward‐looking information includes, but is not limited to, statements with respect to thepotential of the Company’s properties; the future price of gold; success of exploration activities; costs and timing of future exploration and development; the estimation of mineral resources; conclusionsof economic evaluations; requirements for additional capital; and other statements relating to the financial and business prospects of the Company. Generally, forward‐looking information can beidentified by the use of forward‐looking terminology such as “plans,” “expects,” or “does not expect,” “is expected”, “budget,” “scheduled,” “estimates,” “forecasts,” “intends,” “anticipates,” or “doesnot anticipate,” “believes,” or variations of such words and phrases. Forward‐looking information is based on the reasonable assumptions, estimates, analysis and opinions of the management of theCompany made in light of its experience and its perception of trends, current conditions and expected developments, as well as other factors that the management of the Company believes to berelevant and reasonable in the circumstances at the date that such statements are made. Forward‐looking information is inherently subject to known and unknown risks, uncertainties and other factorsthat may cause the actual results, level of activity, performance or achievements of the Company to be materially different from those expressed or implied by such forward‐looking information,including but not limited to risks related to: the Company’s goal of creating shareholder value by concentrating on the development of the Toroparu Gold Project, believing that it has the potential tocontain economic gold deposits; the Company’s assessment of future plans for the Upper Puruni property; managements’ economic outlook regarding future trends; the Company’s exploration budgetfor the Upper Puruni property, and in particular, the availability of skilled labour, timing and the amount of the expected budget; the Company’s ability to meet its working capital needs at the currentlevel in the short term; expectations with respect to raising capital; sensitivity analysis on financial instruments may vary from the amounts disclosed; and government regulation and environmentalliability, as well as those risk factors discussed or referred to in the Company’s continuous disclosure filings with the securities regulatory authorities in Canada available at www.sedar.com. Although theCompany has attempted to identify important factors that could cause actual results to differ materially from those contained in forward‐looking information, other factors could also cause materiallydifferent results. There can be no assurance that forward‐looking statements will prove to be accurate, as actual results and future events could differ materially from those anticipated in suchstatements. Accordingly, readers should not place undue reliance on forward‐looking information. The forward‐looking information contained herein is presented for the purpose of assisting investorsin understanding the Company’s expected financial and operational performance and the Company’s plans and objectives and may not be appropriate for other purposes. The Company does notundertake to update any forward‐looking information, except in accordance with applicable securities laws.
Pre‐Feasibility StudyThe Pre‐Feasibility Study, prepared by SRK Consulting (U.S.) Inc. with an effective date of May 8, 2013, is entitled “NI 43‐101 Technical Report, Pre‐Feasibility Study, Toroparu Gold Project, Upper PuruniRiver Area, Guyana. Pre‐Feasibility economics were calculated using a base case of US$1,400/oz gold and US$3.25/lb copper. The Pre‐Feasibility Study has been filed on SEDAR at www.sedar.com.
Resource EstimatesThis document uses the term “reserves”, “proven and probable reserves”, “resources”, “measured resources”, “indicated resources” and “inferred resources”. United States investors are advised that,while measured resources, indicated resources and inferred resources are recognized and required by Canadian securities laws, the United States Securities and Exchange Commission (the “SEC”) doesnot recognize them. Under United States standards, mineralization may not be classified as a “reserve” unless the determination has been made that the mineralization could be economically and legallyproduced or extracted at the time the reserve determination is made. United States investors are cautioned not to assume that all or any part of measured or indicated resources will ever be convertedinto reserves. Further, inferred resources have a great amount of uncertainty as to their existence and as to whether they can be mined legally or economically. It cannot be assumed that all or any partof the inferred resources will ever be upgraded to a higher category. Therefore, United States investors are also cautioned not to assume that all or any part of the inferred resources exist, or that theycan be mined legally or economically. Disclosure of “contained ounces” is permitted disclosure under Canadian regulations, however, the SEC normally only permits issuers to report “resources” as inplace tonnage and grade without reference to unit measures. Accordingly, information concerning descriptions of mineralization and resources contained in this release may not be comparable toinformation made public by United States companies subject to the reporting and disclosure requirements of the SEC. National Instrument 43‐101 Standards of Disclosure for Mineral Projects (“NI 43‐101”) is a rule developed by the Canadian Securities Administrators, which established standards for all public disclosure an issuer makes of scientific and technical information concerning mineralprojects. All resource estimates contained in this circular have been prepared in accordance with NI 43‐101 and the Canadian Institute of Mining, Metallurgy and Petroleum Classification System.
Qualified PersonThe scientific and technical information in this presentation has been reviewed and approved by Mr. L. Werner Claessens, Lic. Geo., P.Geo., and Yani Roditis, B.Sc., M.Sc., both qualified persons asdefined under NI‐43101. Mr. Roditis is a Registered Member of SME (#2744550).
2
CAUTIONARY NOTESForward‐looking Statements and Cautionary Notes
TSX-V: SSP | OTC: SSPXF
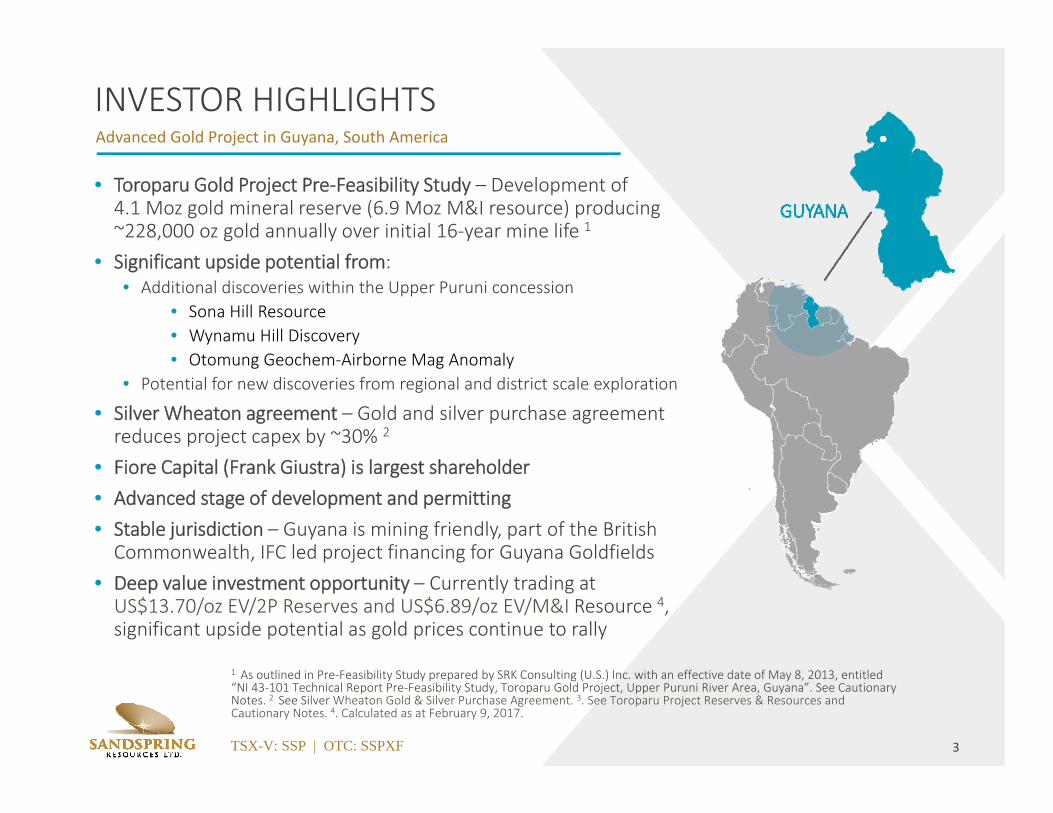
INVESTOR HIGHLIGHTSAdvanced Gold Project in Guyana, South America
• Toroparu Gold Project Pre‐Feasibility Study – Development of 4.1 Moz gold mineral reserve (6.9 Moz M&I resource) producing ~228,000 oz gold annually over initial 16‐year mine life 1
• Significant upside potential from:• Additional discoveries within the Upper Puruni concession
• Sona Hill Resource• Wynamu Hill Discovery• Otomung Geochem‐Airborne Mag Anomaly
• Potential for new discoveries from regional and district scale exploration
• Silver Wheaton agreement – Gold and silver purchase agreement reduces project capex by ~30% 2
• Fiore Capital (Frank Giustra) is largest shareholder• Advanced stage of development and permitting • Stable jurisdiction – Guyana is mining friendly, part of the British Commonwealth, IFC led project financing for Guyana Goldfields
• Deep value investment opportunity – Currently trading at US$13.70/oz EV/2P Reserves and US$6.89/oz EV/M&I Resource 4, significant upside potential as gold prices continue to rally
1 As outlined in Pre‐Feasibility Study prepared by SRK Consulting (U.S.) Inc. with an effective date of May 8, 2013, entitled “NI 43‐101 Technical Report Pre‐Feasibility Study, Toroparu Gold Project, Upper Puruni River Area, Guyana”. See Cautionary Notes. 2 See Silver Wheaton Gold & Silver Purchase Agreement. 3. See Toroparu Project Reserves & Resources and Cautionary Notes. 4. Calculated as at February 9, 2017.
3
TSX-V: SSP | OTC: SSPXF
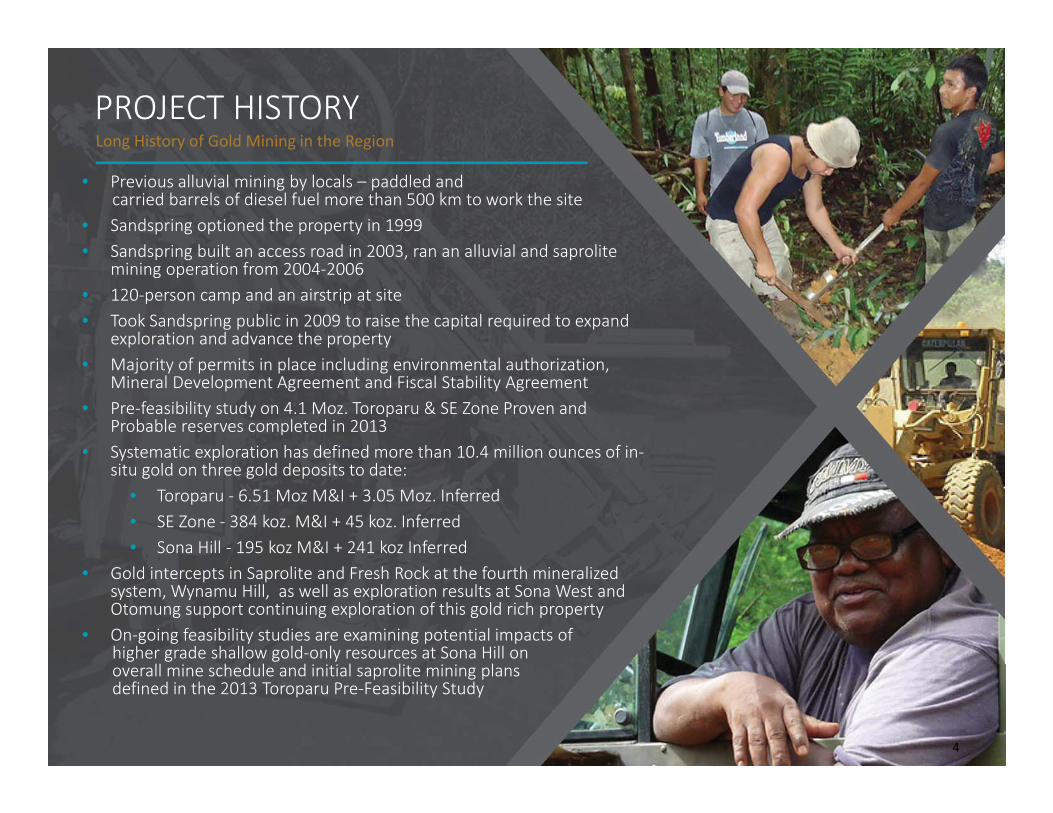
PROJECT HISTORYLong History of Gold Mining in the Region
• Previous alluvial mining by locals – paddled and carried barrels of diesel fuel more than 500 km to work the site
• Sandspring optioned the property in 1999• Sandspring built an access road in 2003, ran an alluvial and saprolite
mining operation from 2004‐2006 • 120‐person camp and an airstrip at site• Took Sandspring public in 2009 to raise the capital required to expand
exploration and advance the property• Majority of permits in place including environmental authorization,
Mineral Development Agreement and Fiscal Stability Agreement• Pre‐feasibility study on 4.1 Moz. Toroparu & SE Zone Proven and
Probable reserves completed in 2013• Systematic exploration has defined more than 10.4 million ounces of in‐
situ gold on three gold deposits to date:• Toroparu ‐ 6.51 Moz M&I + 3.05 Moz. Inferred• SE Zone ‐ 384 koz. M&I + 45 koz. Inferred• Sona Hill ‐ 195 koz M&I + 241 koz Inferred
• Gold intercepts in Saprolite and Fresh Rock at the fourth mineralized system, Wynamu Hill, as well as exploration results at Sona West and Otomung support continuing exploration of this gold rich property
• On‐going feasibility studies are examining potential impacts of higher grade shallow gold‐only resources at Sona Hill onoverall mine schedule and initial saprolite mining plansdefined in the 2013 Toroparu Pre‐Feasibility Study
4
5TSX-V: SSP | OTC: SSPXF
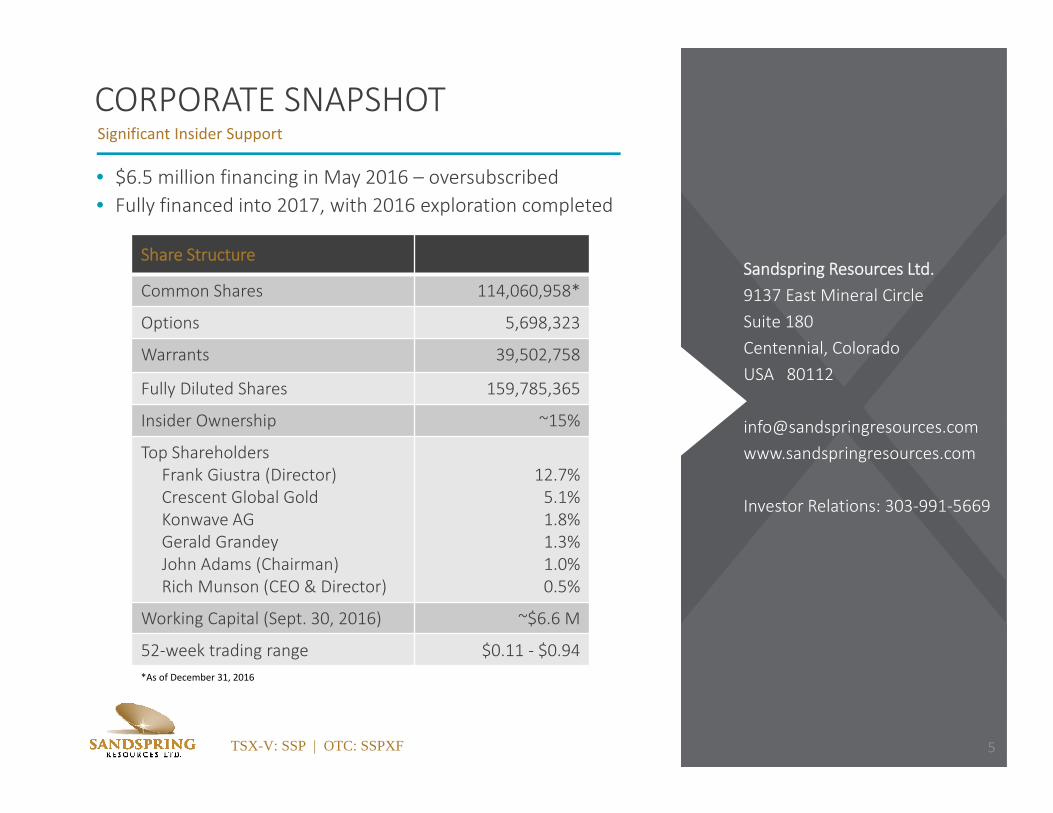
• $6.5 million financing in May 2016 – oversubscribed • Fully financed into 2017, with 2016 exploration completed
CORPORATE SNAPSHOTSignificant Insider Support
5
Sandspring Resources Ltd.9137 East Mineral CircleSuite 180Centennial, ColoradoUSA 80112
Investor Relations: 303‐991‐5669
Share Structure
Common Shares 114,060,958*
Options 5,698,323
Warrants 39,502,758
Fully Diluted Shares 159,785,365
Insider Ownership ~15%
Top ShareholdersFrank Giustra (Director) Crescent Global GoldKonwave AG Gerald GrandeyJohn Adams (Chairman)Rich Munson (CEO & Director)
12.7%5.1%1.8%1.3%1.0%0.5%
Working Capital (Sept. 30, 2016) ~$6.6 M
52‐week trading range $0.11 ‐ $0.94*As of December 31, 2016
TSX-V: SSP | OTC: SSPXF
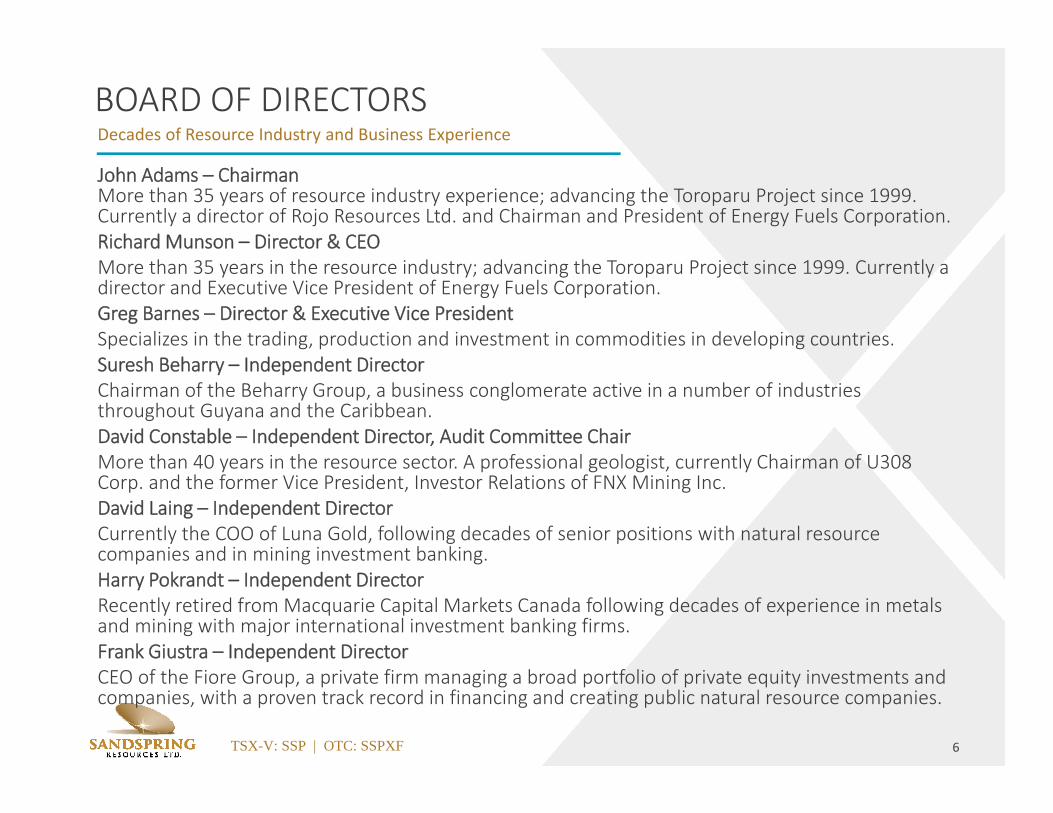
John Adams – Chairman More than 35 years of resource industry experience; advancing the Toroparu Project since 1999. Currently a director of Rojo Resources Ltd. and Chairman and President of Energy Fuels Corporation.Richard Munson – Director & CEOMore than 35 years in the resource industry; advancing the Toroparu Project since 1999. Currently a director and Executive Vice President of Energy Fuels Corporation.Greg Barnes – Director & Executive Vice PresidentSpecializes in the trading, production and investment in commodities in developing countries.Suresh Beharry – Independent DirectorChairman of the Beharry Group, a business conglomerate active in a number of industries throughout Guyana and the Caribbean.David Constable – Independent Director, Audit Committee ChairMore than 40 years in the resource sector. A professional geologist, currently Chairman of U308 Corp. and the former Vice President, Investor Relations of FNX Mining Inc.David Laing – Independent DirectorCurrently the COO of Luna Gold, following decades of senior positions with natural resource companies and in mining investment banking.Harry Pokrandt – Independent DirectorRecently retired from Macquarie Capital Markets Canada following decades of experience in metals and mining with major international investment banking firms.Frank Giustra – Independent DirectorCEO of the Fiore Group, a private firm managing a broad portfolio of private equity investments and companies, with a proven track record in financing and creating public natural resource companies.
6
BOARD OF DIRECTORSDecades of Resource Industry and Business Experience
7TSX-V: SSP | OTC: SSPXF
‐‐
$50
$100
$150
$200
$250
Enterprise Value US$/oz Gold Re
source
Enterprise Value per Ounce of Gold
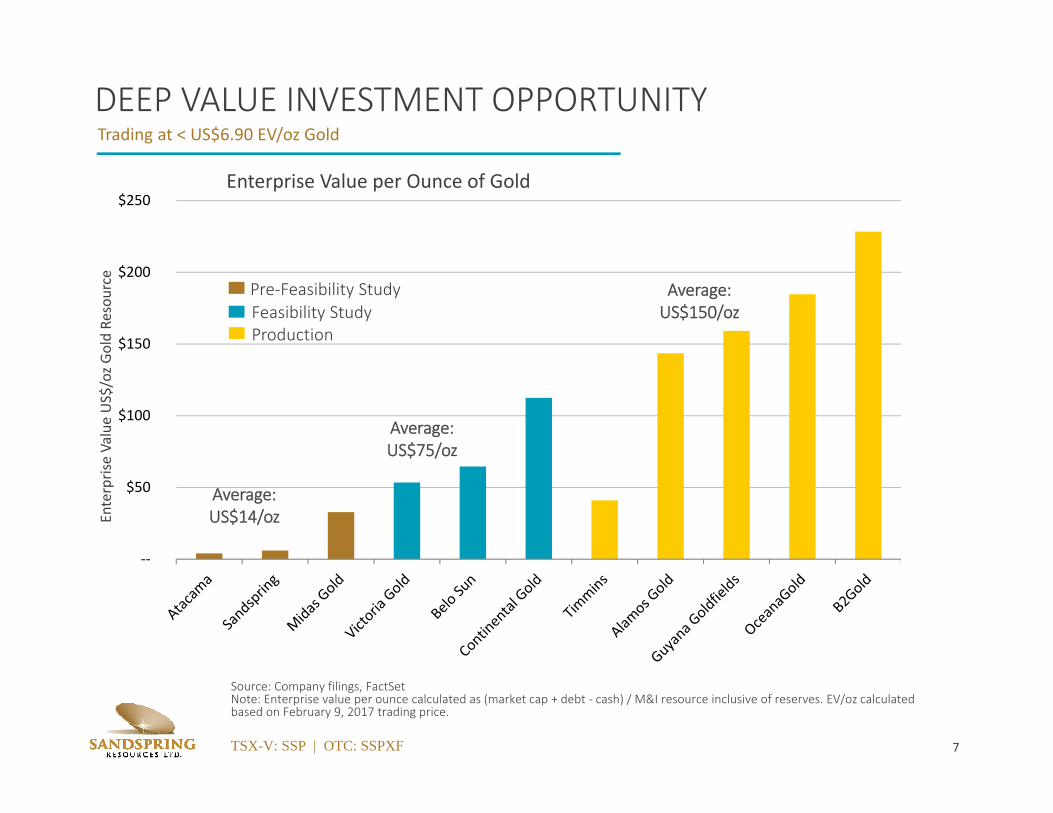
DEEP VALUE INVESTMENT OPPORTUNITYTrading at < US$6.90 EV/oz Gold
Source: Company filings, FactSetNote: Enterprise value per ounce calculated as (market cap + debt ‐ cash) / M&I resource inclusive of reserves. EV/oz calculatedbased on February 9, 2017 trading price.
Average: US$14/oz
Average: US$75/oz
Average: US$150/oz
Pre‐Feasibility StudyFeasibility StudyProduction
8
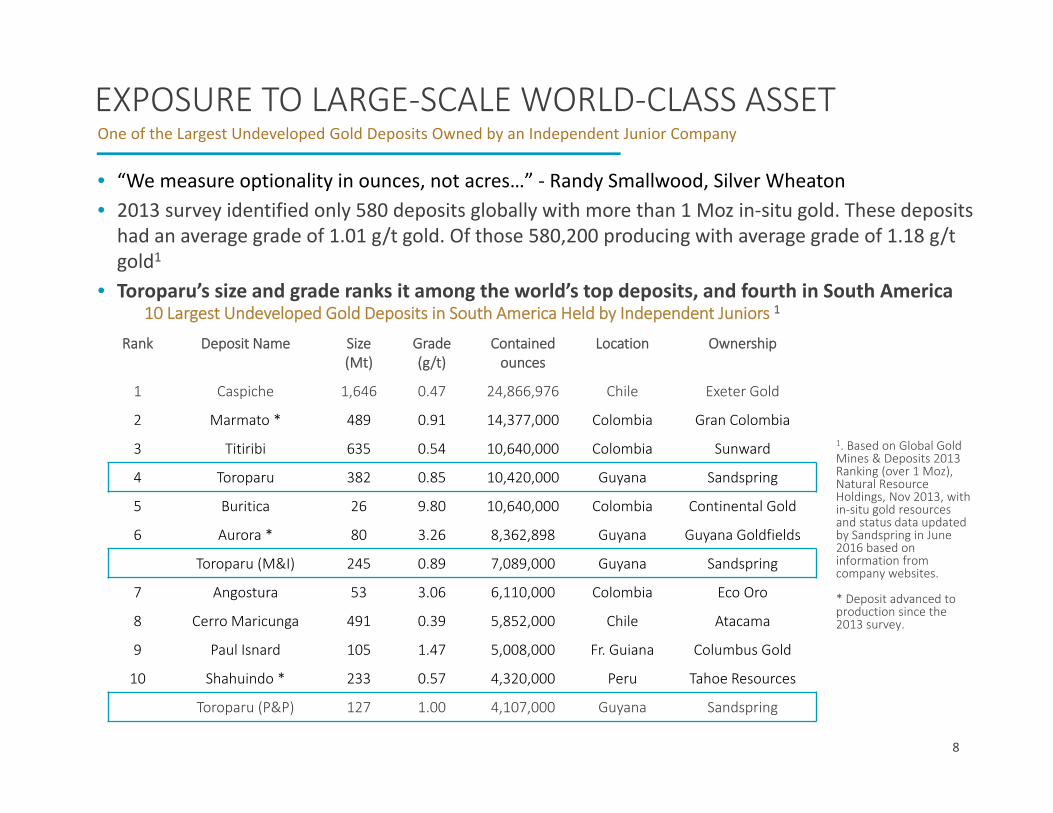
EXPOSURE TO LARGE‐SCALE WORLD‐CLASS ASSETOne of the Largest Undeveloped Gold Deposits Owned by an Independent Junior Company
10 Largest Undeveloped Gold Deposits in South America Held by Independent Juniors 1
Rank Deposit Name Size(Mt)
Grade (g/t)
Containedounces
Location Ownership
1 Caspiche 1,646 0.47 24,866,976 Chile Exeter Gold
2 Marmato * 489 0.91 14,377,000 Colombia Gran Colombia
3 Titiribi 635 0.54 10,640,000 Colombia Sunward
4 Toroparu 382 0.85 10,420,000 Guyana Sandspring
5 Buritica 26 9.80 10,640,000 Colombia Continental Gold
6 Aurora * 80 3.26 8,362,898 Guyana Guyana Goldfields
Toroparu (M&I) 245 0.89 7,089,000 Guyana Sandspring
7 Angostura 53 3.06 6,110,000 Colombia Eco Oro
8 Cerro Maricunga 491 0.39 5,852,000 Chile Atacama
9 Paul Isnard 105 1.47 5,008,000 Fr. Guiana Columbus Gold
10 Shahuindo * 233 0.57 4,320,000 Peru Tahoe Resources
Toroparu (P&P) 127 1.00 4,107,000 Guyana Sandspring
• “We measure optionality in ounces, not acres…” ‐ Randy Smallwood, Silver Wheaton • 2013 survey identified only 580 deposits globally with more than 1 Moz in‐situ gold. These deposits had an average grade of 1.01 g/t gold. Of those 580,200 producing with average grade of 1.18 g/t gold1
• Toroparu’s size and grade ranks it among the world’s top deposits, and fourth in South America
1. Based on Global Gold Mines & Deposits 2013 Ranking (over 1 Moz), Natural Resource Holdings, Nov 2013, with in‐situ gold resources and status data updated by Sandspring in June 2016 based on information from company websites.
* Deposit advanced to production since the 2013 survey.
9
PROJECT RESERVES 1 & RESOURCES 2Upside Potential from Conversion of Toroparu, SE Zone, and Sona Hill Resources
Category Tonnes(000s)
Gold(g/t)
Gold(k oz)
Copper(%)
Copper(M lb)
Silver 3(g/t)
Silver 3(k oz)
Proven 29,780 1.10 1,049 0.13 64
Probable 97,331 0.98 3,058 0.10 147
Proven + Probable 127,111 1.00 4,107 0.11 211
Measured 44,447 0.98 1,398 0.104 102 1.165 1,664
Indicated 201,356 0.88 5,692 0.079 342 0.736 4,631
Measured + Indicated 245,803 0.90 7,090 0.084 444 0.815 6,295
Inferred 136,566 0.76 3,331 0.042 120 0.074 3101 Notes on Reserve Estimate: Reserves estimated as part of Pre‐Feasibility Study prepared by SRK Consulting (U.S.) Inc. with an effective date of May 8, 2013, entitled “NI 43‐101 Technical Report Pre‐Feasibility
Study, Toroparu Gold Project, Upper Puruni River Area, Guyana”. Reserves are based on a gold cutoff price of US$1,070/oz. for fresh rock and US$970/oz. for saprolite, and a cut‐off grade of $0.38 g/t Au forfresh rock and 0.35 g/t Au for saprolite. Cash flow Base Case used a gold price of US$1,400/oz. and copper price of $3.25/lb.; open pit reserves assume full mine recovery; open pit reserves are diluted (furtherto dilution inherent in the resource model and assumes selective mining unit of 5 m x 5 m x 5 m). Contained in‐situ Au ounces do not include metallurgical recoveries of 96% for gold in saprolite (Oxide), 85% forgold in Au/Cu fresh rock, 91% for copper in Au/Cu fresh rock, and 96% for gold in Au fresh rock. Waste tonnes within pit is 468.9 Mt at a strip ratio of 3.69:1 (waste to ore); an open pit CoG of 0.35 g/t‐Ausaprolite and 0.38 g/t‐Au Fresh Rock was applied to open pit resources constrained by the final pit design; mineral resource tonnage and contained metal have been rounded to reflect the accuracy of theestimate, and numbers may not add due to rounding; the mineral reserve estimate for Toroparu was calculated by Fernando P. Rodrigues, BSc, MBA MMSAQP #01405QP of SRK, in accordance to CSA, NI 43‐101 standards and generally accepted CIM “Estimation of Mineral Resource and Mineral Reserves Best Practices” guidelines. See Cautionary Notes.
2 Notes for Resource Estimate: Mineral resources are inclusive of mineral reserves. All resources in the revised mineral resource statement are In‐Pit resources reported within an optimized pit shell (Resource PitShell) above an economic cut‐off grade of 0.30 g/t Au. The economic cut‐off grade was determined using a gold price of $1,350/oz. Au, an average metallurgical recovery of 95.9% for gold, processing + G&Acosts of $11.49/tonne, and includes $112/oz. Au for freight, smelting, refining and royalties. Copper metallurgical recovery used was 91%. Additional indicated resources from Sona Hill are included with detailsprovided on Slide 17. Mineral Resources are reported in accordance with Canadian Securities Administrators (CSA) National Instrument 43‐101 (NI 43‐101) and have been estimated in conformity with generallyaccepted CIM "Estimation of Mineral Resource and Mineral Reserves Best Practices" guidelines. Resources are not Mineral Reserves and do not have demonstrated economic viability. There is no certainty thatall or any part of the Mineral Resources estimated will be converted into Mineral Reserves estimate. Mineral resource tonnage and contained metal have been rounded to reflect the accuracy of the estimate,and numbers may not add due to rounding. The quantity and grade of reported Inferred resources in this estimation are uncertain in nature and there has been insufficient exploration to define these Inferredresources as an Indicated or Measured mineral resource and it is uncertain if further exploration will result in upgrading them to an Indicated or Measured mineral resource category. See Cautionary Notes.
3 Notes for Silver Resource Estimate: The PFS Resource Statement, originally published with an effective date of March 31, 2013, was updated in September 2014 to include silver resources. All resources in therevised mineral resource statement are In‐Pit resources reported within an optimized pit shell above an economic cut‐off grade (CoG) of 0.30 g/t Au. See Cautionary Notes.
10TSX-V: SSP | OTC: SSPXF
PRE‐FEASIBILITY STUDY ECONOMICSLeverage to Rising Gold Price
Pre‐tax US$1200 oz/gold US$1400 oz/gold US$1750 oz/gold
NPV 5% US$557 million US$992 million US$1,782 million
IRR 18.9% 27.2% 40.1%
Payback 3.58 years 2.42 years 1.37 years
After‐tax US$1200 oz/gold US$1400 oz/gold US$1750 oz/gold
NPV 5% US$384 million US$691 million US$1,246 million
IRR 16.1% 23.1% 33.8%
Payback 3.66 years 2.63 years 1.57 years
As outlined in Pre‐Feasibility Study prepared by SRK Consulting (U.S.) Inc. with an effective date of May 8, 2013, entitled “NI 43‐101 Technical Report Pre‐Feasibility Study, Toroparu Gold Project, Upper Puruni River Area, Guyana”. See Cautionary Notes.
• Pre‐production capex of US$464 million (US$329 million after Silver Wheaton contribution)• Project provides US$1.25 billion in free cash flow over life of mine at PFS base case price of
US$1400/oz Au, or US$893 M at US$1260/oz Au
US$691 MNPV 5% After‐tax
23.1%IRR After‐tax
2.6 yearsAfter‐tax Payback
11TSX-V: SSP | OTC: SSPXF
• Precious Metals Purchase Agreement (PMPA) with Silver Wheaton 1
• Key transaction terms:• 10% of LoM gold production at US$400/oz Au• 50% of LoM silver production at US$3.90/oz Ag• US$15.5 M early deposit received• US$138 M project installments for royalty stream• Total contribution toward project capex: US$153.5 M
• Silver Wheaton’s early deposit transaction and expansion in 2015 validates Toroparu Project
• Substantially reduces project finance requirement by ~30%
SILVER WHEATON GOLD & SILVER PURCHASE AGREEMENTSignificantly De‐risks Project Finance Requirements
1 PMPA currently requires completion of a Feasibility Study by December 31, 2017. Afterreviewing the feasibility, Silver Wheaton has the option to continue or opt out of the PMPA.If Silver Wheaton elects not to proceed, Sandspring can choose to return US$11.5 million toSilver Wheaton and terminate the GSPA, or can reduce the gold stream from 10% to 0.909%and the silver stream from 50% to nil.
12TSX-V: SSP | OTC: SSPXF
PRE‐FEASIBILITY STUDY PARAMETERSAdvancing to Feasibility
1 As outlined in Pre‐Feasibility Study prepared by SRK Consulting (U.S.) Inc. with an effective date of May 8, 2013, entitled “NI 43‐101 Technical Report Pre‐Feasibility Study, Toroparu Gold Project, Upper Puruni River Area, Guyana”. See Cautionary Notes.
2 Internal numbers prepared by Management.
May 2013 Pre‐Feasibility 1 Silver Wheaton Gold Stream 2
Total LoM production 3,707,000 ounces gold 3,707,000 ounces gold
Average LoM annual production 227,000 ounces gold 227,000 ounces gold
Average LoM operating cash cost US$700/oz payable gold US$691/oz payable gold
LoM all‐in sustaining cost (AISC) US$922/oz payable gold US$886/oz payable gold
Mine life 16 years 16 years
Throughput 15,000 tpd / 22,500 (yr 4) 15,000 tpd / 22,500 (yr 4)
Average mined grade 1.00 g/t 1.00 g/t
Gold recovery 91% 91%
Pre‐production capex US$464 million US$329 million
Expansion and sustaining capex US$320 million US$320 million
Pre‐tax NPV5% US$994 million US$904 million
Pre‐tax IRR and payback 27.2%, 2.4 years 32.1%, 1.7 years
Post‐tax NPV5% US$691 million US$667 million
Post‐tax IRR and payback 23.1%, 2.6 years 28.7%, 1.8 years
Gold price US$1400/oz US$1400/oz
TSX-V: SSP | OTC: SSPXF
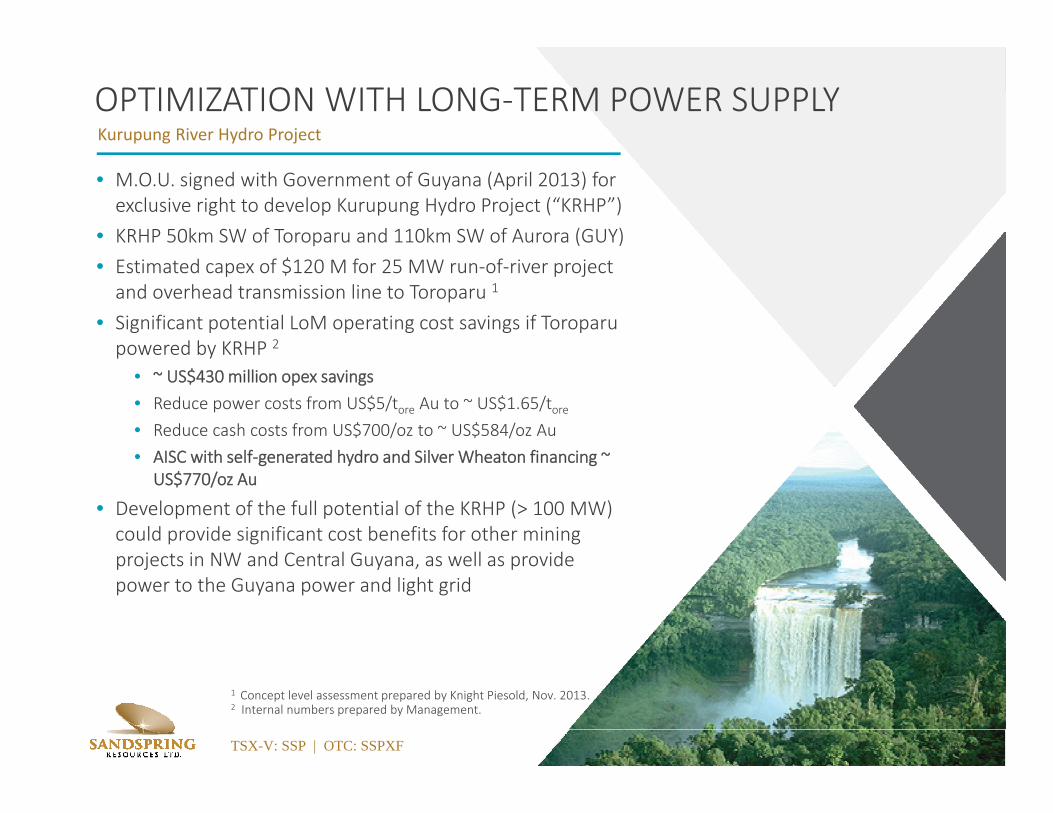
• M.O.U. signed with Government of Guyana (April 2013) for exclusive right to develop Kurupung Hydro Project (“KRHP”)
• KRHP 50km SW of Toroparu and 110km SW of Aurora (GUY)• Estimated capex of $120 M for 25 MW run‐of‐river project and overhead transmission line to Toroparu 1
• Significant potential LoM operating cost savings if Toroparu powered by KRHP 2
• ~ US$430 million opex savings• Reduce power costs from US$5/tore Au to ~ US$1.65/tore• Reduce cash costs from US$700/oz to ~ US$584/oz Au• AISC with self‐generated hydro and Silver Wheaton financing ~
US$770/oz Au
• Development of the full potential of the KRHP (> 100 MW) could provide significant cost benefits for other mining projects in NW and Central Guyana, as well as provide power to the Guyana power and light grid
13
OPTIMIZATION WITH LONG‐TERM POWER SUPPLYKurupung River Hydro Project
1 Concept level assessment prepared by Knight Piesold, Nov. 2013. 2 Internal numbers prepared by Management..
14TSX-V: SSP | OTC: SSPXF
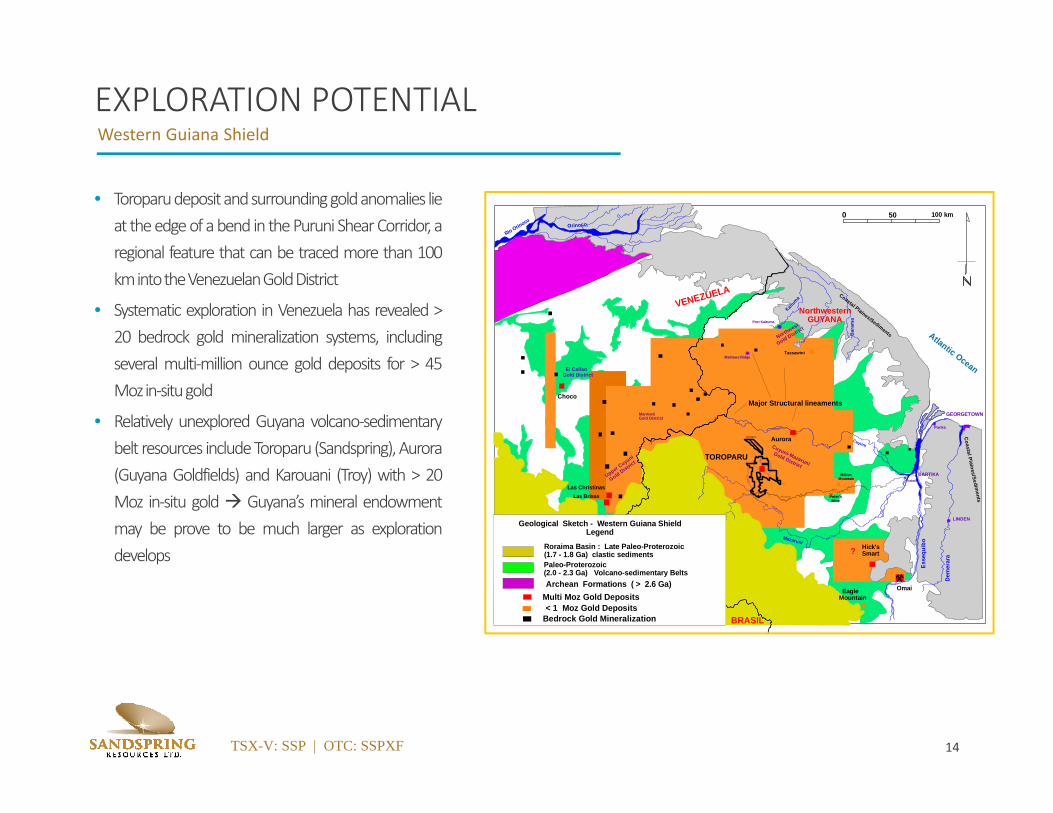
• Toroparudepositandsurroundinggoldanomalies lieat theedgeofabend in thePuruni ShearCorridor, aregional feature that can be traced more than 100kmintotheVenezuelanGoldDistrict
• Systematic exploration in Venezuela has revealed >20 bedrock gold mineralization systems, includingseveral multi‐million ounce gold deposits for > 45Mozin‐situgold
• Relatively unexplored Guyana volcano‐sedimentarybelt resources includeToroparu (Sandspring),Aurora(Guyana Goldfields) and Karouani (Troy) with > 20Moz in‐situ gold Guyana’s mineral endowmentmay be prove to be much larger as explorationdevelops
EXPLORATION POTENTIALWestern Guiana Shield
?
Coastal Plaines/Sediments
Coasta l Pl aines /Sedim
ents
BARTIKA
LINDEN
GEORGETOWN
Mathews Ridge
Port Kaituma
ParikaAurora
MillionMountain
Peter's Mine
TOR
Puruni Landing
RoadCamp
Eagle Mountain
Omai
Itabali
MAIN ACCESS ROAD
PURUNI
PUTA REN G
MAZARUNI RIVER
Kaitum
a
Wynamu
Toroparu
Esse
quib
o
Dem
erar
a
Cuyuni
Mazaruni
Bar
ama
Maz aruni
Rio OrinocoOrinoco
Northwestern GUYANA
VENEZUELA
Bartika
Itabali
Atlantic Ocean
BRASIL
0 50 100 km
Geological Sketch - Western Guiana ShieldLegend
Roraima Basin : Late Paleo-Proterozoic(1.7 - 1.8 Ga) clastic sedimentsPaleo-Proterozoic(2.0 - 2.3 Ga) Volcano-sedimentary BeltsArchean Formations ( > 2.6 Ga)
Multi Moz Gold Deposits < 1 Moz Gold DepositsBedrock Gold Mineralization
Major Structural lineaments
Otomung PLs
GS14: G-102GS14: G-103
Aurora
Hick's Smart
Las ChristinasLas Brisas
Choco
Tassawini
Upper Cuyuni
Gold District
El Callao Gold District
Marwani Gold District
Cuyuni-Mazaruni
Gold District
Northwest
Gold District
TOROPARU
15TSX-V: SSP | OTC: SSPXF
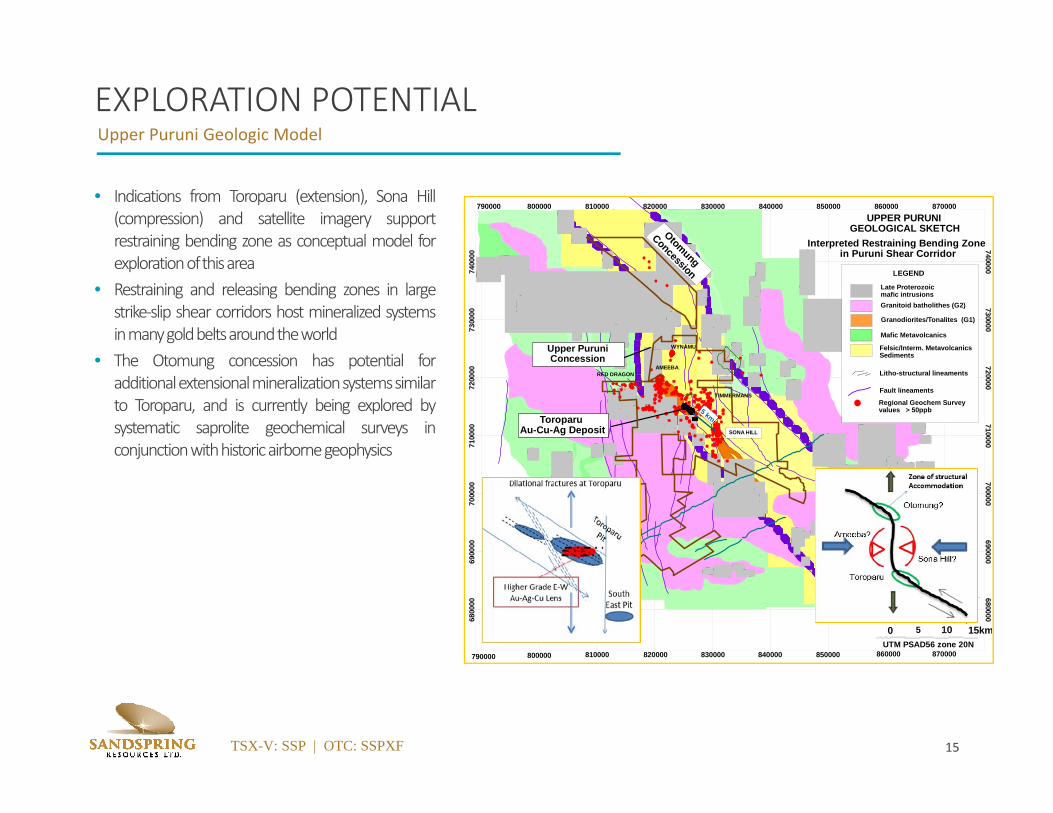
• Indications from Toroparu (extension), Sona Hill(compression) and satellite imagery supportrestraining bending zone as conceptual model forexplorationofthisarea
• Restraining and releasing bending zones in largestrike‐slip shear corridors host mineralized systemsinmanygoldbeltsaroundtheworld
• The Otomung concession has potential foradditionalextensionalmineralizationsystemssimilarto Toroparu, and is currently being explored bysystematic saprolite geochemical surveys inconjunctionwithhistoricairbornegeophysics
EXPLORATION POTENTIALUpper Puruni Geologic Model
0 5 10 15km
6800
0069
0000
7000
0071
0000
7200
0073
0000
7400
00
680000690000
700000710000
720000730000
740000
790000 800000 810000 820000 830000 840000 850000 860000 870000
790000 800000 810000 820000 830000 840000 850000 860000 870000
UTM PSAD56 zone 20N
UPPER PURUNIGEOLOGICAL SKETCH 81
0,00
0
820,
000 UTM PSAD Zone 20N
?
LEGEND
Granitoid batholithes (G2)
Granodiorites/Tonalites (G1)
Mafic Metavolcanics
Felsic/Interm. MetavolcanicsSediments
Litho-structural lineaments
Fault lineaments
Late Proterozoic mafic intrusions
Regional Geochem Surveyvalues > 50ppb
Toroparu Au-Cu-Ag Deposit
Upper PuruniConcession
Interpreted Restraining Bending Zone in Puruni Shear Corridor
WYNAMU
TIMMERMANS
AMEEBARED DRAGON
Otomung
Concession
SONA HILL
5 km
16TSX-V: SSP | OTC: SSPXF
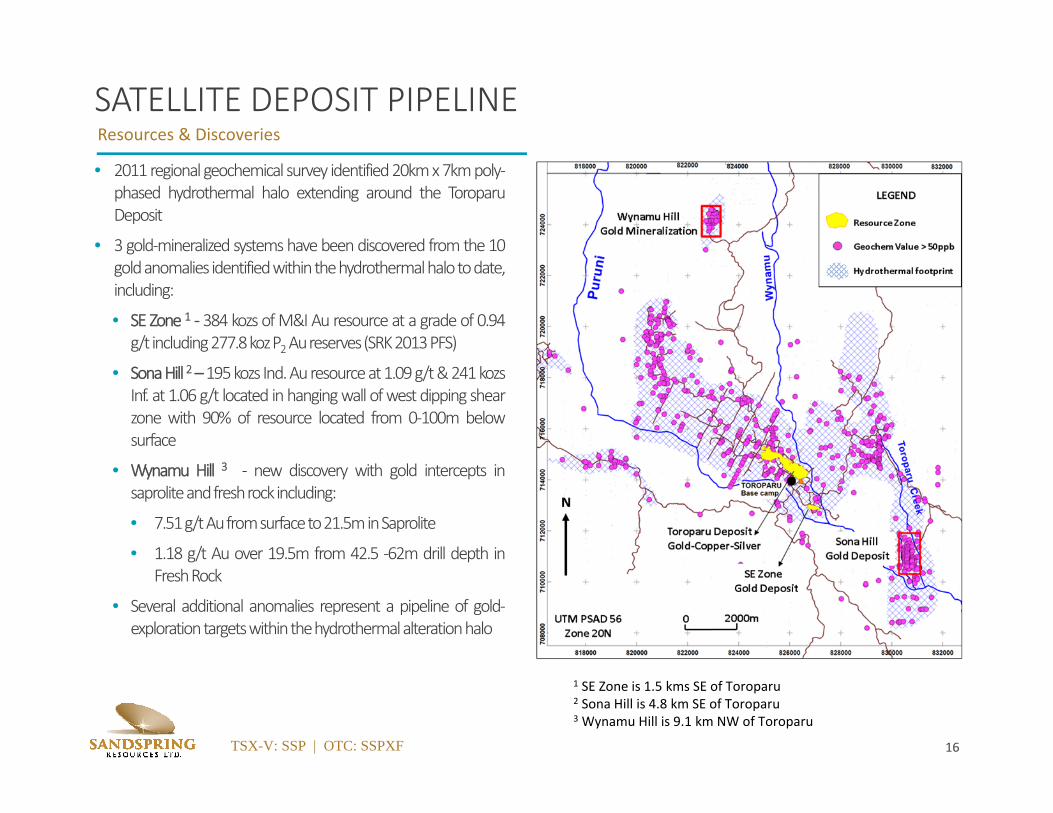
• 2011regional geochemical survey identified20kmx7kmpoly‐phased hydrothermal halo extending around the ToroparuDeposit
• 3 gold‐mineralized systemshavebeendiscovered from the10goldanomalies identifiedwithinthehydrothermalhalotodate,including:
• SE Zone 1 ‐ 384 kozs ofM&I Au resource at a grade of 0.94g/t including277.8kozP2Aureserves(SRK2013PFS)
• SonaHill 2 –195kozs Ind.Auresourceat1.09g/t&241kozsInf. at 1.06 g/t located inhangingwall ofwest dipping shearzone with 90% of resource located from 0‐100m belowsurface
• Wynamu Hill 3 ‐ new discovery with gold intercepts insaproliteandfreshrockincluding:
• 7.51g/tAufromsurfaceto21.5minSaprolite
• 1.18 g/t Au over 19.5m from 42.5 ‐62m drill depth inFreshRock
• Several additional anomalies represent a pipeline of gold‐explorationtargetswithinthehydrothermalalterationhalo
SATELLITE DEPOSIT PIPELINEResources & Discoveries
1 SE Zone is 1.5 kms SE of Toroparu2 Sona Hill is 4.8 km SE of Toroparu3 Wynamu Hill is 9.1 km NW of Toroparu
17TSX-V: SSP | OTC: SSPXF
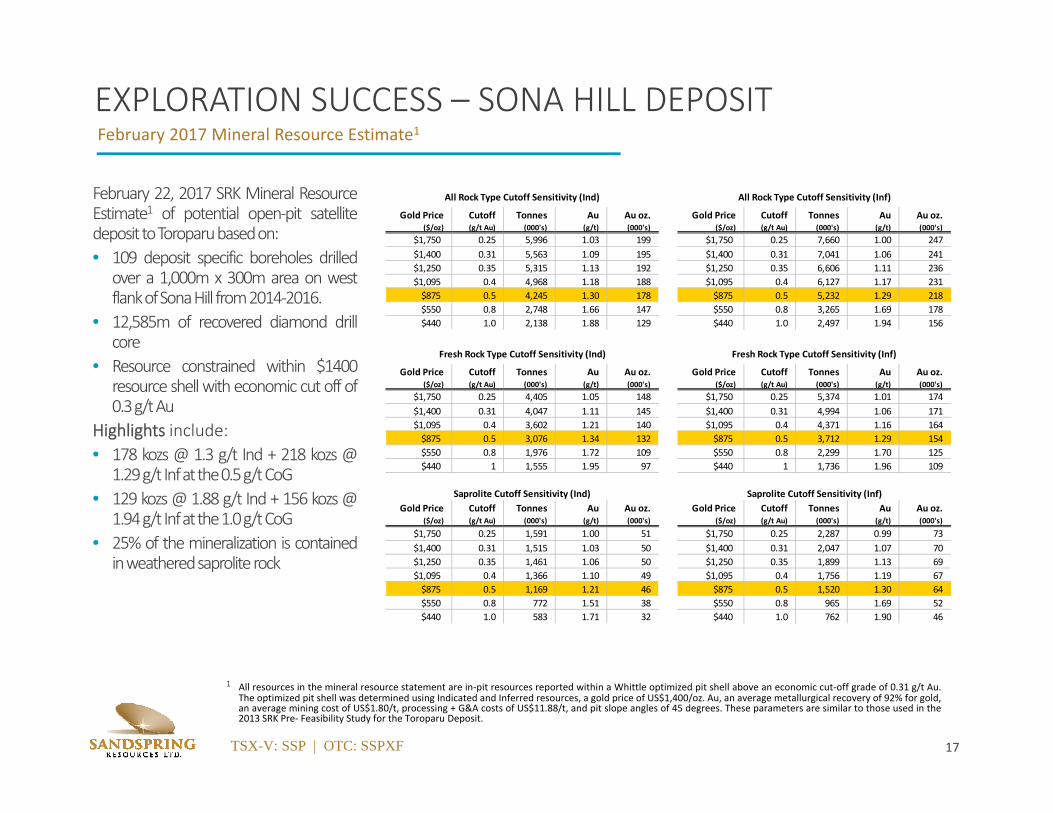
EXPLORATION SUCCESS – SONA HILL DEPOSITFebruary 2017 Mineral Resource Estimate1
February 22, 2017 SRK Mineral ResourceEstimate1 of potential open‐pit satellitedeposittoToroparubasedon:• 109 deposit specific boreholes drilled
over a 1,000m x 300m area on westflankofSonaHill from2014‐2016.
• 12,585m of recovered diamond drillcore
• Resource constrained within $1400resource shellwith economic cut off of0.3g/tAu
Highlights include: • 178 kozs @ 1.3 g/t Ind + 218 kozs @
1.29g/t Infatthe0.5g/tCoG• 129 [email protected] g/t Ind + 156 kozs@
1.94g/t Infatthe1.0g/tCoG• 25% of themineralization is contained
inweatheredsaproliterock
1 All resources in the mineral resource statement are in‐pit resources reported within a Whittle optimized pit shell above an economic cut‐off grade of 0.31 g/t Au.The optimized pit shell was determined using Indicated and Inferred resources, a gold price of US$1,400/oz. Au, an average metallurgical recovery of 92% for gold,an average mining cost of US$1.80/t, processing + G&A costs of US$11.88/t, and pit slope angles of 45 degrees. These parameters are similar to those used in the2013 SRK Pre‐ Feasibility Study for the Toroparu Deposit.
Gold Price($/oz)
Cutoff (g/t Au)
Tonnes (000's)
Au(g/t)
Au oz.(000's)
Gold Price($/oz)
Cutoff (g/t Au)
Tonnes (000's)
Au(g/t)
Au oz.(000's)
$1,750 0.25 5,996 1.03 199 $1,750 0.25 7,660 1.00 247$1,400 0.31 5,563 1.09 195 $1,400 0.31 7,041 1.06 241$1,250 0.35 5,315 1.13 192 $1,250 0.35 6,606 1.11 236$1,095 0.4 4,968 1.18 188 $1,095 0.4 6,127 1.17 231$875 0.5 4,245 1.30 178 $875 0.5 5,232 1.29 218$550 0.8 2,748 1.66 147 $550 0.8 3,265 1.69 178$440 1.0 2,138 1.88 129 $440 1.0 2,497 1.94 156
Gold Price($/oz)
Cutoff (g/t Au)
Tonnes (000's)
Au(g/t)
Au oz.(000's)
Gold Price($/oz)
Cutoff (g/t Au)
Tonnes (000's)
Au(g/t)
Au oz.(000's)
$1,750 0.25 4,405 1.05 148 $1,750 0.25 5,374 1.01 174$1,400 0.31 4,047 1.11 145 $1,400 0.31 4,994 1.06 171$1,095 0.4 3,602 1.21 140 $1,095 0.4 4,371 1.16 164$875 0.5 3,076 1.34 132 $875 0.5 3,712 1.29 154$550 0.8 1,976 1.72 109 $550 0.8 2,299 1.70 125$440 1 1,555 1.95 97 $440 1 1,736 1.96 109
Gold Price ($/oz)
Cutoff (g/t Au)
Tonnes (000's)
Au (g/t)
Au oz.(000's)
Gold Price ($/oz)
Cutoff (g/t Au)
Tonnes (000's)
Au (g/t)
Au oz.(000's)
$1,750 0.25 1,591 1.00 51 $1,750 0.25 2,287 0.99 73$1,400 0.31 1,515 1.03 50 $1,400 0.31 2,047 1.07 70$1,250 0.35 1,461 1.06 50 $1,250 0.35 1,899 1.13 69$1,095 0.4 1,366 1.10 49 $1,095 0.4 1,756 1.19 67$875 0.5 1,169 1.21 46 $875 0.5 1,520 1.30 64$550 0.8 772 1.51 38 $550 0.8 965 1.69 52$440 1.0 583 1.71 32 $440 1.0 762 1.90 46
All Rock Type Cutoff Sensitivity (Ind) All Rock Type Cutoff Sensitivity (Inf)
Saprolite Cutoff Sensitivity (Ind) Saprolite Cutoff Sensitivity (Inf)
Fresh Rock Type Cutoff Sensitivity (Ind) Fresh Rock Type Cutoff Sensitivity (Inf)
18TSX-V: SSP | OTC: SSPXF
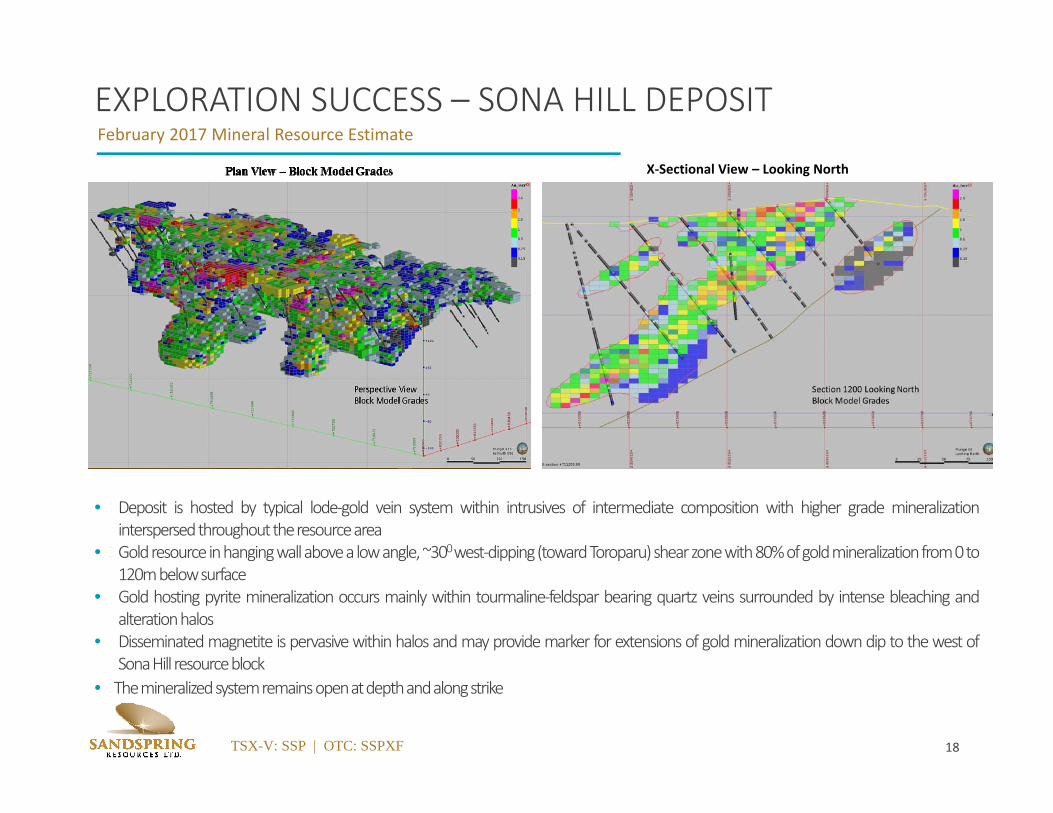
EXPLORATION SUCCESS – SONA HILL DEPOSITFebruary 2017 Mineral Resource Estimate
• Deposit is hosted by typical lode‐gold vein system within intrusives of intermediate composition with higher grade mineralizationinterspersedthroughouttheresourcearea
• Goldresourceinhangingwallabovealowangle,~300west‐dipping(towardToroparu)shearzonewith80%ofgoldmineralizationfrom0to120mbelowsurface
• Gold hosting pyrite mineralization occurs mainly within tourmaline‐feldspar bearing quartz veins surrounded by intense bleaching andalterationhalos
• Disseminatedmagnetite is pervasivewithin halos andmay providemarker for extensions of goldmineralization downdip to thewest ofSonaHill resourceblock
• Themineralizedsystemremainsopenatdepthandalongstrike
X‐Sectional View – Looking North
19TSX-V: SSP | OTC: SSPXF
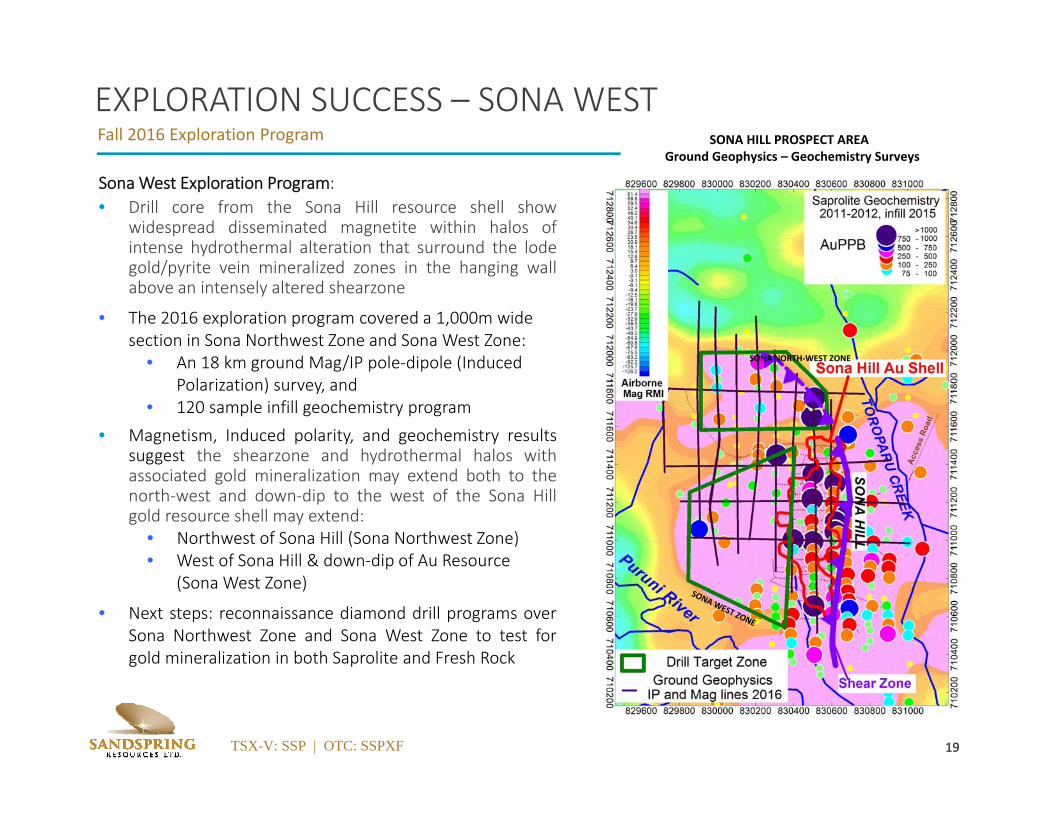
EXPLORATION SUCCESS – SONA WESTFall 2016 Exploration Program
19
Sona West Exploration Program:• Drill core from the Sona Hill resource shell show
widespread disseminated magnetite within halos ofintense hydrothermal alteration that surround the lodegold/pyrite vein mineralized zones in the hanging wallabove an intensely altered shearzone
• The 2016 exploration program covered a 1,000m wide section in Sona Northwest Zone and Sona West Zone:
• An 18 km ground Mag/IP pole‐dipole (Induced Polarization) survey, and
• 120 sample infill geochemistry program• Magnetism, Induced polarity, and geochemistry results
suggest the shearzone and hydrothermal halos withassociated gold mineralization may extend both to thenorth‐west and down‐dip to the west of the Sona Hillgold resource shell may extend:
• Northwest of Sona Hill (Sona Northwest Zone)• West of Sona Hill & down‐dip of Au Resource
(Sona West Zone)
• Next steps: reconnaissance diamond drill programs overSona Northwest Zone and Sona West Zone to test forgold mineralization in both Saprolite and Fresh Rock
SONA HILL PROSPECT AREA Ground Geophysics – Geochemistry Surveys
SONA NORTH‐WEST ZONE
20TSX-V: SSP | OTC: SSPXF
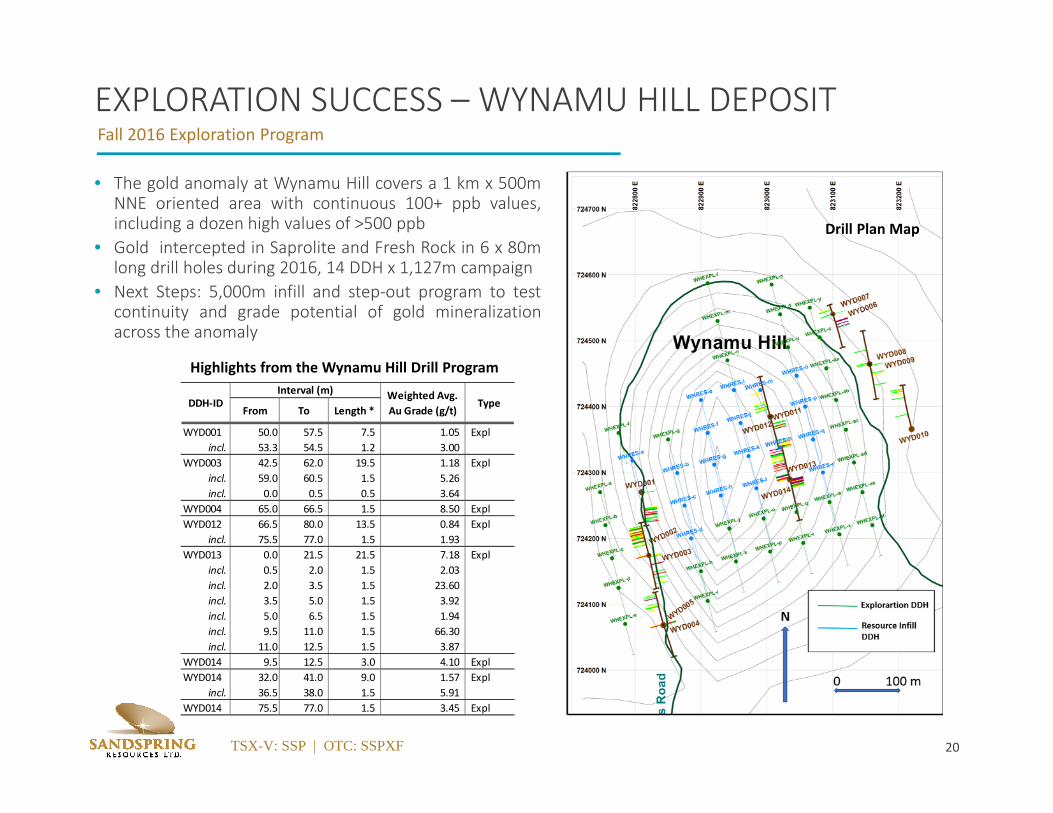
EXPLORATION SUCCESS – WYNAMU HILL DEPOSITFall 2016 Exploration Program
• The gold anomaly at Wynamu Hill covers a 1 km x 500mNNE oriented area with continuous 100+ ppb values,including a dozen high values of >500 ppb
• Gold intercepted in Saprolite and Fresh Rock in 6 x 80mlong drill holes during 2016, 14 DDH x 1,127m campaign
• Next Steps: 5,000m infill and step‐out program to testcontinuity and grade potential of gold mineralizationacross the anomaly
From To Length *
WYD001 50.0 57.5 7.5 1.05 Explincl. 53.3 54.5 1.2 3.00
WYD003 42.5 62.0 19.5 1.18 Explincl. 59.0 60.5 1.5 5.26 incl. 0.0 0.5 0.5 3.64
WYD004 65.0 66.5 1.5 8.50 ExplWYD012 66.5 80.0 13.5 0.84 Expl
incl. 75.5 77.0 1.5 1.93 WYD013 0.0 21.5 21.5 7.18 Expl
incl. 0.5 2.0 1.5 2.03 incl. 2.0 3.5 1.5 23.60 incl. 3.5 5.0 1.5 3.92 incl. 5.0 6.5 1.5 1.94 incl. 9.5 11.0 1.5 66.30 incl. 11.0 12.5 1.5 3.87
WYD014 9.5 12.5 3.0 4.10 ExplWYD014 32.0 41.0 9.0 1.57 Expl
incl. 36.5 38.0 1.5 5.91 WYD014 75.5 77.0 1.5 3.45 Expl
DDH‐IDInterval (m) Weighted Avg.
Au Grade (g/t)Type
Highlights from the Wynamu Hill Drill Program
Drill Plan Map
21TSX-V: SSP | OTC: SSPXF
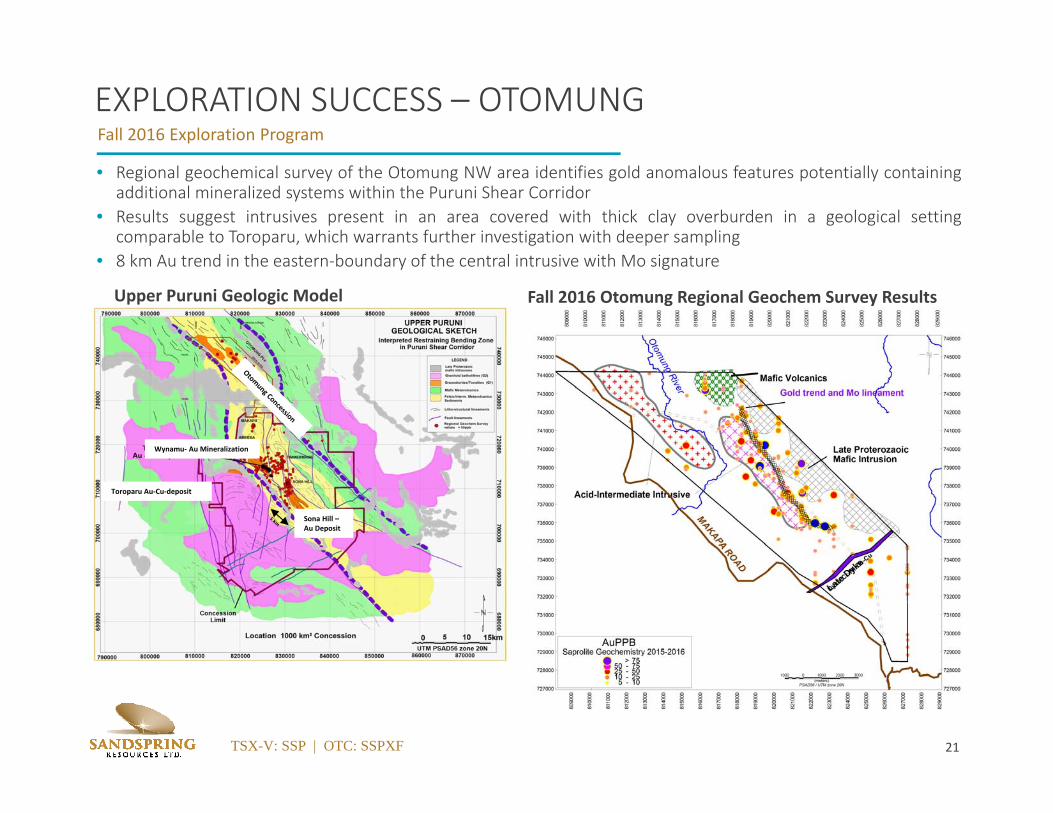
EXPLORATION SUCCESS – OTOMUNGFall 2016 Exploration Program
• Regional geochemical survey of the Otomung NW area identifies gold anomalous features potentially containingadditional mineralized systems within the Puruni Shear Corridor
• Results suggest intrusives present in an area covered with thick clay overburden in a geological settingcomparable to Toroparu, which warrants further investigation with deeper sampling
• 8 km Au trend in the eastern‐boundary of the central intrusive with Mo signature
Fall 2016 Otomung Regional Geochem Survey ResultsUpper Puruni Geologic Model
Wynamu‐ Au Mineralization
Toroparu Au‐Cu‐deposit
Sona Hill –Au Deposit
22TSX-V: SSP | OTC: SSPXF
EXPLORATION SUCCESS – OTOMUNGFall 2016 Exploration Program
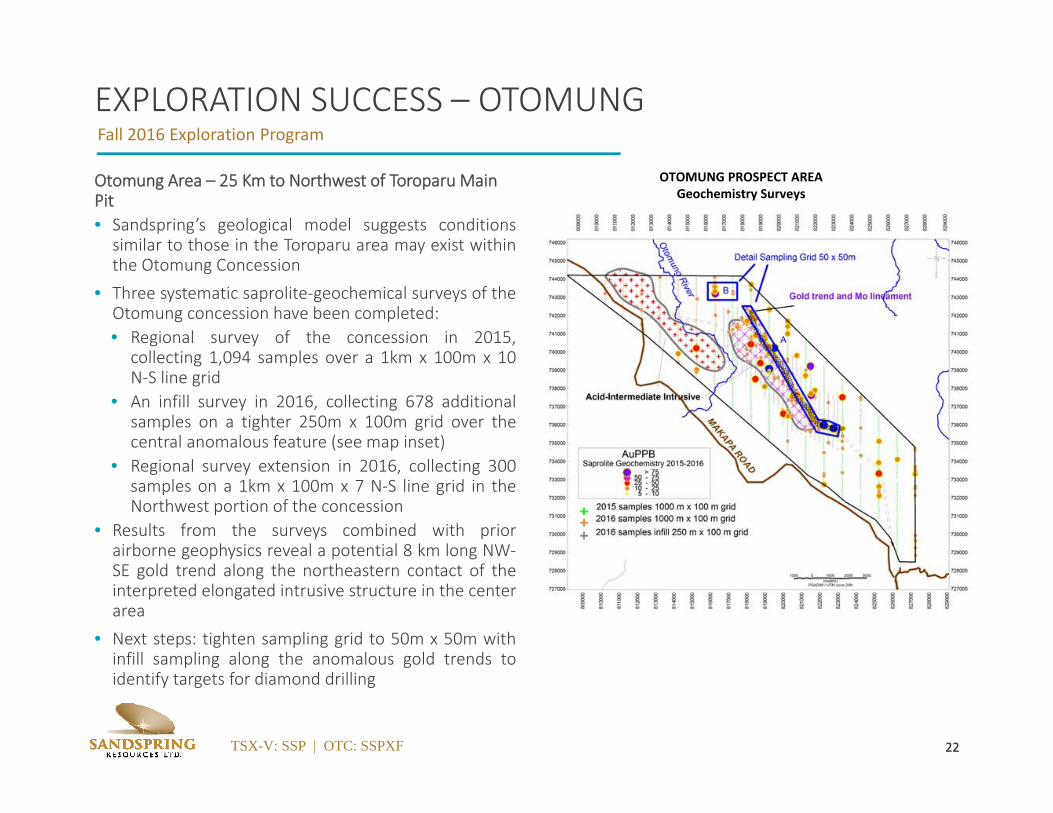
22
Otomung Area – 25 Km to Northwest of Toroparu Main Pit • Sandspring’s geological model suggests conditionssimilar to those in the Toroparu area may exist withinthe Otomung Concession
• Three systematic saprolite‐geochemical surveys of theOtomung concession have been completed:• Regional survey of the concession in 2015,
collecting 1,094 samples over a 1km x 100m x 10N‐S line grid
• An infill survey in 2016, collecting 678 additionalsamples on a tighter 250m x 100m grid over thecentral anomalous feature (see map inset)
• Regional survey extension in 2016, collecting 300samples on a 1km x 100m x 7 N‐S line grid in theNorthwest portion of the concession
• Results from the surveys combined with priorairborne geophysics reveal a potential 8 km long NW‐SE gold trend along the northeastern contact of theinterpreted elongated intrusive structure in the centerarea
• Next steps: tighten sampling grid to 50m x 50m withinfill sampling along the anomalous gold trends toidentify targets for diamond drilling
OTOMUNG PROSPECT AREA Geochemistry Surveys
TSX-V: SSP | OTC: SSPXF
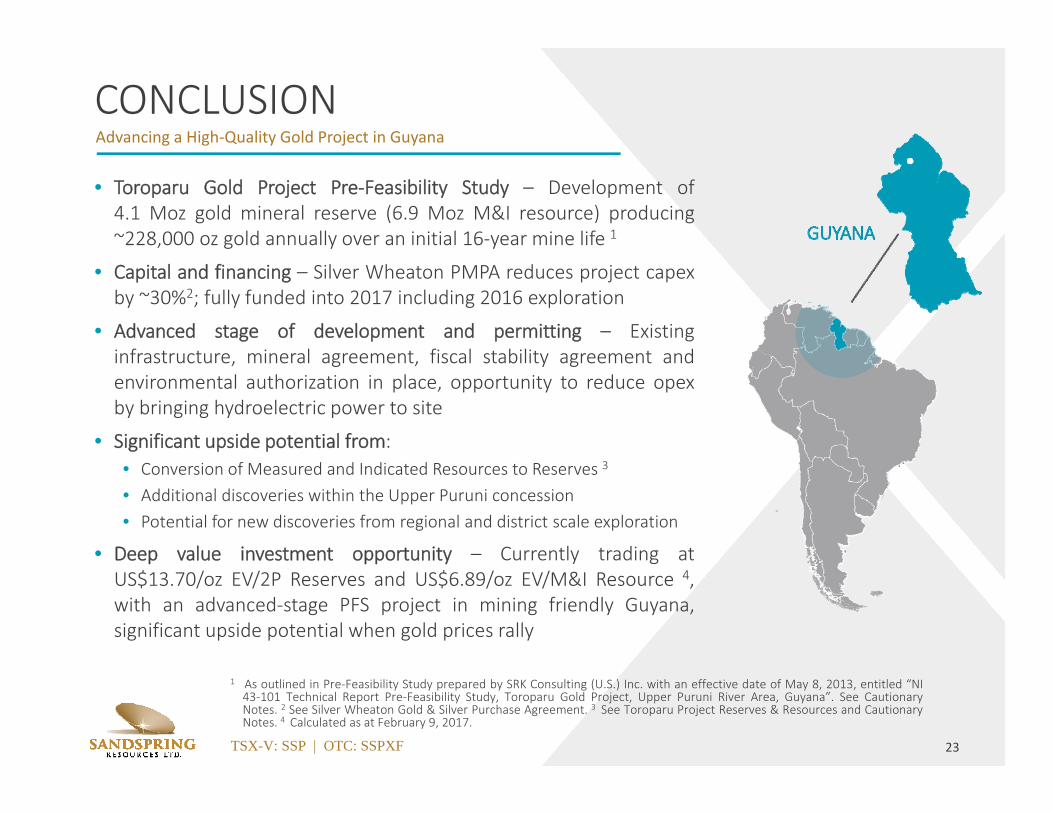
CONCLUSIONAdvancing a High‐Quality Gold Project in Guyana
• Toroparu Gold Project Pre‐Feasibility Study – Development of4.1 Moz gold mineral reserve (6.9 Moz M&I resource) producing~228,000 oz gold annually over an initial 16‐year mine life 1
• Capital and financing – Silver Wheaton PMPA reduces project capexby ~30%2; fully funded into 2017 including 2016 exploration
• Advanced stage of development and permitting – Existinginfrastructure, mineral agreement, fiscal stability agreement andenvironmental authorization in place, opportunity to reduce opexby bringing hydroelectric power to site
• Significant upside potential from:• Conversion of Measured and Indicated Resources to Reserves 3
• Additional discoveries within the Upper Puruni concession• Potential for new discoveries from regional and district scale exploration
• Deep value investment opportunity – Currently trading atUS$13.70/oz EV/2P Reserves and US$6.89/oz EV/M&I Resource 4,with an advanced‐stage PFS project in mining friendly Guyana,significant upside potential when gold prices rally
1 As outlined in Pre‐Feasibility Study prepared by SRK Consulting (U.S.) Inc. with an effective date of May 8, 2013, entitled “NI43‐101 Technical Report Pre‐Feasibility Study, Toroparu Gold Project, Upper Puruni River Area, Guyana”. See CautionaryNotes. 2 See Silver Wheaton Gold & Silver Purchase Agreement. 3 See Toroparu Project Reserves & Resources and CautionaryNotes. 4 Calculated as at February 9, 2017.
23
TSX-V: SSP | OTC: SSPXF 24
APPENDIX
25TSX-V: SSP | OTC: SSPXF
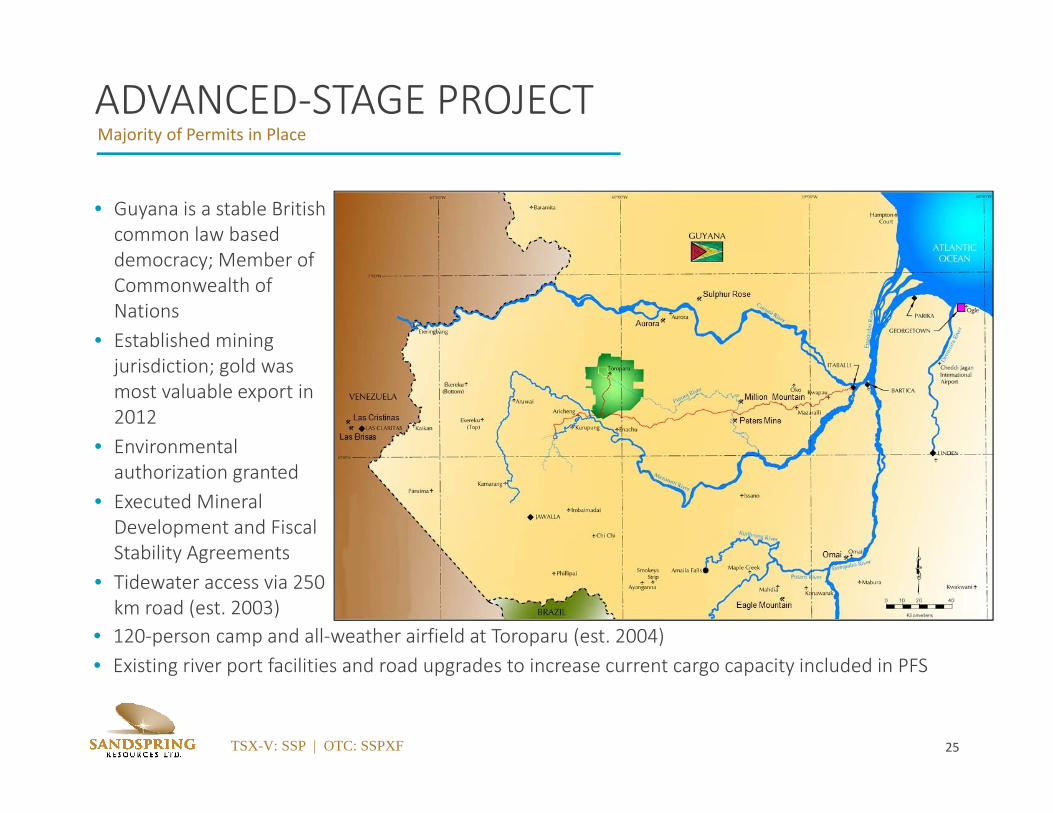
• Guyana is a stable British common law based democracy; Member of Commonwealth of Nations
• Established mining jurisdiction; gold was most valuable export in 2012
• Environmental authorization granted
• Executed Mineral Development and Fiscal Stability Agreements
• Tidewater access via 250 km road (est. 2003)
ADVANCED‐STAGE PROJECTMajority of Permits in Place
• 120‐person camp and all‐weather airfield at Toroparu (est. 2004)• Existing river port facilities and road upgrades to increase current cargo capacity included in PFS
26
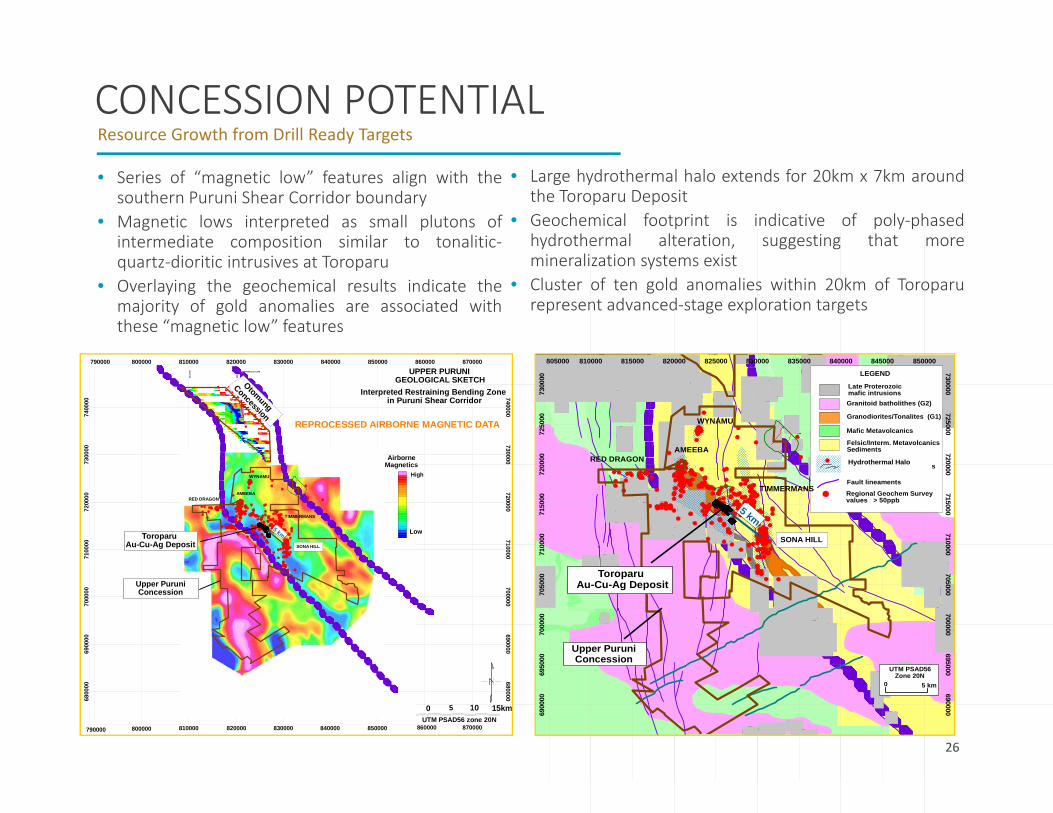
CONCESSION POTENTIALResource Growth from Drill Ready Targets
• Series of “magnetic low” features align with thesouthern Puruni Shear Corridor boundary
• Magnetic lows interpreted as small plutons ofintermediate composition similar to tonalitic‐quartz‐dioritic intrusives at Toroparu
• Overlaying the geochemical results indicate themajority of gold anomalies are associated withthese “magnetic low” features
• Large hydrothermal halo extends for 20km x 7km aroundthe Toroparu Deposit
• Geochemical footprint is indicative of poly‐phasedhydrothermal alteration, suggesting that moremineralization systems exist
• Cluster of ten gold anomalies within 20km of Toroparurepresent advanced‐stage exploration targets
AirborneMagnetics
High
Low
0 5 10 15km
6800
0069
0000
7000
0071
0000
7200
0073
0000
7400
00
680000690000
700000710000
720000730000
740000
790000 800000 810000 820000 830000 840000 850000 860000 870000
790000 800000 810000 820000 830000 840000 850000 860000 870000
UTM PSAD56 zone 20N
UPPER PURUNIGEOLOGICAL SKETCH 81
0,00
0
820,
000 UTM PSAD Zone 20N
Toroparu Au-Cu-Ag Deposit
Upper PuruniConcession
Interpreted Restraining Bending Zone in Puruni Shear Corridor
WYNAMU
TIMMERMANS
AMEEBARED DRAGON
Otomung
Concession
SONA HILL
5 km
REPROCESSED AIRBORNE MAGNETIC DATA?
069
0000
6950
0070
0000
7050
0071
0000
7150
0072
0000
7250
0073
0000
6690000
695000700000
705000710000
715000720000
725000730000
805000 810000 815000 820000 825000 830000 835000 840000 845000 850000
LEGEND
Granitoid batholithes (G2)
Granodiorites/Tonalites (G1)
Mafic Metavolcanics
Felsic/Interm. MetavolcanicsSediments
Litho-structural lineaments
Fault lineaments
Late Proterozoic mafic intrusions
Regional Geochem Surveyvalues > 50ppb
Hydrothermal Halo
Toroparu Au-Cu-Ag Deposit
Upper PuruniConcession
WYNAMU
TIMMERMANS
AMEEBARED DRAGON
SONA HILL
5 km
UTM PSAD56 Zone 20N
0 5 km
27TSX-V: SSP | OTC: SSPXF
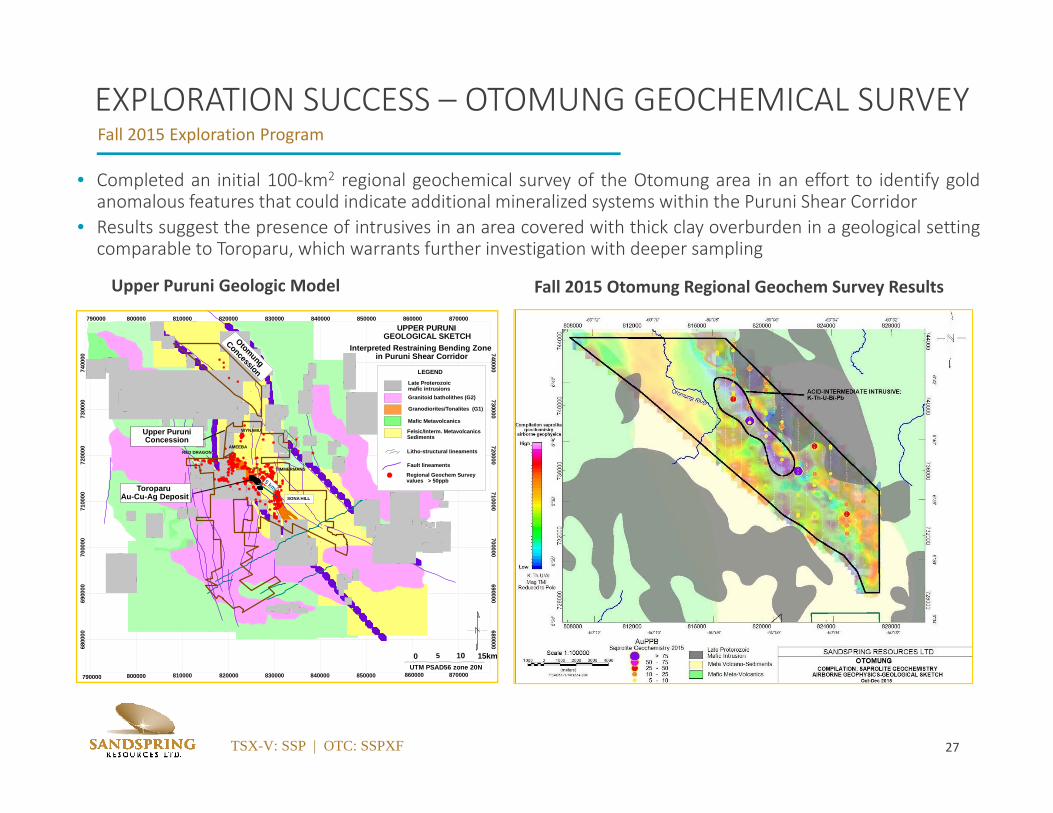
EXPLORATION SUCCESS – OTOMUNG GEOCHEMICAL SURVEYFall 2015 Exploration Program
• Completed an initial 100‐km2 regional geochemical survey of the Otomung area in an effort to identify goldanomalous features that could indicate additional mineralized systems within the Puruni Shear Corridor
• Results suggest the presence of intrusives in an area covered with thick clay overburden in a geological settingcomparable to Toroparu, which warrants further investigation with deeper sampling
Fall 2015 Otomung Regional Geochem Survey ResultsUpper Puruni Geologic Model
0 5 10 15km
6800
0069
0000
7000
0071
0000
7200
0073
0000
7400
00
680000690000
700000710000
720000730000
740000
790000 800000 810000 820000 830000 840000 850000 860000 870000
790000 800000 810000 820000 830000 840000 850000 860000 870000
UTM PSAD56 zone 20N
UPPER PURUNIGEOLOGICAL SKETCH 81
0,00
0
820,
000 UTM PSAD Zone 20N
?
LEGEND
Granitoid batholithes (G2)
Granodiorites/Tonalites (G1)
Mafic Metavolcanics
Felsic/Interm. MetavolcanicsSediments
Litho-structural lineaments
Fault lineaments
Late Proterozoic mafic intrusions
Regional Geochem Surveyvalues > 50ppb
Toroparu Au-Cu-Ag Deposit
Upper PuruniConcession
Interpreted Restraining Bending Zone in Puruni Shear Corridor
WYNAMU
TIMMERMANS
AMEEBARED DRAGON
Otomung
Concession
SONA HILL
5 km
28TSX-V: SSP | OTC: SSPXF
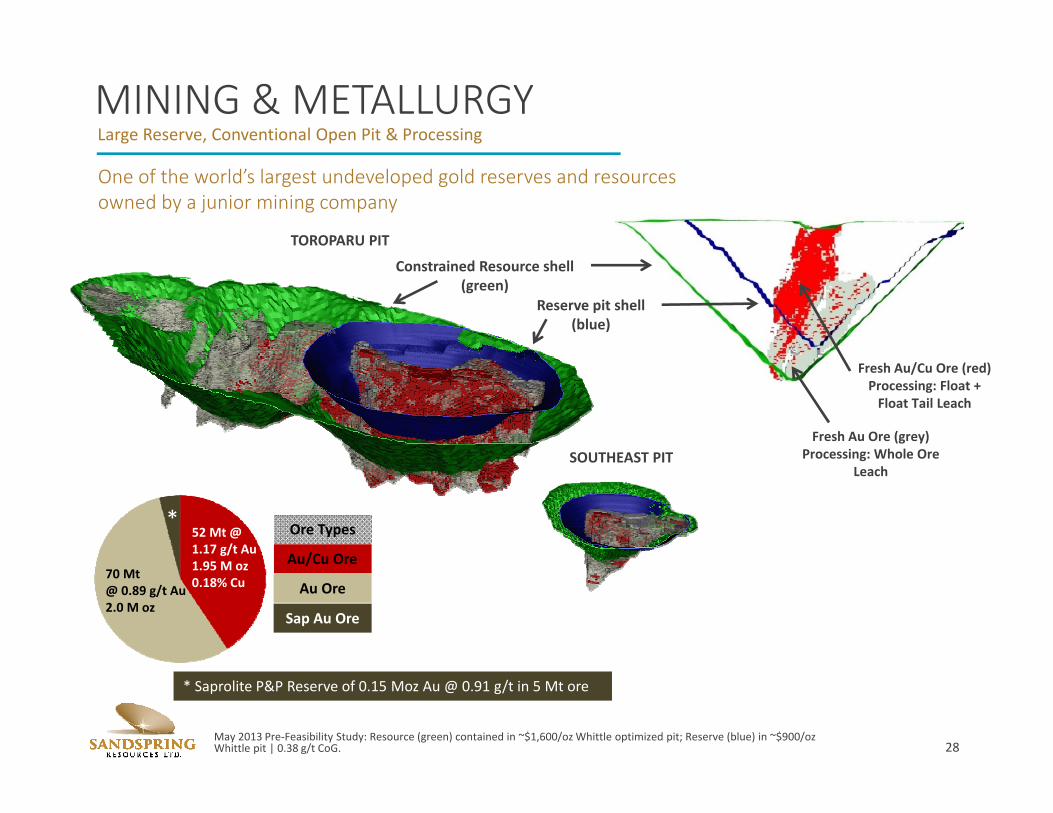
MINING & METALLURGYLarge Reserve, Conventional Open Pit & Processing
May 2013 Pre‐Feasibility Study: Resource (green) contained in ~$1,600/ozWhittle optimized pit; Reserve (blue) in ~$900/ozWhittle pit | 0.38 g/t CoG.
Au Ore
Au/Cu Ore
Sap Au Ore
Ore Types
Fresh Au/Cu Ore (red)Processing: Float + Float Tail Leach
Fresh Au Ore (grey)Processing: Whole Ore
Leach
Reserve pit shell (blue)
Constrained Resource shell (green)
70 Mt@ 0.89 g/t Au2.0 M oz
52 Mt @ 1.17 g/t Au 1.95 M oz0.18% Cu
*
* Saprolite P&P Reserve of 0.15 Moz Au @ 0.91 g/t in 5 Mt ore
One of the world’s largest undeveloped gold reserves and resources owned by a junior mining company
TOROPARU PIT
SOUTHEAST PIT
29
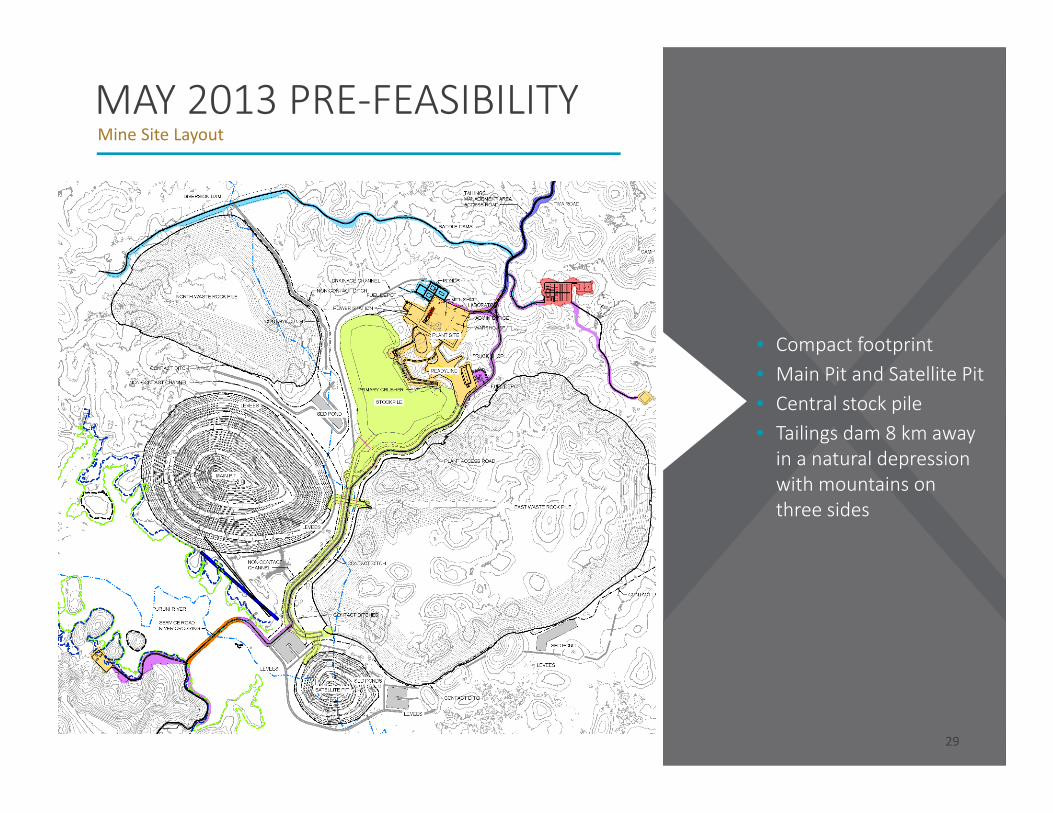
MAY 2013 PRE‐FEASIBILITY Mine Site Layout
• Compact footprint• Main Pit and Satellite Pit• Central stock pile• Tailings dam 8 km away in a natural depression with mountains on three sides
29
30TSX-V: SSP | OTC: SSPXF
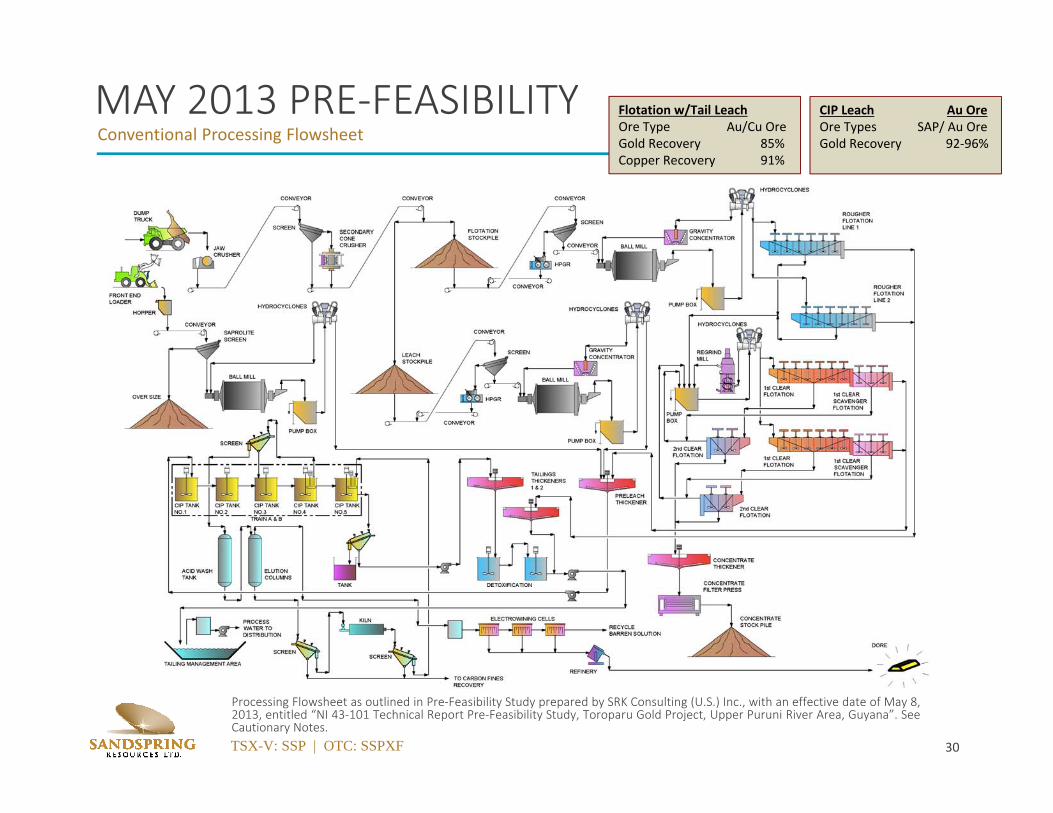
MAY 2013 PRE‐FEASIBILITYConventional Processing Flowsheet
Processing Flowsheet as outlined in Pre‐Feasibility Study prepared by SRK Consulting (U.S.) Inc., with an effective date of May 8,2013, entitled “NI 43‐101 Technical Report Pre‐Feasibility Study, Toroparu Gold Project, Upper Puruni River Area, Guyana”. SeeCautionary Notes.
Flotation w/Tail LeachOre Type Au/Cu Ore Gold Recovery 85% Copper Recovery 91%
CIP Leach Au Ore Ore Types SAP/ Au OreGold Recovery 92‐96%
31TSX-V: SSP | OTC: SSPXF
1 As outlined in Pre‐Feasibility Study prepared by SRK Consulting (U.S.) Inc. with an effective date of May 8, 2013, entitled “NI 43‐101 TechnicalReport Pre‐Feasibility Study, Toroparu Gold Project, Upper Puruni River Area, Guyana”. Cash operating cost is based on $/payable ounce andincludes on‐site operating costs and royalties, excludes taxes and is net of Cu by‐product. See Cautionary Notes.
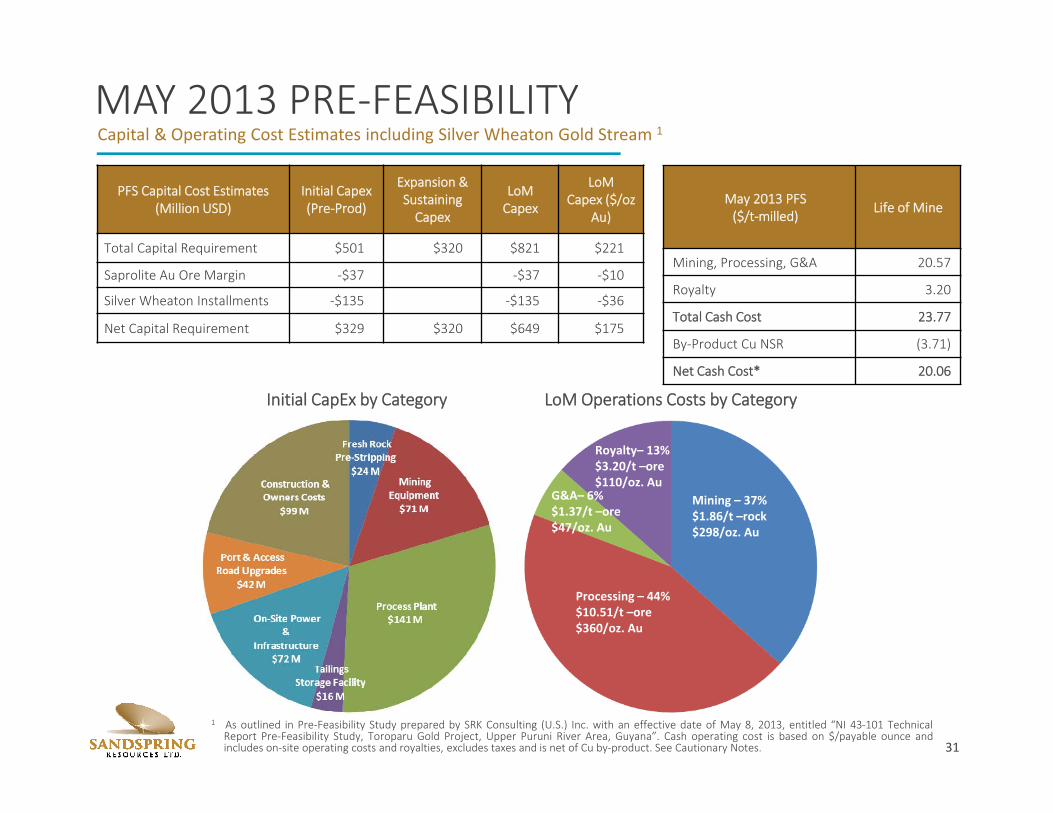
MAY 2013 PRE‐FEASIBILITYCapital & Operating Cost Estimates including Silver Wheaton Gold Stream 1
PFS Capital Cost Estimates (Million USD)
Initial Capex(Pre‐Prod)
Expansion &SustainingCapex
LoMCapex
LoMCapex ($/oz
Au)
Total Capital Requirement $501 $320 $821 $221
Saprolite Au Ore Margin ‐$37 ‐$37 ‐$10
Silver Wheaton Installments ‐$135 ‐$135 ‐$36
Net Capital Requirement $329 $320 $649 $175
Initial CapEx by Category LoM Operations Costs by Category
May 2013 PFS($/t‐milled) Life of Mine
Mining, Processing, G&A 20.57
Royalty 3.20
Total Cash Cost 23.77
By‐Product Cu NSR (3.71)
Net Cash Cost* 20.06
Mining $1.86/t‐mined
Mining – 37%$1.86/t –rock$298/oz. Au
Processing – 44%$10.51/t –ore$360/oz. Au
Royalty– 13%$3.20/t –ore$110/oz. Au
G&A– 6%$1.37/t –ore$47/oz. Au
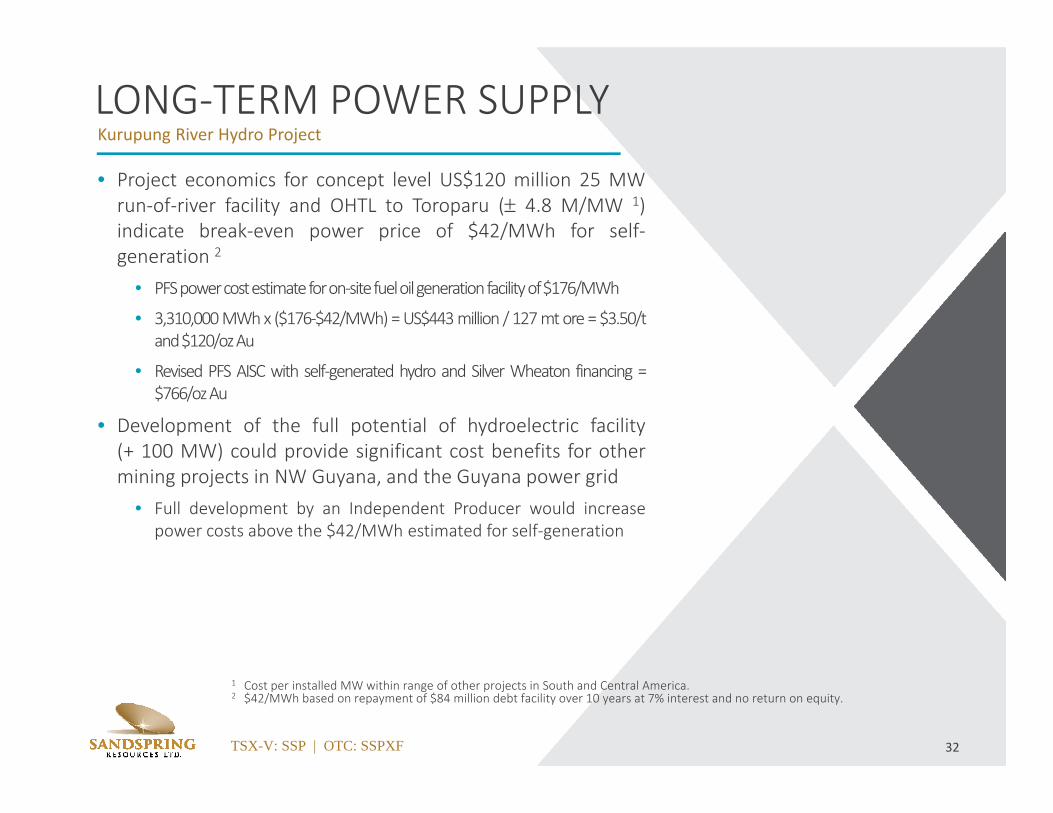
TSX-V: SSP | OTC: SSPXF
• Project economics for concept level US$120 million 25 MWrun‐of‐river facility and OHTL to Toroparu ( 4.8 M/MW 1)indicate break‐even power price of $42/MWh for self‐generation 2
• PFSpowercostestimateforon‐sitefueloilgenerationfacilityof$176/MWh
• 3,310,000MWhx ($176‐$42/MWh)=US$443million / 127mtore =$3.50/tand$120/ozAu
• Revised PFS AISC with self‐generated hydro and Silver Wheaton financing =$766/ozAu
• Development of the full potential of hydroelectric facility(+ 100 MW) could provide significant cost benefits for othermining projects in NW Guyana, and the Guyana power grid
• Full development by an Independent Producer would increasepower costs above the $42/MWh estimated for self‐generation
32
LONG‐TERM POWER SUPPLYKurupung River Hydro Project
1 Cost per installed MW within range of other projects in South and Central America.2 $42/MWh based on repayment of $84 million debt facility over 10 years at 7% interest and no return on equity.
33TSX-V: SSP | OTC: SSPXF
PRODUCTION & ECONOMIC PROFILEMay 2013 Pre‐Feasibility Study (1) (2)
1 Total initial capital estimated at US$501 million less profit from pre‐production mining.2 Cash operating cost is based on $/payable ounce and includes on‐site operating costs and royalties, excludes
taxes and is net of Cu by‐product.
34TSX-V: SSP | OTC: SSPXF
PRODUCTION SCHEDULEMay 2013 Pre‐Feasibility Study 1
1 Production Schedule as outlined in Pre‐Feasibility Study prepared by SRK Consulting (U.S.) Inc. with an effective date of May8, 2013, entitled “NI 43‐101 Technical Report Pre‐Feasibility Study, Toroparu Gold Project, Upper Puruni River Area,Guyana”. See Cautionary Notes.
35TSX-V: SSP | OTC: SSPXF
MINERAL RESERVESMay 2013 Pre‐Feasibility Study 1
1 Reserves estimated as part of Pre‐Feasibility Study prepared by SRK Consulting (U.S.) Inc. with an effective date of May 8, 2013, entitled “NI 43‐101 Technical Report Pre‐Feasibility Study, Toroparu Gold Project, Upper Puruni River Area, Guyana”. See Cautionary Notes.
MaterialReserve
ClassificationTonnes(000's)
Gold(g/t)
Gold(k oz.)* Copper (%)
Copper(M lb.)*
AuEq(g/t)
AuEq**(k oz.)*
Saprolite Au Ore
Proven 1,621 0.95 50 0.09 n/a n/a n/aProbable 3,400 0.90 98 0.10 n/a n/a n/aProven + Probable 5,022 0.91 148 0.10 n/a n/a n/a
Fresh Au Ore
Proven 13,976 0.93 419 0.05 n/a n/a n/aProbable 56,333 0.88 1,587 0.05 n/a n/a n/aProven + Probable 70,309 0.89 2,006 0.05 n/a n/a n/a
Fresh Au/Cu Ore
Proven 14,183 1.27 581 0.20 64 1.62 740Probable 37,597 1.14 1,373 0.18 147 1.44 1,740Proven + Probable 51,780 1.17 1,953 0.18 211 1.49 2,480
All Ore Types
Proven 29,780 1.10 1,049 0.13 64 1.26 1,209Probable 97,331 0.98 3,058 0.10 147 1.09 3,425Proven + Probable 127,111 1.00 4,107 0.11 211 1.13 4,634
Notes on Reserve Estimate:Reserves are based on a gold cutoff price of US$1,070/oz. for Fresh Rock and US$970/oz. for saprolite, and a cut‐off grade of $0.38 g/t Au for Fresh Rock and 0.35 g/t Au for saprolite. Cash flow Base Case used a goldprice of US$1,400/oz. and copper price of $3.25/lb.; open pit reserves assume full mine recovery; open pit reserves are diluted (further to dilution inherent in the resource model and assumes selective mining unit of 5m x 5 m x 5 m).
* Contained In‐situ Au ounces do not include metallurgical recoveries of 96% for gold in saprolite (Oxide), 85% for gold in Au/Cu Fresh Rock, 91% for copper in Au/Cu Fresh Rock, and 96% for gold in Au Fresh Rock.** AuEq Gold Equivalent oz. calculated using US$1,403/oz. Au ($1,394/oz. after refining), US$3.47/lb. Cu ($3.17/lb. after NSR deductions), 85.46% gold recovery, 91% copper recovery, Formula 1% Cu = 1.714 g/t‐Au).
Waste tonnes within pit is 468.9 Mt at a strip ratio of 3.69:1 (waste to ore); an open pit CoG of 0.35 g/t‐Au saprolite and 0.38 g/t‐Au Fresh Rock was applied to open pit resources constrained by the final pit design;mineral resource tonnage and contained metal have been rounded to reflect the accuracy of the estimate, and numbers may not add due to rounding; the mineral reserve estimate for Toroparu was calculated byFernando P. Rodrigues, BSc, MBA MMSAQP #01405QP of SRK, in accordance to CSA, NI 43‐101 standards and generally accepted CIM “Estimation of Mineral Resource and Mineral Reserves Best Practices” guidelines;and Reserves Effective Date: March 31, 2013.
36TSX-V: SSP | OTC: SSPXF
METALLURGICAL RECOVERY DETAILSMay 2013 Pre‐Feasibility Study 1
1 Metallurgical Recoveries as outlined in Pre‐Feasibility Study prepared by SRK Consulting (U.S.) Inc. with an effective date ofMay 8, 2013, entitled “NI 43‐101 Technical Report Pre‐Feasibility Study, Toroparu Gold Project, Upper Puruni River Area,Guyana”. See Cautionary Notes.
Metal Recoveries Pre‐Prod Year 1‐5 Year 1‐10 Life of Mine
Saprolite Au Ore Leach (Doré)Gold Recovery 98% 98% 88% 96%
Fresh Au/Cu Ore (Concentrate + Doré)Gold Recovery 88% 88% 88%Copper Recovery 91% 91% 91%
Fresh Au Ore Cyanide Leach (Doré)
Gold Recovery 95% 95%
Doré vs. Concentrate Production Gold in Doré 100% 65% 73% 78%Gold in Concentrate 35% 27% 22%
Concentrate
Annual Concentrate Production 42k dmt 30k dmt 26k dmtCopper Grade 21% 21% 21%Gold Grade 60 g/t 63 g/t 62 g/t
37TSX-V: SSP | OTC: SSPXF
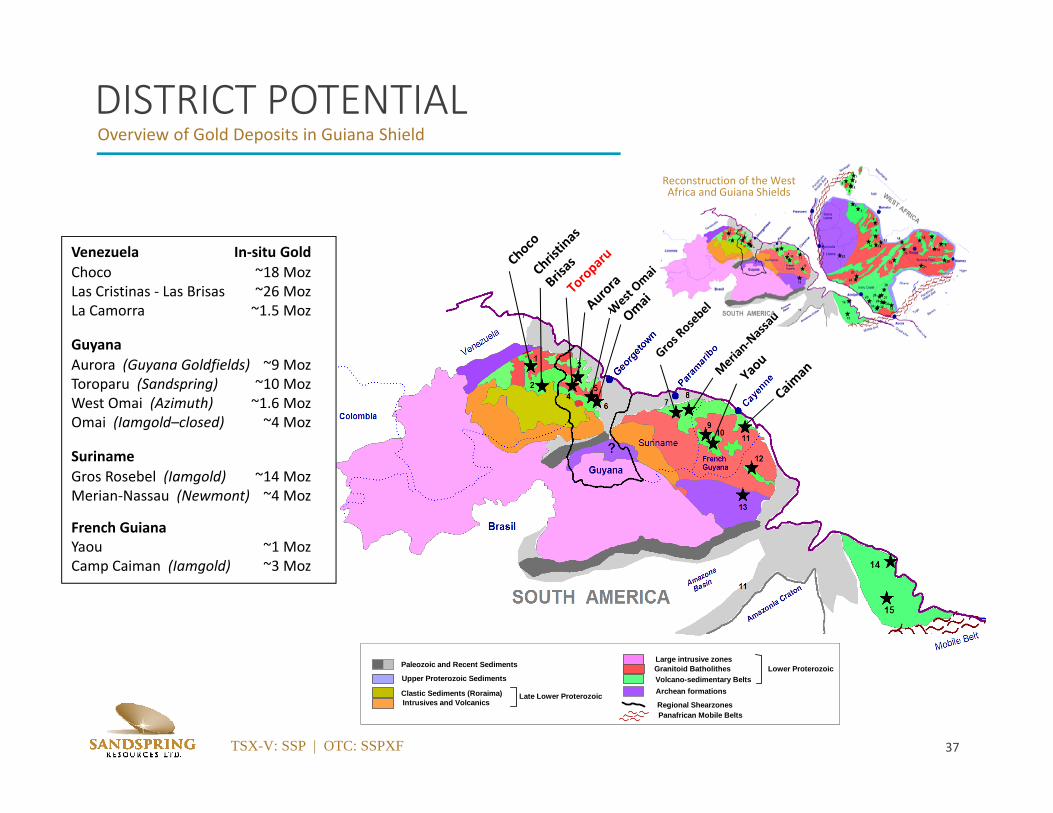
DISTRICT POTENTIALOverview of Gold Deposits in Guiana Shield
Venezuela In‐situ GoldChoco ~18 MozLas Cristinas ‐ Las Brisas ~26 MozLa Camorra ~1.5 Moz
GuyanaAurora (Guyana Goldfields) ~9 MozToroparu (Sandspring) ~10 MozWest Omai (Azimuth) ~1.6 MozOmai (Iamgold–closed) ~4 Moz
Suriname Gros Rosebel (Iamgold) ~14 MozMerian‐Nassau (Newmont) ~4 Moz
French Guiana Yaou ~1 MozCamp Caiman (Iamgold) ~3 Moz
Paleozoic and Recent Sediments
Upper Proterozoic Sediments
Clastic Sediments (Roraima)
Large intrusive zonesGranitoid BatholithesVolcano-sedimentary BeltsArchean formations
Regional ShearzonesPanafrican Mobile Belts
Lower Proterozoic
Late Lower ProterozoicIntrusives and Volcanics
Reconstruction of the West Africa and Guiana Shields
38TSX-V: SSP | OTC: SSPXF
?Georg
etown
Paramari
bo
Cayen
neBamako
Abidjan
Accra
Monrovia
Freetown
Ouaga
Niamey
Amazonia Craton
Mobile Belt Coast Line
Coast Line
Panafrican
Mobile Belt
Ghana
Niger
Benin
Burkina Faso
Ivory Coast
Liberia
Sierra Leone
Mali
SenegalMauritania
Panafric
an
Mobile
Belt
8Venezuela
14
15
12
34
5
67
8
9
10 11
12
13
14
15
1617
1819
2021
22
23
24
25
26
2728
2930
313233
Brasil
Suriname
Guyana
SOUTH AMERICA
WEST AFRICA
Colombia
French Guyana
Amazone
Basin
13
57
911
11
12
10
2
3
4
1
Togo
68
Paleozoic and Recent Sediments
Upper Proterozoic Sediments
Clastic Sediments (Roraima)
Large intrusive zonesGranitoid BatholithesVolcano-sedimentary Belts
Archean formations
Regional ShearzonesPanafrican Mobile Belts
Lower Proterozoic
Early Middle ProterozoicIntrusives and Volcanics
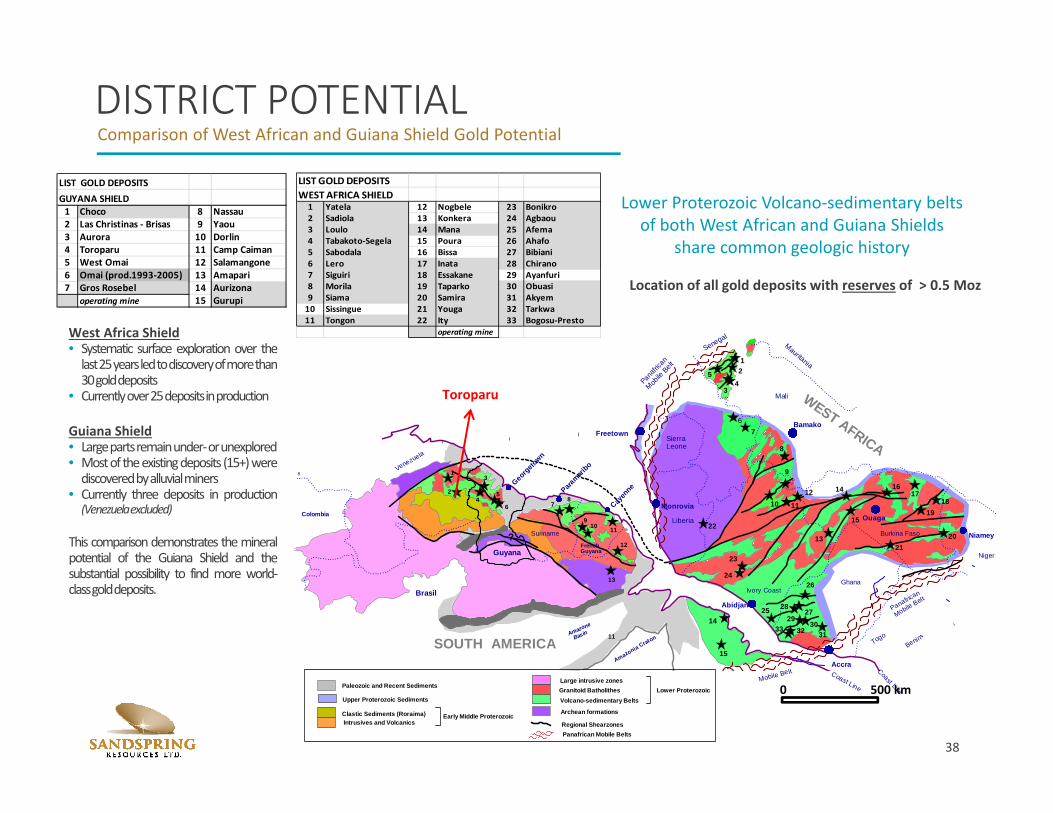
DISTRICT POTENTIALComparison of West African and Guiana Shield Gold Potential
Lower Proterozoic Volcano‐sedimentary belts of both West African and Guiana Shields
share common geologic history
0 500 km
West Africa Shield• Systematic surface exploration over thelast25yearsledtodiscoveryofmorethan30golddeposits
• Currentlyover25depositsinproduction
Guiana Shield• Largepartsremainunder‐orunexplored• Mostof theexistingdeposits (15+)werediscoveredbyalluvialminers
• Currently three deposits in production(Venezuelaexcluded)
This comparison demonstrates themineralpotential of the Guiana Shield and thesubstantial possibility to find more world‐classgolddeposits.
Location of all gold deposits with reserves of > 0.5 Moz
LIST GOLD DEPOSITSWEST AFRICA SHIELD1 Yatela 12 Nogbele 23 Bonikro2 Sadiola 13 Konkera 24 Agbaou3 Loulo 14 Mana 25 Afema4 Tabakoto‐Segela 15 Poura 26 Ahafo5 Sabodala 16 Bissa 27 Bibiani6 Lero 17 Inata 28 Chirano7 Siguiri 18 Essakane 29 Ayanfuri8 Morila 19 Taparko 30 Obuasi9 Siama 20 Samira 31 Akyem10 Sissingue 21 Youga 32 Tarkwa11 Tongon 22 Ity 33 Bogosu‐Presto
operating mine
LIST GOLD DEPOSITSGUYANA SHIELD1 Choco 8 Nassau2 Las Christinas ‐ Brisas 9 Yaou3 Aurora 10 Dorlin4 Toroparu 11 Camp Caiman5 West Omai 12 Salamangone6 Omai (prod.1993‐2005) 13 Amapari7 Gros Rosebel 14 Aurizona
operating mine 15 Gurupi
Toroparu
38