Topic/Statistics: Energy, Water and Environment Survey...
21
COUNTRY PRACTICE IN ENERGY STATISTICS Topic/Statistics: Energy, Water and Environment Survey (EWES) Institution/Organization: Australian Bureau of Statistics Country: Australia Date: April 2012
Transcript of Topic/Statistics: Energy, Water and Environment Survey...
COUNTRY PRACTICE IN ENERGY STATISTICS
Topic/Statistics: Energy, Water and Environment Survey
(EWES)
Institution/Organization: Australian Bureau of Statistics Country: Australia Date: April 2012
2
CONTENTS
Abstract .................................................................................................................................................. 3
1. General information......................................................................................................................... 5 1.1. Name of the statistics/topic ........................................................................................................ 5 1.2. History and purpose.................................................................................................................... 5 1.3. Reference period......................................................................................................................... 5 1.4. Frequency ................................................................................................................................... 5 1.5. Dissemination ............................................................................................................................. 5 1.6. Regional level............................................................................................................................. 6 1.7. Main users .................................................................................................................................. 6 1.8. Responsible authority ................................................................................................................. 6 1.9. Legal basis and legally binding commitments ........................................................................... 6 1.10. Resource requirements ..................................................................................................... 6 1.11. International reporting...................................................................................................... 7
2. Statistical concepts, methodology, variables and classifications .................................................. 7 2.1. Scope 7 2.2. Definitions of main concepts and variables...............................Error! Bookmark not defined. 2.3. Measurement units...................................................................................................................... 8 2.4. Classification scheme ................................................................................................................. 9 2.5. Data sources ..............................................................................Error! Bookmark not defined. 2.6. Population................................................................................................................................... 9 2.7. Sampling frame and sample characteristics.............................................................................. 10 2.8. Collection method .................................................................................................................... 10 2.9. Survey participation/response rate............................................................................................ 11
3. The statistical production process ................................................................................................ 11 3.1. Data capture and storage .......................................................................................................... 11 3.2. Data editing .............................................................................................................................. 11 3.3. Imputation ................................................................................................................................ 11 3.4. Grossing up procedures ............................................................................................................ 12 3.5. Analytical methods................................................................................................................... 13
4. Dissemination.................................................................................................................................. 13 4.1. Publications and additional documentation.............................................................................. 13 4.2. Revisions .................................................................................................................................. 13 4.3. Microdata.................................................................................................................................. 14 4.4. Confidentiality.......................................................................................................................... 14
5. Quality............................................................................................................................................. 14 5.1. Relevance ................................................................................................................................. 14 5.2. Accuracy................................................................................................................................... 14 5.3. Timeliness and punctuality....................................................................................................... 16 5.4. Accessibility ............................................................................................................................. 16 5.5. Comparability ........................................................................................................................... 16 5.6. Coherence and consistency....................................................................................................... 17
6. Future plans.................................................................................................................................... 17
Annexes ................................................................................................................................................ 18
3
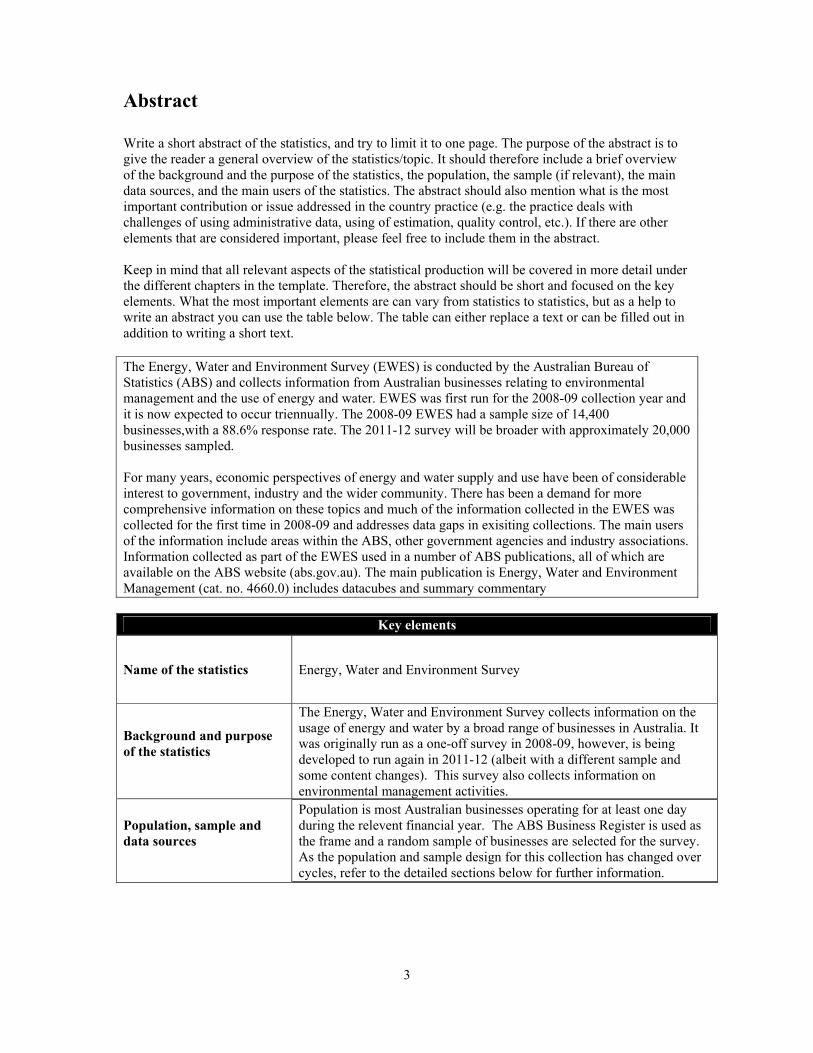
Abstract Write a short abstract of the statistics, and try to limit it to one page. The purpose of the abstract is to give the reader a general overview of the statistics/topic. It should therefore include a brief overview of the background and the purpose of the statistics, the population, the sample (if relevant), the main data sources, and the main users of the statistics. The abstract should also mention what is the most important contribution or issue addressed in the country practice (e.g. the practice deals with challenges of using administrative data, using of estimation, quality control, etc.). If there are other elements that are considered important, please feel free to include them in the abstract. Keep in mind that all relevant aspects of the statistical production will be covered in more detail under the different chapters in the template. Therefore, the abstract should be short and focused on the key elements. What the most important elements are can vary from statistics to statistics, but as a help to write an abstract you can use the table below. The table can either replace a text or can be filled out in addition to writing a short text. The Energy, Water and Environment Survey (EWES) is conducted by the Australian Bureau of Statistics (ABS) and collects information from Australian businesses relating to environmental management and the use of energy and water. EWES was first run for the 2008-09 collection year and it is now expected to occur triennually. The 2008-09 EWES had a sample size of 14,400 businesses,with a 88.6% response rate. The 2011-12 survey will be broader with approximately 20,000 businesses sampled. For many years, economic perspectives of energy and water supply and use have been of considerable interest to government, industry and the wider community. There has been a demand for more comprehensive information on these topics and much of the information collected in the EWES was collected for the first time in 2008-09 and addresses data gaps in exisiting collections. The main users of the information include areas within the ABS, other government agencies and industry associations. Information collected as part of the EWES used in a number of ABS publications, all of which are available on the ABS website (abs.gov.au). The main publication is Energy, Water and Environment Management (cat. no. 4660.0) includes datacubes and summary commentary
Key elements
Name of the statistics Energy, Water and Environment Survey
Background and purpose of the statistics
The Energy, Water and Environment Survey collects information on the usage of energy and water by a broad range of businesses in Australia. It was originally run as a one-off survey in 2008-09, however, is being developed to run again in 2011-12 (albeit with a different sample and some content changes). This survey also collects information on environmental management activities.
Population, sample and data sources
Population is most Australian businesses operating for at least one day during the relevent financial year. The ABS Business Register is used as the frame and a random sample of businesses are selected for the survey. As the population and sample design for this collection has changed over cycles, refer to the detailed sections below for further information.
4
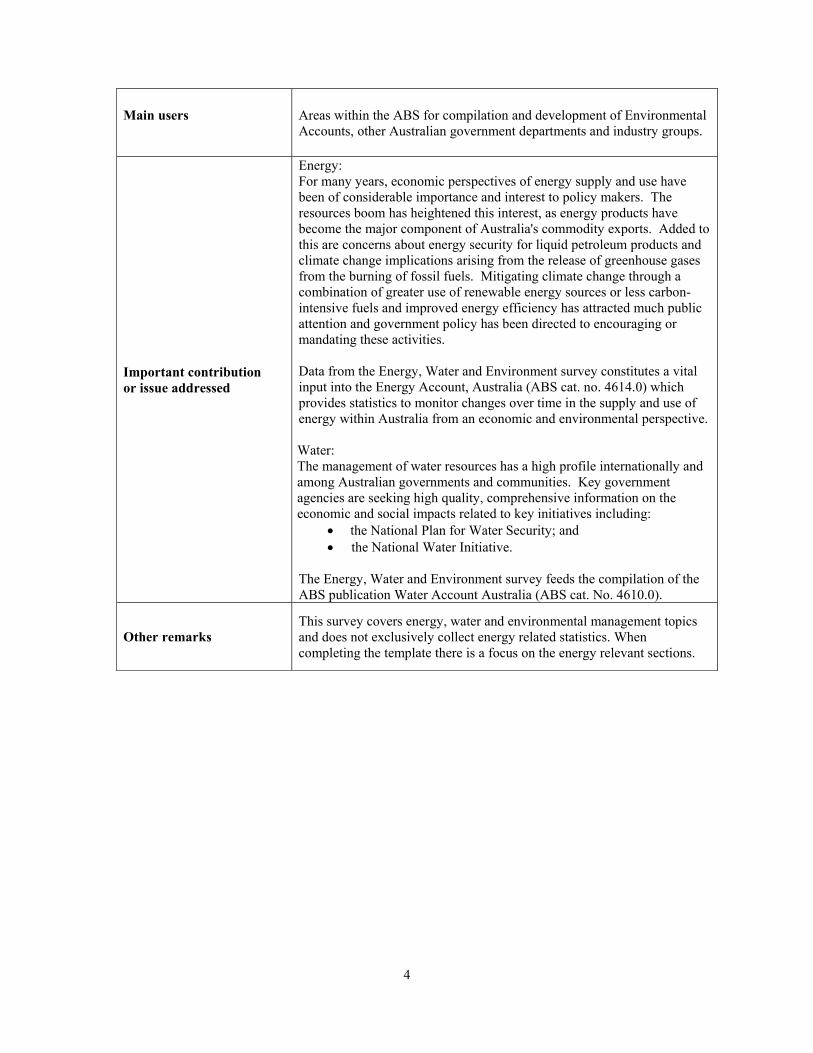
Main users
Areas within the ABS for compilation and development of Environmental Accounts, other Australian government departments and industry groups.
Important contribution or issue addressed
Energy: For many years, economic perspectives of energy supply and use have been of considerable importance and interest to policy makers. The resources boom has heightened this interest, as energy products have become the major component of Australia's commodity exports. Added to this are concerns about energy security for liquid petroleum products and climate change implications arising from the release of greenhouse gases from the burning of fossil fuels. Mitigating climate change through a combination of greater use of renewable energy sources or less carbon-intensive fuels and improved energy efficiency has attracted much public attention and government policy has been directed to encouraging or mandating these activities. Data from the Energy, Water and Environment survey constitutes a vital input into the Energy Account, Australia (ABS cat. no. 4614.0) which provides statistics to monitor changes over time in the supply and use of energy within Australia from an economic and environmental perspective. Water: The management of water resources has a high profile internationally and among Australian governments and communities. Key government agencies are seeking high quality, comprehensive information on the economic and social impacts related to key initiatives including:
• the National Plan for Water Security; and • the National Water Initiative.
The Energy, Water and Environment survey feeds the compilation of the ABS publication Water Account Australia (ABS cat. No. 4610.0).
Other remarks This survey covers energy, water and environmental management topics and does not exclusively collect energy related statistics. When completing the template there is a focus on the energy relevant sections.
5
1. General information
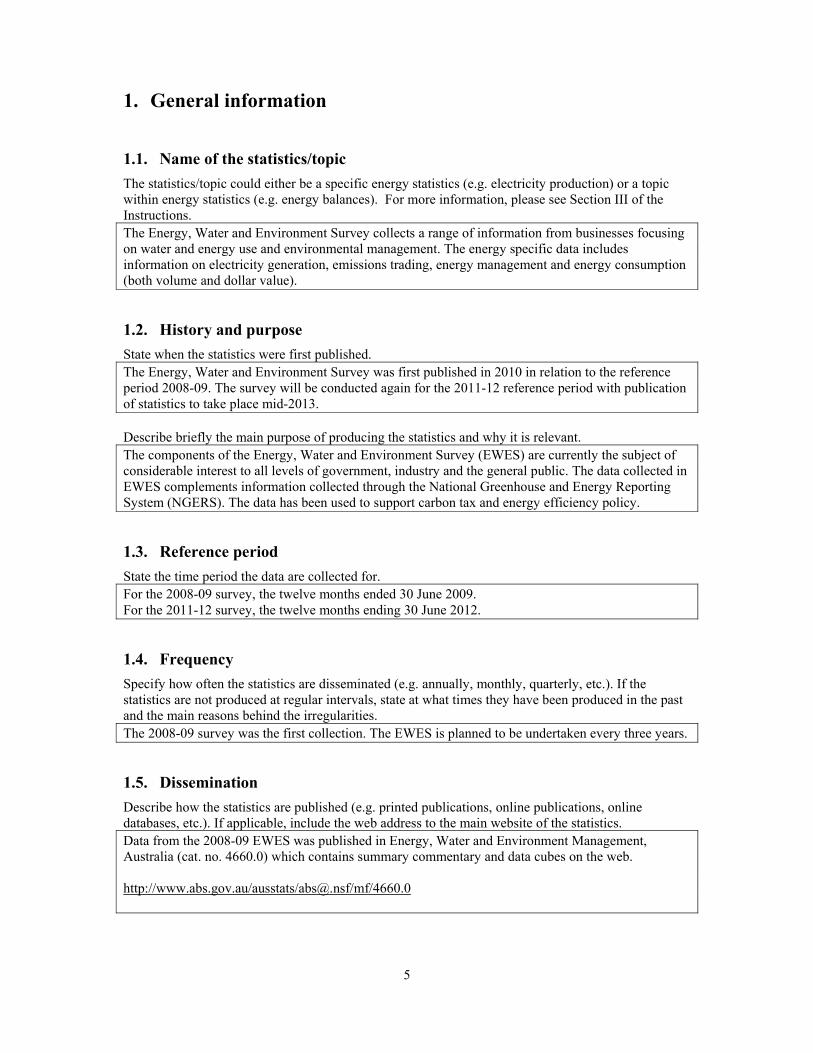
1.1. Name of the statistics/topic The statistics/topic could either be a specific energy statistics (e.g. electricity production) or a topic within energy statistics (e.g. energy balances). For more information, please see Section III of the Instructions. The Energy, Water and Environment Survey collects a range of information from businesses focusing on water and energy use and environmental management. The energy specific data includes information on electricity generation, emissions trading, energy management and energy consumption (both volume and dollar value).
1.2. History and purpose State when the statistics were first published. The Energy, Water and Environment Survey was first published in 2010 in relation to the reference period 2008-09. The survey will be conducted again for the 2011-12 reference period with publication of statistics to take place mid-2013. Describe briefly the main purpose of producing the statistics and why it is relevant. The components of the Energy, Water and Environment Survey (EWES) are currently the subject of considerable interest to all levels of government, industry and the general public. The data collected in EWES complements information collected through the National Greenhouse and Energy Reporting System (NGERS). The data has been used to support carbon tax and energy efficiency policy.
1.3. Reference period State the time period the data are collected for. For the 2008-09 survey, the twelve months ended 30 June 2009. For the 2011-12 survey, the twelve months ending 30 June 2012.
1.4. Frequency Specify how often the statistics are disseminated (e.g. annually, monthly, quarterly, etc.). If the statistics are not produced at regular intervals, state at what times they have been produced in the past and the main reasons behind the irregularities. The 2008-09 survey was the first collection. The EWES is planned to be undertaken every three years.
1.5. Dissemination Describe how the statistics are published (e.g. printed publications, online publications, online databases, etc.). If applicable, include the web address to the main website of the statistics. Data from the 2008-09 EWES was published in Energy, Water and Environment Management, Australia (cat. no. 4660.0) which contains summary commentary and data cubes on the web. http://www.abs.gov.au/ausstats/[email protected]/mf/4660.0
6
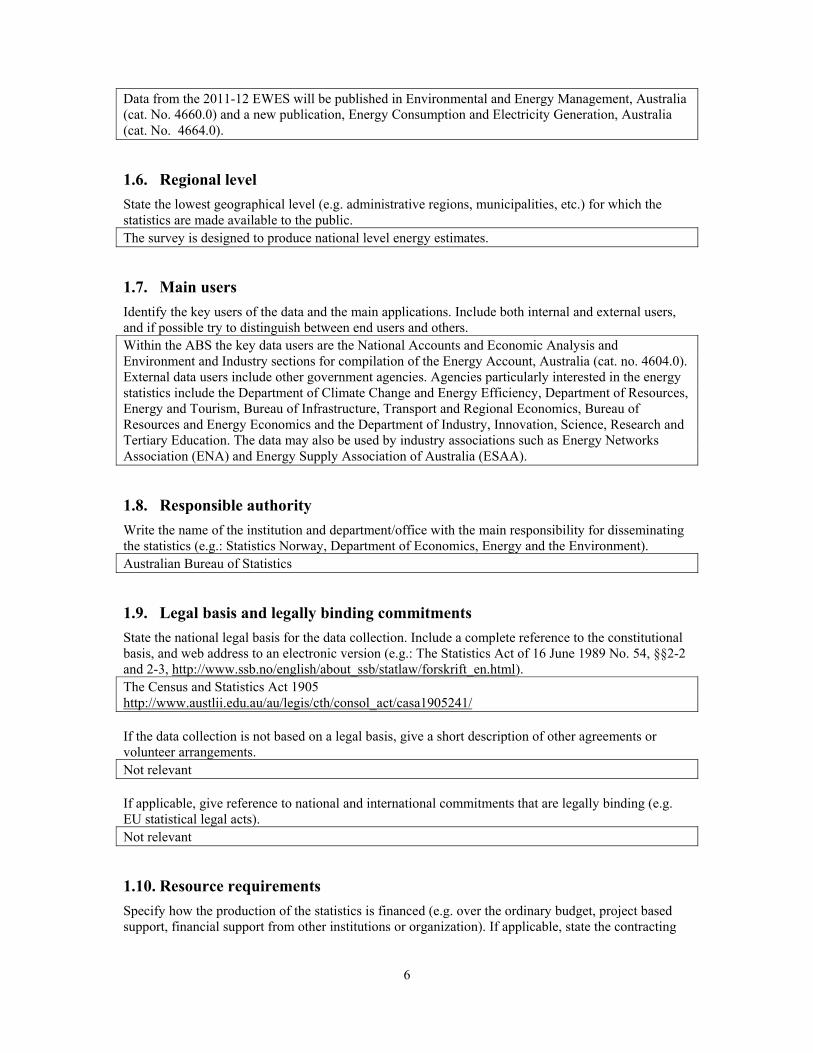
Data from the 2011-12 EWES will be published in Environmental and Energy Management, Australia (cat. No. 4660.0) and a new publication, Energy Consumption and Electricity Generation, Australia (cat. No. 4664.0).
1.6. Regional level State the lowest geographical level (e.g. administrative regions, municipalities, etc.) for which the statistics are made available to the public. The survey is designed to produce national level energy estimates.
1.7. Main users Identify the key users of the data and the main applications. Include both internal and external users, and if possible try to distinguish between end users and others. Within the ABS the key data users are the National Accounts and Economic Analysis and Environment and Industry sections for compilation of the Energy Account, Australia (cat. no. 4604.0). External data users include other government agencies. Agencies particularly interested in the energy statistics include the Department of Climate Change and Energy Efficiency, Department of Resources, Energy and Tourism, Bureau of Infrastructure, Transport and Regional Economics, Bureau of Resources and Energy Economics and the Department of Industry, Innovation, Science, Research and Tertiary Education. The data may also be used by industry associations such as Energy Networks Association (ENA) and Energy Supply Association of Australia (ESAA).
1.8. Responsible authority Write the name of the institution and department/office with the main responsibility for disseminating the statistics (e.g.: Statistics Norway, Department of Economics, Energy and the Environment). Australian Bureau of Statistics
1.9. Legal basis and legally binding commitments State the national legal basis for the data collection. Include a complete reference to the constitutional basis, and web address to an electronic version (e.g.: The Statistics Act of 16 June 1989 No. 54, §§2-2 and 2-3, http://www.ssb.no/english/about_ssb/statlaw/forskrift_en.html). The Census and Statistics Act 1905 http://www.austlii.edu.au/au/legis/cth/consol_act/casa1905241/ If the data collection is not based on a legal basis, give a short description of other agreements or volunteer arrangements. Not relevant If applicable, give reference to national and international commitments that are legally binding (e.g. EU statistical legal acts). Not relevant
1.10. Resource requirements Specify how the production of the statistics is financed (e.g. over the ordinary budget, project based support, financial support from other institutions or organization). If applicable, state the contracting
7
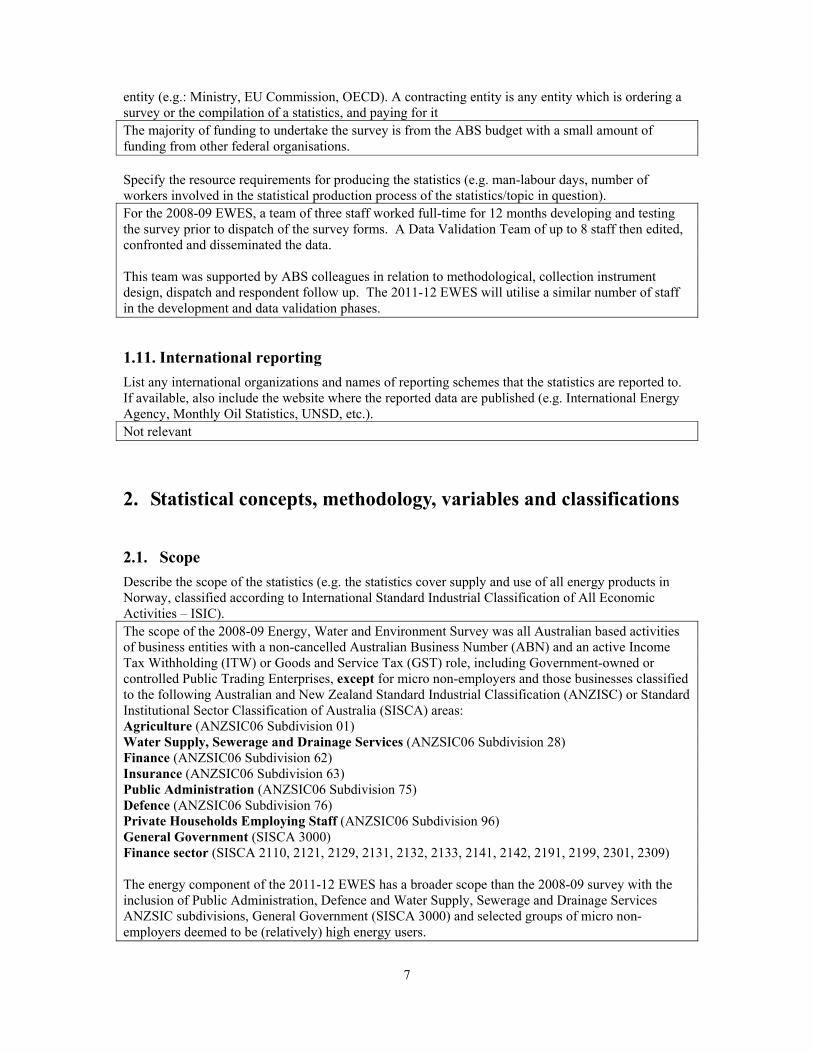
entity (e.g.: Ministry, EU Commission, OECD). A contracting entity is any entity which is ordering a survey or the compilation of a statistics, and paying for it The majority of funding to undertake the survey is from the ABS budget with a small amount of funding from other federal organisations. Specify the resource requirements for producing the statistics (e.g. man-labour days, number of workers involved in the statistical production process of the statistics/topic in question). For the 2008-09 EWES, a team of three staff worked full-time for 12 months developing and testing the survey prior to dispatch of the survey forms. A Data Validation Team of up to 8 staff then edited, confronted and disseminated the data. This team was supported by ABS colleagues in relation to methodological, collection instrument design, dispatch and respondent follow up. The 2011-12 EWES will utilise a similar number of staff in the development and data validation phases.
1.11. International reporting List any international organizations and names of reporting schemes that the statistics are reported to. If available, also include the website where the reported data are published (e.g. International Energy Agency, Monthly Oil Statistics, UNSD, etc.). Not relevant
2. Statistical concepts, methodology, variables and classifications
2.1. Scope Describe the scope of the statistics (e.g. the statistics cover supply and use of all energy products in Norway, classified according to International Standard Industrial Classification of All Economic Activities – ISIC). The scope of the 2008-09 Energy, Water and Environment Survey was all Australian based activities of business entities with a non-cancelled Australian Business Number (ABN) and an active Income Tax Withholding (ITW) or Goods and Service Tax (GST) role, including Government-owned or controlled Public Trading Enterprises, except for micro non-employers and those businesses classified to the following Australian and New Zealand Standard Industrial Classification (ANZISC) or Standard Institutional Sector Classification of Australia (SISCA) areas: Agriculture (ANZSIC06 Subdivision 01) Water Supply, Sewerage and Drainage Services (ANZSIC06 Subdivision 28) Finance (ANZSIC06 Subdivision 62) Insurance (ANZSIC06 Subdivision 63) Public Administration (ANZSIC06 Subdivision 75) Defence (ANZSIC06 Subdivision 76) Private Households Employing Staff (ANZSIC06 Subdivision 96) General Government (SISCA 3000) Finance sector (SISCA 2110, 2121, 2129, 2131, 2132, 2133, 2141, 2142, 2191, 2199, 2301, 2309) The energy component of the 2011-12 EWES has a broader scope than the 2008-09 survey with the inclusion of Public Administration, Defence and Water Supply, Sewerage and Drainage Services ANZSIC subdivisions, General Government (SISCA 3000) and selected groups of micro non-employers deemed to be (relatively) high energy users.
8
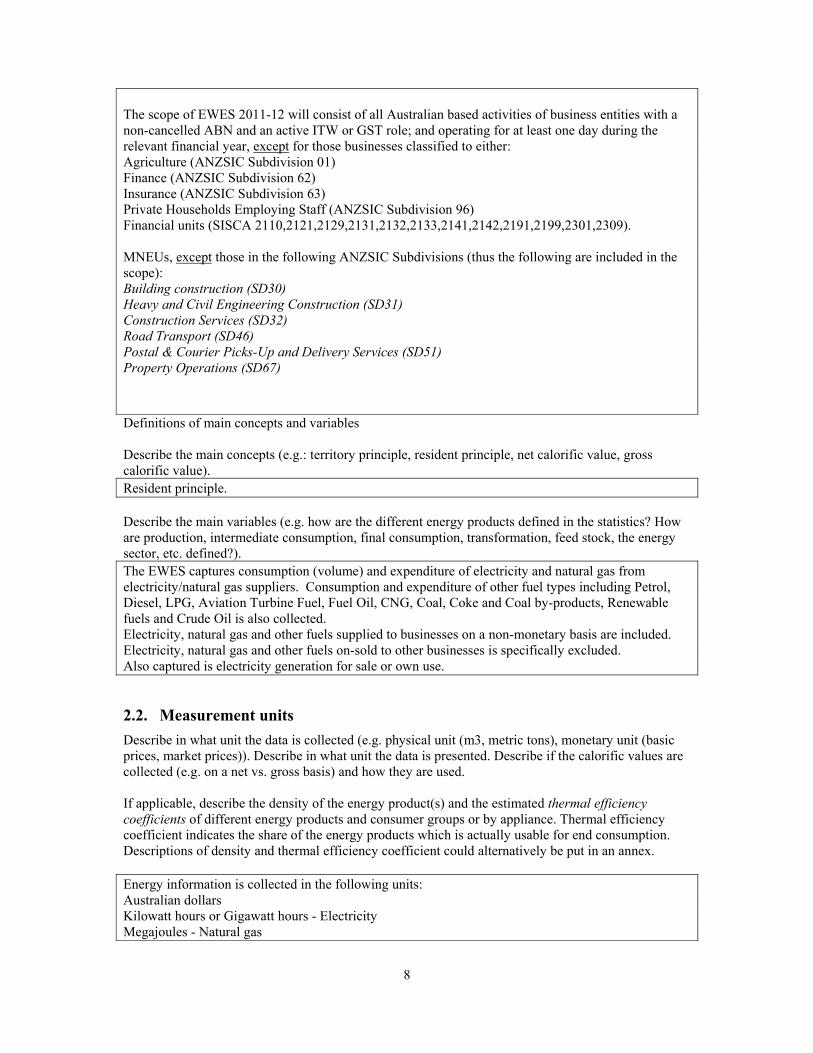
The scope of EWES 2011-12 will consist of all Australian based activities of business entities with a non-cancelled ABN and an active ITW or GST role; and operating for at least one day during the relevant financial year, except for those businesses classified to either: Agriculture (ANZSIC Subdivision 01) Finance (ANZSIC Subdivision 62) Insurance (ANZSIC Subdivision 63) Private Households Employing Staff (ANZSIC Subdivision 96) Financial units (SISCA 2110,2121,2129,2131,2132,2133,2141,2142,2191,2199,2301,2309). MNEUs, except those in the following ANZSIC Subdivisions (thus the following are included in the scope): Building construction (SD30) Heavy and Civil Engineering Construction (SD31) Construction Services (SD32) Road Transport (SD46) Postal & Courier Picks-Up and Delivery Services (SD51) Property Operations (SD67)
Definitions of main concepts and variables Describe the main concepts (e.g.: territory principle, resident principle, net calorific value, gross calorific value). Resident principle. Describe the main variables (e.g. how are the different energy products defined in the statistics? How are production, intermediate consumption, final consumption, transformation, feed stock, the energy sector, etc. defined?). The EWES captures consumption (volume) and expenditure of electricity and natural gas from electricity/natural gas suppliers. Consumption and expenditure of other fuel types including Petrol, Diesel, LPG, Aviation Turbine Fuel, Fuel Oil, CNG, Coal, Coke and Coal by-products, Renewable fuels and Crude Oil is also collected. Electricity, natural gas and other fuels supplied to businesses on a non-monetary basis are included. Electricity, natural gas and other fuels on-sold to other businesses is specifically excluded. Also captured is electricity generation for sale or own use.
2.2. Measurement units Describe in what unit the data is collected (e.g. physical unit (m3, metric tons), monetary unit (basic prices, market prices)). Describe in what unit the data is presented. Describe if the calorific values are collected (e.g. on a net vs. gross basis) and how they are used. If applicable, describe the density of the energy product(s) and the estimated thermal efficiency coefficients of different energy products and consumer groups or by appliance. Thermal efficiency coefficient indicates the share of the energy products which is actually usable for end consumption. Descriptions of density and thermal efficiency coefficient could alternatively be put in an annex. Energy information is collected in the following units: Australian dollars Kilowatt hours or Gigawatt hours - Electricity Megajoules - Natural gas
9
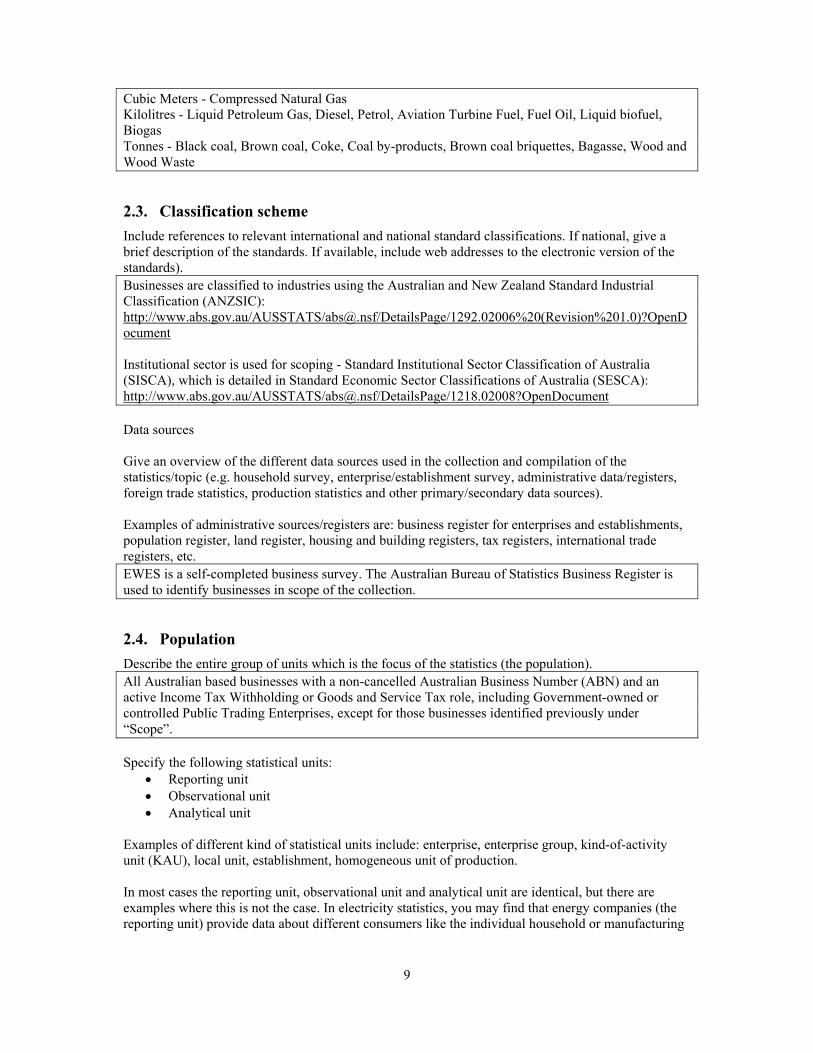
Cubic Meters - Compressed Natural Gas Kilolitres - Liquid Petroleum Gas, Diesel, Petrol, Aviation Turbine Fuel, Fuel Oil, Liquid biofuel, Biogas Tonnes - Black coal, Brown coal, Coke, Coal by-products, Brown coal briquettes, Bagasse, Wood and Wood Waste
2.3. Classification scheme Include references to relevant international and national standard classifications. If national, give a brief description of the standards. If available, include web addresses to the electronic version of the standards). Businesses are classified to industries using the Australian and New Zealand Standard Industrial Classification (ANZSIC): http://www.abs.gov.au/AUSSTATS/[email protected]/DetailsPage/1292.02006%20(Revision%201.0)?OpenDocument Institutional sector is used for scoping - Standard Institutional Sector Classification of Australia (SISCA), which is detailed in Standard Economic Sector Classifications of Australia (SESCA): http://www.abs.gov.au/AUSSTATS/[email protected]/DetailsPage/1218.02008?OpenDocument Data sources Give an overview of the different data sources used in the collection and compilation of the statistics/topic (e.g. household survey, enterprise/establishment survey, administrative data/registers, foreign trade statistics, production statistics and other primary/secondary data sources). Examples of administrative sources/registers are: business register for enterprises and establishments, population register, land register, housing and building registers, tax registers, international trade registers, etc. EWES is a self-completed business survey. The Australian Bureau of Statistics Business Register is used to identify businesses in scope of the collection.
2.4. Population Describe the entire group of units which is the focus of the statistics (the population). All Australian based businesses with a non-cancelled Australian Business Number (ABN) and an active Income Tax Withholding or Goods and Service Tax role, including Government-owned or controlled Public Trading Enterprises, except for those businesses identified previously under “Scope”. Specify the following statistical units:
• Reporting unit • Observational unit • Analytical unit
Examples of different kind of statistical units include: enterprise, enterprise group, kind-of-activity unit (KAU), local unit, establishment, homogeneous unit of production. In most cases the reporting unit, observational unit and analytical unit are identical, but there are examples where this is not the case. In electricity statistics, you may find that energy companies (the reporting unit) provide data about different consumers like the individual household or manufacturing
10
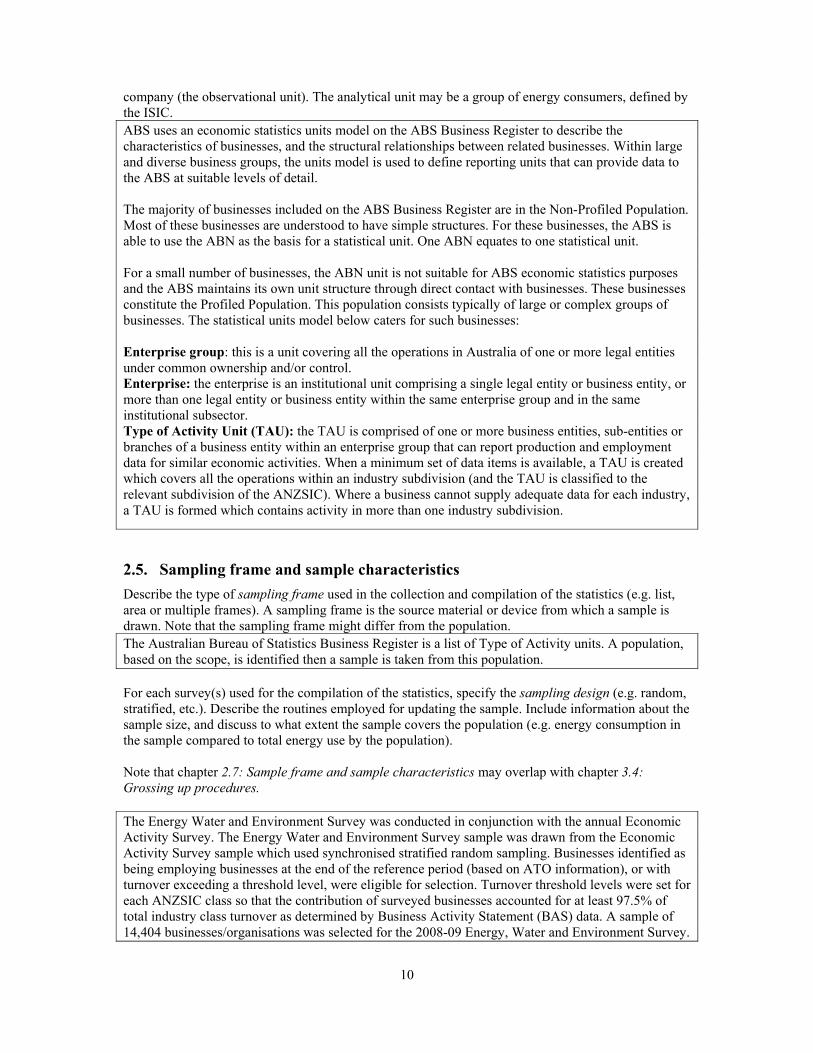
company (the observational unit). The analytical unit may be a group of energy consumers, defined by the ISIC. ABS uses an economic statistics units model on the ABS Business Register to describe the characteristics of businesses, and the structural relationships between related businesses. Within large and diverse business groups, the units model is used to define reporting units that can provide data to the ABS at suitable levels of detail. The majority of businesses included on the ABS Business Register are in the Non-Profiled Population. Most of these businesses are understood to have simple structures. For these businesses, the ABS is able to use the ABN as the basis for a statistical unit. One ABN equates to one statistical unit. For a small number of businesses, the ABN unit is not suitable for ABS economic statistics purposes and the ABS maintains its own unit structure through direct contact with businesses. These businesses constitute the Profiled Population. This population consists typically of large or complex groups of businesses. The statistical units model below caters for such businesses: Enterprise group: this is a unit covering all the operations in Australia of one or more legal entities under common ownership and/or control. Enterprise: the enterprise is an institutional unit comprising a single legal entity or business entity, or more than one legal entity or business entity within the same enterprise group and in the same institutional subsector. Type of Activity Unit (TAU): the TAU is comprised of one or more business entities, sub-entities or branches of a business entity within an enterprise group that can report production and employment data for similar economic activities. When a minimum set of data items is available, a TAU is created which covers all the operations within an industry subdivision (and the TAU is classified to the relevant subdivision of the ANZSIC). Where a business cannot supply adequate data for each industry, a TAU is formed which contains activity in more than one industry subdivision.
2.5. Sampling frame and sample characteristics Describe the type of sampling frame used in the collection and compilation of the statistics (e.g. list, area or multiple frames). A sampling frame is the source material or device from which a sample is drawn. Note that the sampling frame might differ from the population. The Australian Bureau of Statistics Business Register is a list of Type of Activity units. A population, based on the scope, is identified then a sample is taken from this population. For each survey(s) used for the compilation of the statistics, specify the sampling design (e.g. random, stratified, etc.). Describe the routines employed for updating the sample. Include information about the sample size, and discuss to what extent the sample covers the population (e.g. energy consumption in the sample compared to total energy use by the population). Note that chapter 2.7: Sample frame and sample characteristics may overlap with chapter 3.4: Grossing up procedures. The Energy Water and Environment Survey was conducted in conjunction with the annual Economic Activity Survey. The Energy Water and Environment Survey sample was drawn from the Economic Activity Survey sample which used synchronised stratified random sampling. Businesses identified as being employing businesses at the end of the reference period (based on ATO information), or with turnover exceeding a threshold level, were eligible for selection. Turnover threshold levels were set for each ANZSIC class so that the contribution of surveyed businesses accounted for at least 97.5% of total industry class turnover as determined by Business Activity Statement (BAS) data. A sample of 14,404 businesses/organisations was selected for the 2008-09 Energy, Water and Environment Survey.
11
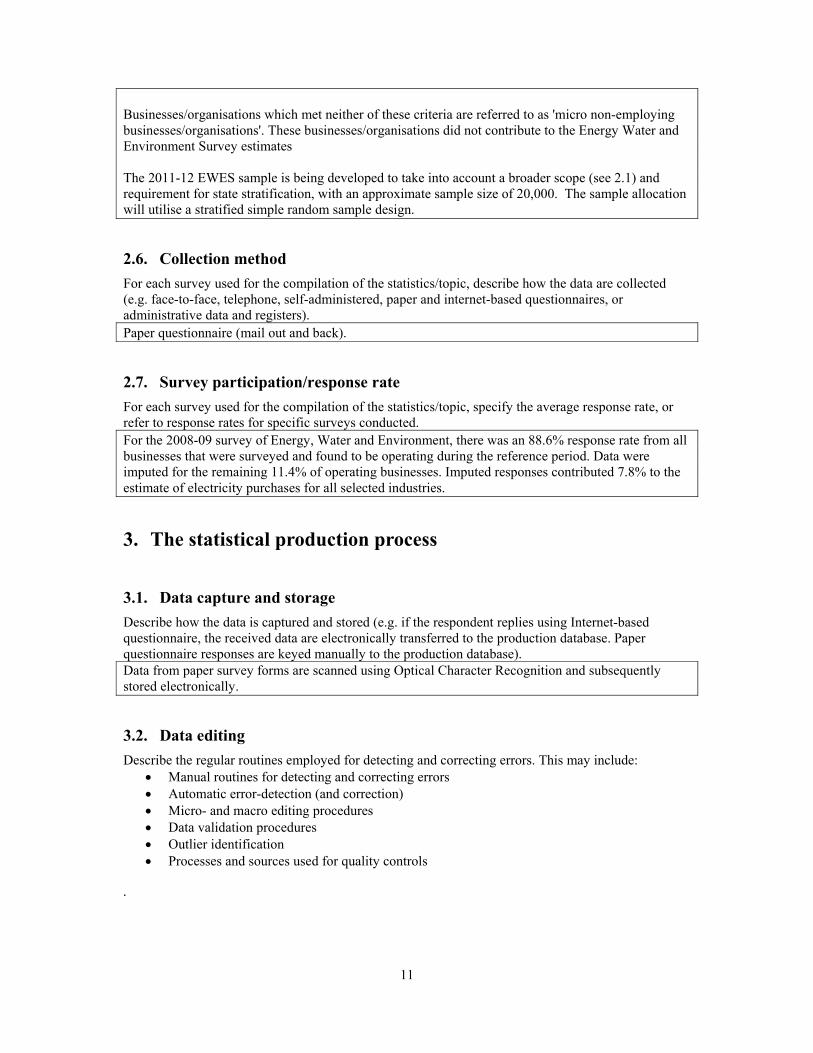
Businesses/organisations which met neither of these criteria are referred to as 'micro non-employing businesses/organisations'. These businesses/organisations did not contribute to the Energy Water and Environment Survey estimates The 2011-12 EWES sample is being developed to take into account a broader scope (see 2.1) and requirement for state stratification, with an approximate sample size of 20,000. The sample allocation will utilise a stratified simple random sample design.
2.6. Collection method For each survey used for the compilation of the statistics/topic, describe how the data are collected (e.g. face-to-face, telephone, self-administered, paper and internet-based questionnaires, or administrative data and registers). Paper questionnaire (mail out and back).
2.7. Survey participation/response rate For each survey used for the compilation of the statistics/topic, specify the average response rate, or refer to response rates for specific surveys conducted. For the 2008-09 survey of Energy, Water and Environment, there was an 88.6% response rate from all businesses that were surveyed and found to be operating during the reference period. Data were imputed for the remaining 11.4% of operating businesses. Imputed responses contributed 7.8% to the estimate of electricity purchases for all selected industries.
3. The statistical production process
3.1. Data capture and storage Describe how the data is captured and stored (e.g. if the respondent replies using Internet-based questionnaire, the received data are electronically transferred to the production database. Paper questionnaire responses are keyed manually to the production database). Data from paper survey forms are scanned using Optical Character Recognition and subsequently stored electronically.
3.2. Data editing Describe the regular routines employed for detecting and correcting errors. This may include:
• Manual routines for detecting and correcting errors • Automatic error-detection (and correction) • Micro- and macro editing procedures • Data validation procedures • Outlier identification • Processes and sources used for quality controls
.
12
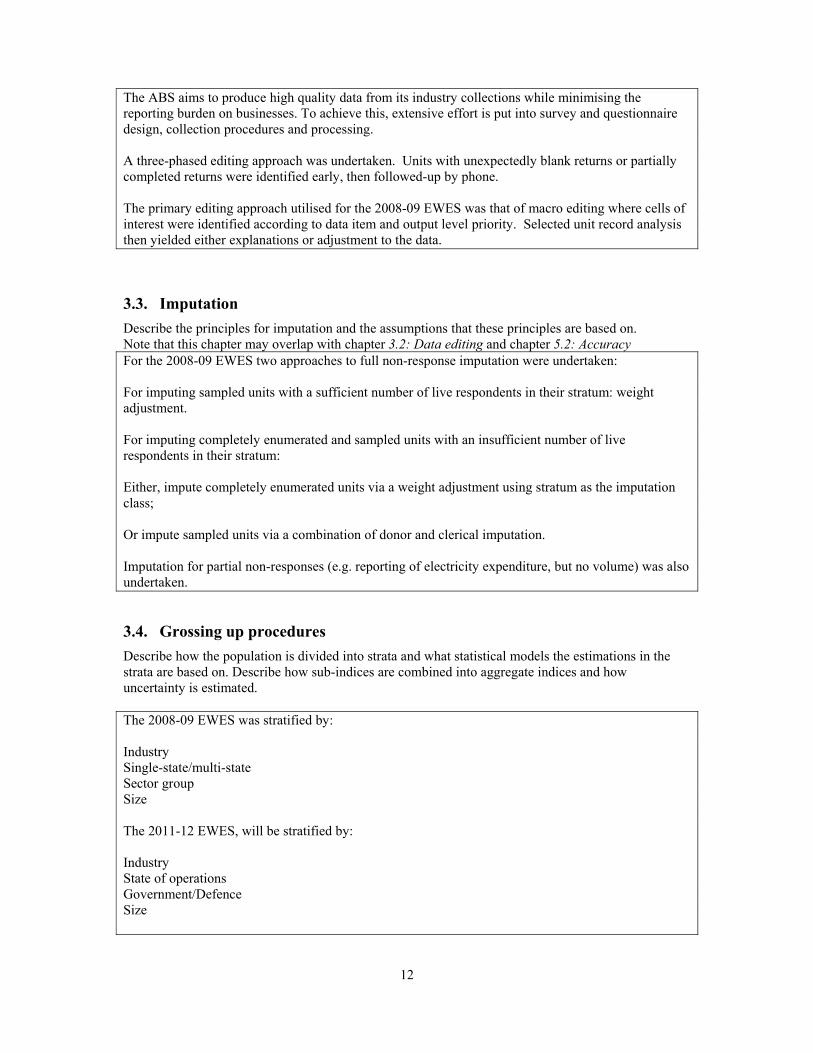
The ABS aims to produce high quality data from its industry collections while minimising the reporting burden on businesses. To achieve this, extensive effort is put into survey and questionnaire design, collection procedures and processing. A three-phased editing approach was undertaken. Units with unexpectedly blank returns or partially completed returns were identified early, then followed-up by phone. The primary editing approach utilised for the 2008-09 EWES was that of macro editing where cells of interest were identified according to data item and output level priority. Selected unit record analysis then yielded either explanations or adjustment to the data.
3.3. Imputation Describe the principles for imputation and the assumptions that these principles are based on. Note that this chapter may overlap with chapter 3.2: Data editing and chapter 5.2: Accuracy For the 2008-09 EWES two approaches to full non-response imputation were undertaken: For imputing sampled units with a sufficient number of live respondents in their stratum: weight adjustment. For imputing completely enumerated and sampled units with an insufficient number of live respondents in their stratum: Either, impute completely enumerated units via a weight adjustment using stratum as the imputation class; Or impute sampled units via a combination of donor and clerical imputation. Imputation for partial non-responses (e.g. reporting of electricity expenditure, but no volume) was also undertaken.
3.4. Grossing up procedures Describe how the population is divided into strata and what statistical models the estimations in the strata are based on. Describe how sub-indices are combined into aggregate indices and how uncertainty is estimated. The 2008-09 EWES was stratified by: Industry Single-state/multi-state Sector group Size The 2011-12 EWES, will be stratified by: Industry State of operations Government/Defence Size
13
Sample allocation for the 2011-12 EWES collections is designed to constrain the relative standard errors for the EWES 2008-09 variables - total expenditure on electricity, total expenditure on gas and expenditure on fuel.
3.5. Analytical methods Give a description of any analytical methods used to adjust the data (e.g.: seasonal adjustment and temperature adjustment). A more detailed description of the analytical method can also be included as an annex. Not relevant
4. Dissemination
4.1. Publications and additional documentation Describe the form of dissemination of the statistics/topics in question (e.g. printed publications, website, etc.). Please provide relevant website link(s) if available. All ABS publications are available for free on the ABS website (abs.gov.au). The main publication of 2008-09 EWES energy data is the publication Energy, Water and Environment Management, Australia (cat. no. 4660.0) which contains summary commentary and datacubes: http://www.abs.gov.au/ausstats/[email protected]/mf/4660.0 For 2011-12 EWES, data will be published in Environmental and Energy Management, Australia (cat. No. 4660.0), as well as in a new catalogue - Energy Consumption and Electricity Generation, Australia (cat. no. 4664.0). In addition, 2011-12 EWES energy data will be used in the Energy Account, Australia (cat. no. 4604.0). Give a complete reference to publicly available statistics databases where data from the statistics can be extracted. Include web addresses if available online. Not relevant Indicate whether you charge users for access to the statistics at any level of aggregation. Special data services incur a charge. However, special data services are none available for the EWES.
4.2. Revisions Describe the current revision policies. E.g.: Is historical data revised when new methodology, new definitions, new classifications etc. are taken into use? Is the data continuously revised, or is the data revised at certain points in times (e.g. every third year, annually, etc.)? Not relevant If applicable, describe any major conceptual or methodological revisions that have been carried out for this statistic/topic in the past. Not relevant
14
4.3. Microdata Describe how microdata are stored. Data are stored in a data warehouse. All iterations of the data (i.e. reported, imputed, edited) are stored. Specify if microdata are available for scientific and/or public use. If so, describe under what conditions these are made available. Not available
4.4. Confidentiality Describe the legal authority that regulates confidentiality, and what restrictions are applied to the publication of the statistics. The Census and Statistics Act 1905 http://www.austlii.edu.au/au/legis/cth/consol_act/casa1905241/ Describe the criteria used to suppress sensitive data in statistical tables (cell suppression). The likely identification of an individual organisation or business. Describe how confidential data are handled. Data Suppression; Cell collapsing; Seek consent to publish Describe any confidentiality standards that go beyond what is legally required.
5. Quality
5.1. Relevance State to which degree the statistical information meet the real needs of clients/users. The statistics produced are highly relevant and are the subject of interest to all levels of government, industry and the general public. The information collected is of use to analysts and policy makers in both the public and private sectors for informed decision making.
5.2. Accuracy State the closeness of computations or estimates to the exact or true values that the statistics were intended to measure. Most of the data contained in the 2008-09 EWES was collected for the first time and, for those data items previously collected, limited current information was available to enable valid comparison. Measurement and processing errors Discuss the measurement and processing errors that are relevant for the statistics. Try as far as possible to give an estimation of the size and scope of the errors. Estimates contain both sampling and non-sampling errors.
15
Non-sampling error arises from inaccuracies in collecting, recording and processing the data. Every effort was made to minimise reporting error, by the careful design of questionnaires, intensive training of survey analysts, and efficient data processing procedures. Main non-sampling issues for EWES: Some businesses utility payments, such as electricity, gas and water, are included in lease agreements and not able to be separately reported. Instructions on the form advise how to report in these situations. This issue results in over estimates in the Rental, Hiring and Real Estate Services industry, balanced by underetimates across the rest of the economy; Although electricity, natural gas and other fuels expenditure data are usuaually kept in a businesses accounts, volume data is not and is therefore more difficult and time consuming to source. Sampling error, occuring when a sample, rather than the entire population, is surveyed reflects the difference between estimates based on a sample and those that would have been obtained had a census been conducted. Selected data item relative standard errors (obtained by expressing the standard error as a percentage of the estimate to which it refers) for Australia are shown on the ABS website: http://www.abs.gov.au/AUSSTATS/[email protected]/Latestproducts/4660.0Technical%20Note12008-09?opendocument&tabname=Notes&prodno=4660.0&issue=2008-09&num=&view= Non-response errors State the size of the unit non-response and the item non-response, distributed by important variables in the population (e.g. region, industry). Consider if the non-response errors are systematic, and if so, describe the methods used to correct it. Indicate whether the effects of correcting non-response errors on the results have been analysed, and, if so, describe them. For the 2008-09 EWES there was an 88.6% response rate from all businesses that were surveyed and found to be operating during the reference period. Data were imputed, either clerically or using live respondent mean for each stratum, for the remaining 11.4% of operating businesses. Imputed responses contributed 7.8% to the estimate of electricity purchases for all selected industries. Sampling errors Discuss the size of the sampling errors. Compare the population and sample with regards to important properties (e.g. coefficient of variance). Selected data item relative standard errors (obtained by expressing the standard error as a percentage of the estimate to which it refers) for Australia are shown on the ABS website: http://www.abs.gov.au/AUSSTATS/[email protected]/Latestproducts/4660.0Technical%20Note12008-09?opendocument&tabname=Notes&prodno=4660.0&issue=2008-09&num=&view= The coefficient of variation was capped in order to further smooth the data for allocation. However, details are not available. Other sources of error Discuss other sources of errors that might be relevant for the statistics. E.g.: Model assumption errors, coverage errors Not applicable.
16
5.3. Timeliness and punctuality Specify the time between the end of the reference period and publication. If the statistics are published both as preliminary and final figures, specify the time between publication of preliminary and final figures. You should also point out whether the publication date is set according to certain rules (e.g. advance release calendar, a specific day or prior to other publications). The information for EWES 2008-09 was published on 30th July 2010, 12 months after the end of the reference period. No preliminary figures were released. Publication of the 2011-12 EWES is planned for June 2013. Point out if there have been any major discrepancies between the planned publication date and the actual publication date in recent years. If so, state the length of this discrepancy and its cause. Not relevant
5.4. Accessibility Describe how easily accessible the statistics are. In particular, is there an advance release calendar to inform the users about when and where the data will be available and how to access them? Are metadata and other user support services easily available? Are there particular groups that don’t have access to the published statistics (e.g.: visually disadvantaged)? Data is published on the ABS website (www.abs.gov.au). There is a release date calendar for all statistical products produced by the ABS. Website content must adhere to accessibility standards and guidelines to ensure that information can be accessed by those who have a range of disabilities.
5.5. Comparability Discuss the comparability of the statistics over time, geographical areas and other domains. Comparability over time Discuss comparability over time and include information about whether there have been any breaks in the time series of the statistics and why. Also describe any major changes in the statistical methodology that may have had an impact on comparability over time. The 2008-09 survey was the first time the Energy, Water and Environment Survey was conducted. It has been updated and is expected to be repeated tri-annually. Comparability over region Discuss comparability over geographical areas, and include information about whether the statistics are comparable to relevant statistics published by other countries and/or international organisations. The use of ABS standards and classifications supports the comparability of data with other national and international statistics. Comparability over other domains Discuss comparability over domains, and include information about whether the statistics are comparable between different industries, different types of households etc. This was a business based survey. The use of ABS standards and classifications supports the comparability of data with other national and international statistics.
17
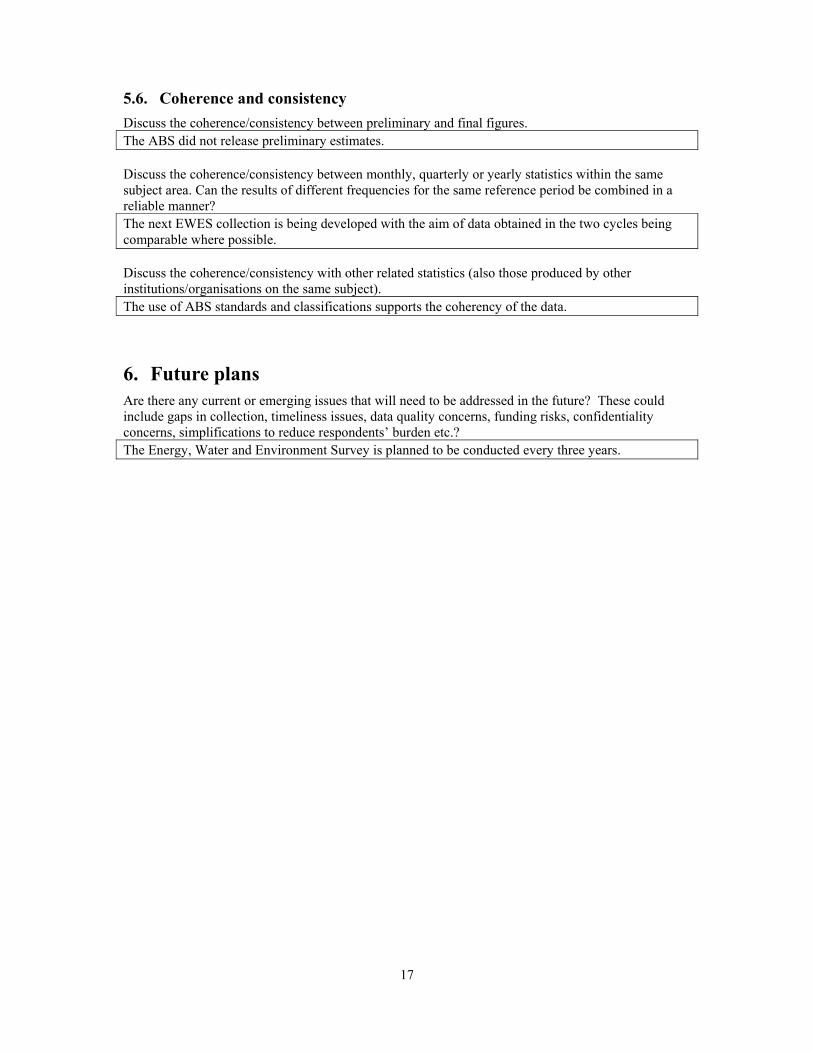
5.6. Coherence and consistency Discuss the coherence/consistency between preliminary and final figures. The ABS did not release preliminary estimates. Discuss the coherence/consistency between monthly, quarterly or yearly statistics within the same subject area. Can the results of different frequencies for the same reference period be combined in a reliable manner? The next EWES collection is being developed with the aim of data obtained in the two cycles being comparable where possible. Discuss the coherence/consistency with other related statistics (also those produced by other institutions/organisations on the same subject). The use of ABS standards and classifications supports the coherency of the data.
6. Future plans Are there any current or emerging issues that will need to be addressed in the future? These could include gaps in collection, timeliness issues, data quality concerns, funding risks, confidentiality concerns, simplifications to reduce respondents’ burden etc.? The Energy, Water and Environment Survey is planned to be conducted every three years.
18
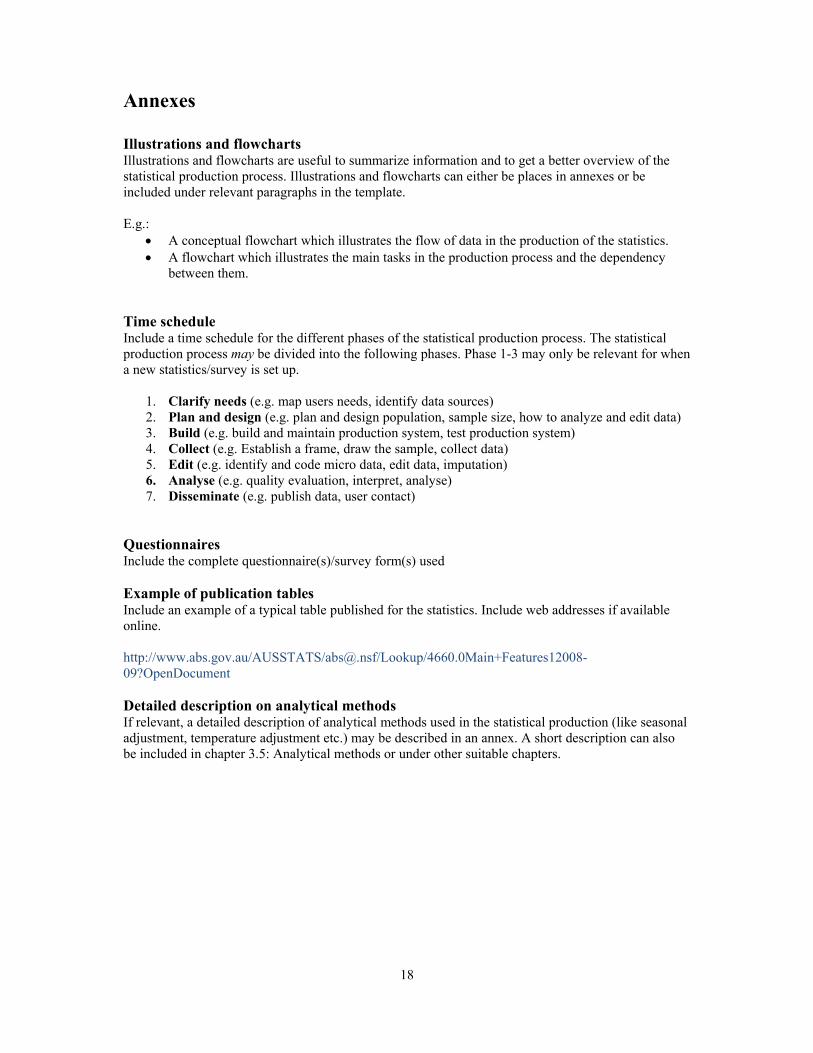
Annexes Illustrations and flowcharts Illustrations and flowcharts are useful to summarize information and to get a better overview of the statistical production process. Illustrations and flowcharts can either be places in annexes or be included under relevant paragraphs in the template. E.g.:
• A conceptual flowchart which illustrates the flow of data in the production of the statistics. • A flowchart which illustrates the main tasks in the production process and the dependency
between them. Time schedule Include a time schedule for the different phases of the statistical production process. The statistical production process may be divided into the following phases. Phase 1-3 may only be relevant for when a new statistics/survey is set up.
1. Clarify needs (e.g. map users needs, identify data sources) 2. Plan and design (e.g. plan and design population, sample size, how to analyze and edit data) 3. Build (e.g. build and maintain production system, test production system) 4. Collect (e.g. Establish a frame, draw the sample, collect data) 5. Edit (e.g. identify and code micro data, edit data, imputation) 6. Analyse (e.g. quality evaluation, interpret, analyse) 7. Disseminate (e.g. publish data, user contact)
Questionnaires Include the complete questionnaire(s)/survey form(s) used Example of publication tables Include an example of a typical table published for the statistics. Include web addresses if available online. http://www.abs.gov.au/AUSSTATS/[email protected]/Lookup/4660.0Main+Features12008-09?OpenDocument Detailed description on analytical methods If relevant, a detailed description of analytical methods used in the statistical production (like seasonal adjustment, temperature adjustment etc.) may be described in an annex. A short description can also be included in chapter 3.5: Analytical methods or under other suitable chapters.
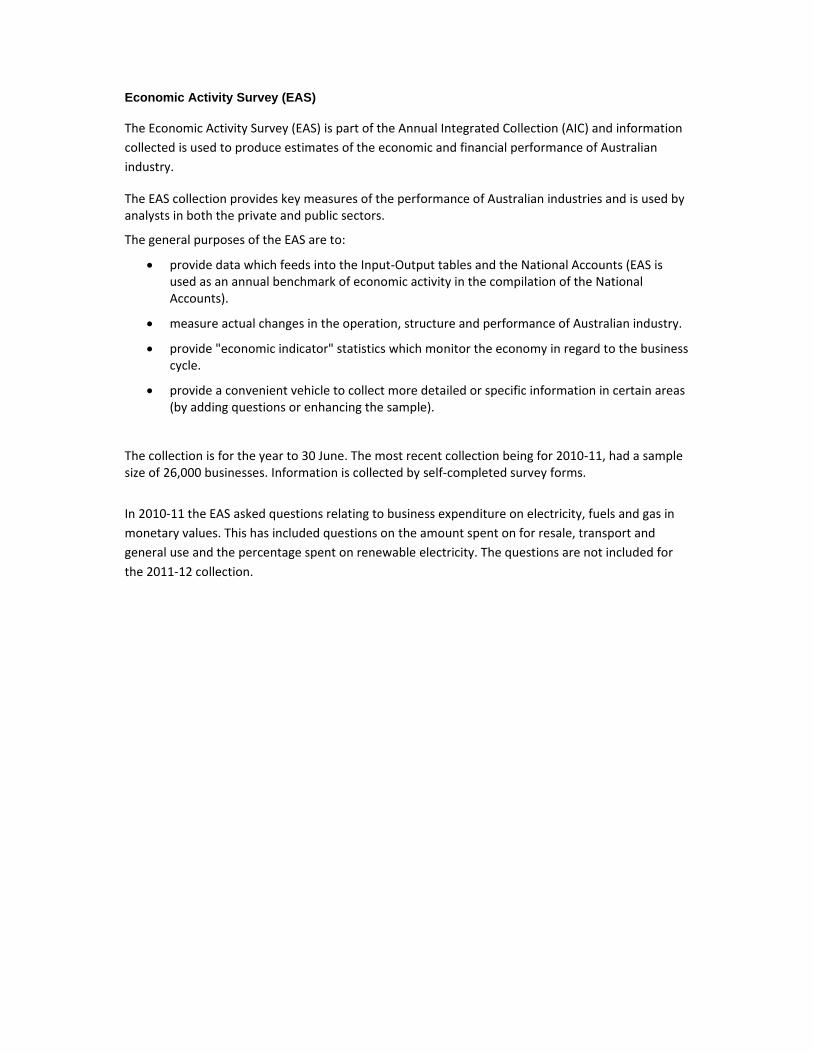
Economic Activity Survey (EAS)
The Economic Activity Survey (EAS) is part of the Annual Integrated Collection (AIC) and information collected is used to produce estimates of the economic and financial performance of Australian industry.
The EAS collection provides key measures of the performance of Australian industries and is used by analysts in both the private and public sectors.
The general purposes of the EAS are to:
• provide data which feeds into the Input‐Output tables and the National Accounts (EAS is used as an annual benchmark of economic activity in the compilation of the National Accounts).
• measure actual changes in the operation, structure and performance of Australian industry.
• provide "economic indicator" statistics which monitor the economy in regard to the business cycle.
• provide a convenient vehicle to collect more detailed or specific information in certain areas (by adding questions or enhancing the sample).
The collection is for the year to 30 June. The most recent collection being for 2010‐11, had a sample size of 26,000 businesses. Information is collected by self‐completed survey forms.
In 2010‐11 the EAS asked questions relating to business expenditure on electricity, fuels and gas in monetary values. This has included questions on the amount spent on for resale, transport and general use and the percentage spent on renewable electricity. The questions are not included for the 2011‐12 collection.
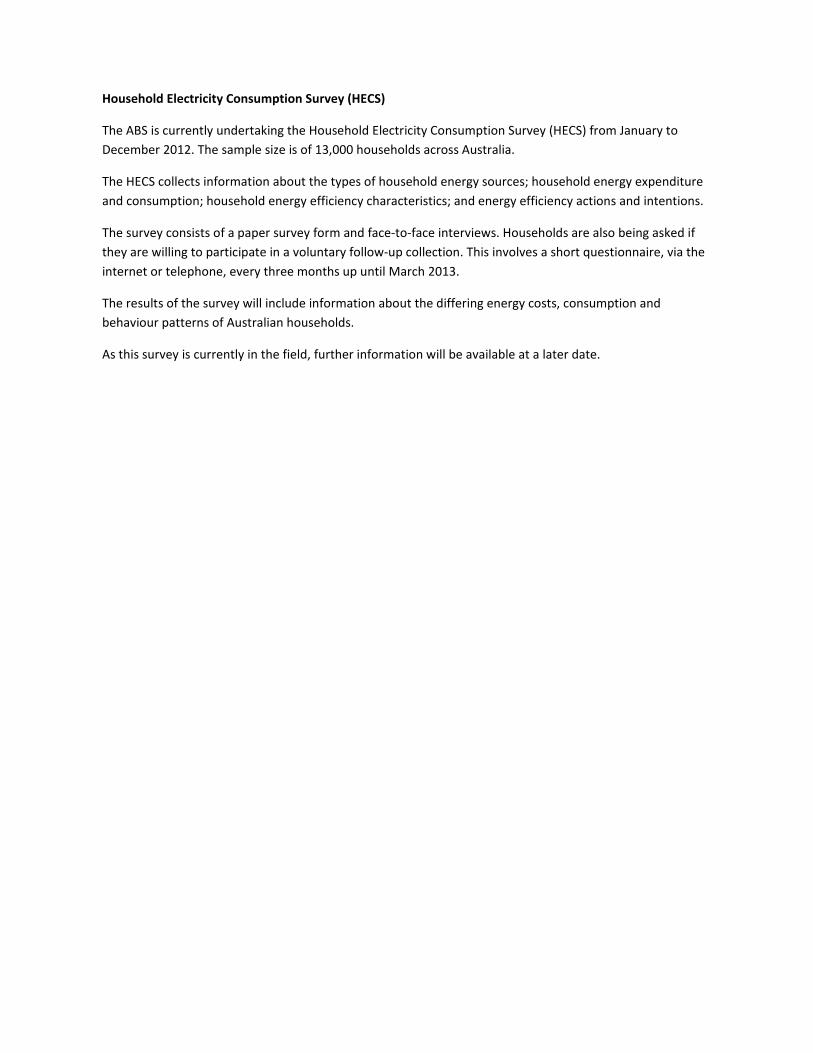
Household Electricity Consumption Survey (HECS)
The ABS is currently undertaking the Household Electricity Consumption Survey (HECS) from January to December 2012. The sample size is of 13,000 households across Australia.
The HECS collects information about the types of household energy sources; household energy expenditure and consumption; household energy efficiency characteristics; and energy efficiency actions and intentions.
The survey consists of a paper survey form and face‐to‐face interviews. Households are also being asked if they are willing to participate in a voluntary follow‐up collection. This involves a short questionnaire, via the internet or telephone, every three months up until March 2013.
The results of the survey will include information about the differing energy costs, consumption and behaviour patterns of Australian households.
As this survey is currently in the field, further information will be available at a later date.
National Greenhouse and Energy Reporting (NGER)
Australian businesses that meet an annual threshold for energy consumption, energy production or greenhouse gas emissions have been required to register for the National Greenhouse and Energy Reporting (NGER) system since 2008. This is outlined in the National Greenhouse and Energy Reporting Act 2007.
Reporting has occurred on an annual basis from the year 2008‐09 and eligible businesses are required to begin self‐reporting in years they meet the threshold. NGER reporting years are from 1 July to 30 June. Businesses must apply to register by 31 August following the end of the reporting period in which they first met the threshold. They are required to report by 31 October following the reporting year.
Businesses report information including energy production, energy consumption, greenhouse gas emissions, location, fuel type, renewable energy and business type. Submission ofdata occurs online through the Online System for Comprehensive Activity Reporting (OSCAR). OSCAR automatically calculates greenhouse gas emissions from energy and fuel consumption data that is submitted.
Data is published annually by the Greenhouse and Energy Data Officer (GEDO). A registered business will have its reported totals for that financial year published, if its scope 1 and scope 2 greenhouse gas emissions, combined together, are equal to or greater than the publishing thresholds specified in the NGER Act. The GEDO must publish the totals that were reported before 28 February for the previous collection period's information. Data is published to meet international reporting obligations and so the wider community can have a greater understanding of energy flows and greenhouse gas emissions. Some government organisations (specified in the NGER Act) can also access NGER data at a finer level (including emissions, energy use and generation, fuel type and location information).
Published NGER data for collection periods are found at the following websites: 2010‐2011: http://www.climatechange.gov.au/government/initiatives/national‐greenhouse‐energy‐reporting/publication‐of‐data/nger‐greenhouse‐energy‐information‐2010‐11.aspx 2009‐10: http://www.climatechange.gov.au/government/initiatives/national‐greenhouse‐energy‐reporting/publication‐of‐data/greenpower‐and‐renewabl‐energy‐certificates/2009‐2010‐reported‐totals.aspx 2008‐09: http://www.climatechange.gov.au/government/initiatives/national‐greenhouse‐energy‐reporting/publication‐of‐data/greenpower‐and‐renewabl‐energy‐certificates/2008‐2009‐reported‐totals.aspx
Further information about National Greenhouse and Energy Reporting can be found here:
http://www.climatechange.gov.au/en/government/initiatives/national‐greenhouse‐energy‐reporting.aspx