Topic 6 - witsgbs.com 16_topic 6.pdf · • distinguish between a static budget and a flexible...
37
6.1 Topic 6
Transcript of Topic 6 - witsgbs.com 16_topic 6.pdf · • distinguish between a static budget and a flexible...

6.1
Topic 6
Topic 6 Standard cost analysis
6.2
STANDARD COSTANALYSIS
Introduction
Standard costs, which were introduced in Topic 3, are a feature of budgets. Performanceevaluation is performed by using the standard measures in the budget as a basis forcomparison against actual outcomes. In this topic we will study how the differences betweenplans and actual outcomes can be analysed to gain information that assists managers inmaking managerial decisions.
Learning objectives
On completion of this topic you should be able to:
• describe how standard costs are set;
• define basic, ideal, and currently attainable standards;
• explain how a standard costing system operates;
• distinguish between a static budget and a flexible budget;
• compute materials, labour, and overhead variances;
• analyse gross profit, and
• understand possible causes for variances.

Managerial Accounting
6.3
Course Notes
Introduction
Under a system of budgetary control and responsibility accounting, actual costs and revenuesare accumulated for each responsibility centre and periodically compared with budgetarytargets. Variances from budget are highlighted and the person in charge of the responsibilitycentre is held accountable for the deviations.
Standard costing and variance analysis is a system that enables such deviations from thebudget to be analysed in greater detail, thus enabling costs and revenues to be controlled moreeffectively. Such analysis can indicate the investigation needed to ascertain the true cause ofthe variances and the person actually responsible for them.
Definition: Standard costing
Standard costing is a technique whereby the planned activities of an undertaking are expressedin budgets, standard costs, standard selling prices, and standard profit margins, and thedifference between these and the comparable actual results are accounted for.
There are a number of advantages in operating a standard cost system, some of which youhave come across in earlier topics. They include the way that standard costs facilitate therecording, forecasting and pricing activities during an operating period.
Management is periodically presented with an analysis of differences by causes andresponsibility centres, such analysis usually commencing with the operating profit variance.The differences are called variances.
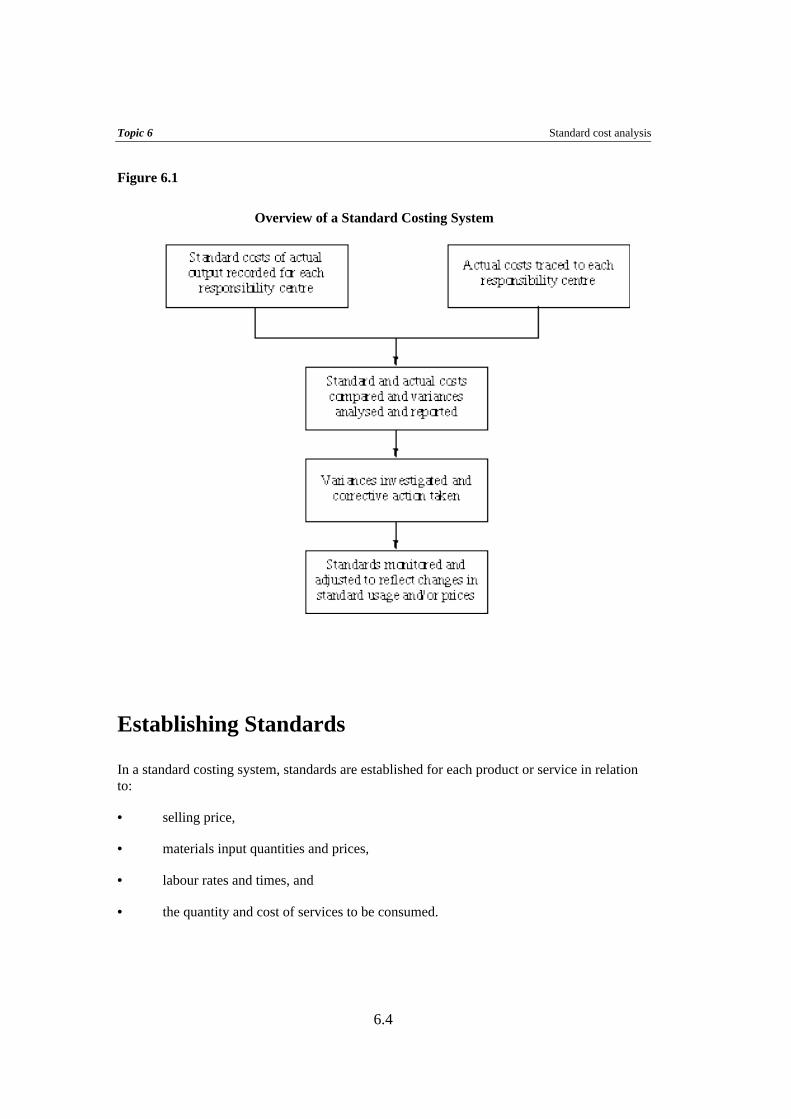
Variances highlight deviations from expectations or desires. They can be investigated andanalysed to reveal possible causes of the deviations (Figure 6.1). Action can then be taken toimprove the outcome of operations. This is part of the control function of standard costing.
Suitability
A system of standard costing is suitable for organisations whose activities consist of a seriesof repetitive operations.
Topic 6 Standard cost analysis
6.4
Figure 6.1
Overview of a Standard Costing System
Establishing Standards
In a standard costing system, standards are established for each product or service in relationto:
• selling price,
• materials input quantities and prices,
• labour rates and times, and
• the quantity and cost of services to be consumed.

Managerial Accounting
6.5
Standards May Be Established Using Different Methods:
• standards based on design/engineering studies;
• standards based on trial runs;
• standards based on work study techniques; and
• standards based on average historic usage.
Standards for Direct Materials (based on design, quality policy andproduction process):
• material type;
• material quantity; and
• material unit price.
Standards for Direct Labour (based on method of production,equipment used, and procedures):
• standard time for each operation; and
• standard wage rate.
Standards for Production Overhead Costs:
• separate standards are set for variable and fixed overhead costs;
• variable overhead rate per unit or per labour hour;
• total fixed cost, and
• fixed overhead rate per unit or per labour hour.
Types of Standards
Basic Standards
Standards which are left unchanged for a long period of time. These are seldom used.

Topic 6 Standard cost analysis
6.6
Ideal Standards
These are minimum or optimal standards that are only possible under the most efficientoperating conditions. These are used as targets to aim for. They are generally not used tomonitor current performance. They provide the greatest motivation to managers and the fairestcomparison for performance evaluation.
Attainable Standards
These represent costs that should be incurred under efficient operating conditions withcurrently available equipment and methods. These are standards which are difficult, but notimpossible to achieve.
Purposes of Standard Costing
1. To assist in setting budgets and evaluating managerial performance.
2. To act as a control device by highlighting variances that may require corrective action.
3. To predict future expected costs which may be useful for decision making.
4. To simplify product costing for inventory valuation.
5. To expedite record keeping during an operating period.
6. To motivate employees by providing a challenging target.
Flexible Budgeting and Performance Reports
Performance Reports are used to evaluate managers who are responsible for cost or revenuecentres.
Performance Report Format:
Budget – Actual = Variance cost or cost or from budgeted revenues revenues costs or revenues
Types of budgets
Static:
A budget based on the planned level of activity, the static budget ignores changes in the levelof output and measures the effectiveness of performance.

Managerial Accounting
6.7
• A static budget is fixed
• It shows the costs, revenues and profits at the planned level of activity
• The performance report compares actual results to planned results and ignores anydifference in the level of activity.
Static Budget Amount = planned level of activity × standard variable cost + fixed costs.
Flexible:
The flexible budget adjusts the static budget to the actual level of output and enablesassessment of efficiency of performance.
• A flexible budget is dynamic. It can be prepared for any level of activity.
• At the end of a period the flexible budget represents the budgeted level of costs, revenuesand profits for the actual level of activity achieved for the period.
• Actual cost and revenues are therefore compared to a budget representing the same levelof activity.
Flexible Budget Amount = actual level of activity × standard variable cost per unit + fixed costs.
Illustration
Assume that a company FB Co has pre-determined its fixed costs and budget information asfollows
Standard data per unit of product $
Selling Price 60.00
Materials Cost 5.00
Labour Cost 10.00
Variable Manufacturing Overhead 6.00
Variable Marketing cost 2.00

Topic 6 Standard cost analysis
6.8
Fixed Costs for the period $
Fixed Manufacturing Overheads 200,000
Fixed Marketing cost 100,000
Planned Activity Level – (Static budget volume) 12,000
Using various different sales levels the budget could then be flexed according to the following table.
Volume Level 1 10000 11000 12000 13000 15000
Sales $ $60 $600,000 $660,000 $720,000 $780,000 $900,000
Mat Cost $5 $50,000 $55,000 $60,000 $65,000 $75,000
Labour Cost $10 $100,000 $110,000 $120,000 $130,000 $150,000
Var Manuf O/H $6, $60,000 $66,000 $72,000 $78,000 $90,000
Var Marketing cost $2 $20,000 $22,000 $24,000 $26,000 $30,000
Fixed Manuf O/H $200,000 $200,000 $200,000 $200,000 $200,000 $200,000
Fixed Marketing cost $100,000 $100,000 $100,000 $100,000 $100,000 $100,000
Total cost $530,000 $553,000 $576,000 $599,000 $645,000
Profit $70,000 $107,000 $144,000 $181,000 $255,000
Note that the budget is based on expected costs, given a particular output, and that fixed costs are always expectedto be the same.
The Monthly performance report would then be a comparison between the actual cost andrevenues generated and the actual volumes represented at standard costs and selling prices.
Question
Do Question 6.1 from the self assessment questions at the end of this topic.
Cost variances
The variances seek to explain the difference between the amount and cost of input that shouldhave been used to produce the actual output and the actual amount and cost of input that wasused.
Managerial Accounting
6.9
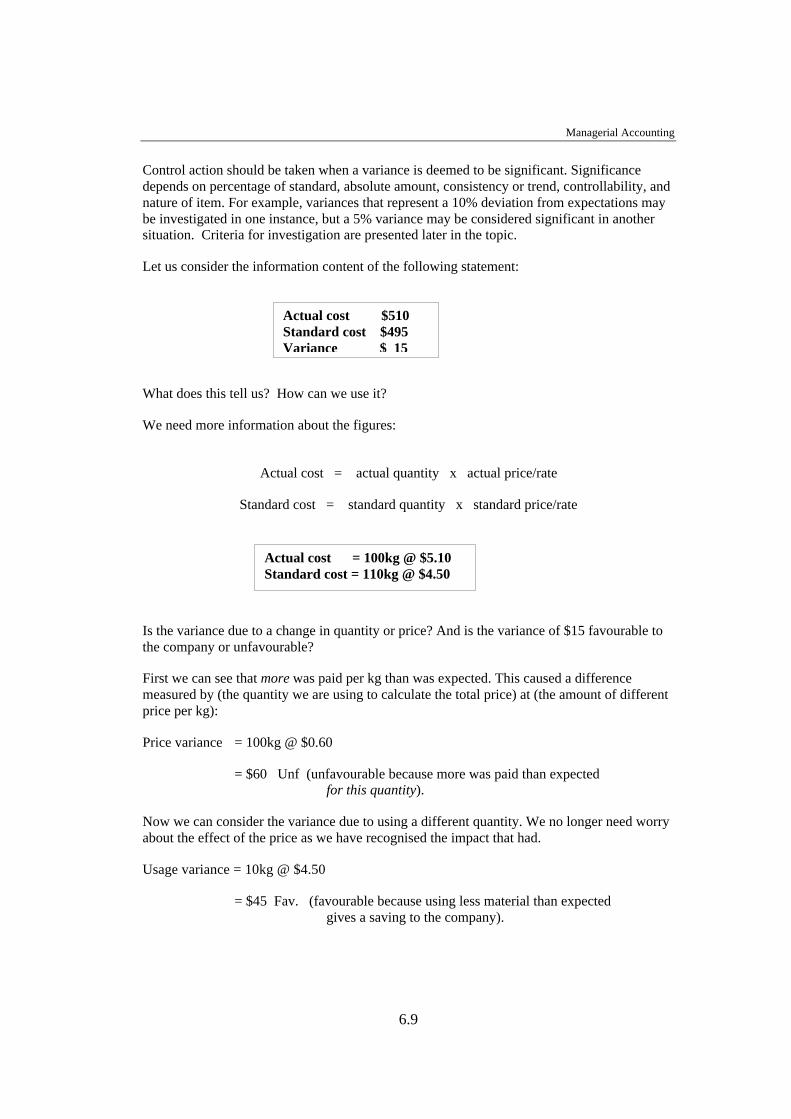
Control action should be taken when a variance is deemed to be significant. Significancedepends on percentage of standard, absolute amount, consistency or trend, controllability, andnature of item. For example, variances that represent a 10% deviation from expectations maybe investigated in one instance, but a 5% variance may be considered significant in anothersituation. Criteria for investigation are presented later in the topic.
Let us consider the information content of the following statement:
What does this tell us? How can we use it?
We need more information about the figures:
Actual cost = actual quantity x actual price/rate
Standard cost = standard quantity x standard price/rate
Is the variance due to a change in quantity or price? And is the variance of $15 favourable tothe company or unfavourable?
First we can see that more was paid per kg than was expected. This caused a differencemeasured by (the quantity we are using to calculate the total price) at (the amount of differentprice per kg):
Price variance = 100kg @ $0.60
= $60 Unf (unfavourable because more was paid than expected for this quantity).
Now we can consider the variance due to using a different quantity. We no longer need worryabout the effect of the price as we have recognised the impact that had.
Usage variance = 10kg @ $4.50
= $45 Fav. (favourable because using less material than expected gives a saving to the company).
Actual cost $510Standard cost $495Variance $ 15
Actual cost = 100kg @ $5.10Standard cost = 110kg @ $4.50
Topic 6 Standard cost analysis
6.10
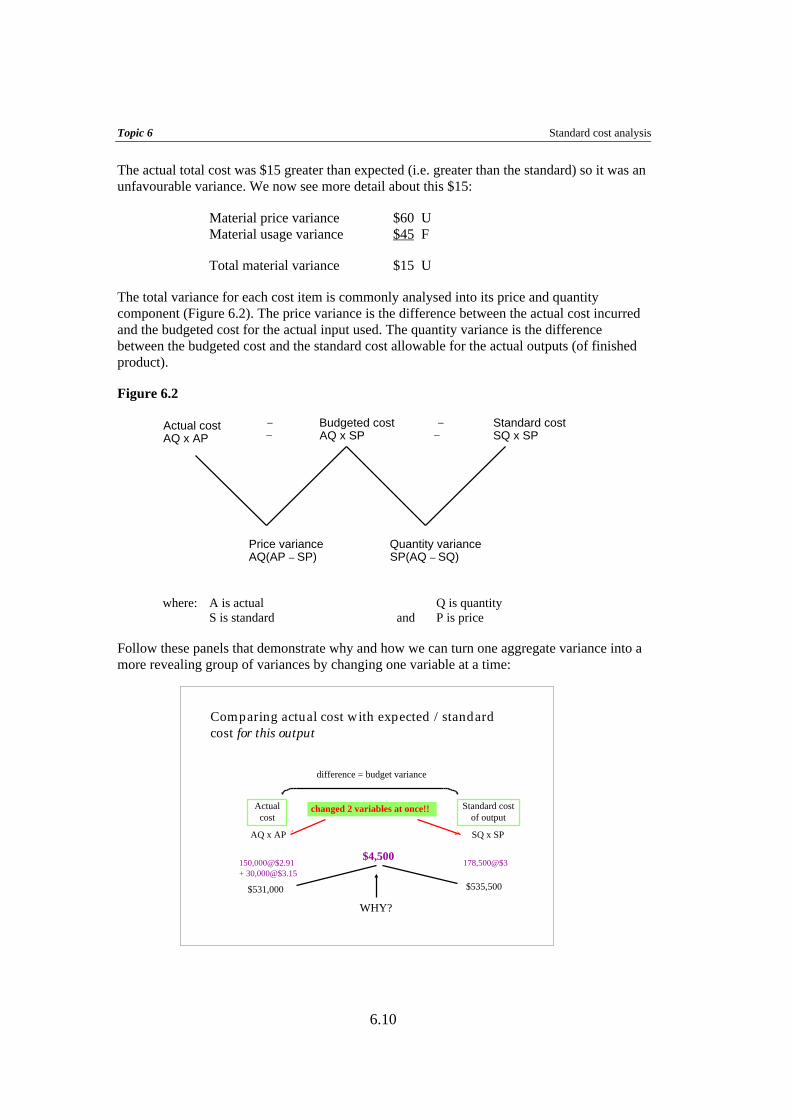
The actual total cost was $15 greater than expected (i.e. greater than the standard) so it was anunfavourable variance. We now see more detail about this $15:
Material price variance $60 UMaterial usage variance $45 F
Total material variance $15 U
The total variance for each cost item is commonly analysed into its price and quantitycomponent (Figure 6.2). The price variance is the difference between the actual cost incurredand the budgeted cost for the actual input used. The quantity variance is the differencebetween the budgeted cost and the standard cost allowable for the actual outputs (of finishedproduct).
Figure 6.2
Actual costAQ x AP
Budgeted costAQ x SP
Standard costSQ x SP
– –
Price varianceAQ(AP – SP)
Quantity varianceSP(AQ – SQ)
– –
where: A is actual S is standard
Q is quantity and P is price
Follow these panels that demonstrate why and how we can turn one aggregate variance into amore revealing group of variances by changing one variable at a time:
Comparing actual cost with expected /standardcost for this outputComparing actual cost with expected /standardcost for this output
Actualcost
Standard costof output
AQ x AP SQ x SP
difference = budget variance
150,000@$2.91+ 30,000@$3.15
178,500@$3
$531,000 $535,500
$4,500
WHY?
changed 2 variables at once!!
Managerial Accounting
6.11
The explanation of the standard cost comes from the case detail1. In a car wash one packet ofsoap is normally used per car wash, packets costing $3 each. In one period the companywashed 178,500 cars, using 180,000 packets of soap, the actual cost as shown in the panel.
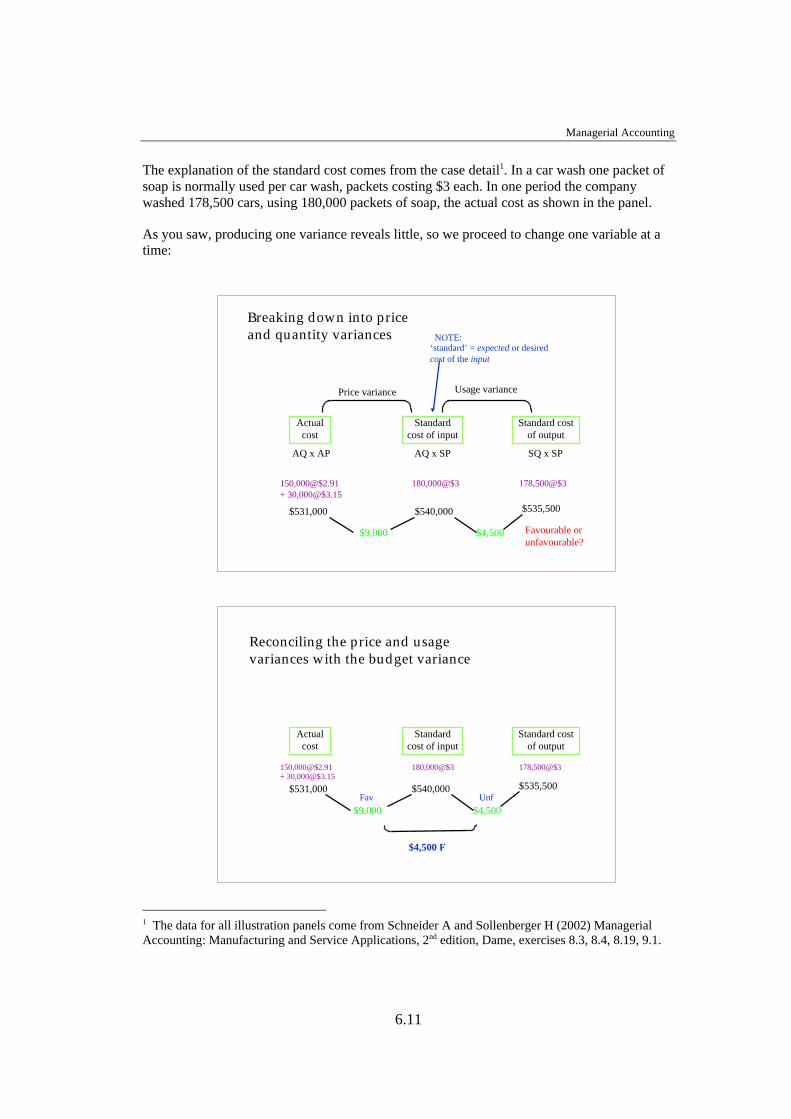
As you saw, producing one variance reveals little, so we proceed to change one variable at atime:
1 The data for all illustration panels come from Schneider A and Sollenberger H (2002) ManagerialAccounting: Manufacturing and Service Applications, 2nd edition, Dame, exercises 8.3, 8.4, 8.19, 9.1.
Breaking down into priceand quantity variancesBreaking down into priceand quantity variances
Actualcost
Standardcost of input
Standard costof output
AQ x AP SQ x SP
178,500@$3
$535,500
AQ x SP
180,000@$3
$540,000
Price variance Usage variance
$9,000 $4,500 Favourable orunfavourable?
150,000@$2.91+ 30,000@$3.15
$531,000
NOTE:‘standard’ = expected or desiredcost of the input
Reconciling the price and usagevariances with the budget varianceReconciling the price and usagevariances with the budget variance
Actualcost
Standardcost of input
Standard costof output
$535,500$540,000
$9,000 $4,500Fav Unf
$4,500 F
$531,000
178,500@$3180,000@$3150,000@$2.91+ 30,000@$3.15
Topic 6 Standard cost analysis
6.12
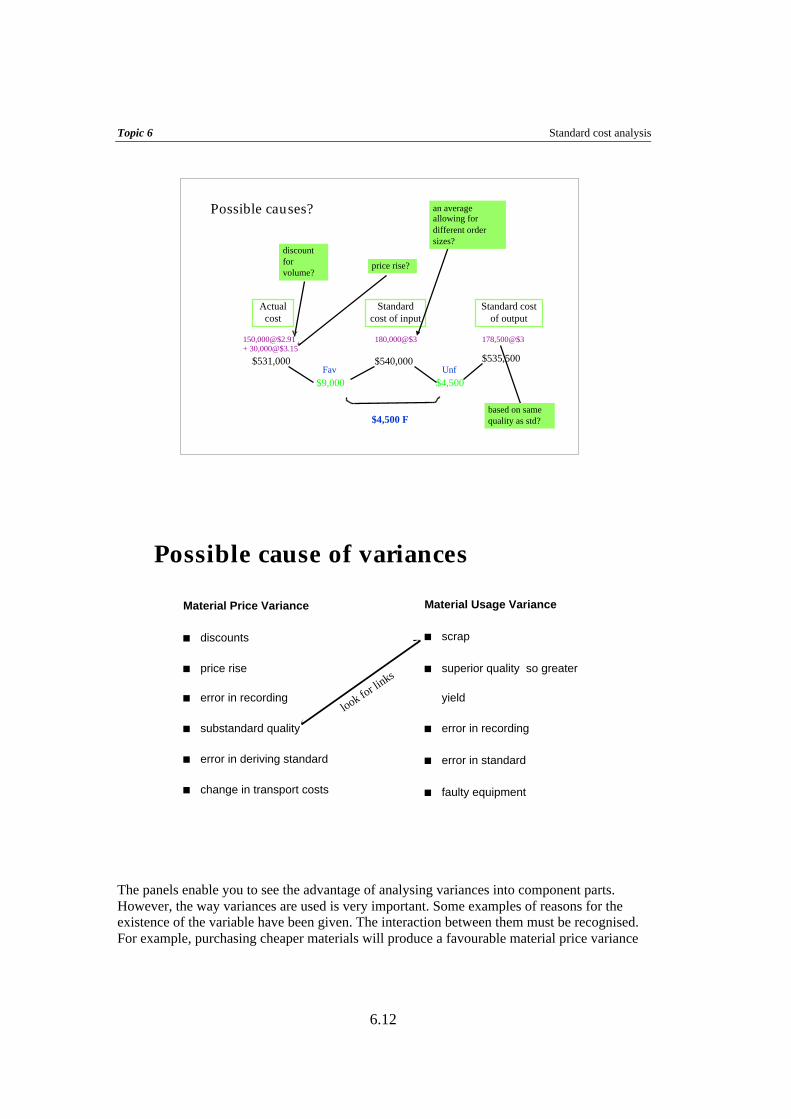
The panels enable you to see the advantage of analysing variances into component parts.However, the way variances are used is very important. Some examples of reasons for theexistence of the variable have been given. The interaction between them must be recognised.For example, purchasing cheaper materials will produce a favourable material price variance
Possible causes?Possible causes?
Actualcost
Standardcost of input
Standard costof output
$535,500$540,000
$9,000 $4,500Fav Unf
$4,500 F
$531,000
178,500@$3180,000@$3150,000@$2.91+ 30,000@$3.15
discountforvolume?
price rise?
an averageallowing fordifferent ordersizes?
based on samequality as std?
Possible cause of variancesPossible cause of variances
Material Usage Variance
n scrap
n superior quality so greater
yield
n error in recording
n error in standard
n faulty equipment
Material Price Variance
n discounts
n price rise
n error in recording
n substandard quality
n error in deriving standard
n change in transport costs
look for li
nks

Managerial Accounting
6.13
but could lead to more scrap due to the poor quality of the material. It could also be difficult tohandle, giving unfavourable labour variances.
Frequently one manager is responsible for procurements while a different manager managesproduction. The variances would therefore be favourable for the manager who is at fault andunfavourable for the manager who was not responsible for the purchase decision.
It is always important to remember that variances give questions to ask, not answers forreward or penalty. They highlight problems and give clues about the cause.
The next panel shows how the same variance analysis technique can be used for labourvariances:
Question
Questions 6.2 and 6.3 from the self assessment questions at the end of this topic should be donenow.
Obviously managers do not usually prepare reports using the diagrams in our illustration."Along the line" calculations can be performed as follows:
Labour variancesLabour variances
Actualcost
Standardcost of input
Standard costof output
AQ x AR SQ x SR
550 x 2.5 x $19
$26,125
AQ x SR
1,447@$19
$27,493
DL rate variance DL efficiency variance
$578.80F $1,368U
1,447@$18.60
$26,914.20
sameexperience?

Topic 6 Standard cost analysis
6.14
Direct materials, direct labour and variable overhead
Price Variance (Rate Variance, Spending Variance)
Actual InputsPurchased
× Actual StandardUnit Price
−Unit Price
Note: the price variance calculation can be performed on either the quantity purchased or thequantity put into process (i.e. used). When the variance is taken at the time of purchase thematerials are stored at standard cost in the inventory. When the variance is taken at the timeof use the inventory is recorded at actual cost.
Quantity Variance (Efficiency Variance, Usage Variance)
Standard UnitPrice of Inputs × Inputs Inputs that should
Actually used−
havebeenused
Alternative Variance Terminology
Price = Rate = SpendingQuantity = Usage = Efficiency
It is common for the materials variances to be called a price variance and a usage variance.
It is common for the labour variances to be called a rate variance and an efficiency variance.
The variable overhead variances are often called a spending variance and an efficiencyvariance.
The fixed overhead variances are calculated in a different way and are called a spendingvariance and a volume variance, or capacity variance.
Fixed factory overhead
Production Volume Variance
Budgeted FixedOverhead Rate ×
BudgetedVolume ×
Actual Volume*{ }* Where inputs (such as direct labour hours) are used to allocate overhead, the ‘actual
volume’ will be the ‘standard volume (of hours) allowed for the actual output unitsproduced’.
Budget or Spending variance
Actual Overhead – Budgeted Overhead
All overhead variances are further illustrated later in this topic.
-
Managerial Accounting
6.15
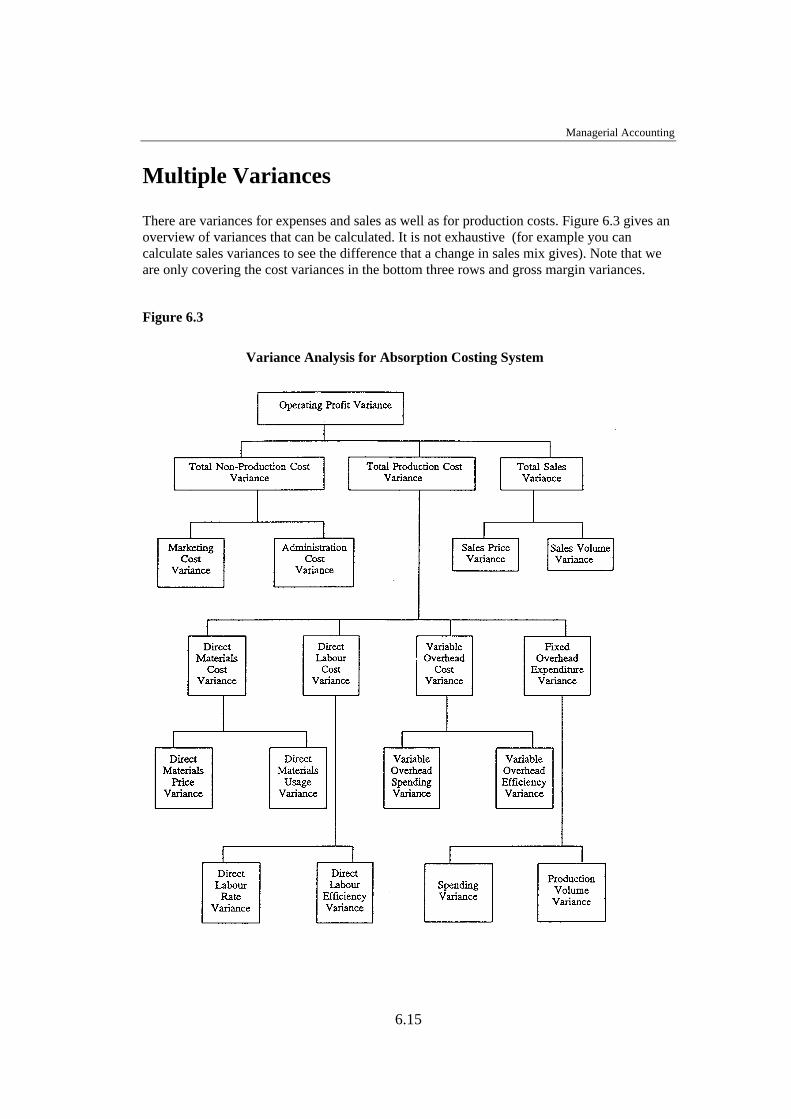
Multiple Variances
There are variances for expenses and sales as well as for production costs. Figure 6.3 gives anoverview of variances that can be calculated. It is not exhaustive (for example you cancalculate sales variances to see the difference that a change in sales mix gives). Note that weare only covering the cost variances in the bottom three rows and gross margin variances.
Figure 6.3
Variance Analysis for Absorption Costing System
Topic 6 Standard cost analysis
6.16
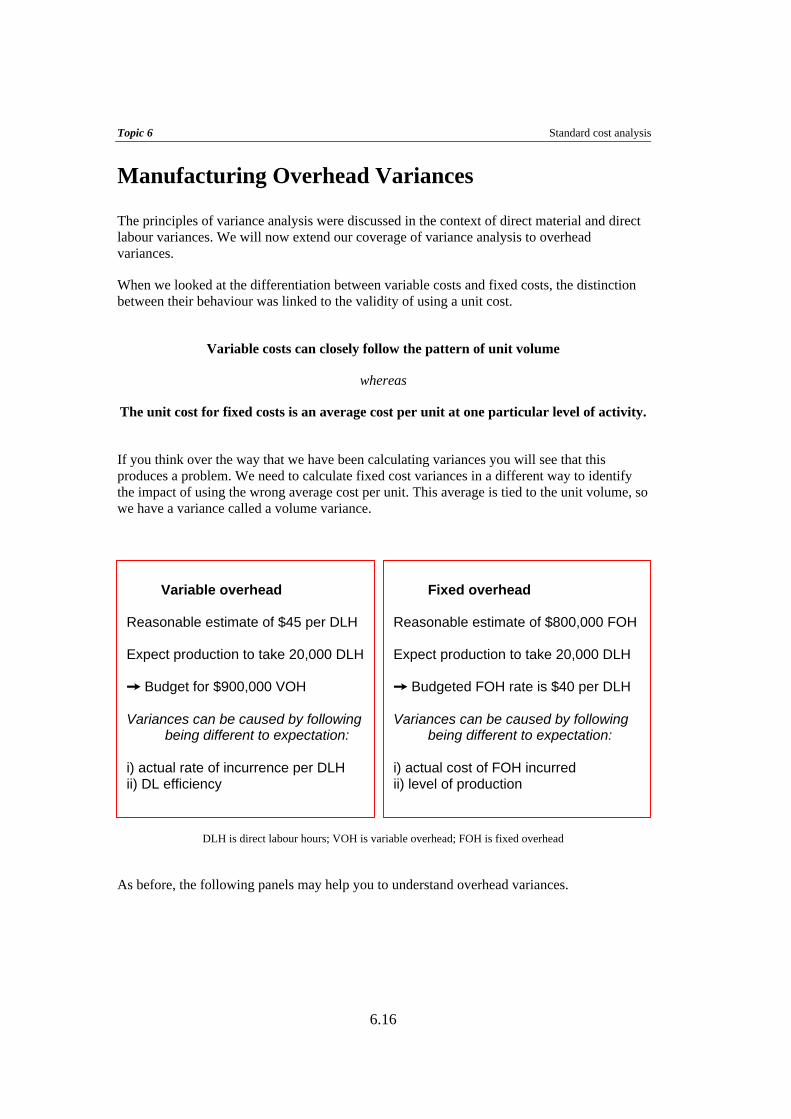
Manufacturing Overhead Variances
The principles of variance analysis were discussed in the context of direct material and directlabour variances. We will now extend our coverage of variance analysis to overheadvariances.
When we looked at the differentiation between variable costs and fixed costs, the distinctionbetween their behaviour was linked to the validity of using a unit cost.
Variable costs can closely follow the pattern of unit volume
whereas
The unit cost for fixed costs is an average cost per unit at one particular level of activity.
If you think over the way that we have been calculating variances you will see that thisproduces a problem. We need to calculate fixed cost variances in a different way to identifythe impact of using the wrong average cost per unit. This average is tied to the unit volume, sowe have a variance called a volume variance.
DLH is direct labour hours; VOH is variable overhead; FOH is fixed overhead
As before, the following panels may help you to understand overhead variances.
Variable overhead
Reasonable estimate of $45 per DLH
Expect production to take 20,000 DLH
Ù Budget for $900,000 VOH
Variances can be caused by following being different to expectation:
i) actual rate of incurrence per DLHii) DL efficiency
Fixed overhead
Reasonable estimate of $800,000 FOH
Expect production to take 20,000 DLH
Ù Budgeted FOH rate is $40 per DLH
Variances can be caused by followingbeing different to expectation:
i) actual cost of FOH incurredii) level of production
Managerial Accounting
6.17
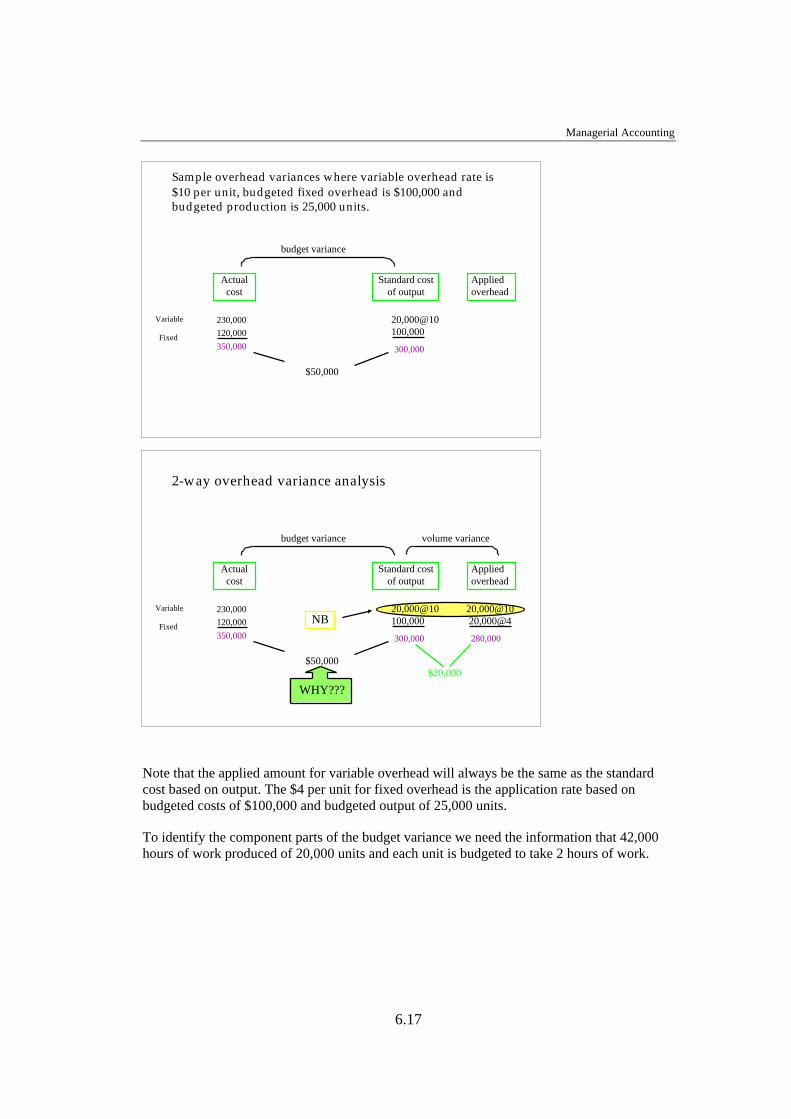
Note that the applied amount for variable overhead will always be the same as the standardcost based on output. The $4 per unit for fixed overhead is the application rate based onbudgeted costs of $100,000 and budgeted output of 25,000 units.
To identify the component parts of the budget variance we need the information that 42,000hours of work produced of 20,000 units and each unit is budgeted to take 2 hours of work.
Sample overhead variances where variable overhead rate is$10 per unit, budgeted fixed overhead is $100,000 andbudgeted production is 25,000 units.
Sample overhead variances where variable overhead rate is$10 per unit, budgeted fixed overhead is $100,000 andbudgeted production is 25,000 units.
Actualcost
Standard costof output
230,000
120,000
20,000@10100,000
300,000
budget variance
350,000
$50,000
Variable
Fixed
Appliedoverhead
2-way overhead variance analysis2-way overhead variance analysis
Actualcost
Appliedoverhead
Standard costof output
budget variance
230,000
120,000
350,000
Variable
Fixed
20,000@10100,000
300,000
$50,000
volume variance
20,000@1020,000@4
280,000
$20,000
NB
WHY???
Topic 6 Standard cost analysis
6.18
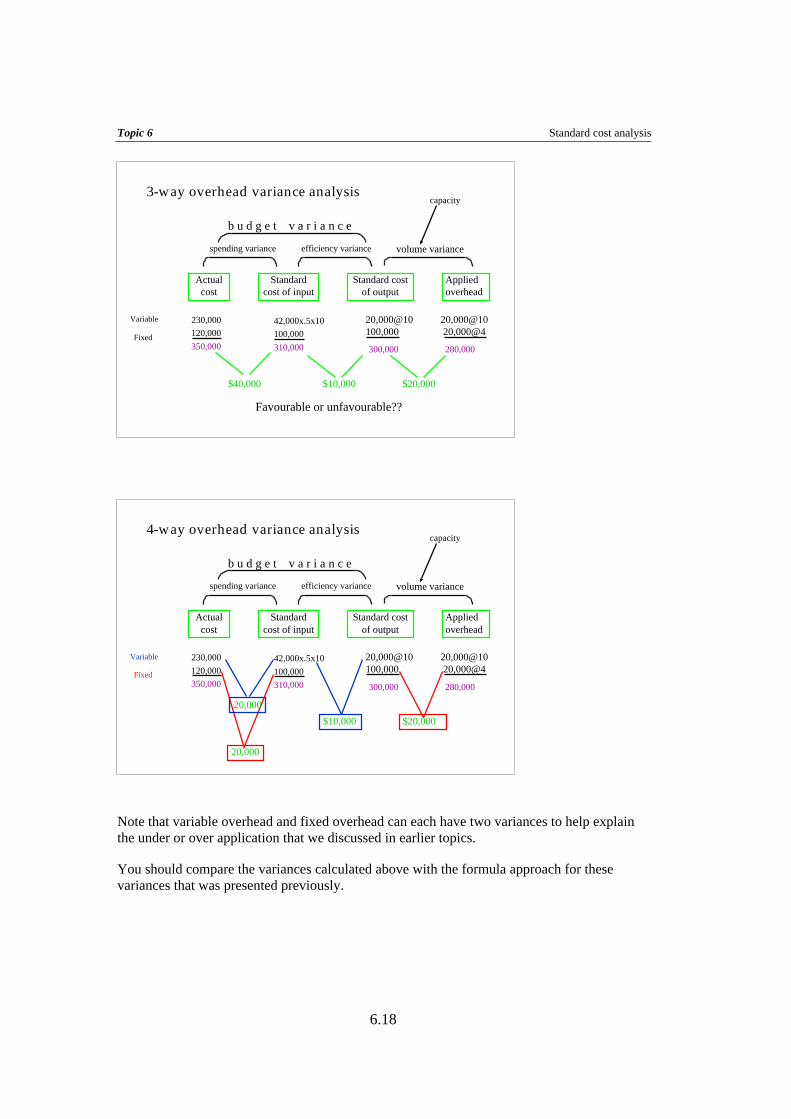
Note that variable overhead and fixed overhead can each have two variances to help explainthe under or over application that we discussed in earlier topics.
You should compare the variances calculated above with the formula approach for thesevariances that was presented previously.
3-way overhead variance analysis3-way overhead variance analysis
Actualcost
Standardcost of input
Standard costof output
230,000
120,000
20,000@10100,000
300,000
20,000@1020,000@4
280,000350,000
Variable
Fixed
Appliedoverhead
volume variance
$20,000
42,000x.5x10
100,000
310,000
$40,000 $10,000
spending variance efficiency variance
Favourable or unfavourable??
b u d g e t v a r i a n c e
capacity
4-way overhead variance analysis4-way overhead variance analysis
Actualcost
Standardcost of input
Standard costof output
230,000
120,000
20,000@10100,000
300,000
20,000@1020,000@4
280,000350,000
Variable
Fixed
Appliedoverhead
volume variance
$20,000
42,000x.5x10
100,000
310,000
$10,000
spending variance efficiency variance
b u d g e t v a r i a n c e
capacity
20,000
20,000
Managerial Accounting
6.19
Question
Question 6.4 from the self assessment questions at the end of this topic should be done now.
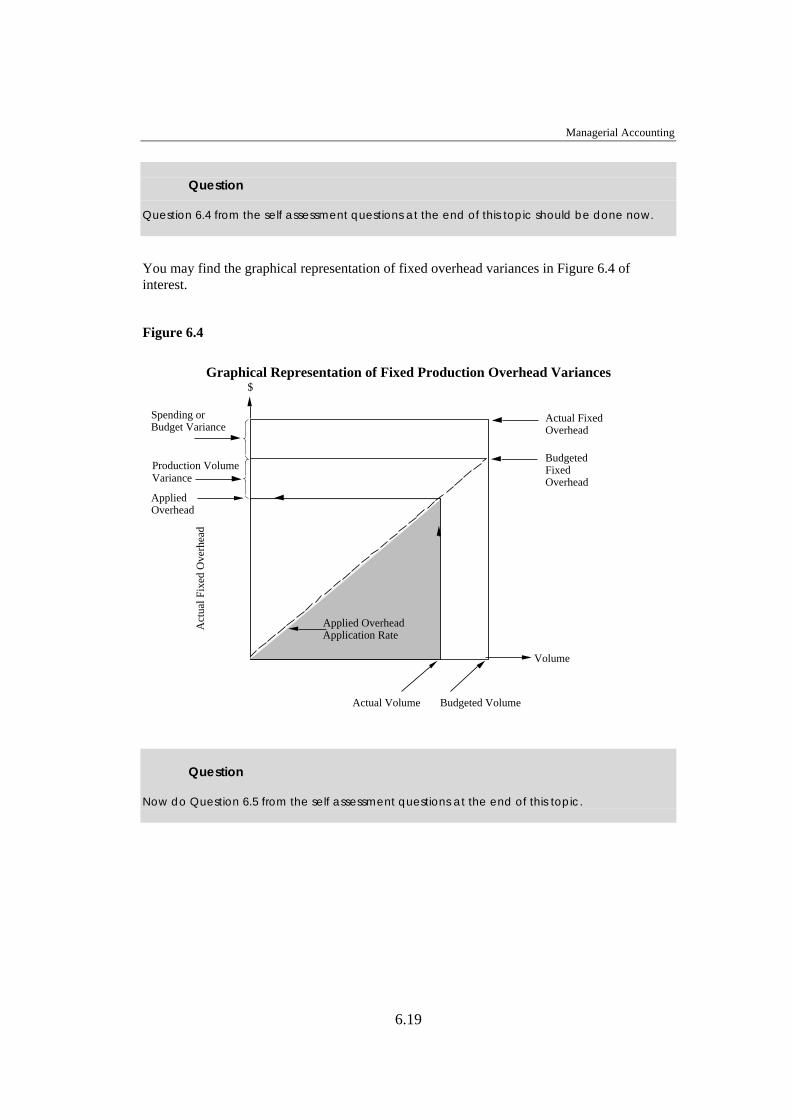
You may find the graphical representation of fixed overhead variances in Figure 6.4 ofinterest.
Figure 6.4
Graphical Representation of Fixed Production Overhead Variances
Spending orBudget Variance
Production VolumeVariance
BudgetedFixedOverhead
Actual Volume Budgeted Volume
Act
ual F
ixed
Ove
rhea
d
AppliedOverhead
Actual FixedOverhead
Volume
Applied OverheadApplication Rate
$
Question
Now do Question 6.5 from the self assessment questions at the end of this topic.

Topic 6 Standard cost analysis
6.20
Factors Affecting Follow-Up of Production Variables
Whether we are dealing with goods or services, these variances can be used to analyseperformance and control for outcomes. When should the variance be acted upon? The factorsthat influence this decision include the following:
• Is it a key measure with regard to overall outcomes?
• What is the acceptable range?
• Can they explain other things that are happening?
• How controllable or random is the item?
• Does it affect other important measures, actions, outcomes etc?
• Does it affect production?
• Or signal matters that can cause bigger problems in the future?
Gross Margin Variances
To complete our study of variance analysis we will consider the way that differences betweenactual gross margin and budgeted gross margin can be analysed.
ABC Co. records the following data:
The difficulty is really understanding why the gross margin is down $2,000 when sales are up.Is it because sales price was reduced? Is it because cost of goods was higher than anticipated?We can start with a flexible budget and draw some conclusions about this matter.
Budget Actual
Sales units 2,500 3,000
Sales $20,000 $22,500
Cost of sales 15,000 19,500
Gross margin $ 5,000 $ 3,000

Managerial Accounting
6.21
We have identified three component variances and we need to see the impact of each on thefinal gross margin:
Number sold:
Comparing the static budget and the flexible budget we can see that if we sell 3,000 instead of2,500 we would expect gross profit to rise by $1,000.
Sales price variance:
Now we are only considering the actual sales. At this sales volume we would expect toreceive revenue of $24,000 but only received revenue of $22,500. So the change on sales pricehas reduced revenue (and gross margin) by $1,500
Budget Actual Flexible budget
Sales units 2,500 3,000 3,000
Sales $20,000 $22,500 $24,000
Cost of sales 15,000 19,500 18,000
Gross margin $ 5,000 $ 3,000 $ 6,000
Gross margin variancesGross margin variances
Budget Actual Flexible budget
Sales units 2,500 3,000 3,000
Sales $20,000 $22,500 $24,000Cost of sales 15,000 19,500 18,000 Gross margin $ 5,000 $ 3,000 $ 6,000
sellingprice pu
down
cost of goodssold pu is up
No.sold
$1,000 (1,500)(1,500)$(2,000)

Topic 6 Standard cost analysis
6.22
Cost of goods sold
At this level of sales cost of goods sold should be $1,500 less so the change in cost of goodssold has reduced gross margin by $1,500.
To reconcile these variances with the original identified difference of $2,000:
Sales volume variance $1,000 F
Sales price variance 1,500 U
Cost of goods sold variance 1,500 U
Gross margin variance $2,000 U
There are more detailed sales variances that you could now study in textbooks if they are ofbenefit to you but they are beyond the scope of this course. You now have the basicknowledge that will make it easy for you to study variance analysis further.
Question
Complete your study of this topic by doing the review questions from the self assessmentquestions at the end of this topic.
Summary
In this topic you have seen the advantages that can come from analysing actual costs to derivea variety of variances. Standard costing facilitates this analysis by providing the standardagainst which to evaluate actual costs. Similarly, sales variances can be derived to provideuseful information for decision making.
The use of flexible budgets for performance evaluation is important as engineered costsshould differ from the static budget if forecast customer demand was wrong. To have the samecosts as in the budget it would be necessary to make what was in the original budget. Ifcustomer demand were lower than allowed for in the budget, this would produce a build-up ofinventory. If customer demand were higher than anticipated there would be stock-outs, andlost sales. Managers should not be penalised for taking appropriate action during a budgetperiod, and this can result from evaluation against a static budget. This matter will bediscussed further in Topic 9.
In the next topic we will study an alternative, more contemporary costing system that betterfacilities effective management in many modern firms.
Managerial Accounting
6.23
Reference
Schneider A and Sollenberger H (2002) Managerial Accounting: Manufacturing and ServiceApplications, 2nd edition, Dame

6.24
Self Assessment Questions
After you have prepared an answer to these questions you should compare it with the solutionprovided in the next section.
Question 6.1
From the following data for James Ltd., prepare
a. a static budget, and
b. a flexible budget for the actual output level.
Planned level of activity 5,000 units
Actual level of activity 4,700 units
Budgeted costs at the planned level of activity:
Labour costs 2 hours @ $15 per hour $30 per unit
Material costs 3 kgs @ $4 per kg 12 per unit
Overhead costs $4,000 fixed plus $8 per unit
Question 6.2
From the panel that illustrates direct labour variances identify actual rate, actual quantity,standard rate and standard quantity data.
Question 6.3
Use the data from question 6.1. Additional data are as follows:
Managerial Accounting
6.25
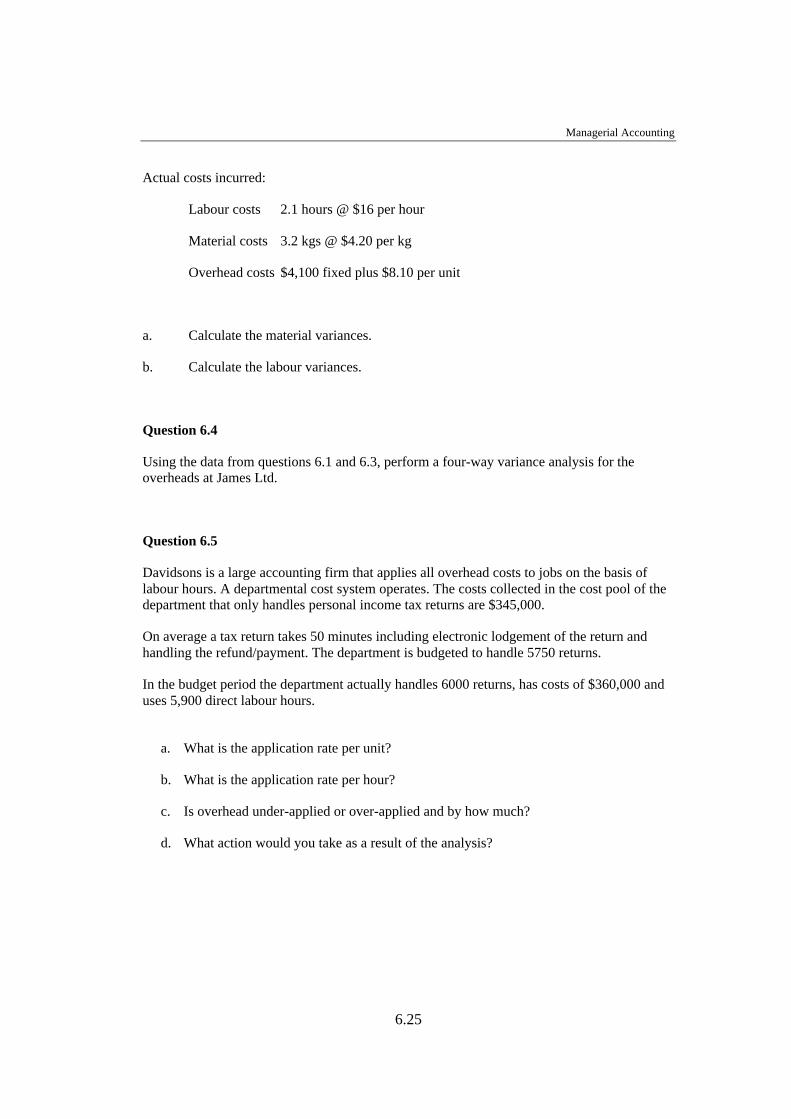
Actual costs incurred:
Labour costs 2.1 hours @ $16 per hour
Material costs 3.2 kgs @ $4.20 per kg
Overhead costs $4,100 fixed plus $8.10 per unit
a. Calculate the material variances.
b. Calculate the labour variances.
Question 6.4
Using the data from questions 6.1 and 6.3, perform a four-way variance analysis for theoverheads at James Ltd.
Question 6.5
Davidsons is a large accounting firm that applies all overhead costs to jobs on the basis oflabour hours. A departmental cost system operates. The costs collected in the cost pool of thedepartment that only handles personal income tax returns are $345,000.
On average a tax return takes 50 minutes including electronic lodgement of the return andhandling the refund/payment. The department is budgeted to handle 5750 returns.
In the budget period the department actually handles 6000 returns, has costs of $360,000 anduses 5,900 direct labour hours.
a. What is the application rate per unit?
b. What is the application rate per hour?
c. Is overhead under-applied or over-applied and by how much?
d. What action would you take as a result of the analysis?

Topic 6 Standard cost analysis
6.26
e. If the system changed to recognise the distinction between fixed overhead and variableoverhead, and you were told that half the budgeted overhead were fixed and half werevariable, and that actual fixed overhead came to $175,000:
i. What would the two overhead application rates be?ii. What four variances could you derive?
f. What action might you take?
Question 6.6
Explain why overhead variances occur.
Review Question 6.1
G L Ong runs a food processing plant. One of the products, Sun-dried Strawberry Bix, ismade from ingredients that are expected to cost $12 per box of bix's. For each box, 2kg ofpremixed ingredients are normally used. These ingredients are bought from a subsidiary andthe cost is usually $6 per kg.
The conversion costs for the bix's are expected to be $9 per box. Of the conversion costs onethird is for direct labour costs. The budget for the week is for 4,000 boxes of bix's to beproduced and dispatched to supermarkets. This is expected to take 500 direct labour hours.
In the week 3800 boxes are produced and dispatched. Because of a drought, strawberries weremore expensive than expected. After mixing with grains, flour and fats the materials cost $6per kg to produce so the subsidiary charged Ong $8 per kg. Due to the mix being inferior tonormal supplies, 8,200 kg of material were used.
Labour costs were $11,550 for 535 hours work.
a. Compute two material variances and two labour variances.
b. Comment on the variances.
Managerial Accounting
6.27
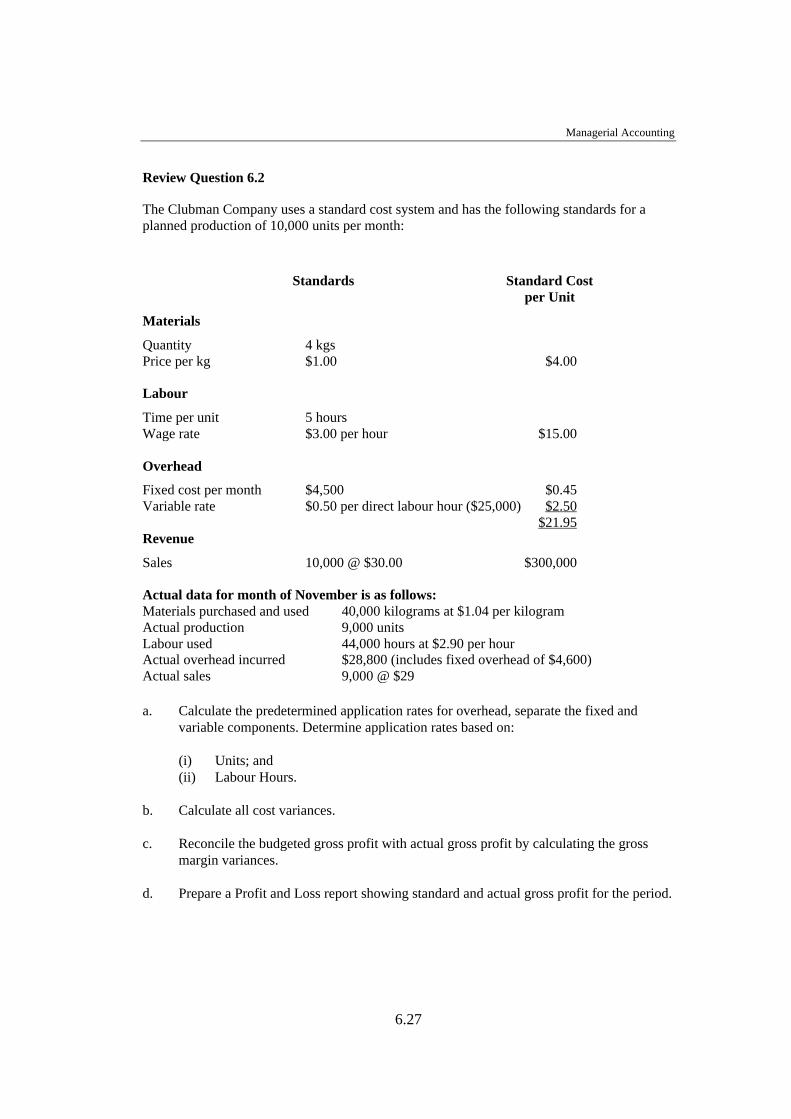
Review Question 6.2
The Clubman Company uses a standard cost system and has the following standards for aplanned production of 10,000 units per month:
Standards Standard Costper Unit
Materials
Quantity 4 kgsPrice per kg $1.00 $4.00
Labour
Time per unit 5 hoursWage rate $3.00 per hour $15.00
Overhead
Fixed cost per month $4,500 $0.45Variable rate $0.50 per direct labour hour ($25,000) $2.50
$21.95Revenue
Sales 10,000 @ $30.00 $300,000
Actual data for month of November is as follows:Materials purchased and used 40,000 kilograms at $1.04 per kilogramActual production 9,000 unitsLabour used 44,000 hours at $2.90 per hourActual overhead incurred $28,800 (includes fixed overhead of $4,600)Actual sales 9,000 @ $29
a. Calculate the predetermined application rates for overhead, separate the fixed andvariable components. Determine application rates based on:
(i) Units; and(ii) Labour Hours.
b. Calculate all cost variances.
c. Reconcile the budgeted gross profit with actual gross profit by calculating the grossmargin variances.
d. Prepare a Profit and Loss report showing standard and actual gross profit for the period.
Topic 6 Standard cost analysis
6.28
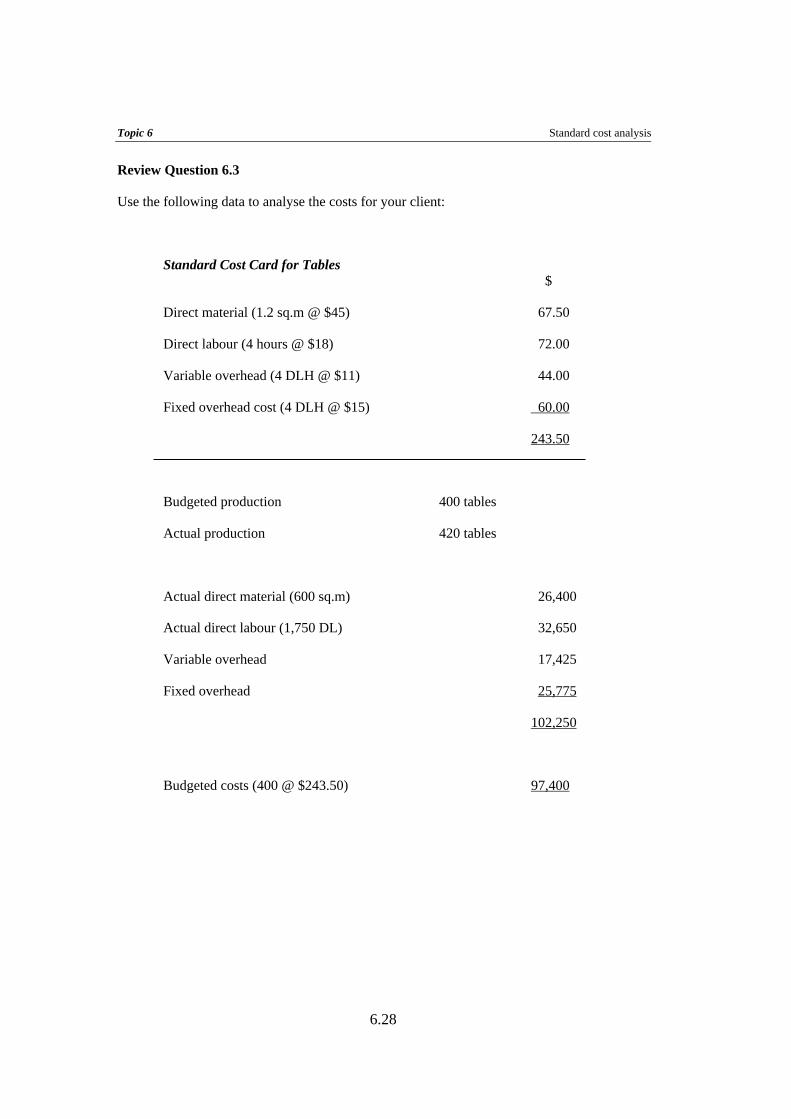
Review Question 6.3
Use the following data to analyse the costs for your client:
Standard Cost Card for Tables $
Direct material (1.2 sq.m @ $45) 67.50
Direct labour (4 hours @ $18) 72.00
Variable overhead (4 DLH @ $11) 44.00
Fixed overhead cost (4 DLH @ $15) 60.00
243.50
Budgeted production 400 tables
Actual production 420 tables
Actual direct material (600 sq.m) 26,400
Actual direct labour (1,750 DL) 32,650
Variable overhead 17,425
Fixed overhead 25,775
102,250
Budgeted costs (400 @ $243.50) 97,400

6.29
Solutions to Self Assessment Questions
Question 6.1
a. b.Static Budget Flexible Budget ( 5,000 units) (4,700 units)
Materials 60,000 56,400
Labour 150,000 141,000
Variable overhead 40,000 37,600
Fixed overhead 4,000 4,000
Total budgeted cost 254,000 239,000
Question 6.2
Actual labour hours: 1,447
Paid at an average actual labour rate of $18.60 per hour
On average each unit is expected to take 2.5 hours
And the average wage rate is expected to be $19
Additional information is that the output was 550 units
Question 6.3
a. Material variances
Actual Standard cost Standard costCost of input for output
4700 x 3.2 x 4.20 4700 x 3.2 x 4 4700 x 3 x 463,168 60,160 56,400
price variance usage variance(3008) (3760)

Topic 6 Standard cost analysis
6.30
Alternatively:
Price variance = 4700 x 3.2 x (4 - 4.20)= 3008 Unf.
Usage variance = 4700 x (3 - 3.20) x 4= 3760 Unf.
b. Labour variances:
Actual Standard cost Standard costCost of input for output
4700 x 2.1 x 16 4700 x 3.2 x 4 4700 x 3 x 4157,920 148,050 141,000
rate variance efficiency variance(9870) (7050)
Alternatively:
Expected cost of actual hours 148,050Actual cost of actual hours 157,920 Rate variance (9870)
Expected cost for the output 141,000Expected cost of the input 148,050 Efficiency variance (7050)
Question 6.4
Variable overhead variances
The variable overhead rate is not based on DLH or machine hours etc. As it is directly relatedto units there is not an efficiency variance.
Spending variance = $4700 (8 - 8.10)) = $470 Unf.
If variable overhead were applied based on DLH the efficiency variance would be calculatedthe same way as the DL efficiency variance.
Fixed overhead variances
Spending variance = Budgeted FOH - Actual FOH = $(4000 - 4100) = $100 Unf

Managerial Accounting
6.31
Volume variance = Applied FOH - Budgeted FOH = $(4700 - 5000) .80* = $240 Unf
* Application rate = $4000 / 5000 units = $0.80 pu
Question 6.5
a. $345,000 / 5750 units = $60 per unit
b. $60 ÷ 50/60 hours = $72 per hour
c. Overhead applied = 6000 units x (50/60) standard DLH x $72 per hour = $360,000Actual overhead = $360,000So overhead was neither over nor under applied!
Alternative calculation of applied overhead is 6000 units @ $60 per unit.
d. Probably feel very self-satisfied.
e. i.
Variable cost per unit = $172,500 / 5750 = $30 per unit but the firm uses a rate perhour:Variable cost per hour = $172,500 / 4791.67 Std DLH = $36 per Std DLH
The same calculations would be performed for fixed overhead to get the sameapplication rates for fixed overhead.
ii. $Variable overhead spending variance:Expected VOH for the input of 5,900 hours (5,900 x 36) = 212,400Actual VOH (360,000 - 175,000) = 185,000 27,400 F
Variable overhead efficiency variance:Expected VOH for this output (same whether based on units or hours!) = 180,000Expected VOH for the input of 5,900 hours (5,900 x 36) = 212,400 32,400 U
Fixed overhead spending variance:Budgeted FOH = 172,500Actual FOH = 175,000 2,500 U

Topic 6 Standard cost analysis
6.32
Volume variance:Applied FOH (6000units x .8333 Std DLH x $36 per Std DLH)* = 180,000Budgeted FOH = 172,500 7,500 F
* The standard for the output will always be the same whether you base it on Std denominator units (inthis case Std DLH) or Std per unit (6000 @ $30 in this case).
Reconciliation: Variable overhead spending variance 27,400 F Variable overhead efficiency variance 32,400 U Fixed overhead spending variance 2,500 U Volume variance 7,500 F 0 .
f. The variable costs should be investigated to see why there was an overestimation ofthem. Perhaps the analysis of fixed versus variable was incorrect, perhaps there was awise decision during the period that cut variable costs, or perhaps a supplier actual cutprices. Investigate to see if there was a wise move that could be replicated.
It appears that the estimate of 50 minutes, on average, was wrong (see efficiencyvariance. Investigate to see whether it was due to less experienced staff who willimprove for next year, because the standard was unrealistic, because some peoplewere lazy, or perhaps work stations need to be improved to cut time. Investigate toexplain this unfavourable variance.
Fixed overhead was underestimated. Check to see whether this is a recurring costincrease so that it can be allowed fro in the next period. Or whether there was a costthat should not have existed. Or perhaps (for all of these) there was an error inrecording data.
The volume variance shows that there was more business than anticipated. This isgood. Could be investigated to see why. Perhaps it was an advertising campaign thatshould be repeated next year. Maybe a sponsorship of a sporting team, orpresentations at elderly citizen clubs worked? Investigate.
Question 6.6
Overhead variances occur because:
a. The actual amount of overhead incurred differs from the budgeted amount. This is anumerator problem in the determination of the application rate. It is called a Spendingvariance for variable overhead and a Budget variance (or Spending variance) for fixedoverhead. (Note that the budgeted amount of variable overhead – budget allowance foractual inputs – varies with the actual number of inputs – say labour hours – used).

Managerial Accounting
6.33
b. In relation to variable overhead, the actual amount of inputs used, (say actual labourhours) differs from the standard inputs allowed for the actual output. This is adenominator problem and is called an Efficiency variance for variable overhead.
c. In relation to fixed overhead, the actual amount of activity (output) achieved during theperiod differs from the budgeted activity (output) for the period. This will result eitherin a greater amount of fixed overhead applied (over-applications, where actual activityexceeds the budget) or a lesser amount of fixed overhead applied than budgeted (under-application, where actual activity is less than budget). This is a denominator problemas well and is called a fixed production overhead Volume variance.
Additionally you may have:
• erroneous assumptions re fixed overhead rate
• erroneous assumptions re variable overhead incurrence
• changed prices
• inefficient labour
• etc etc
Review Question 6.1
a. Standard material cost per box 2kg @ $6 per kg $12 Standard labour cost per box 1/8 hours @ $24 per hour $ 3
DM price variance = 8,200 x $(6 - 8) = $(16,400)DM usage variance = $6 x (3800 x 2 - 8200) = $(3,600)
DL rate variance = 535 x $24 - $11,550 = $1,290DL efficiency variance = $24 x (3800/8 - 535) = $(1,440)
b. The extra price of material has been explained so it is not surprising that we have anunfavourable price variance of $16,400. In fact this is a very large variance (33% ofthe standard cost for that input!)
The material usage is also poor but this is explained to be due to the poor quality ofthe supplies.
Topic 6 Standard cost analysis
6.34
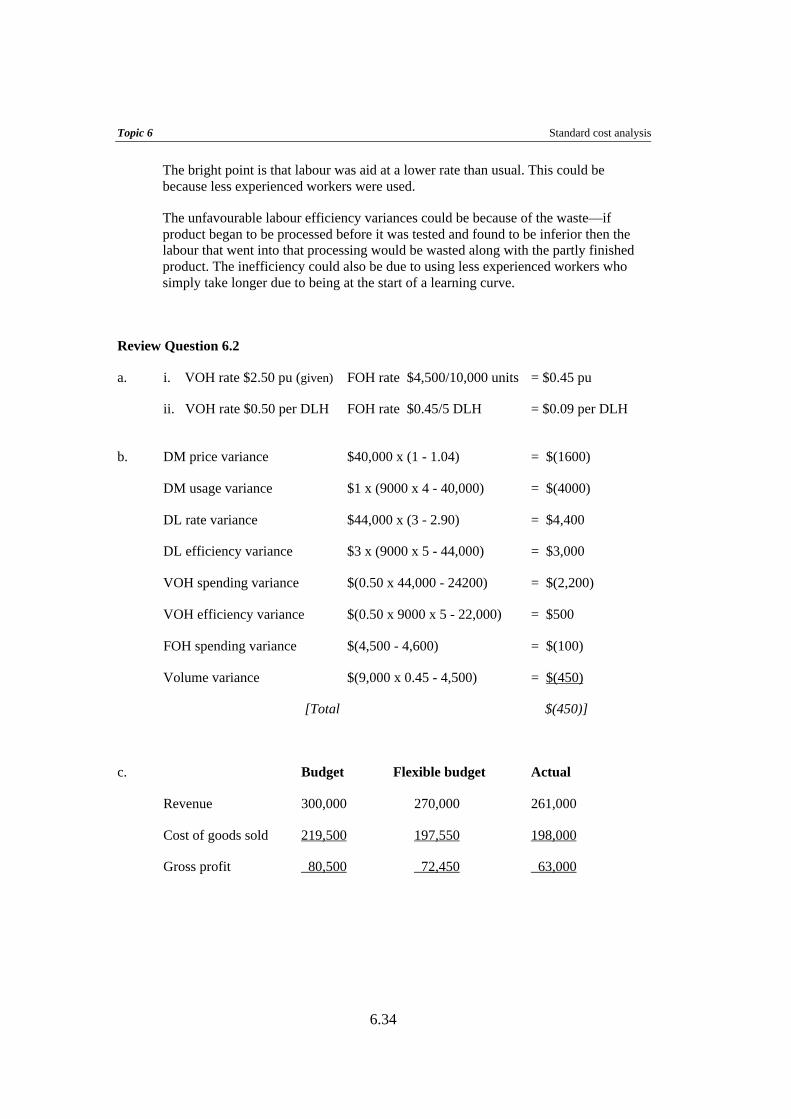
The bright point is that labour was aid at a lower rate than usual. This could bebecause less experienced workers were used.
The unfavourable labour efficiency variances could be because of the waste—ifproduct began to be processed before it was tested and found to be inferior then thelabour that went into that processing would be wasted along with the partly finishedproduct. The inefficiency could also be due to using less experienced workers whosimply take longer due to being at the start of a learning curve.
Review Question 6.2
a. i. VOH rate $2.50 pu (given) FOH rate $4,500/10,000 units = $0.45 pu
ii. VOH rate $0.50 per DLH FOH rate $0.45/5 DLH = $0.09 per DLH
b. DM price variance $40,000 x (1 - 1.04) = $(1600)
DM usage variance $1 x (9000 x 4 - 40,000) = $(4000)
DL rate variance $44,000 x (3 - 2.90) = $4,400
DL efficiency variance $3 x (9000 x 5 - 44,000) = $3,000
VOH spending variance $(0.50 x 44,000 - 24200) = $(2,200)
VOH efficiency variance $(0.50 x 9000 x 5 - 22,000) = $500
FOH spending variance $(4,500 - 4,600) = $(100)
Volume variance $(9,000 x 0.45 - 4,500) = $(450)
[Total $(450)]
c. Budget Flexible budget Actual
Revenue 300,000 270,000 261,000
Cost of goods sold 219,500 197,550 198,000
Gross profit 80,500 72,450 63,000

Managerial Accounting
6.35
A reconciliation of budgeted gross profit with actual gross profit can be found in thefollowing statement:
Budgeted gross profit $80,500
Volume variance (72,450 - 80,500) (8,050)
Standard gross profit 72,450
Price variance (261,000 - 270,000) $(9,000)
Cost variances (197,550 - 198,000) (450) (9,450)
Actual gross profit $63,000
d. Depending on the usde to which the information is to be put the statement couldtake one of a variety of formats:
i. Standard gross profit (9,000 @ 8.05) 72,450
Price variance (261,000 - 270,000) $(9,000)
Cost variances:
DM price variance $(1600)
DM usage variance (4000)
DL rate variance 4,400
DL efficiency variance 3,000
VOH spending variance (2,200)
VOH efficiency variance 500
FOH spending variance (100)
Volume variance (450) (450) (9,450)
Actual gross profit $63,000
Topic 6 Standard cost analysis
6.36
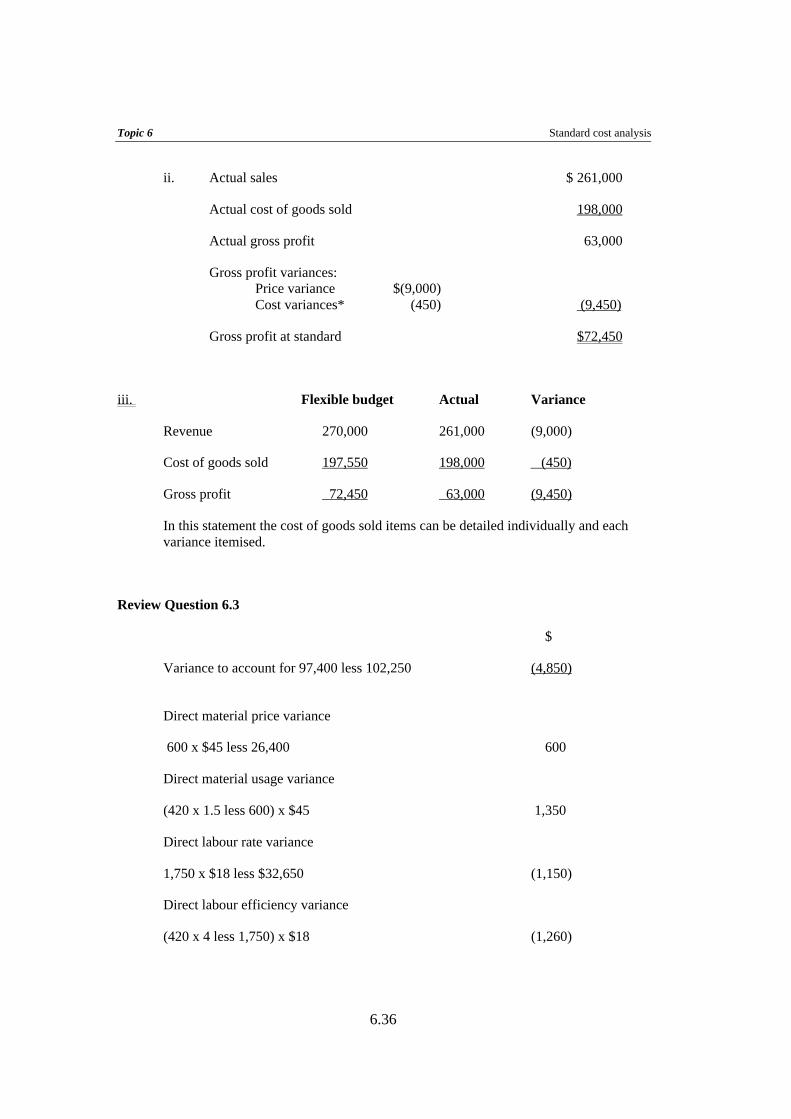
ii. Actual sales $ 261,000
Actual cost of goods sold 198,000
Actual gross profit 63,000
Gross profit variances: Price variance $(9,000) Cost variances* (450) (9,450)
Gross profit at standard $72,450
iii. Flexible budget Actual Variance
Revenue 270,000 261,000 (9,000)
Cost of goods sold 197,550 198,000 (450)
Gross profit 72,450 63,000 (9,450)
In this statement the cost of goods sold items can be detailed individually and eachvariance itemised.
Review Question 6.3
$
Variance to account for 97,400 less 102,250 (4,850)
Direct material price variance
600 x $45 less 26,400 600
Direct material usage variance
(420 x 1.5 less 600) x $45 1,350
Direct labour rate variance
1,750 x $18 less $32,650 (1,150)
Direct labour efficiency variance
(420 x 4 less 1,750) x $18 (1,260)
Managerial Accounting
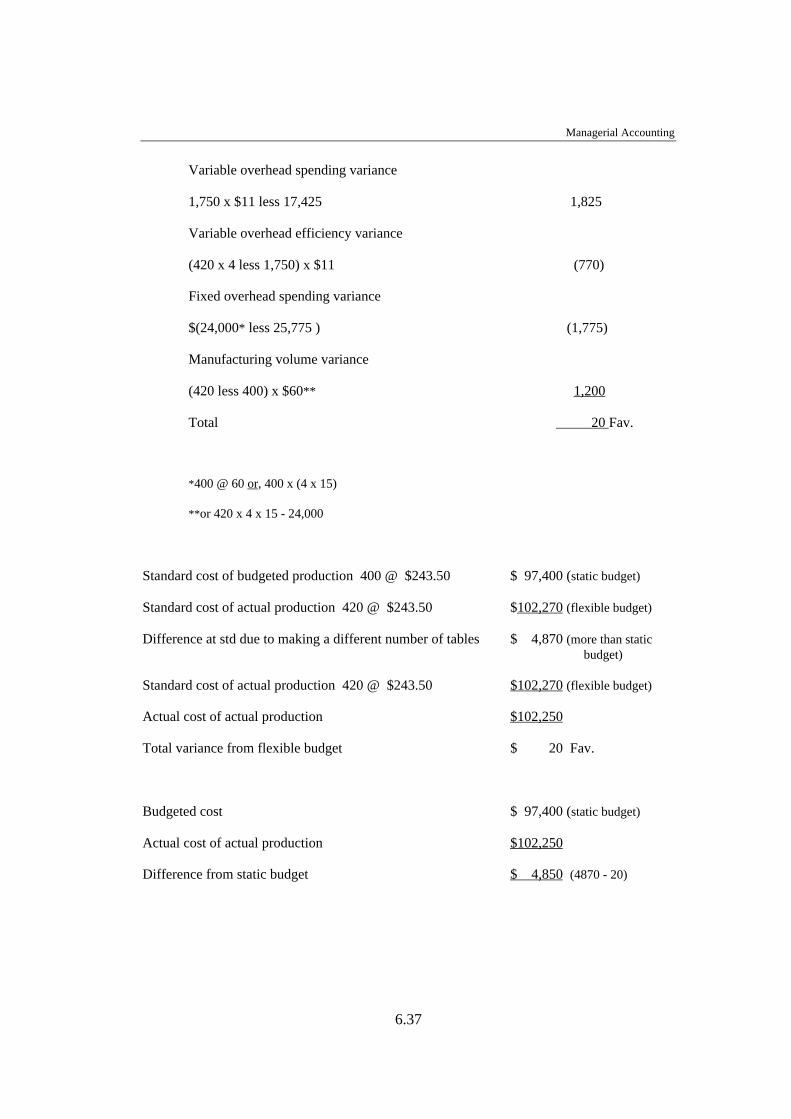
6.37
Variable overhead spending variance
1,750 x $11 less 17,425 1,825
Variable overhead efficiency variance
(420 x 4 less 1,750) x $11 (770)
Fixed overhead spending variance
$(24,000* less 25,775 ) (1,775)
Manufacturing volume variance
(420 less 400) x $60** 1,200
Total 20 Fav.
*400 @ 60 or, 400 x (4 x 15)
**or 420 x 4 x 15 - 24,000
Standard cost of budgeted production 400 @ $243.50 $ 97,400 (static budget)
Standard cost of actual production 420 @ $243.50 $102,270 (flexible budget)
Difference at std due to making a different number of tables $ 4,870 (more than static budget)
Standard cost of actual production 420 @ $243.50 $102,270 (flexible budget)
Actual cost of actual production $102,250
Total variance from flexible budget $ 20 Fav.
Budgeted cost $ 97,400 (static budget)
Actual cost of actual production $102,250
Difference from static budget $ 4,850 (4870 - 20)