Historical Cartography of Rio de Janeiro: Spatial and Temporal Reconstitution of Downtown

Topic 5: Geographic Information Systems
The materials used here have been assembled as part of the AquaSpace project(Ecosystem Approach to making Space for Aquaculture, http://aquaspace-h2020.eu)
and has received funding from the European Union's Horizon 2020 Framework Programme for Research and Innovation under grant agreement n° 633476.
They may be used under a Creative Commons Attribution-ShareAlike 4.0 International License, with attribution to the author
Horizon 2020
David Miller, Chen Wang, Gillian Donaldson-Selby, Dave Miller, Margaret McKeen
James Hutton Institute
Antje Gimpel, Thünen-Institut
Masters Module PLANNING AND MANAGING THE USE OF SPACE FOR AQUACULTURE
31 January 2018
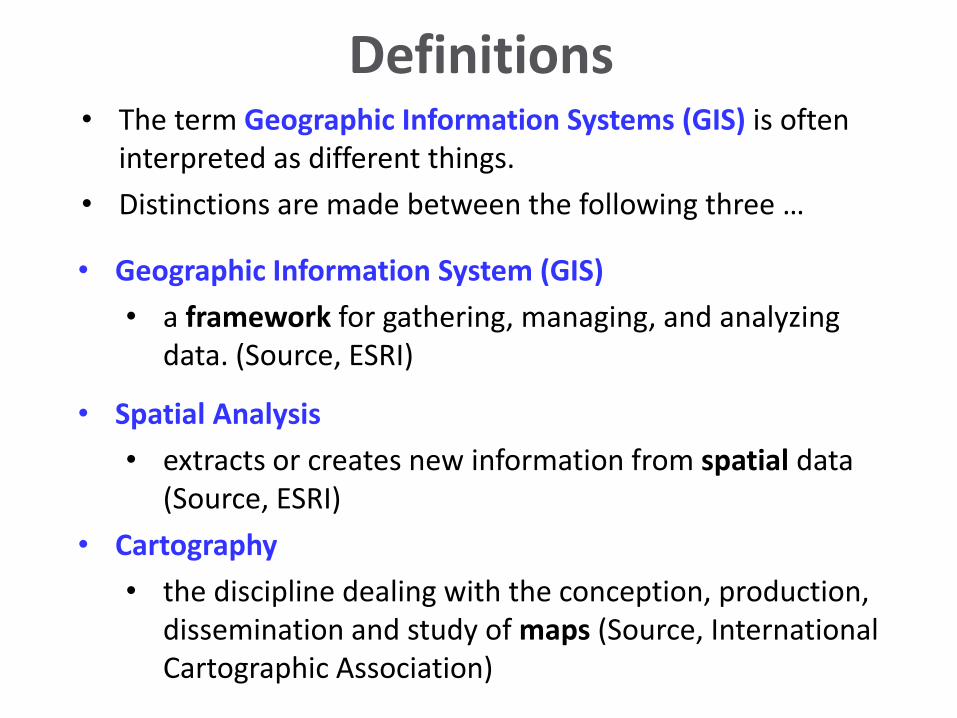
• Geographic Information System (GIS)
• a framework for gathering, managing, and analyzingdata. (Source, ESRI)
Definitions
• Spatial Analysis
• extracts or creates new information from spatial data (Source, ESRI)
• Cartography
• the discipline dealing with the conception, production, dissemination and study of maps (Source, International Cartographic Association)
• The term Geographic Information Systems (GIS) is often interpreted as different things.
• Distinctions are made between the following three …
Examples applications in relation to aquaculture …
• Geographic Information Systems –
• Bringing together data on natural resources, protected areas, transport routes, model output datasets
• Spatial analysis -
• Deriving visibility of fish cages from tourist viewpoints
• Measuring distance between features (e.g. coast and aquaculture site)
• Quantifying number of fish cages within a defined area
• Cartography -
• Producing maps of areas suitable for aquaculture development
Purposes
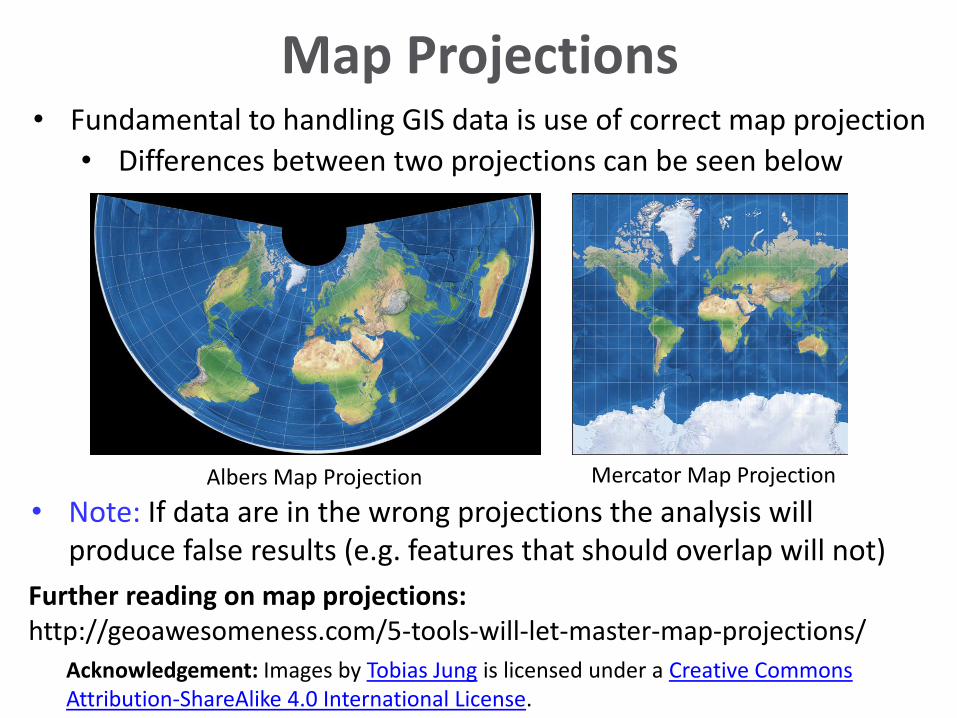
• Fundamental to handling GIS data is use of correct map projection
• Differences between two projections can be seen below
Map Projections
• Note: If data are in the wrong projections the analysis will produce false results (e.g. features that should overlap will not)
Further reading on map projections:http://geoawesomeness.com/5-tools-will-let-master-map-projections/
Albers Map Projection Mercator Map Projection
Acknowledgement: Images by Tobias Jung is licensed under a Creative Commons Attribution-ShareAlike 4.0 International License.
• Fundamental concepts are scale and resolution
• Map scale refers to the relationship (or ratio) between distance on a map and the corresponding distance on the ground (Source, Geoscience Australia)
[Note, in cartography …
Large scale = greater detail; Small scale = lower detail.
In other disciplines, the terms are used the opposite way around]
• Resolution refers to the detail with which a map depicts the location and shape of geographic features (source, ESRI)
Scale and Resolution
Data Structures
• Geographic features or elements are represented in one or more of different data structures:
• Raster, Vector, Triangulated Irregular Network, Object-based
(see next slide for examples)
Data Structures
Data Formats
• Data are held in one of many different formats
• Many are proprietary; conversions are possible between most, but not always
• Example formats
• Image JPG, PNG,
• Raster ESRI GRID, IMAGE (Erdas Imagine)
• Polygon, lines Shapefile (.shp, .shx etc.), DXF
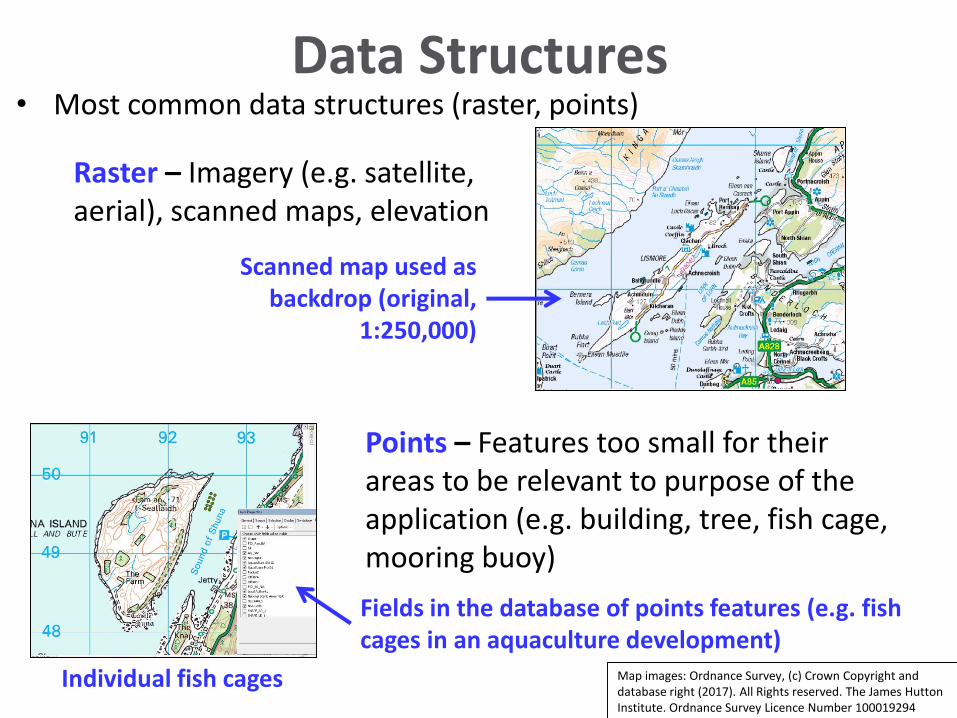
Data Structures• Most common data structures (raster, points)
Raster – Imagery (e.g. satellite, aerial), scanned maps, elevation
Points – Features too small for their areas to be relevant to purpose of the application (e.g. building, tree, fish cage, mooring buoy)
Individual fish cages
Scanned map used as backdrop (original,
1:250,000)
Fields in the database of points features (e.g. fish cages in an aquaculture development)
Map images: Ordnance Survey, (c) Crown Copyright and database right (2017). All Rights reserved. The James Hutton Institute. Ordnance Survey Licence Number 100019294
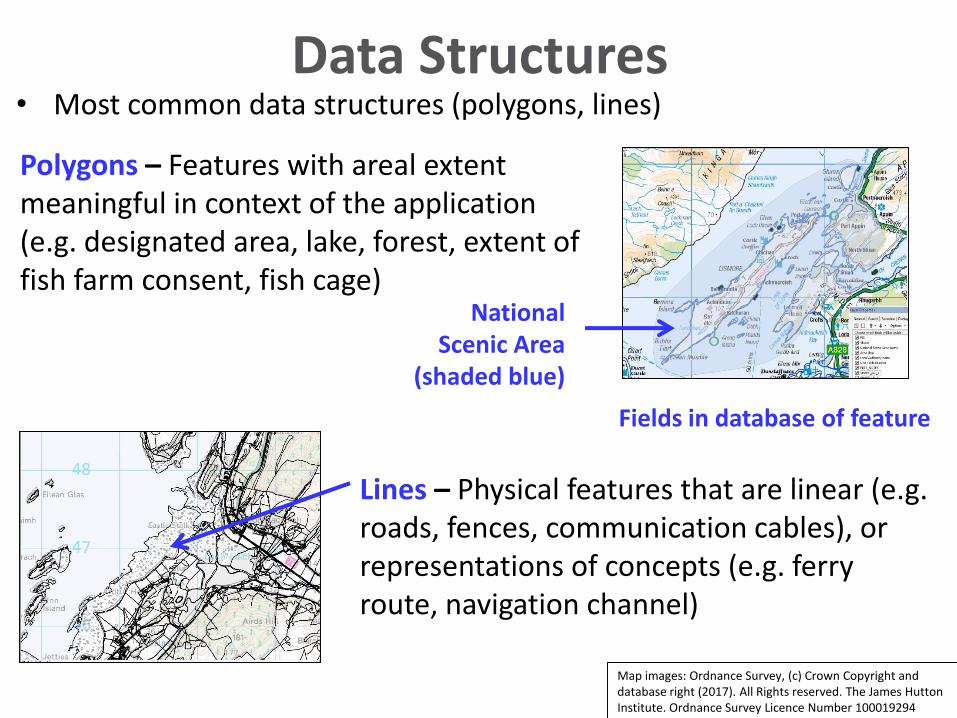
Data Structures
Polygons – Features with areal extent meaningful in context of the application (e.g. designated area, lake, forest, extent of fish farm consent, fish cage)
National Scenic Area
(shaded blue)
Fields in database of feature
Lines – Physical features that are linear (e.g. roads, fences, communication cables), or representations of concepts (e.g. ferry route, navigation channel)
Map images: Ordnance Survey, (c) Crown Copyright and database right (2017). All Rights reserved. The James Hutton Institute. Ordnance Survey Licence Number 100019294
• Most common data structures (polygons, lines)
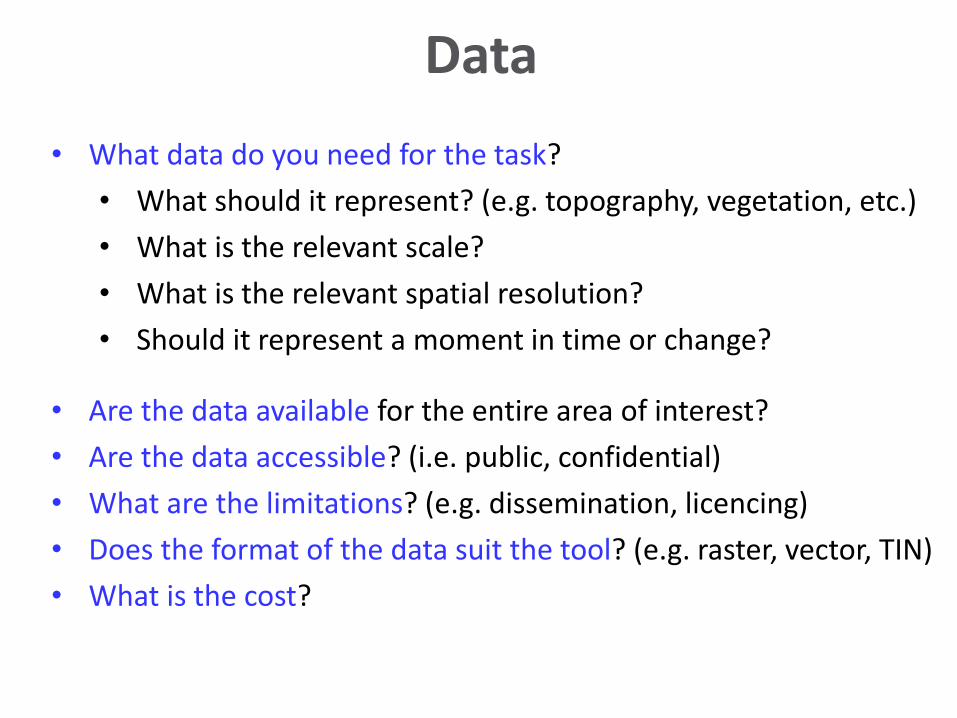
Data
• What data do you need for the task?
• What should it represent? (e.g. topography, vegetation, etc.)
• What is the relevant scale?
• What is the relevant spatial resolution?
• Should it represent a moment in time or change?
• Are the data available for the entire area of interest?
• Are the data accessible? (i.e. public, confidential)
• What are the limitations? (e.g. dissemination, licencing)
• Does the format of the data suit the tool? (e.g. raster, vector, TIN)
• What is the cost?
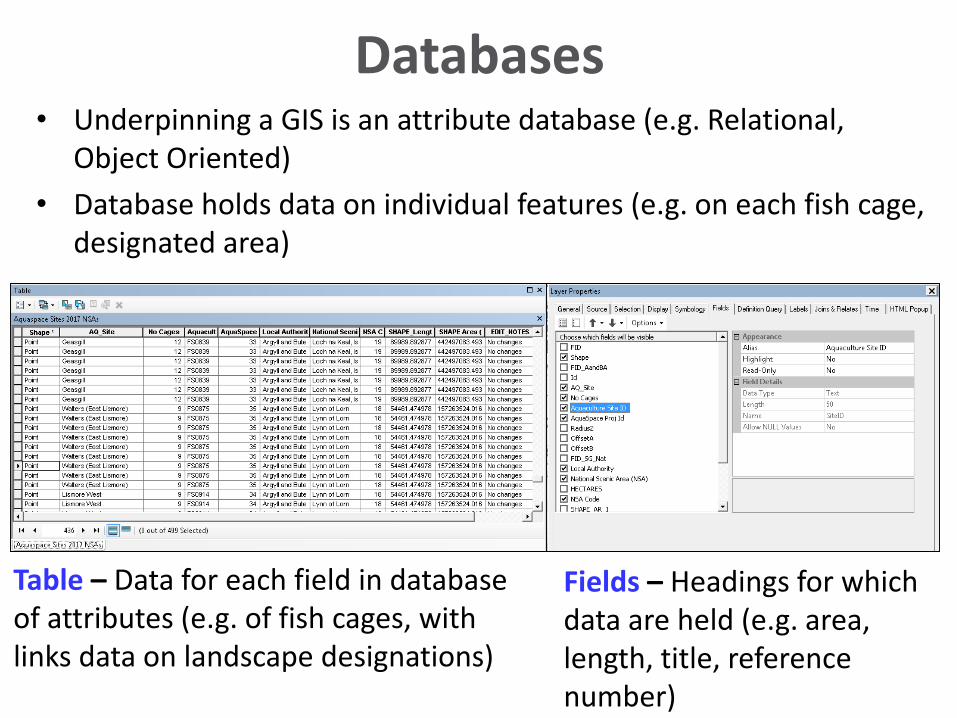
• Underpinning a GIS is an attribute database (e.g. Relational, Object Oriented)
• Database holds data on individual features (e.g. on each fish cage, designated area)
Databases
Table – Data for each field in database of attributes (e.g. of fish cages, with links data on landscape designations)
Fields – Headings for which data are held (e.g. area, length, title, reference number)
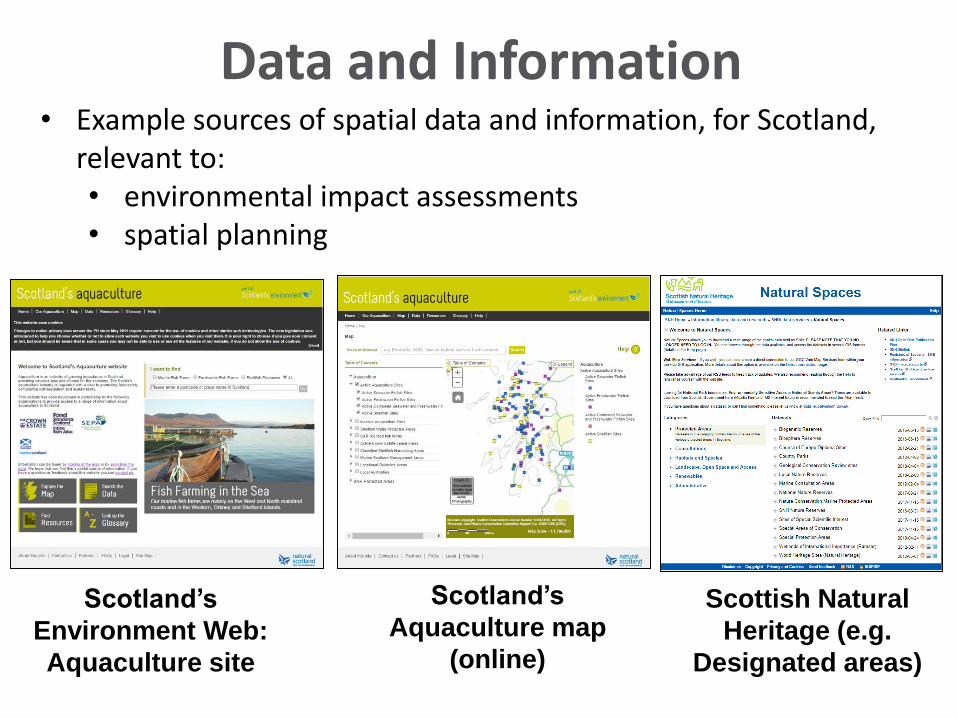
Data and Information• Example sources of spatial data and information, for Scotland,
relevant to:• environmental impact assessments• spatial planning
Scotland’s
Environment Web:
Aquaculture site
Scottish Natural
Heritage (e.g.
Designated areas)
Scotland’s
Aquaculture map
(online)
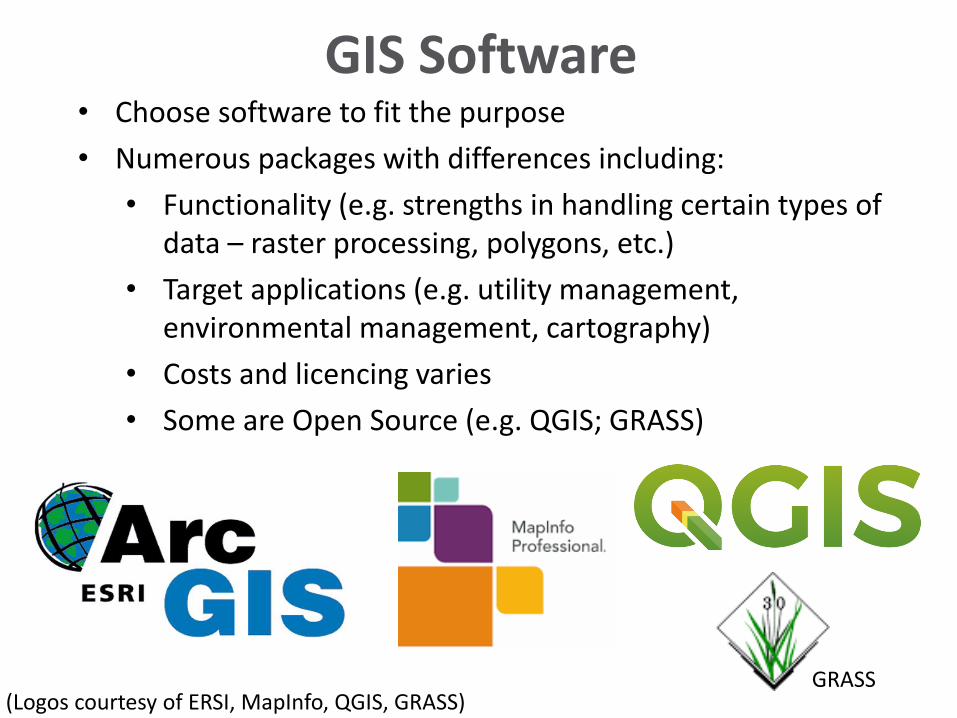
GIS Software• Choose software to fit the purpose
• Numerous packages with differences including:
• Functionality (e.g. strengths in handling certain types of data – raster processing, polygons, etc.)
• Target applications (e.g. utility management, environmental management, cartography)
• Costs and licencing varies
• Some are Open Source (e.g. QGIS; GRASS)
GRASS(Logos courtesy of ERSI, MapInfo, QGIS, GRASS)
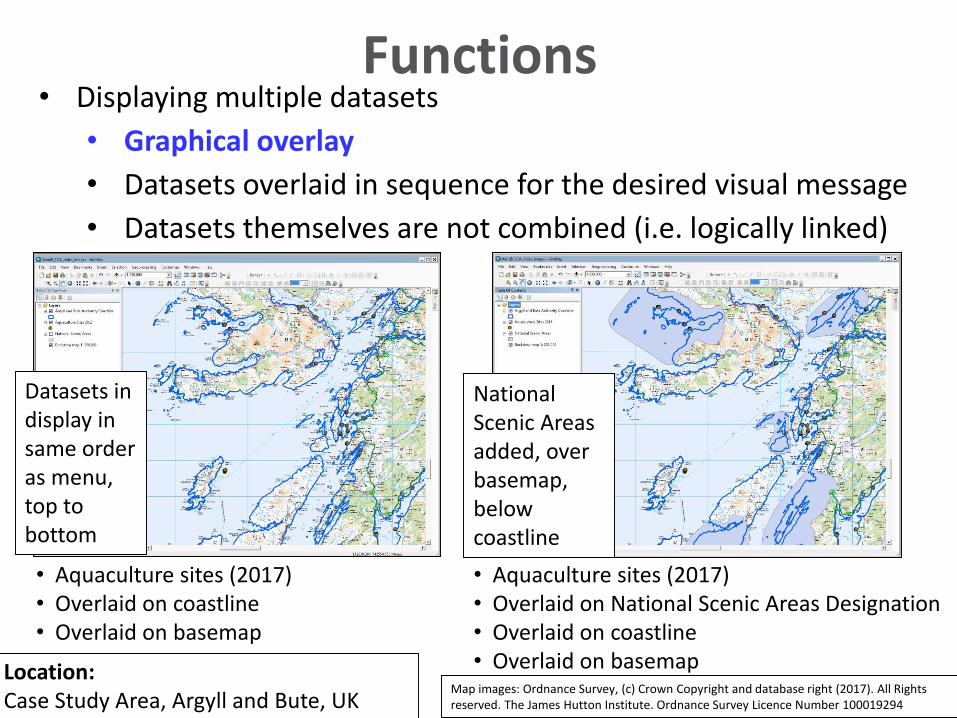
• Displaying multiple datasets
• Graphical overlay
• Datasets overlaid in sequence for the desired visual message
• Datasets themselves are not combined (i.e. logically linked)
Functions
• Aquaculture sites (2017)• Overlaid on coastline• Overlaid on basemap
• Aquaculture sites (2017)• Overlaid on National Scenic Areas Designation• Overlaid on coastline• Overlaid on basemapLocation:
Case Study Area, Argyll and Bute, UK
Datasets in display in same order as menu, top to bottom
National Scenic Areas added, over basemap, below coastline
Map images: Ordnance Survey, (c) Crown Copyright and database right (2017). All Rights reserved. The James Hutton Institute. Ordnance Survey Licence Number 100019294
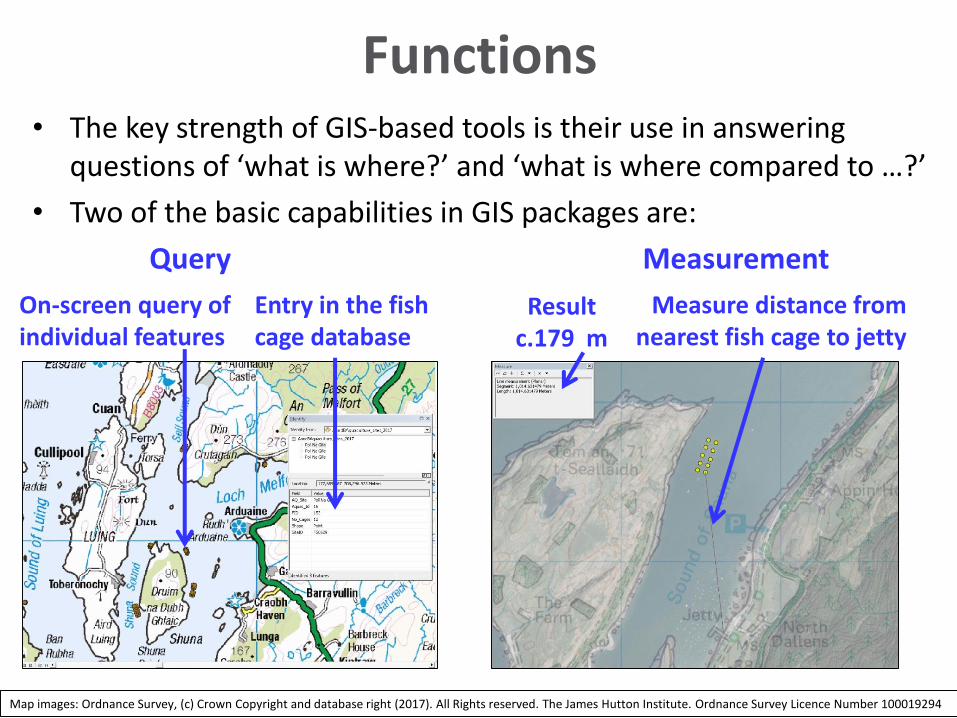
• The key strength of GIS-based tools is their use in answering questions of ‘what is where?’ and ‘what is where compared to …?’
• Two of the basic capabilities in GIS packages are:
Query Measurement
Functions
Map images: Ordnance Survey, (c) Crown Copyright and database right (2017). All Rights reserved. The James Hutton Institute. Ordnance Survey Licence Number 100019294
On-screen query of individual features
Entry in the fish cage database
Measure distance from nearest fish cage to jetty
Result c.179 m
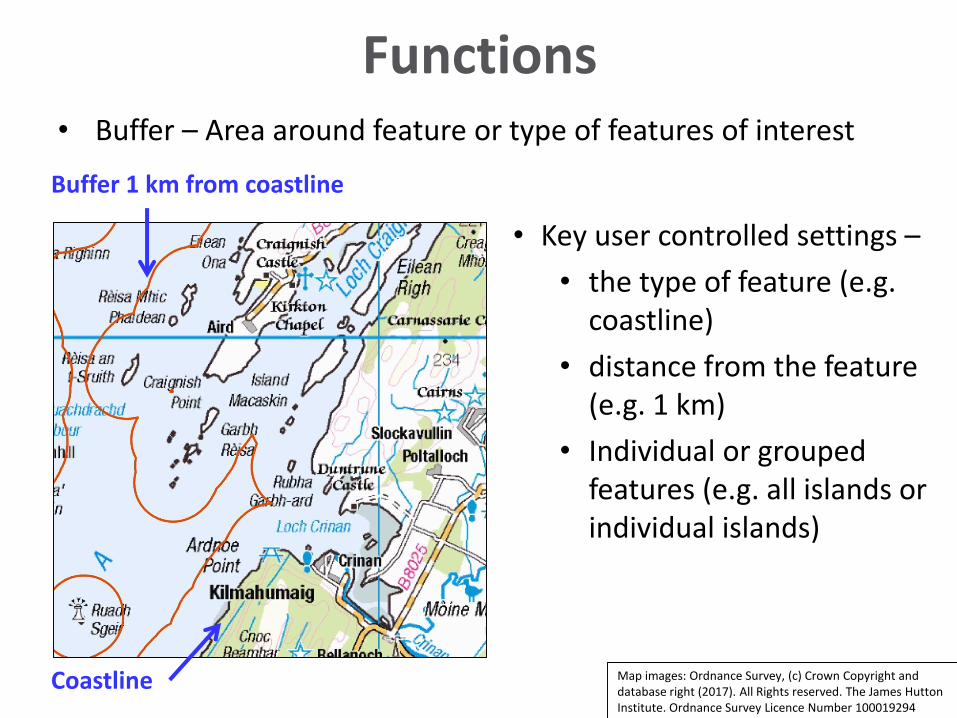
• Buffer – Area around feature or type of features of interest
Functions
• Key user controlled settings –
• the type of feature (e.g. coastline)
• distance from the feature (e.g. 1 km)
• Individual or grouped features (e.g. all islands or individual islands)
Buffer 1 km from coastline
Coastline Map images: Ordnance Survey, (c) Crown Copyright and database right (2017). All Rights reserved. The James Hutton Institute. Ordnance Survey Licence Number 100019294
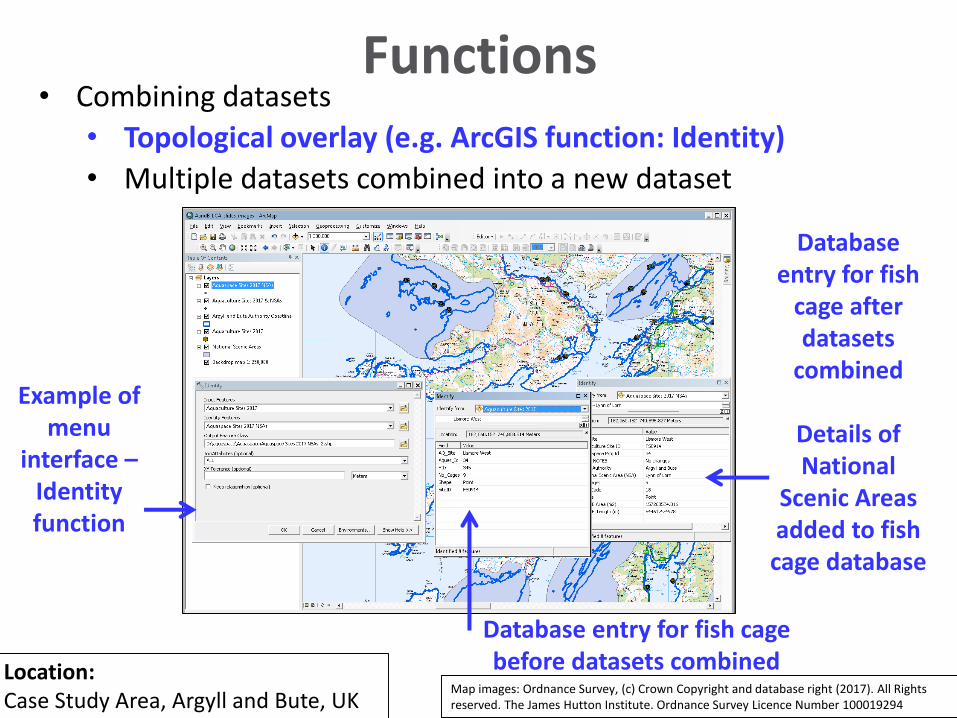
• Combining datasets
• Topological overlay (e.g. ArcGIS function: Identity)
• Multiple datasets combined into a new dataset
Functions
Location:Case Study Area, Argyll and Bute, UK
Example of menu
interface –Identity function
Database entry for fish
cage after datasets
combined
Details of National
Scenic Areas added to fish cage database
Database entry for fish cage before datasets combined
Map images: Ordnance Survey, (c) Crown Copyright and database right (2017). All Rights reserved. The James Hutton Institute. Ordnance Survey Licence Number 100019294
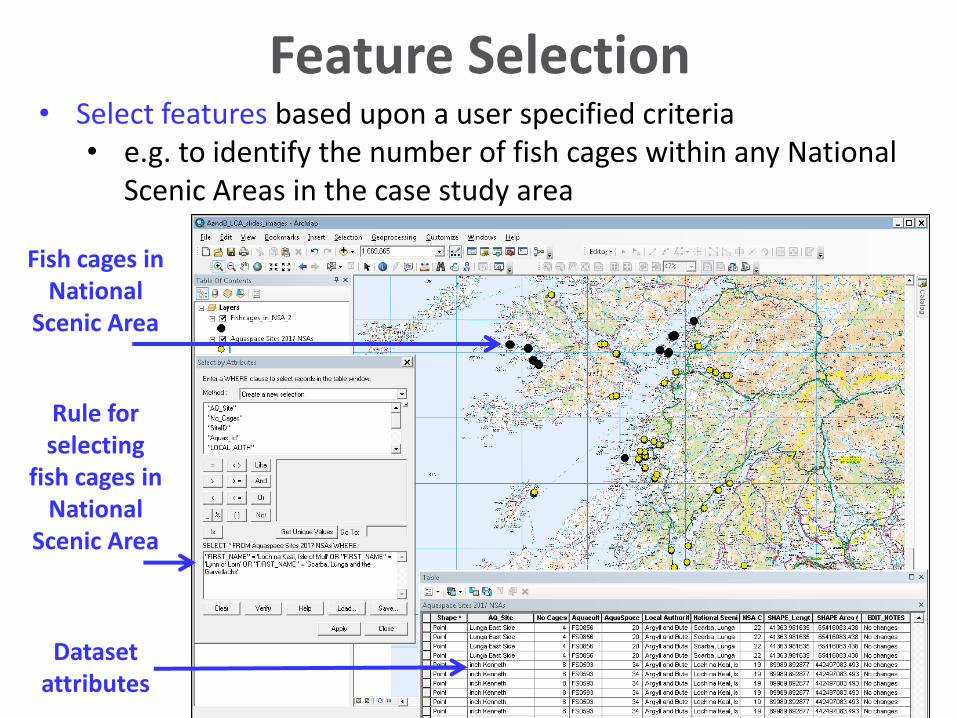
• Select features based upon a user specified criteria• e.g. to identify the number of fish cages within any National
Scenic Areas in the case study area
Feature Selection
Fish cages in National
Scenic Area
Rule for selecting
fish cages in National
Scenic Area
Dataset attributes
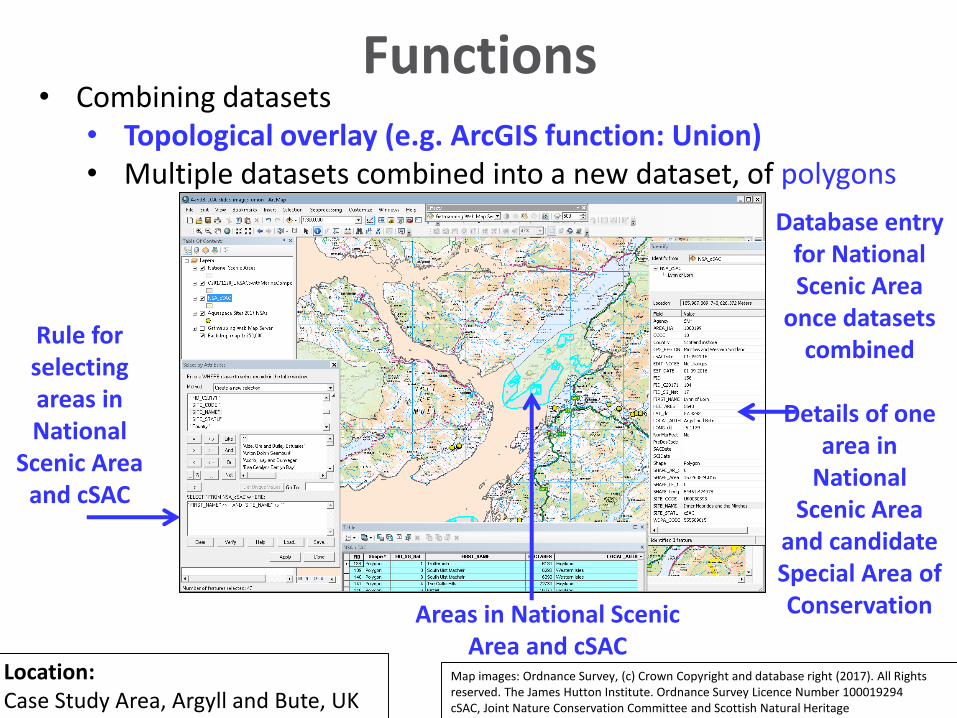
Functions• Combining datasets
• Topological overlay (e.g. ArcGIS function: Union)• Multiple datasets combined into a new dataset, of polygons
Map images: Ordnance Survey, (c) Crown Copyright and database right (2017). All Rights reserved. The James Hutton Institute. Ordnance Survey Licence Number 100019294cSAC, Joint Nature Conservation Committee and Scottish Natural Heritage
Location:Case Study Area, Argyll and Bute, UK
Database entry for National Scenic Area
once datasets combined
Details of one area in
National Scenic Area
and candidate Special Area of ConservationAreas in National Scenic
Area and cSAC
Rule for selecting areas in National
Scenic Area and cSAC
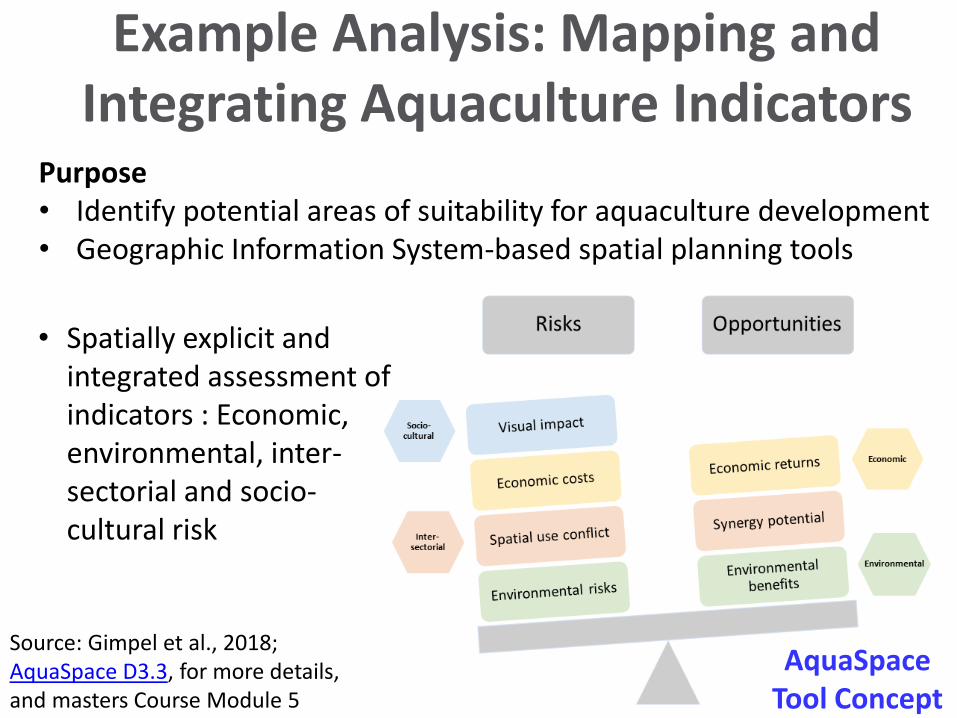
Example Analysis: Mapping and Integrating Aquaculture Indicators
Purpose• Identify potential areas of suitability for aquaculture development• Geographic Information System-based spatial planning tools
Source: Gimpel et al., 2018; AquaSpace D3.3, for more details, and masters Course Module 5
• Spatially explicit and integrated assessment of indicators : Economic, environmental, inter-sectorial and socio-cultural risk
AquaSpace Tool Concept
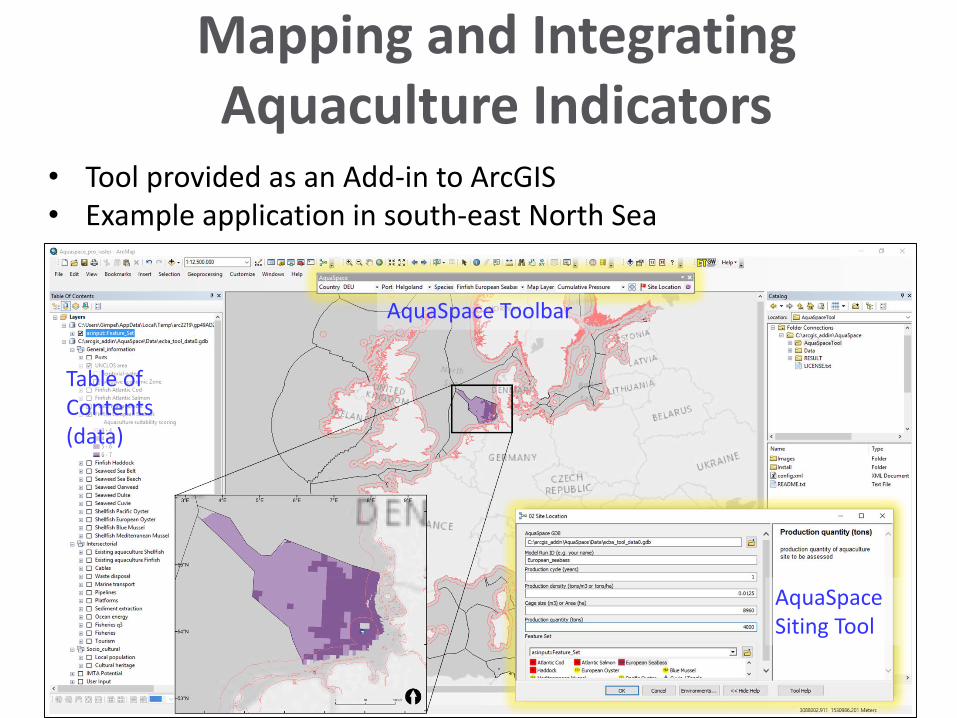
Mapping and Integrating Aquaculture Indicators
• Tool provided as an Add-in to ArcGIS• Example application in south-east North Sea
AquaSpace Toolbar
AquaSpace Siting Tool
Table of Contents (data)
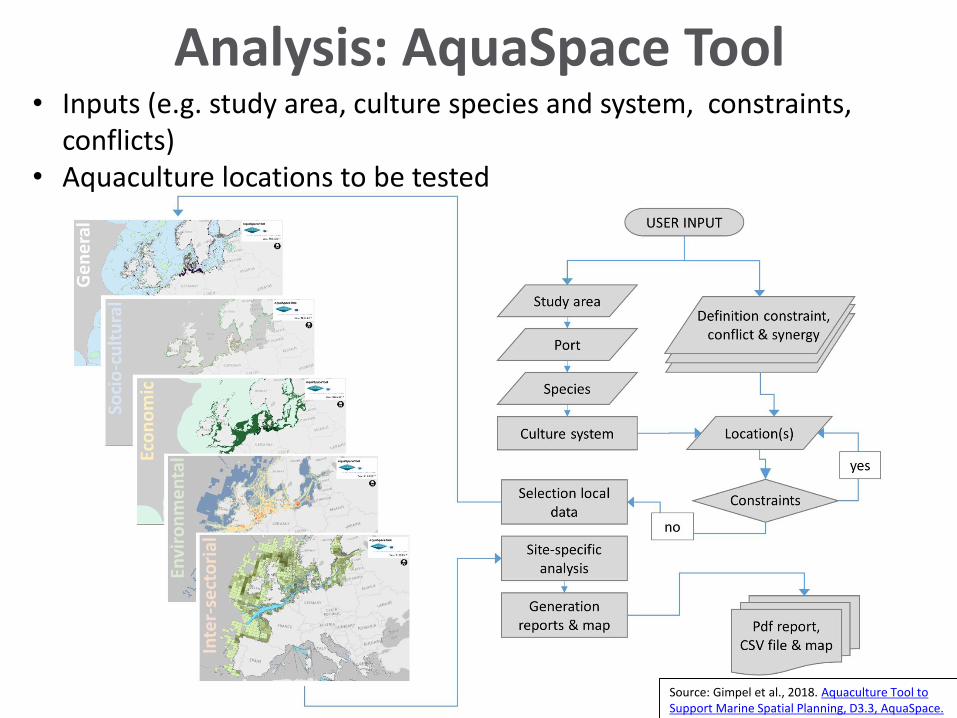
Analysis: AquaSpace Tool
Source: Gimpel et al., 2018. Aquaculture Tool to Support Marine Spatial Planning, D3.3, AquaSpace.
• Inputs (e.g. study area, culture species and system, constraints, conflicts)
• Aquaculture locations to be tested
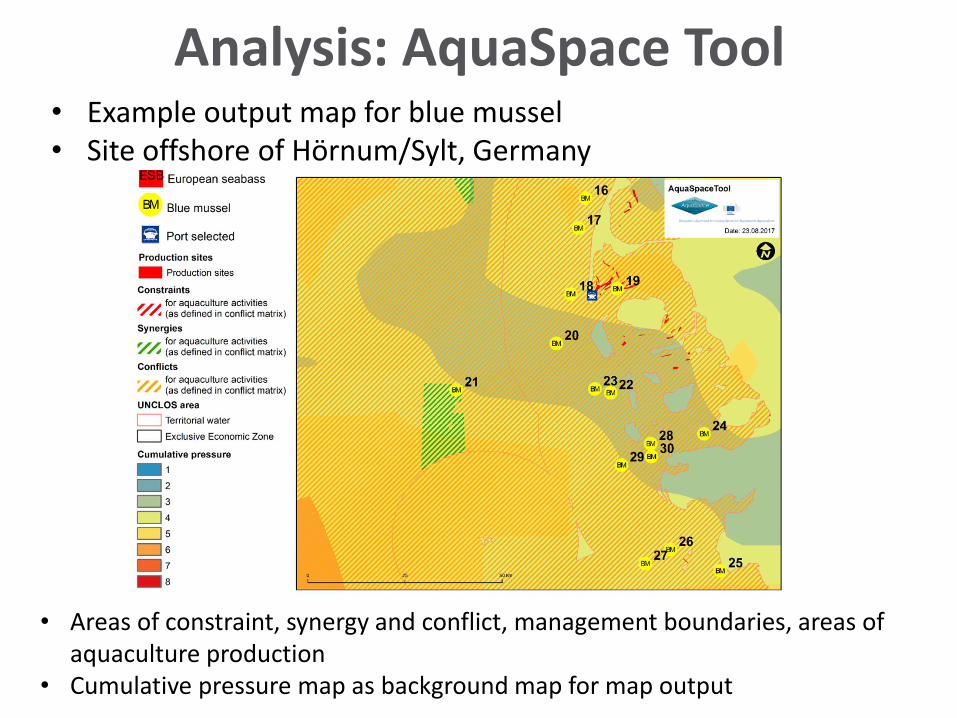
Analysis: AquaSpace Tool
• Areas of constraint, synergy and conflict, management boundaries, areas of aquaculture production
• Cumulative pressure map as background map for map output
• Example output map for blue mussel• Site offshore of Hörnum/Sylt, Germany
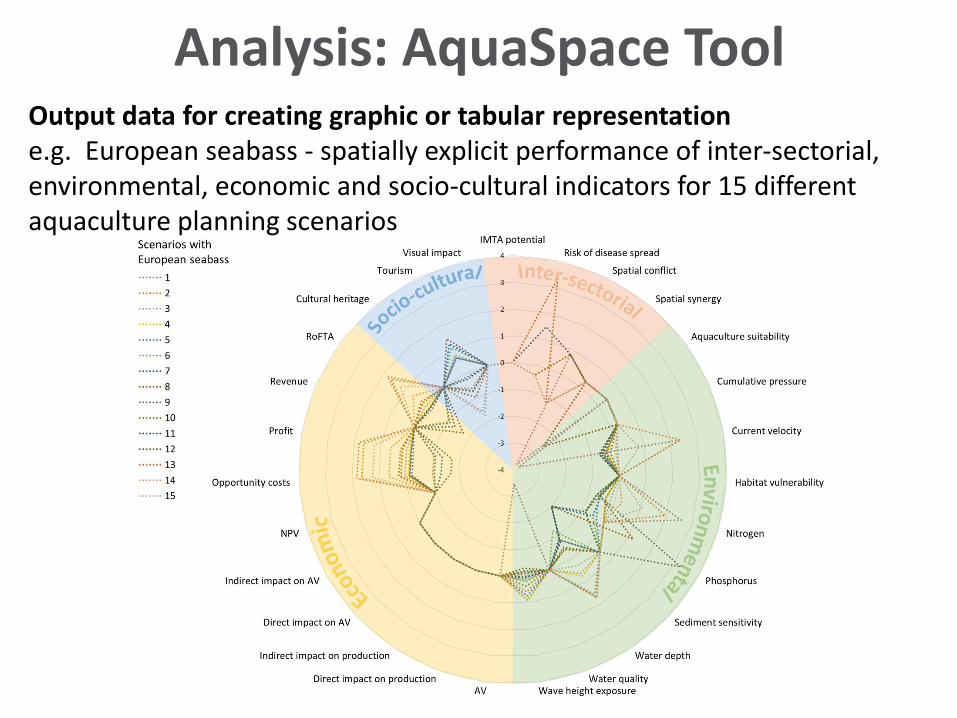
Analysis: AquaSpace ToolOutput data for creating graphic or tabular representation e.g. European seabass - spatially explicit performance of inter-sectorial, environmental, economic and socio-cultural indicators for 15 different aquaculture planning scenarios
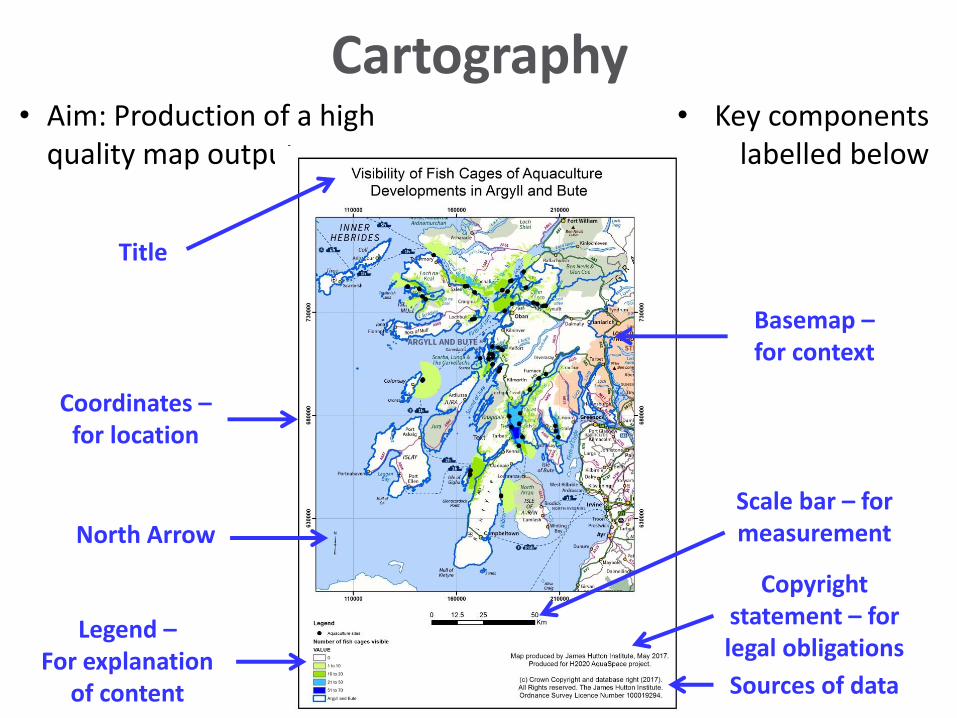
• Aim: Production of a high quality map output
Cartography• Key components
labelled below
Title
Legend –For explanation
of content
Copyright statement – for legal obligations
Sources of data
Scale bar – for measurement
Basemap –for context
Coordinates –for location
North Arrow
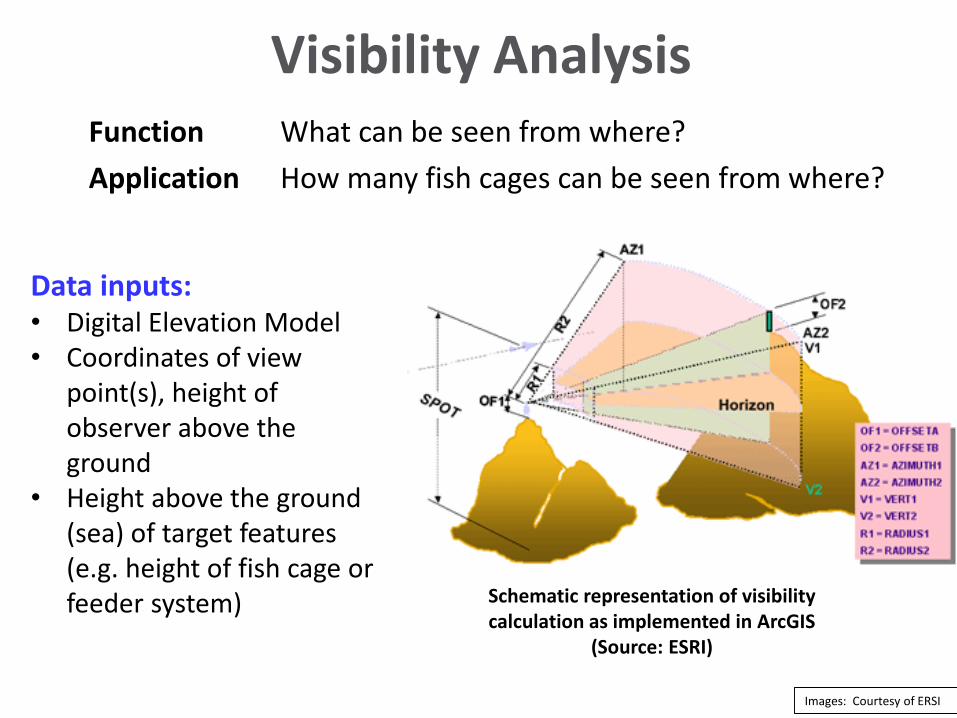
Visibility AnalysisFunction What can be seen from where?
Application How many fish cages can be seen from where?
Images: Courtesy of ERSI
Data inputs: • Digital Elevation Model• Coordinates of view
point(s), height of observer above the ground
• Height above the ground (sea) of target features (e.g. height of fish cage or feeder system) Schematic representation of visibility
calculation as implemented in ArcGIS (Source: ESRI)
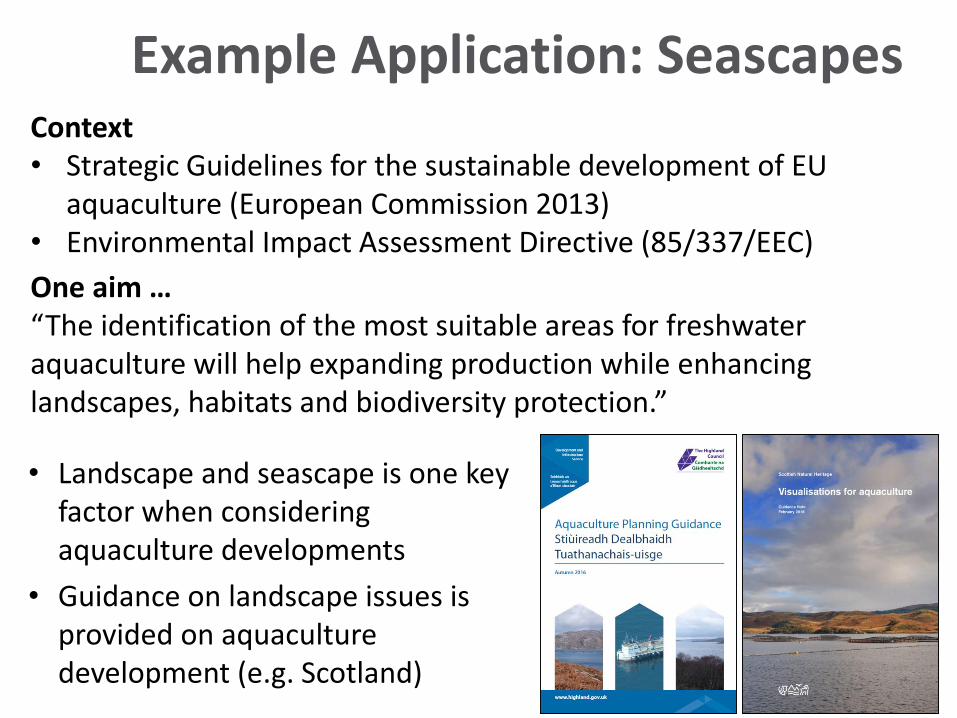
• Landscape and seascape is one key factor when considering aquaculture developments
• Guidance on landscape issues is provided on aquaculture development (e.g. Scotland)
Context• Strategic Guidelines for the sustainable development of EU
aquaculture (European Commission 2013)• Environmental Impact Assessment Directive (85/337/EEC)
One aim …“The identification of the most suitable areas for freshwater aquaculture will help expanding production while enhancing landscapes, habitats and biodiversity protection.”
Example Application: Seascapes
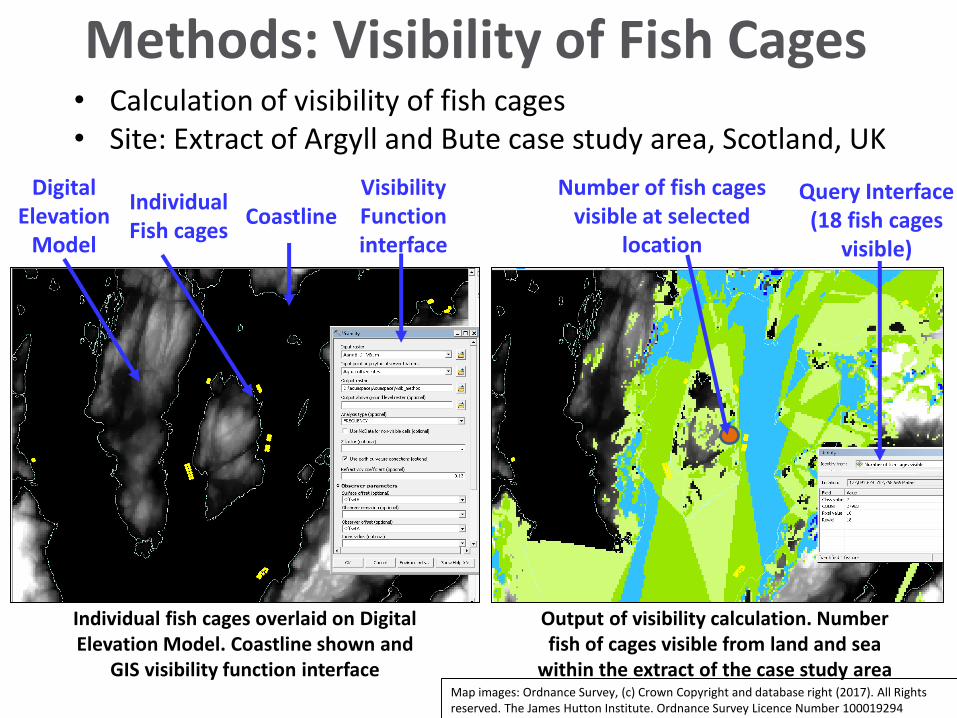
Methods: Visibility of Fish Cages
Individual fish cages overlaid on Digital Elevation Model. Coastline shown and
GIS visibility function interface
Output of visibility calculation. Number fish of cages visible from land and sea
within the extract of the case study area
Digital Elevation
ModelCoastline
Visibility Function interface
Individual Fish cages
Query Interface (18 fish cages
visible)
Number of fish cages visible at selected
location
Map images: Ordnance Survey, (c) Crown Copyright and database right (2017). All Rights reserved. The James Hutton Institute. Ordnance Survey Licence Number 100019294
• Calculation of visibility of fish cages• Site: Extract of Argyll and Bute case study area, Scotland, UK
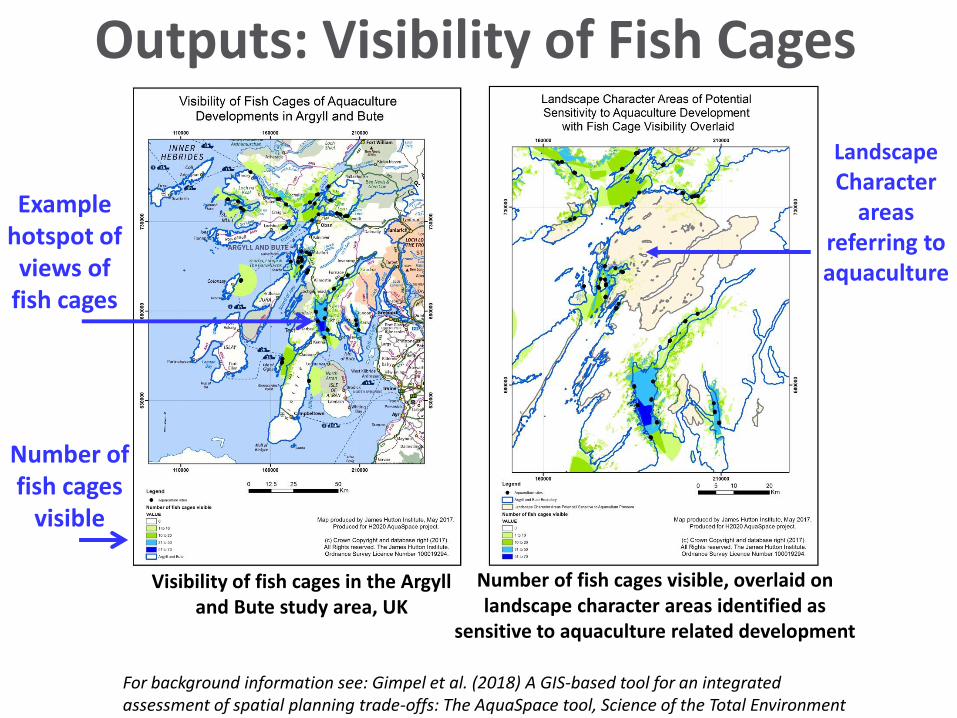
Outputs: Visibility of Fish Cages
Visibility of fish cages in the Argyll and Bute study area, UK
Number of fish cages visible, overlaid on landscape character areas identified as
sensitive to aquaculture related development
For background information see: Gimpel et al. (2018) A GIS-based tool for an integrated assessment of spatial planning trade-offs: The AquaSpace tool, Science of the Total Environment
Number of fish cages
visible
Example hotspot of views of
fish cages
Landscape
Character areas
referring to aquaculture
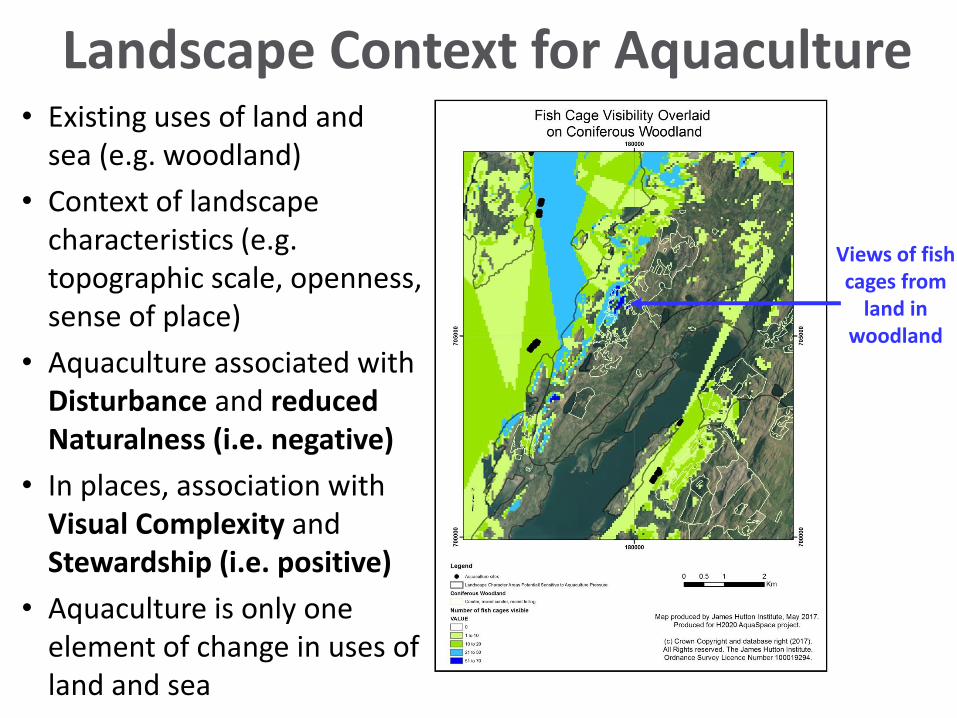
Landscape Context for Aquaculture• Existing uses of land and
sea (e.g. woodland)
• Context of landscape characteristics (e.g. topographic scale, openness, sense of place)
• Aquaculture associated with Disturbance and reduced Naturalness (i.e. negative)
• In places, association with Visual Complexity and Stewardship (i.e. positive)
• Aquaculture is only one element of change in uses of land and sea
Views of fish cages from
land in woodland
Aquaculture and Seascapes: Conclusions
• Landscape concepts of Good stewardship, naturalness, coherence and visual complexity are associated with positive preferences of aquaculture in seascapes
• Poor stewardship, incoherence and reduced naturalness are associated with negative preferences
• In engagement activities, areas avoided were close to leisure use (e.g. marinas), historic features (e.g. castles), housing, and areas perceived as ‘remote’, ‘wild’ or ‘natural’
• In such areas, development was considered intrusive
• Aquaculture associated with some types of seascapes by residents in areas without such developments [limited data]
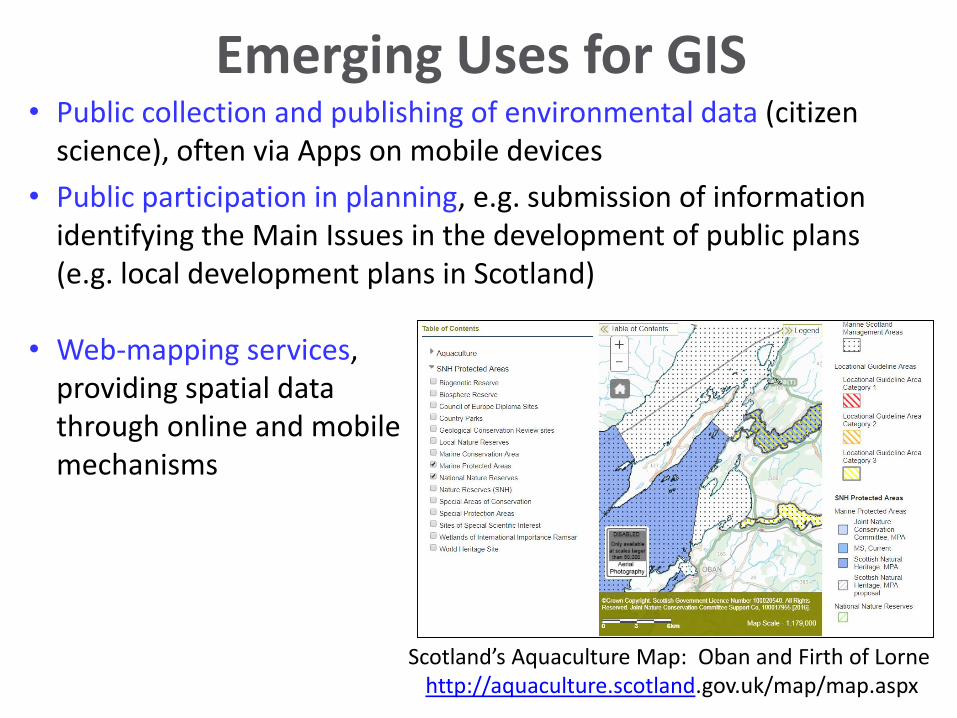
• Public collection and publishing of environmental data (citizen science), often via Apps on mobile devices
• Public participation in planning, e.g. submission of information identifying the Main Issues in the development of public plans (e.g. local development plans in Scotland)
Emerging Uses for GIS
• Web-mapping services, providing spatial data through online and mobile mechanisms
Scotland’s Aquaculture Map: Oban and Firth of Lorne http://aquaculture.scotland.gov.uk/map/map.aspx
• General introduction
• Heywood, I., Cornelius, S. and Carver, S. (2011) An Introduction to Geographical Information Systems, Prentice Hall 4th Edition, pp. 480.
• Senior managers and technology specialists
• Tomlinson, R. (2013) Thinking About GIS: Geographic Information System Planning for Managers. 5th Edition. ESRI.
• ArcGIS desktop software
• www.esri.com/software/arcgis/arcgis-for-desktop
• ArcGIS Online Support Site
• http://support.esri.com
Further Reading
• The following is a short list of snippets uploaded to www.youtube.com which contain demonstrations of how to use some of the functionality of ArcGIS
Video Tutorials
University of Toronto, Youtube channel of Don Boyes. Example videos of GIS:• Working in ArcMap (15mins)
www.youtube.com/watch?v=zlYHu60Z_ZQ• Digitising in ArcMap (14mins) www.youtube.com/watch?v=YYwhX-
jhthk• Vector Buffers in ArcMap (5mins)
www.youtube.com/watch?v=PdRvCYMKQBk• Selecting features in ArcMap (6mins)
www.youtube.com/watch?v=9rTN710KLfw
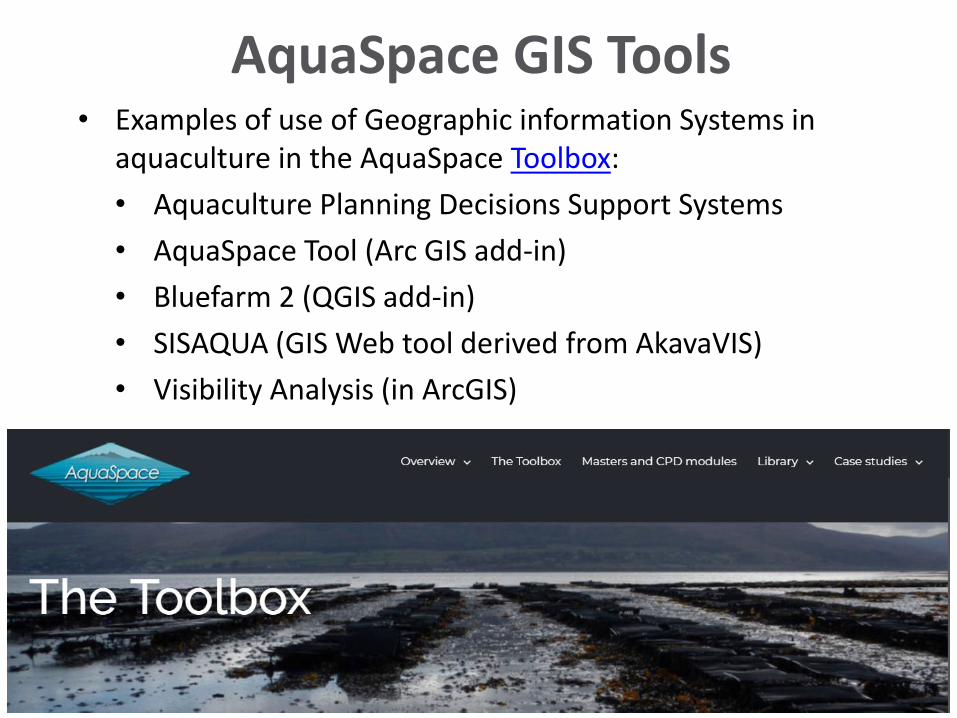
• Examples of use of Geographic information Systems in aquaculture in the AquaSpace Toolbox:
• Aquaculture Planning Decisions Support Systems
• AquaSpace Tool (Arc GIS add-in)
• Bluefarm 2 (QGIS add-in)
• SISAQUA (GIS Web tool derived from AkavaVIS)
• Visibility Analysis (in ArcGIS)
AquaSpace GIS Tools
• Materials
• James Hutton Institute: David Miller, Margaret McKeen, Dave Miller, Chen Wang, Gillian Donaldson-Selby
• Thünen-Institut: Antje Gimpel, Vanessa Stelzenmueller
• Data
• Ordnance Survey, (c) Crown Copyright and database right (2017). All Rights reserved. The James Hutton Institute. Ordnance Survey Licence Number 100019294 for raster map images on slides 7, 8, 13, 14, 15, 16, 17, 18, 24, 27, 28.
• Graphics
• ESRI, www.esri.com, Slide 25
• Video links
• Don Boyes, University of Toronto
Acknowledgements
For more information about
the AquaSpace Masters module
and spatial planning toolbox,
visit our website:
www.aquaspace-h2020.eu
Horizon 2020
The materials used here have been assembled as part of the AquaSpace project(Ecosystem Approach to making Space for Aquaculture, http://aquaspace-h2020.eu)
and has received funding from the European Union's Horizon 2020 Framework Programme for Research and Innovation under grant agreement n° 633476.