TOPIC 4 The Moving Crust - Holy Cross · PDF fileTOPIC 4 The Moving Crust ... Evidence for...
36
TOPIC 4 The Moving Crust Why does Earth’s crust move? The mystery of the moving crust has puzzled people for thousands of years. During the past 25 years tech- nology has been developed to provide clues to solve the mystery. Many of those clues come from deep within Earth. If you could travel through Earth’s crust into the centre of our planet, what would you find? Figure 5.35 is a model of the layers of Earth. A. The crust includes the layer you can walk on, and is home to plants, animals, and soil. It also includes deeper areas where minerals are mined and oil and gas are formed. The crust is very thin under the ocean. In some places it extends only 5 km deep. Under some parts of the continents it reaches a depth of 60 km. B. The mantle is found under the crust. It is made of rock material. The upper mantle is solid, and together with the crust forms the lithosphere. The lower mantle is partly melted and has the consis- tency of taffy. Rock material in the mantle can flow very slowly. C. The outer core is composed of iron and nickel. The temperature here is over 5500°C. It is so hot, the iron and nickel are liquid. D. The intense pressure of all the layers forces the inner core into a solid ball. The inner core has a temperature over 6000°C. If you were travelling at 100 km/h, how long would it take you to travel through Earth’s crust? How long would it take you to travel through the entire mantle? Satellites high above Earth now take pictures of Earth. These pictures are similar to X-rays because they can show what is underneath the crust. They can detect differences in tempera- ture the same way a CAT scan can detect a tumour inside a person’s body. Computers are used to interpret the pictures. 382 MHR • Planet Earth 670 km 2885 km 2270 km 1216 km to centre outer core (5500°C) inner core (6000°C) lower mantle (4000°C) A. B. C. D. upper mantle (1000°C) crust (5°C) 5–60 km crust Figure 5.35 The inner core of Earth is very hot, at 6000°C. As the temperatures on the diagram show, each layer of Earth is cooler than the layer below.
Transcript of TOPIC 4 The Moving Crust - Holy Cross · PDF fileTOPIC 4 The Moving Crust ... Evidence for...

T O P I C 4 The Moving CrustWhy does Earth’s crust move? The mystery of the moving crust haspuzzled people for thousands of years. During the past 25 years tech-nology has been developed to provide clues to solve the mystery. Manyof those clues come from deep within Earth. If you could travelthrough Earth’s crust into the centre of our planet, what would youfind? Figure 5.35 is a model of the layers of Earth.A. The crust includes the layer you can walk on, and is home to plants,
animals, and soil. It also includes deeper areas where minerals aremined and oil and gas are formed. The crust is very thin under theocean. In some places it extends only 5 km deep. Under some partsof the continents it reaches a depth of 60 km.
B. The mantle is found under the crust. It is made of rock material.The upper mantle is solid, and together with the crust forms thelithosphere. The lower mantle is partly melted and has the consis-tency of taffy. Rock material in the mantle can flow very slowly.
C. The outer core is composed of iron and nickel. The temperaturehere is over 5500°C. It is so hot, the iron and nickel are liquid.
D. The intense pressure of all the layers forces the inner core into asolid ball. The inner core has a temperature over 6000°C.
If you were travelling at100 km/h, how longwould it take you totravel through Earth’scrust? How long would ittake you to travel throughthe entire mantle?
Satellites high aboveEarth now take picturesof Earth. These picturesare similar to X-raysbecause they can showwhat is underneath thecrust. They can detectdifferences in tempera-ture the same way aCAT scan can detect atumour inside aperson’s body.Computers are used tointerpret the pictures.
382 MHR • Planet Earth
670
km
2885
km
2270
km
1216 km to centre outer core
(5500°C)
inner core(6000°C)
lower mantle(4000°C)
A.
B.
C.
D.
upper mantle(1000°C)
crust (5°C) 5–60 km
crust
Figure 5.35 The inner core of Earth is very hot, at6000°C. As the temperatures on the diagram show,each layer of Earth is cooler than the layer below.
The Moving Crust • MHR 383
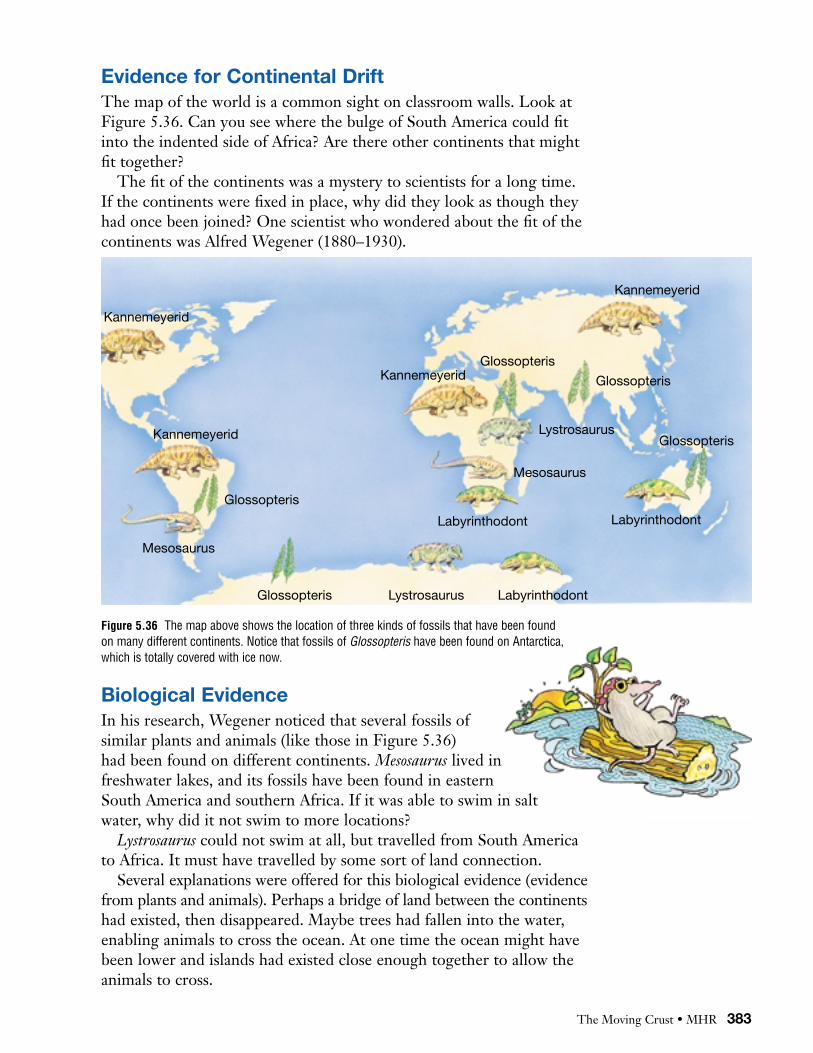
Evidence for Continental Drift The map of the world is a common sight on classroom walls. Look atFigure 5.36. Can you see where the bulge of South America could fitinto the indented side of Africa? Are there other continents that mightfit together?
The fit of the continents was a mystery to scientists for a long time.If the continents were fixed in place, why did they look as though theyhad once been joined? One scientist who wondered about the fit of thecontinents was Alfred Wegener (1880–1930).
Figure 5.36 The map above shows the location of three kinds of fossils that have been found on many different continents. Notice that fossils of Glossopteris have been found on Antarctica,which is totally covered with ice now.
Biological EvidenceIn his research, Wegener noticed that several fossils of similar plants and animals (like those in Figure 5.36) had been found on different continents. Mesosaurus lived infreshwater lakes, and its fossils have been found in easternSouth America and southern Africa. If it was able to swim in saltwater, why did it not swim to more locations?
Lystrosaurus could not swim at all, but travelled from South Americato Africa. It must have travelled by some sort of land connection.
Several explanations were offered for this biological evidence (evidencefrom plants and animals). Perhaps a bridge of land between the continentshad existed, then disappeared. Maybe trees had fallen into the water,enabling animals to cross the ocean. At one time the ocean might havebeen lower and islands had existed close enough together to allow theanimals to cross.
Kannemeyerid
Kannemeyerid
Glossopteris
Glossopteris
Glossopteris
Glossopteris
Glossopteris
Mesosaurus
Mesosaurus
Lystrosaurus
Lystrosaurus
Labyrinthodont
LabyrinthodontLabyrinthodont
Kannemeyerid
Kannemeyerid

384 MHR • Planet Earth
Wegener studied the fossil evidence and the interlocking shapes of thecontinents. He concluded the conti-nents had been joined together whenthe fossil animals and plants had beenalive. Over thousands, maybe millions,of years, the continents had graduallymoved to their present locations.Wegener called his explanation continental drift.
Evidence from RocksWegener continued his research. He examined the observations of other scientists to see if there might be more evidence to support theidea of continental movement. He discovered that geologists had foundsimilarities in rocks on both sides of the Atlantic Ocean. A mountainrange, called the Appalachians, in eastern North America was made ofthe same kind and ages of rock as the mountain range that ran throughBritain and Norway (see Figure 5.37).
A further clue came from fossils of trilobites found high up on theHimalayan Mountains in India. These trilobites roamed the ancientseas 250 to 500 million years ago. How did trilobites end up on the“roof” of the world? The evidence suggested that India was once a separate piece of land. Many millions of years ago, India drifted intoEurasia. The collision pushed rocks containing fossils from the bottomof the sea up to the top of the Himalayan mountains (see Figure 5.38).
Geological Evidence of ClimateCoal provided further important information about Earth’s history. In order for coal to form, there has to be rich, luxurious plant life in a tropical, swampy environment. The coal beds that exist in North
America, Europe, and Antarctica arenow in moderate to cold climates.How did tropical plants grow therein the past? Why has the climatechanged in so many places?
For Wegener, the clues providedby geological evidence of climaticchange raised questions that had noeasy answers. Since Wegener wastrained as a meteorologist, he wasespecially interested in these clues.He found evidence of even greaterclimatic changes in places that hadprobably been covered by glaciers.
NorthAmerica
Europe
SouthAmerica
Africa
AtlanticOcean
PacificOcean
Equator
Mountains
Figure 5.37 How couldmountains formed from thesame type of rock occurthousands of kilometresfrom each other across an ocean?

The Moving Crust • MHR 385
Ancient glacial deposits (200 to 300 million years old) were foundspread over the southern hemisphere. Layers of deposits left behind byglaciers were found in southern Africa, South America, India, andAustralia. Under the deposits in some places, therewere grooves in the bedrock showing thedirection in which the glaciers had moved.All of these locations now had very warmclimates, much too warm for glaciers.Was the whole world cold, or had theseland masses moved to their present warmlocations from a place nearer to theSouth Pole?
Response to WegenerIn 1915 Wegener published his findings in a book, written in German,called The Origin of Continents and Oceans. In the book, he stated that allof Earth’s continents had been joined together in a giant supercontinentcalled Pangaea. Pangaea started breaking up about 200 million yearsago, and the pieces began moving or drifting into their present loca-tions. Wegener wrote, “It is just as if we were to refit the torn pieces ofa newspaper by matching their edges and then check whether the linesof print run smoothly across. If they do, there is nothing left but to conclude that the pieces were in fact joined in this way.”
To support his hypothesis about drifting continents, Wegenerthought about what forces might be causing the movement. Heproposed that the Moon might be responsible, but other scientists disagreed with him. Because Wegener could not satisfactorily explainthe origin of the force that was moving the continents, the scientificcommunity rejected his ideas on continental drift.
Wegener died in Greenland in 1930, still searching for evidence tosupport his theory of continental drift. Years later, advances intechnology and the work of a Canadian scientist led to a new theorythat explained Wegener’s observations.
www.mcgrawhill.ca/links/sciencefocus7
Find out more about Wegener by going to the web siteabove. Click on Web Links to find out where to go next.
See if you can locate any drawings from Wegener’s book. Find some information about him that you did not learn in
this text, and use it to prepare a brief biography.
Figure 5.38 Earth mayhave looked like this 180million years ago. Tryto name the seven biggestland masses on the maps.Can you find India onthe map?

386 MHR • Planet Earth
Give Me a Clue!Wegener collected all of the fossil and rock evidence that he could find and put it onto a map of the world. He imagined that all of the continents that we see on Earth today were joined together in one huge supercontinent that he called Pangaea.
QuestionWhat clues do fossils and rocks provide about the ancient world? Can you make the puzzle fit?
Apparatus
coloured pencils
scissors
glue
Materialsworld map
blue paper
Procedure Examine Figure 5.36. Markthe three fossils shown onyour blank world map.
Put a legend on your map,telling what each symbolrepresents.
Find other fossil evidence in other sources. Try theInternet or a CD-ROM in your library. Hint: Look for Cynognathus!
Mark these additional fossillocations on your map. Addthe symbols to your legend.
Examine Figure 5.37. Addthe three samples of “rockevidence” to your map. Usefour different colours toshade in the locations and
call each colour “samerocks” on the legend. Donot cover up your fossil evidence.
On the world map, write the names of the sevencontinents on the landmasses.
Colour each continent. Donot cover up any evidenceyou marked on the worldmap. Decide if India will bethe same colour as Eurasiaor a different colour.
Cut out the land pieces onthe world map around thecontinental shelf edges.Remember to cut India awayfrom Eurasia along the topsof the Himalayas.
Fit the pieces of the worldmap together to resemblePangaea. Once the piecesare in place, glue them to asheet of blue paper.
Transfer the legend to theblue paper by cutting it outor copying it.
5-F5-F
S K I L L C H E C K
Initiating and Planning
Performing and Recording
Analyzing and Interpreting
Communication and Teamwork
Analyze1. What difficulties, if any, did you experience in fitting the
pieces of land together?
2. Which pieces were the hardest to fit together? How mightthese pieces have looked 300 million years ago? How couldyou test your ideas?
Conclude and Apply3. Why was Wegener’s idea on continental drift a reasonable
one? Why did it make sense at the time?
4. As a young child, did you have ideas that you had to changeas your knowledge increased? Was it easy or hard to give upyour old ideas? How might your experience be compared tothe experience of scientists?

The Moving Crust • MHR 387
Advances in TechnologyImportant and surprising clues about Earth’s crust have been collectedfrom the sea floor using sonar (sound wave technology), as shown inFigure 5.39A.
When many sonar tests from Earth’s oceans were studied, the resultsamazed everyone. It was obvious that there were mountains on the seafloor. Moreover, there were long mountain ranges or ridges in someplaces, just like the mountain ranges that existed on land. Scientistsidentified a mountain ridge that stretched from north to south alongthe middle of the Atlantic Ocean. They called this ridge the Mid-Atlantic Ridge (see Figure 5.40).
The features found on the sea floor were similar to the featuresfound on land. What was causing these mountains to form? Theanswer would come from another technology.
Figure 5.39A Sonar revealed that the ocean floor was not flat, as was previously believed.
Sonar stands forSound Navigation andRanging. This technol-ogy is used in natureby bats to navigatearound objects in thedark. Sonar works bysending out a soundand then recording thetime that the soundtakes to bounce back.For example, scientistscan bounce a soundoff the ocean floor andmeasure the time thatit takes to bounceback. Since they knowhow fast the soundtravels, they can calcu-late the distance to thebottom of the ocean.
Figure 5.39B TheGlomar Challengerused oil-drillingtechnology to helpscientists explorebeneath the oceanfloor.
transmitted soundwaves
sound wavereceiver
reflected soundwaves
sound wavetransmitter
Figure 5.40 This map shows the mid-ocean ridges and the trenches. The long,ridged structures are the mid-ocean ridges.

Magnetometers are electronic instru-ments that can detect the direction andstrength of a magnetic field. They usuallyrecord a magnetic field that points north.However, as the ships that carried themmoved across the Atlantic Ocean, some-times the magnetometers recorded amagnetic field that pointed south. Apattern of magnetic reversals was foundtravelling parallel to the Mid-AtlanticRidge. The width and direction of thestripes on both sides of the Ridge weresimilar (see Figure 5.41). What wascausing the reversals?
Igneous rock provided a clue. The magma that forms igneous rock contains
iron-bearing minerals such as magnetite. These minerals line them-selves up with Earth’s magnetic field. As the molten rock hardens atEarth’s surface, the mineral particles stay in line with the magneticfield. So the magnetic reversal stripes must have formed at a differenttime — a time when Earth experienced a reversal of its magnetic field.If the stripes lined up with the ridges, it could mean that the sea floorwas spreading. It also meant that new rock was being formed at themid-ocean ridges. The theory of sea floor spreading was formulated.
magnetic stripes
mid-ocean ridge
Figure 5.41 The pattern ofmagnetic reversals on thesea floor led scientiststo the theory of sea floorspreading. As new crustforms, it takes on themagnetic polarity of Earthat the time of formation.
spreading centre (new crust forming)
Ask anExpertTurn to page 434 tofind out how CharlotteKeen studies rockmany kilometres belowEarth’s surface.
Find OutWhat Do the Rocks Tell Us?What information can rocks provide about theocean floor?
Procedure
The graph on the right is a “best fit” graph. Thesmall dots represent samples of rock takenfrom the magnetic stripes at the bottom of theAtlantic Ocean. Each dot represents a sampleof rock.
1. Find the age of the oldest rock and theyoungest rock on the graph.
2. State the distance of the oldest rock andthe youngest rock from the Mid-AtlanticRidge.
3. Infer or predict some additional data forthe graph.
What Did You Find Out?
What does this evidence suggest was happen-ing to the sea floor? Explain your answer.
Ag
e o
f o
cean
flo
or
rock
s (m
illio
ns o
f ye
ars)
80
60
100
120
40
20
Distance from Mid-Atlantic Ridge (km)
400 800 1200 1600 2000
Analyzing and Interpreting
388 MHR • Planet Earth

The Moving Crust • MHR 389
Deep Sea DrillingScientists confirmed the theory of sea floor spreading when they wereable to bring up samples of rock for testing. The ship GlomarChallenger (see Figure 5.39B) carried equipment that could drill deepholes into the sea floor. Rock from the holes was brought onto the shipfor testing by scientists. Can you imagine the excitement of the scien-tists who first examined these rock samples, knowing that they were thefirst people in the history of the world to do so! Tests of the rock sam-ples showed that younger rock was closer to the Mid-Atlantic Ridgeand older rock was closer to the continents. Scientists found that theAtlantic Ocean is getting wider by about 2 cm every year — about thesame speed that your fingernails grow!
Figure 5.42 Advances in Canadian fibre technology have allowed submersibles to travel evendeeper in the ocean. Submersibles like Alvin have made it possible for us to see lava coming outof cracks in the sea floor. The lava cools so quickly in the cold water that it is called “pillowlava.” Why might it have been given this name?
Even with scuba (self-contained underwaterbreathing apparatus)gear, deep-sea diverscan go only a few hundred metres downinto the ocean becauseof the tremendouspressure of the wateron their bodies.Submersibles allowpeople to travel deeperinto the ocean by protecting them fromthe pressure of thewater. Submersiblesare equipped with anair supply and powerfullights.
Find OutThe Spreading Sea FloorWhen magma rises from the mid-ocean ridge,it produces a new crust which pushes theplates apart. How can you create a model ofthis process?
Materials
sheet of paper (21 cm × 28 cm)
paints, markers, or coloured pencils
scissors
tape
Procedure
1. Cut the paper in half lengthwise. Tape theends together to make one long strip.
2. Push two desks or tables together. Foldthe long strip of paper in half. Hold thepaper vertically under the crack betweenthe desks. Push the open ends of the
folded paper upward until the ends areabout 5 cm above the desk.
3. Fold the ends and colour a pattern on them.
4. Push up another 5 cm and colour a different pattern.
5. Repeat until all the paper is at the surface.
What Did You Find Out?
1. What does the paper represent in your model?
2. What does the crack between the desks represent?
3. Which pattern on your strip represents theoldest rock? the youngest rock?

390 MHR • Planet Earth
The Theory of Plate TectonicsThe evidence collected by advanced technology indicated that Earth’scrust was moving. The crust was not fixed in place, as most peoplebelieved.
A Canadian scientist helped form a new theory to explain how thecrust moves. The new theory stated that Earth’s crust is broken up intopieces, called plates. These plates are always moving on Earth’s mantle.Scientists called the new theory the theory of plate tectonics.
In Figure 5.43, the major plates are labelled. Can you see that mostof the plates are named for the continent that is on the plate? Twoplates pushing together are called converging plates. Two platespulling apart are called diverging plates.
Figure 5.43 This diagram shows the major plates, their direction of movement, and the type ofboundary between them. What is happening to the Juan de Fuca Plate where it meets the NorthAmerican Plate?
J. Tuzo Wilson, a Canadian scientist, is one of the long line of scientistswho have contributed to our understanding of Earth’s crust (see Figure5.44). He made an important addition to scientific observation when hedeveloped the concept of a third kind of movement along plate bound-aries. Instead of pushing together or pulling apart, he hypothesized thatplates were sliding past each other.
Wilson’s idea of sliding plates brought about a rethinking of Earth’scrust movement.
Indo-Australian Plate
Philippine Plate African Plate
Eurasian Plate
Scotia Plate
South American
Plate
North American Plate
Antarctic Plate
Nazca PlatePacific
Plate
Juan de Fuca Plate
Eurasian Plate
diverging plates converging plates plates sliding past each other
Figure 5.44 Tuzo Wilson(1908–1993)

The Moving Crust • MHR 391
Building a Model ofPlate TectonicsGeologists often have a difficult time duplicating the conditions found in Earth’s crust, so they develop models and computer simulations to use in the laboratory. Models help them develop hypotheses about why Earth’s crust behaves the way it does. In this investigation you and your partners may collect the same data, but each of you may develop a different hypothesis. Many geologists create different hypotheses based on the data they collect.
QuestionWhat hypothesis about Earth’s crust can you form based on your model?
ProcedureClean the plastic tub.
Wear disposable gloves orwash your hands beforebeginning. Only one per-son’s hands should be in themixture at one time. It isimportant that the mixturestays clean.
Mix the cornstarch and500 mL water in the tub.Continue adding water untilthe mixture is solid whenyou squeeze it between yourfingers and runs throughyour fingers when you holdit loose in your palm.
Investigate the propertiesof this mixture for severalminutes. Then squeeze asmuch cornstarch as possible
from your hands back intothe tub.
Meanwhile, the remainingpartners can work with smallamounts of the mixture inpetri dishes. Use the bingochips, puzzle pieces, and anyother objects approved bythe teacher. Create a modelof plate tectonics in the petridishes while you wait yourturn for the larger tub. Slidethe objects slowly across thesurface. Create many differ-ent types of boundariesbetween the continentalplates. Form a hypothesisabout Earth’s crust based onyour observations.
Record your observationsand hypothesis.
5-G5-G
S K I L L C H E C K
Initiating and Planning
Performing and Recording
Analyzing and Interpreting
Communication and Teamwork
Apparatus1 large plastic tub(35 cm x 25 cm x 15 cm) per group
4 petri dishes
measuring container
pieces of puzzles, marbles, buildingblocks, bingo chips, etc.
Materials2 boxes (1 kg) of cornstarch pergroup
water
spoon
disposable gloves (optional)
Analyze1. Describe the appearance
of a freshly broken pieceof cornstarch. Explainhow this might supportyour hypothesis on plate movement.
2. Why do some substancesfloat and some sink in the mixture?
Conclude and Apply3. In what ways does the
mixture resemble a liquid?
4. In what ways does themixture resemble a solid?
5. Explain why you think the mixture has theseunusual properties.
6. State your hypothesis.Support it with evidencefrom your investigation.
Extend YourKnowledge andSkills7. How do you think your
model helps to explain theconcept of plate tectonics?
8. Draw a diagram of yourmodel. Use arrows toindicate plate movement.
9. Design a new experimentto support your hypothesis.

392 MHR • Planet Earth
Figure 5.46
If converging plates are bothcontinental, their leading edges crumple,forming mountains.
If an oceanic plate slides under the continental plate, melting occurs, forming volcanoes andmountain ranges.
BA
Convergingcontinental plates
Lithosphere
Divergingcontinental plates
Convergingcontinental andoceanic plates
continental crust
Subduction zone
Rift valley
A
B
Convection currents
Mantle
Trench Trench
Mid-ocean ridge
Figure 5.45 This model shows one way that convection currents might move plates.
Convection CurrentsGeologists are still not sure what causes Earth’s plates to move. Oneexplanation is that convection currents in the mantle under Earth’scrust move the plates (see Figure 5.45). A convection current is theflow resulting from the rise of warmer materials and the sinking ofcooler materials. Many scientists believe convection currents are mov-ing Earth’s plates as shown in Figure 5.46 below. Study the diagram.

The Moving Crust • MHR 393
If the two converging plates are oceanic plates, either plate might subduct, forming island arcs and volcanoes.
C
Scientists are usingsatellites and lasers tomeasure plate move-ments. Plates that holdthe greatest continentalmasses move moreslowly than plates thathold smaller continentalmasses. The African,Eurasian, and AmericanPlates move about 20 mmper year. In comparison,the Pacific, Nazca, andCocos Plates can moveup to 130 mm per year.Plate movements are anexample of incrementalchange, which is changethat happens slowly.Where might the platesbe in a million years? in a billion years? Uselibrary resources to find the answer, orresearch on the Internet.Find a simulation of plate movements predicted for the nextfour billion years.
Mid-ocean ridge
Trench
Oceanic crust
Divergingoceanic plates
Convergingoceanic plates
C
Each plate touches several other plates. Scientists call the placeswhere the two plates collide convergent or collision boundaries.Although they move too slowly for us to notice, each movement affectsother plates as shown in Figure 5.46. When two plates collide or converge, one is shoved under the other. These places are called subduction zones.
Scientists suggest that subduction zones form where convection currents cool and sink. The same process might be occurring in Earth’smantle, creating the force behind plate tectonics. Hot plastic-like rockin the lower mantle moves upward after it is heated by the intense heatin Earth’s core. At the upper part of the mantle, the heated rock moveshorizontally under the plate above it. The heated rock moves the platealong as if the plate were on a conveyor belt. When the rock finallycools, it sinks down farther into the mantle. As it does so, it pulls theedge of the plate down with it, forming a deep ocean trench.
The convection currents might be causing the Atlantic Ocean towiden at the Mid-Atlantic Ridge. Does this mean that Earth’s crust isgetting bigger? No, because while new crust is forming in the middleof the Atlantic Ocean, other crust is being pushed or pulled down intothe ocean trenches and recycled back into the mantle as molten rock.
The theory of plate tectonics is called a unifying theory, a single theory that explains different natural events and landforms. The theoryis our best explanation for the formation of earthquakes, volcanoes, and mountains. Who knows what further discoveries will be made inyour lifetime!

Figure 5.47 When submersibles found deep-sea vents called “black smokers,” they also foundtube worms. The sulfur compounds escaping from the vents provide an energy source for theworms.
1. Make a drawing of Earth’s interior and label the four main layers.
2. List the three kinds of evidence that Wegener collected to support hisidea of continental drift. Give one example for each kind of evidence, andexplain why the example suggested that the continents had moved.
3. Thinking Critically(a) Why were other scientists unwilling to accept Wegener’s ideas?(b) Are people generally willing or unwilling to change? What does this
suggest to you about scientific progress?
4. What do scientists now think is causing the continents to move?
5. (a) What happens when continental plates collide?(b) What happens when a continental plate and an oceanic plate collide?(c) What happens when oceanic plates collide?
6. In what two ways is the plate tectonics theory different from the ideas ofcontinental drift?
T O P I C 4 Review
394 MHR • Planet Earth
Miners of the future maylook for gold and otherprecious metals on thesea floor near volcanicvents called black smok-ers. Scientists say thatthe vents act likesmelters. The ventsdissolve metals from thesurrounding rock andsend them into the coldwater, where they collectoutside the vents. Usethe Internet or libraryresources to find outabout a fossilized blacksmoker deposit calledKidd Creek in northernCanada. Write notesabout your findings inyour Science Log.
To find out how to use technology tools to research, turn to Skill Focus 9.

Earthquakes • MHR 395
T O P I C 5 EarthquakesYou are in a class at school, and suddenly a bell starts to ring very loudly. The teacher asks you all to leave the room calmly and walk outside to a safe place for attendance to be taken. You are having a firedrill, just as students in schools do every year. Now imagine yourselfsitting in your classroom and hearing the same bell ring. This time theteacher asks everyone to get under the desks as shown in Figure 5.48.You are having an earthquake drill. Students who live in places whereearthquakes can happen have earthquake drills as well as fire drills.
How do you know if your school should have earthquake drills as wellas fire drills? How do people prepare for earthquakes? Where do earth-quakes happen in Canada?
The eight dragon heads that are attached to this urn have little balls inside them.Earthquake movement shakes the balls into the toads’ open mouths. The direction of the earthquake is determined by which toad swallows the ball.
How accurate was this ancient device? On one occasion long ago, a ball fell from adragon’s mouth but no ground movement was noticed. Several days later, however, a messenger brought news of an earthquake that had happened about 650 km away.
Animals have often beenthought to “predict”earthquakes. Caged rab-bits will hop aroundwildly for several minutesbefore an earthquake.Deep-sea fish will swimclose to the ocean’ssurface. Some fish, suchas catfish, have actuallyjumped out of the wateronto dry land just beforean earthquake has struck.Bees sometimes evacuatetheir hives in a panicminutes before an earth-quake. Mice can be sodazed that they can becaptured by hand.
Figure 5.49 Seismologistsstudy earthquakes by reading seismograms.
Figure 5.48 These studentsare crouched under aclassroom table during anearthquake drill.

396 MHR • Planet Earth
Measuring EarthquakesScientists called seismologists use a special machine called a seismographto measure earthquakes (see Figure 5.49). Seismographs must be attachedto bedrock (the solid rock that lies beneath the soil and looser rocks) inorder to feel the vibrations that result from an earthquake. Inside theseismograph, a marking pen hangs over a rotating drum, just touchingthe drum. The drum is covered with paper to record the vibrationsmarked by the pen. When an earthquake strikes, it shakes the bedrock,causing the pen to move while the paper drum stays still. The pen pointmoves against the paper drum, making a jagged line. Most modernseismographs are electronic, but they are based on the same principle.
Seismologists use a method of measurement called the Richter scaleto describe the magnitude (strength) of an earthquake. The scale startsat zero and can go as high as necessary. The amount of energy releasedincreases greatly as the numbers increase. An earthquake that regis-tered 7 would be about 30 times stronger than one that registered 6,and about 900 times stronger than one that registered 5. Most earth-quakes that cause damage and loss of life register between 6 and 8 onthe Richter scale; the Kobe earthquake (see Figure 5.50) registered 7.2.
Table 5.3 shows some of the numbers on the Richter scale, theeffects of earthquakes of each magnitude, and their frequency.
Table 5.3 Richter Scale
SOURCE: Earthquake Information Bulletin
Earthquake WavesThere can be many episodes of ground-shaking movement in an earth-quake caused by seismic waves. These are the energy waves that travel outward from the source of the earthquake. These aftershocks areactually smaller earthquakes, and they can cause damaged buildings tocollapse. The Kobe earthquake in Japan produced over 600 aftershocks.
Earthquake effectsRichter magnitudes
< 2.0
2.0 – 2.9
3.0 – 3.9
4.0 – 4.9
5.0 – 5.9
6.0 – 6.97.0 – 7.9
≥ 8.0
generally not felt, but recorded
felt by few
felt by some
felt by most
damaging shocks
destructive in populated regions
major earthquakes, which inflict serious damage
great earthquakes, which produce total destruction to communities near the source
Estimated number per year
600 000
300 000
49 000
6200
800
266 18
1.4
A seismograph will moveonly if the bedrockmoves. It will not registermovement even if you,and everyone else in yourwhole class, jump upand down right beside it.Usually severalseismographs aremounted together inorder to sense thedifferent directions ofmovement that canhappen in an earthquake.One seismographmeasures vertical (up-and-down) movement,while another measureshorizontal (side-to-side)movement.

Earthquakes • MHR 397
Figure 5.50 In 1995 an earthquake in Kobe, Japan, caused over 5000 deaths and cost manybillions of dollars in property damage.
Find OutShake It!With a partner, design and make your ownseismograph.
Procedure
What parts in the diagram might present achallenge? What method could you devise,other than a rotating drum, to record move-ment? Draw and label your design. Write whatyou will need to make your seismograph andhow you will go about it. If your model differs inany way from your design, draw and label yourseismograph. Describe the changes and whyyou made them.
Demonstrate your seismograph for other stu-dents. Compare it with those designed by yourclassmates. Discuss your comparisons with yourpartner, and write down what you noticed. Howmight you improve your seismograph?
Extension
Find out if there is a seismograph locatedsomewhere close to where you live. The bestplace to start is the university or college clos-est to your home. If it is close enough to visit,check with your teacher about arranging a fieldtrip for your class to see the seismograph.
Initiating and Planning
weighthinged toallowmovement
bedrock
support moves
masspen
rotatingdrum torecordmotion
mass doesnot followgroundmotion
Earth moves

Types of Earthquake WavesThree kinds of seismic waves occur in an earthquake.• Primary or P waves travel the fastest of all three types of waves
and can pass through solids, liquids, and gases. They cause a slightvibration (compression) that would rattle dishes on the shelves. Thesewaves warn people in earthquake areas that an earthquake is happen-ing and can give people a few seconds to prepare for the movementto come.
• Secondary or S waves travel more slowly than P waves and can passonly through solids, not through liquids or gases.
• Surface waves are the slowest of the three waves, but their rollingmotion breaks up roads and buildings, so they do the most damage.You have probably thrown a small stone into water and watched theripples spread out from the point where the stone entered the water.Surface waves travel through Earth in just the same way. They causepart of a building to move up while another part moves down. Rigidstructures will collapse if the movement is too great.
Examine Figure 5.51. Which type of wave causes the greatest reaction in the seismograph? What does the seismogram tell youabout the arrival times of the different waves?
Earthquake waves give us some evidence of what might be insideEarth. The earthquake that happened in Kobe, Japan, in 1995, registered on the seismograph at the University of Manitoba because
P waves travel right through the centre of Earth.S waves did not register. We know that P wavescan travel through liquid and that S wavescannot. Therefore, we can hypothesize thatEarth’s outer core must be liquid.
1 min surface wavefirst S wavefirst P wave
398 MHR • Planet Earth
Primary waves travel atabout 6 km/s throughEarth’s crust. Thedistance from Edmontonto Calgary is about300 km. How long wouldit take for primary wavesto travel between thesetwo cities?
primary waves only
shadow zone
primary and secondary
waves
focus
Figure 5.52 Primary waves are bent or refracted as they travel.There is an area where they do not come through on the otherside of Earth. This area is called a shadow zone.
Figure 5.51 The jaggedline on this seismogramrepresents the threedifferent kinds of waves.

Earthquakes • MHR 399
Locating an EarthquakeDuring a thunderstorm, you see lightning before you hear thunder. Itis possible to estimate how far away the storm is by counting the timethat passes between the flash of lightning and the sound of thunder.Light travels many times faster than sound, so you see the lightningflash before you hear the thunder. The more seconds you can countbetween the lightning and the thunder, the farther away the storm is. If the thunder happens at almost the same time as the lightning, thestorm is right above you.
You can use the same idea with earthquake locations. You know thatP waves travel faster than S waves. Since this is so, it is possible todetermine the location of an earthquake by the interval between the P and S waves. The farther apart the P and S waves are, the fartheraway the earthquake.
Scientists have a special name for the source of an earthquake. Infact, they use two names. The place deep in the crust where the earth-quake begins is called the focus of the earthquake. The primary andsecondary waves come from the focus of the earthquake. The surfacelocation directly above the focus is called the epicentre. Surface wavestravel out from the epicentre (see Figure 5.53).
The British Columbiacoast is an earthquakearea, as are the Atlanticseaboard, theSt. Lawrence RiverValley, the high Arctic,and the Yukon Territory.About one quarter of theearthquakes in Canadatake place in northernregions where there arenot many people tonotice the vibrations. Thefirst major Canadianearthquake on recordoccurred about 1535,near Québec City.
epicentre
primarywave
secondarywave
surface waves
break inEarth’s crust
focus
Figure 5.53
Sudden movement in Earth’s crust releases energy thatcauses an earthquake. The point beneath Earth’s surfacewhere the movement occurs is the focus of theearthquake.
Primary waves and secondary waves originate at thefocus and travel outward in all directions. Primary wavestravel about twice as fast as secondary waves.
The place on Earth’s surface directly above the focus ofthe earthquake is called the epicentre. When primary andsecondary waves reach the epicentre, they generate theslowest kind of seismic waves, surface waves.
Surface waves travel outward from the epicentre alongEarth’s surface much as ripples travel outward from astone thrown into a pond.
D
C
B
A

400 MHR • Planet Earth
Locate the EpicentresEach year, areas of Canada experience low-intensity earthquakes. In this activityyou will plot data to discover the epicentres of two earthquakes.
QuestionHow can you use the data from seismograph stations to locate the epicentre of earthquakes?
Materialscompass
pencil
map of Canada provided by your teacher, with scale of 1000 km = 2.2 cm
Part 1
ProcedureCopy the data table into
your notebook. Use thegraph provided to determine the difference in arrival times for primaryand secondary waves foreach distance in the table.Two differences are already provided.
Data Table
Part 2
ProcedureUse the Epicentre Locationchart to determine the dif-ference in arrival time forthe primary and secondarywaves at each station.Develop a chart to recordand organize your data.
Use the Time Travel Graph for P and S Waves to determine the distance in
kilometres of each seismo-graph from the epicentre ofthe earthquake. Recordyour data in your chart.
Now you know how far eachcity is from the earthquake.Next you need to draw a circle around each city withthe radius of the circle beingthe time lag distance. Usethe scale on the map provid-ed by your teacher. Set yourcompass radius to thedistance Earthquake A isfrom Edmonton. Draw a circle around St. John’s withyour compass.
Repeat step 3 above, settingyour compass radius for thedistance of the epicentrefrom Iqaluit. Using this newradius, draw another circleon your map with Iqaluit asthe centre of your circle.
Repeat step 3 above for allyour data.
Analyze1. What happens to the
difference in arrival timesas the distance from theearthquake increases?
2. Based on yourcalculations, make ahypothesis about howthis graph could be usedto determine the epicentreof an earthquake.
Difference inarrival time
Distance(km)
1500
2250
2750
3000
4000
70009000
2 min; 45 s
5 min; 35 s
5-H5-H
S K I L L C H E C K
Initiating and Planning
Performing and Recording
Analyzing and Interpreting
Communication and Teamwork

Earthquakes • MHR 401
Analyze1. Identify the epicentre of each earth-
quake. Near which two cities did the earthquakes occur?
2. How is the distance of a seismographfrom the earthquake related to thearrival time of the waves?
3. How many seismograph stations wereneeded to accurately locate eachepicentre?
Conclude and Apply4. What does this method reveal about
the intensity of an earthquake?
5. How might seismologists use similartechniques to determine the epicentreof earthquakes?
Wave arrival timesLocation of
seismograph Wave
(1) Edmonton
(2) Iqaluit
(3) Whitehorse
(4) Ottawa
(5) Yellowknife
EarthquakeA
EarthquakeB
2:36:15 p.m.2:38:52 p.m.
2:32:35 p.m.2:39:15 p.m.
2:25:00 p.m.2:28:50 p.m.
1:30:00 p.m.1:36:45 p.m.
4:22:15 p.m.4:26:25 p.m.
4:42:10 p.m.4:48:25 p.m.
4:50:23 p.m.4:55:03 p.m.
7:50:35 p.m.7:58:10 p.m.
4:30:05 p.m.4:31:40 p.m.
4:42:12 p.m.4:48:32 p.m.
PS
PS
PS
PS
PS
This system of lasers monitors movement along the SanAndreas Fault. A series of 18 reflectors are positionedseveral kilometres away from the laser station. If a reflector’sposition changes, the change is measured. Movements ofless than 1 mm along the fault can be detected.
Epicentre Location Data and Observations
23
22
21
20
19
18
17
16
15
14
13
12
11
10
9
8
7
6
5
4
3
2
1
1000 3000 5000 7000 90002000 4000 6000 8000 10 000
Primary Wave
Secondary Wave
Epicentre Distance (km)
Trav
el T
ime
(min
)
Time Travel Graph for P and S Waves

Pacific Ocean0
100
200
300
400
500
600
700200W 100W 0 100E 200E 300E
Distance east and west from coast (km)
Dep
th o
f ear
thqu
ake
(km
)
400E 500E 600E 700E
Distance east (km)Earthquake
1
2
3
4
5
6
7
8
9
10
11
400
80
450
220
10
480
250
500
150
300
600
Depth (km)
230
50
320
120
15
400
150
500
60
175
550
Plotting Earth’s Movement
402 MHR • Planet Earth
5-I5-I
S K I L L C H E C K
Initiating and Planning
Performing and Recording
Analyzing and Interpreting
Communication and Teamwork
Think About ItEarth scientists use information about earthquakelocations to study plate boundaries. Plotting thefoci of many earthquakes may indicate the outlineof possible plates.
The table below shows the location of 11 earth-quake foci that occurred under South America.Thousands of earthquakes have happened in thisarea. How can earthquake locations tell us how theplates are moving?
Materialsearthquake data graph paper pencil
What to DoMake a copy of the graph in your notebook oron a sheet of graph paper.
Using the table, plot the 11 earthquake foci onthe graph. Note that all data are plotted eastof the 0 line.
You have only plotted the foci of a few of theearthquakes that have occurred over the years.Therefore, instead of connecting data, you aregoing to make a “best fit” line graph. Draw asmooth or curved line that illustrates thepattern of data.
Analyze1. Predict where you think future earthquake
foci might occur along this plate boundary.Using the symbol of a triangle, draw in fournew foci on the graph.
2. Draw a large arrow on your graph to indicate the motion of one of the plates.
3. What other features besides earthquakesmight occur at this location?
4. Which type of plate boundary does this looklike to you (convergent, divergent, transform)?

Earthquakes • MHR 403
Earthquake ZonesSince 1900, more than 4600 sizable (greater than 3.0 magnitude) earth-quakes have been recorded in Canada, the United States, and Mexico.Only 17 of these earthquakes have been magnitude 8 or greater. One of these was off Canada’s west coast, eight were in Mexico, and eightwere in Alaska. Why might it be important to know when an earth-quake has happened elsewhere?
Types of Rock Movement in EarthquakesThe rock in Earth’s crust is under pressure all the time from tremen-dous forces. These stresses can cause the rock to bend and stretch. Butwhen the pressure is too great, the rock breaks suddenly, creating afault. Movement along a fault can spread more than a kilometre in asecond. Fault zones exist where tectonic plates meet. Three types offaults are examined below in Figure 5.54.
You could compare the inside structure of Earth to an egg. The crustis the eggshell. The mantle is the white of the egg. The inner and out-er cores are represented by the egg yolk. The cracks you make in theshell of a hard-boiled egg could be the faults in the rocks that causeearthquakes to happen!
Normal Faults Tension is the force thatcauses stretching. In places where platesare moving apart, the tension can pullrocks apart and create a normal fault. Inthis type of fault, rock above the faultmoves downward.
Earthquakes that are caused by rocksurfaces pulling apart are very shallow.Most of these types happen on the seafloor and cause very little damage. Theisland of Iceland in the North AtlanticOcean experiences many shallowearthquakes. It has huge cracks onits surface where the rocks havepulled apart.
Strike-Slip or Transform Faults Shearis a force that causes slipping. In placeswhere plates are moving sideways pasteach other, the rock along the edges hasmany bumps and bulges in it. Thesurfaces get caught on the rock spotsand the rock is twisted and strained. Asthe plates keep trying to move, theforces build up until the rocks break andan earthquake occurs.
The Pacific Plate carries the PacificOcean floor, its islands, and a narrowstrip of California. It touches sevenother plates and has a lot of action onits boundaries where it slides pastother plates.
Reverse Faults Compression is a forceor stress that squeezes or compresses. Inplaces where the rock is squeezed by themovement of the plates, the compressioncan cause rocks to bend and break. Inthis type of fault, rock above the fault isforced up and over rock below the fault.
Scientists can tell what kind of rockmovement is occurring in an area bymeasuring the depth and focus of eachearthquake. The deepest earthquakes areusually caused by rocks that have beenpushed together, forming a subductionzone. One of the deepest subductionzones in the world is in the PacificOcean, in the Marianas Trench off thecoast of Japan.
A B C
Figure 5.54

404 MHR • Planet Earth
Preparing for EarthquakesPeople who live in earthquake zones learn how to prepare for earth-quakes. In many homes, people attach the furniture to the walls so thatit won’t shift or fall over during an earthquake. They store heavieritems on shelves that are nearer the floor.
Buildings and roads are constructed differently in areas that experiencemany earthquakes. Engineers try to make them earthquake-resistant —able to withstand the shaking of the ground that occurs during an earth-quake. Rigid structures made of bricks or solid concrete break duringan earthquake because they have very little flexibility. Buildings madeof steel, wood, and reinforced concrete can bend a little without breaking.
For tips on using theInternet, turn to SkillFocus 9.
Figure 5.55 This officebuilding in Vancouver isspecially built so that it willnot collapse in anearthquake. The floors aresuspended from the centralcore of the building byhuge cables that are visibleat the top. What do youthink will happen to thisbuilding when the groundmoves in an earthquake?
Find OutShare Your FaultsCan you build your own working models of faulting?
Materials
Styrofoam™ blocks, cardboard boxes, or blocksof wood, the larger the better (approximately20 cm × 10 cm × 5 cm)
Procedure
Brainstorm with your group how you couldbuild models of faulting. Do some research
about faults on the Internet or at the library.You might even be able to download some 3-D diagrams to help you. Using the suppliesapproved by your teacher, create workingmodels of different types of faults. If you usewood be sure to have an adult help you withsawing. Colour your models. Work collabora-tively and divide up the responsibilities.Compare your models with other students’models. Make any changes that would improveyour models.
Communication and Teamwork
Find OutBe Prepared!Think about how you might prepare for an earthquake.
Procedure
Consider what changes might be necessary in your bedroom to preventyou from being injured if an earthquake happened while you were sleep-ing. For example, are there shelves with heavy objects at the top?
Think about the items you might need in an emergency kit after anearthquake. How long might you need them? Where could you storeyour emergency kit?
Make a list of changes to your bedroom and another list of items foryour emergency kit. Compare your lists with another student’s lists, andmake any changes that you feel would improve your own work.
Initiating and Planning

Earthquakes • MHR 405
Other Effects of EarthquakesSome earthquakes happen under the sea. The water displaced by an earthquake can become huge waves called tsunamis (see Figure 5.56). Tsunamis can travel acrossoceans and cause great damage when theybreak on the shore. In mountains, earth-quakes can trigger avalanches or rock slides.One of the most damaging earthquakeshappened about 350 km east of Mexico Cityin 1985. When the shock waves reached the city,their size was increased by the soft sediments of theancient lake bed on which the city is built. The sandy base turned intoquicksand, and many buildings fell over. The process of changing into a liquid-like substance such as quicksand is called liquefaction. Theofficial number of deaths caused by this earthquake was over 5000.
1. Name the instrument that measures earthquakes, and explain how it works.
2. Explain why three seismographs are required to locate an epicentre.
3. Where do earthquakes usually occur in Canada?
4. (a) Explain the rock movement in a normal fault.(b) Explain the rock movement in a reverse fault.(c) Explain the rock movement in a strike-slip or transform fault.
5. Imagine waking up in the middle of the night to find an earthquakeoccurring. When the shaking stops, you get out of bed to check on therest of your family. Everyone is fine, but you notice cracks in the walls ofyour home. Should you stay inside or leave? Explain.
6. Thinking Critically What kinds of structures might suffer the least damageduring an earthquake? Write your ideas, and then share them with aclassmate. Check your ideas by looking at books or using the Internet.
T O P I C 5 Review
www.mcgrawhill.ca/links/sciencefocus7
Find out about the tsunami that struck Port Alberni, B.C., in March 1964 by going to the above web site. Click on Web Linksto find out where to go next. Write a short story, a poem such as
a haiku, or a script, as though you were one of the people whose account you have just read.
Figure 5.56 Tsunamis arecommon along Japan’scoastline. This painting byartist Katsushika Hokusaishows a huge ocean wavenear Japan, with Mount Fujiin the background. Tsunamiis a Japanese wordmeaning “harbour wave.”

406 MHR • Planet Earth
T O P I C 6 VolcanoesWhat would it be like to watch a huge volcano erupt? Imagine the terrific heat, the choking ash, and the streams of molten lava. A volcanois an opening in Earth’s crust that releases lava, steam, and ash when iterupts (becomes active). The openings are called vents. When volca-noes are not active, they are described as dormant. Scientists try topredict when volcanoes will erupt so that the people living near themcan avoid injury or death.
Like earthquakes, volcanoes can be formed when rock surfaces beneathEarth’s crust push against one another. The part of the crust that ispushed downward reaches very hot areas where it melts and becomesmagma. Eventually there is so much magma, it is forced up throughopenings, and erupts.
One of the worsteruptions in historyhappened on August 27,1883, when the volcanicisland of Krakatau inIndonesia literally blewup. The blast was heard4800 km away. At least32 000 people died whentsunamis reaching 30 min height were triggeredby the eruption.
magmasubductionzone
descending rock
Figure 5.58 In asubduction zone, thedescending rock movesdeeper and deeper until itmelts into magma. Thismagma rises up throughcracks in the rock until itexerts enough pressure tocause the volcano aboveto erupt.
Figure 5.57 The mostactive volcano onEarth is Kilauea inHawaii. It has beencontinuously eruptingsince 1983. The lavahas flowed intoresidential areas,causing many millionsof dollars of damage.

Famous VolcanoesMount St. Helens, in Washington, is an example of a major volcaniceruption. The rock on one side of the mountain began to bulge out inthe days before the eruption that occurred in 1980. Scientists knew thatan eruption would happen soon, so they had time to warn people tostay away from the area. The eruption literally blew away the side ofthe mountain. Figure 5.59 shows how magma built up inside the volcano to cause the eruption.
Figure 5.59 Volcanoes erupt in stages, over a period of several weeks, months, or even years.
One of the most famous volcanoes is Mount Vesuvius in southern Italy.Many scientists believe that Vesuvius, dormant since 1944, is due for alarge eruption. A huge area beneath the peak is filling with magma.The situation is even more dangerous because the opening at the peakis sealed by a rock “plug.” Scientists have produced computer simula-tions to show that, when pressure forces the rock “plug” out, a cloud ofmolten rock, ash, and gas will blast about 1.5 km upwards. Plans arebeing made for emergency measures if such an event occurs.
Figure 5.60 This photograph shows a plaster cast of a body buried in the eruption of Vesuvius in 79 C.E.
NorthCollection or upflow of magma generates earthquake.
3 km
2 km
3 km
2 km
3 km
2 km
3 km
2 km
Continued pressure from magma produces bulge.
bulge
Sideways blast occurs.
landslide debris
Full vertical eruption develops.
A. Mount St. Helens, March 20, 1980 B. Mount St. Helens, April 23 to May 18, 1980, 8:27:00 a.m.
C. Mount St. Helens, May 18, 1980, 8:32:41 a.m.
D. Mount St. Helens, May 18, 1980, 8:32:51 a.m.
Volcanoes • MHR 407
Figure 5.61 After the body decayed, plaster waspoured into the cavity it left. When the plastercast hardened, the surrounding ash was removed.

3-A3-A
408 MHR • Planet Earth
150° 120° 90° 60° 30° 0° 30° 60° 90° 120° 150° 180°
150°
60°
30°
0°
30°
60°
60°
30°
0°
30°
60°
120° 90° 60° 30° 0° 30° 60° 90° 120° 150° 180°
Patterns in Earthquake and Volcano Locations One way to predict earthquakes and volcanic eruptions is to look for patternsin their occurrence. In this investigation, you will plot earthquake and volcanolocations, and plate boundaries on a map using lines of latitude and longitude. You may recognize a pattern of earthquake and volcano activity which suggeststhat something unusual occurs in Earth’s crust in certain areas.
QuestionIs there an observable pattern in the occurrence of earthquakes, volcanoes,and plate boundaries?
ProcedureUse the tables on page 409,or obtain your own earth-quake/volcano list from theInternet.
Decide on a symbol that youwill use to indicate earth-quake locations and anothersymbol that you will use toindicate volcano locations.Use red to mark volcanoes,blue for earthquakes, andpurple for plate boundaries.
Put your symbols andcolours on your map underthe title “Legend,” indicat-ing what each symbol represents.
Mark the locations on themap. Use the Internet or anatlas in your research.
Keep your map in a safeplace so that you can use itlater in this chapter.
S K I L L C H E C K
Initiating and Planning
Performing and Recording
Analyzing and Interpreting
Communication and Teamwork
For tips on using the Internet, turnto Skill Focus 9.
5-J5-J
S K I L L C H E C K
Initiating and Planning
Performing and Recording
Analyzing and Interpreting
Communication and Teamwork
Apparatus world map with latitude andlongitude lines
Table: Earthquakes Around the World
Table: Volcanoes Around the World
coloured pencils or markers

Volcanoes • MHR 409
Analyze1. Are most of the earthquakes located near
volcanoes, or are their locations unrelated?
2. Describe the pattern of earthquakes,volcanoes, and plate boundaries in or aroundthe Pacific Ocean.
3. Does the pattern around the Atlantic Oceanlook similar to or different from the PacificOcean pattern?
4. Where do most earthquakes in NorthAmerica occur?
5. Describe any other places in the world that appear to have a large number of earthquakes and volcanoes.
Conclude and Apply6. What conclusion can you reach about
earthquake and volcano locations, based onyour observations?
7. If you were a scientist, what might youhypothesize about Earth’s crust in theseareas?
Extend Your Knowledge8. Look on the Internet for a map of worldwide
earthquake activity prepared by the GeologicalSurvey of Canada and the United StatesGeological Survey. How does the pattern ofearthquake and volcano activity on this mapcompare with the pattern on the map youprepared?
Latitude YearLongitude122°W72°W78°E
105°E140°E102°E85°E39°E
136°E133°W
97°E3°E
48°E147°W
57°E87°W92°W118°E40°E
68°W78°W137°E
102°W45°E
122°W
37°N33°S44°N36°N36°N37°N28°N35°N36°N54°N29°N35°N38°N61°N30°N12°N15°N39°N40°N25°S1°N
37°N18°N41°N37°N
LocationSan Francisco, CaliforniaValparaiso, ChileTien Shan, ChinaKansu, ChinaTokyo, JapanNan Shan, ChinaBihar, IndiaErzincan, TurkeyFukui, Japannear Queen Charlotte IslandsAssam, IndiaAgadir, MoroccoNorthwestern IranSeward, AlaskaSouthern IranManagua, NicaraguaCentral GuatemalaTangshan, ChinaEastern TurkeyNorthwestern ArgentinaEcuador-Colombia borderHonshu, JapanWestern MexicoNorthwestern ArmeniaSan Francisco, California
1906190619111920192319271934193919481949195019601962196419721972197619761976197719791983198519881989
LatitudeLongitude
122°W
123°W
130°E
25°W
29°E
152°W
102°W
156°W
140°E
20°W
14°E
78°W
25°E
123°E
93°W
105°E
132°W
74°W
138°E
15°E
168°W
121°W
60°W
70°W
90°W
122°W
121°E
46°N
50°N
32°N
39°N
1°S
60°N
19°N
19°N
36°S
63°N
41°N
1°S
36°N
13°N
17°N
6°S
57°N
41°S
35°N
38°N
54°N
40°N
15°N
16°S
12°N
49°N
15°N
Location
Mount St. Helens, Washington
Garibaldi, British Columbia
Unzen, Japan
Fayal, Azores
Nyiragongo, Zaire
Redoubt, Alaska
Paricutin, Mexico
Mauna Loa, Hawaii
Tarwera, Australia
Heimaey, Iceland
Vesuvius, Italy
Cotopaxi, Ecuador
Santorini, Greece
Mayon, Philippines
Fuego, Mexico
Krakatoa, Indonesia
Edziza, British Columbia
Osorno, Chile
Fujiyama, Japan
Etna, Sicily
Bogoslov, Alaska
Lassen Peak, California
Mount Pelée, Martinique
El Misti, Peru
Coseguina, Nicaragua
Mount Baker, Washington State
Mount Pinatubo, Philippines
Earthquakes Around the World Volcanoes Around the World

410 MHR • Planet Earth
Look again at the volcano map you made. Run your finger around the edge of the Pacific Ocean, from NewZealand north to Asia and then down the west coast ofNorth America and South America. Can you see all ofthe volcanoes in this circle? These volcanoes around thePacific Ocean make up the Ring of Fire. The namecomes from the circle of volcanoes that pour out red hotlava, fire, and steam. Mount St. Helens and MountPinatubo are part of this Ring of Fire. Most volcanoes inthe Ring of Fire occur at subduction zones.
Figure 5.63 Ash from the eruption of Mount Pinatubo blocked the sunlightand buried fields and roads. Torrential rains caused mudflows that destroyedvillages and left thousands of people homeless.
Mount Pinatubo
Ash plume
Ash layer
Sunlight
Equator
Atmospheric boundary
Figure 5.62 Mount Pinatubo erupted in thePhilippines in 1991. The huge amount of ashblown out of the volcano formed an ash layerwithin the atmosphere that circled the globe and cooled temperatures around the world.
Find OutMyths RetoldThe mythologies of Greeks, Romans,Indonesians, Japanese, Icelanders, andHawaiians all contain accounts of gods orgoddesses whose anger resulted in a volcaniceruption. For example, Hawaiians believed thatthe Fire Goddess Pele, whose image is shownin the photograph, lived inside the volcanoKilauea. They believed that the volcano erupt-ed when she became angry.
Procedure
Look for myths about volcanoes in librarybooks and on the Internet. Choose one of themyths. Tell it in your own words and illustrate it.
Volcanoes • MHR 411
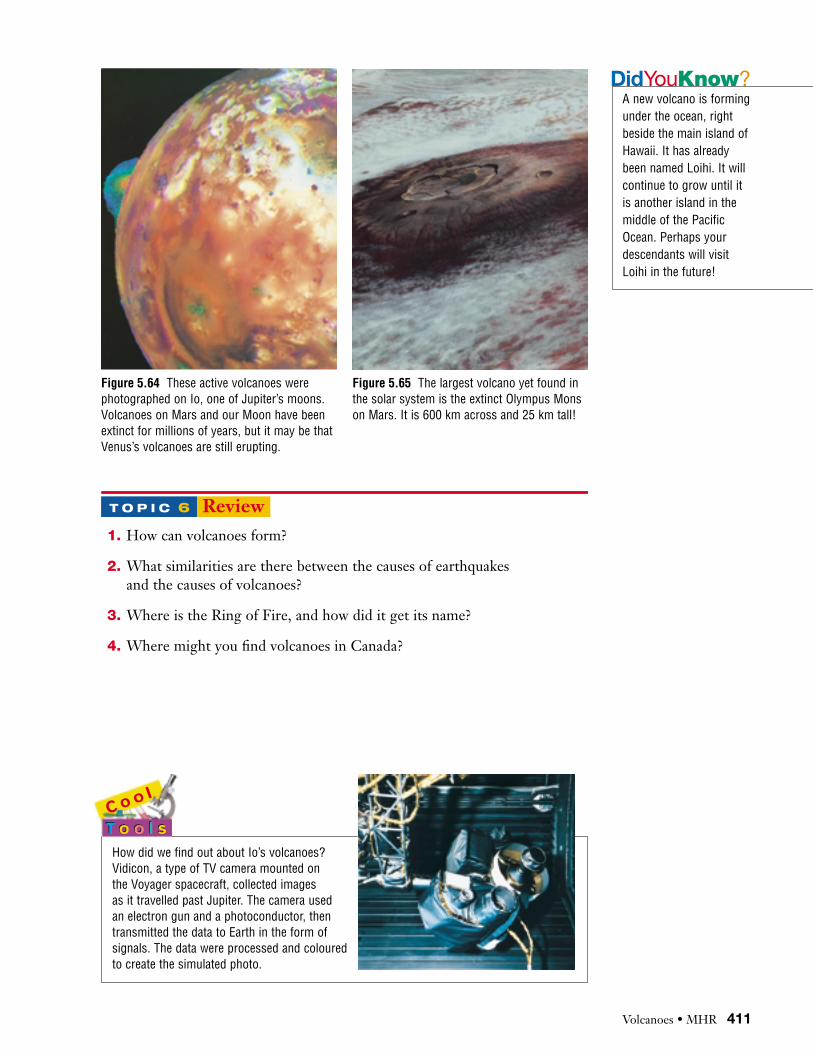
Figure 5.64 These active volcanoes were Figure 5.65 The largest volcano yet found inphotographed on Io, one of Jupiter’s moons. the solar system is the extinct Olympus MonsVolcanoes on Mars and our Moon have been on Mars. It is 600 km across and 25 km tall!extinct for millions of years, but it may be that Venus’s volcanoes are still erupting.
1. How can volcanoes form?
2. What similarities are there between the causes of earthquakes and the causes of volcanoes?
3. Where is the Ring of Fire, and how did it get its name?
4. Where might you find volcanoes in Canada?
T O P I C 6 Review
A new volcano is formingunder the ocean, rightbeside the main island ofHawaii. It has alreadybeen named Loihi. It willcontinue to grow until itis another island in themiddle of the PacificOcean. Perhaps yourdescendants will visitLoihi in the future!
How did we find out about Io’s volcanoes?Vidicon, a type of TV camera mounted on the Voyager spacecraft, collected images as it travelled past Jupiter. The camera used an electron gun and a photoconductor, thentransmitted the data to Earth in the form ofsignals. The data were processed and colouredto create the simulated photo.

412 MHR • Planet Earth
T O P I C 7 Mountains“You’re really growing, aren’t you?” How many times hassomeone made a comment like this to you? Have you everthought that the same kind of comment could be appliedto a mountain? How do mountains form? Which ones arestill growing? Why do they stop growing? These are thekinds of questions that scientists ask as they try to solvesome of the mysteries related to Earth’s crust.
In Topic 2, you learned how sedimentary rock is formed.Some sedimentary rocks formed at the bottom of ancientoceans from shells of marine creatures. These shellsgradually settled to the bottom and, over many, manyyears, are compressed into layers. Other sedimentary rockis made of sand, gravel, and mud.
How does sedimentary rock turn into mountains? Usethe Find Out Activity “Make a Mountain!” to help youvisualize the process.
Mountain Formation and DistributionMountain building takes many years, and it creates some of the mostbeautiful scenery in the world. The Canadian Rockies, the AmericanRockies, and the mountains in Alaska are all part of the WesternCordillera of North America. The name cordillera is Spanish for mountain range. Each mountain range has a distinctive and fascinatinggeological history due to plate tectonics.
Most mountains are large areas that have been uplifted due to themovement or heating of plates. As you learned in Topic 4, the platescan converge, diverge, or slide past each other. The movement along these boundaries can create great heat andpressure. The pressure can cause the rocks to fold and fault, creatingmountains. Sometimes the heat can melt the rock and cause it to rise to form volcanoes.
Figure 5.66 Trace thesedimentary layers of thismountain with your finger.Which forces can bend andfold a mountain?
Find OutMake a Mountain!How do layers of sedimentary rock form intomountains?
Materials
3 sheets of flexible, spongy Styrofoam™ ofdifferent colours
Procedure
Pile the Styrofoam™ sheets on top of eachother. Put your hands on each side of thestack and push together. What happens to the layers?

Mountains • MHR 413
Sedimentary rocks that are placed under slow, gradual pressure caneither fold or break. Geologists explain that rocks can fold if they arehot enough to act like bendable plastic. The soft rock may bend intocurves. Some of the sedimentary rock can be changed to metamorphicrock during the process of folding.
The upward or top part of the folded rock is called the anticline.The bottom of the fold is called the syncline. Over time, both of thesecan erode, but the folded layers still indicate what has happened.
Sometimes the rocks in Earth’s crust are too brittle to fold. Whenpressure is exerted on them, they break, forming a fault. A fault can bethe result of squeezing or stretching of Earth’s crust. When sedimentaryrock is squeezed from the sides, it can form into slabs that move up andover each other like shingles on a roof. This process is called thrustfaulting. When tectonic forces stretch Earth’s crust, fault blocks cantilt or slide down. The older rock may end up on top of the youngerrock. These huge amounts of rock can form mountains called faultblock mountains.
Rock movement along a fault can be vertical or horizontal. Theamount of movement along a fault may be traced by matching rock onopposite sides. One major fault follows the Rocky Mountain Trenchwest of the Rocky Mountains. Some rocks along this fault have beenmoved over 400 km.
Push the skin on the back of your hand. Do you see the wrinkles thatare formed as the skin slides? A similar process is at work in theCanadian Rockies where the sedimentary rock has come loose andslides on the “basement” rock beneath it. Farther south, in theAmerican Rockies, the basement rock has broken along faults. Largeareas of the crust have been shoved on top of each other, raising theunderlying metamorphic and igneous rock up high (see Figure 5.68).
Basement rock
Mantle
Canadian Rockies American Rockies
MantleForeign plate thrust beneath basement
Basement rock
syncline
anticlinesFigure 5.67 These are the main types of folding action inmountain formation.
A B
How could you makea model that showsdifferent types ofmountain building?How could you investi-gate mountain buildingprocesses? You maywish to use your ideasfor “A Creative Crust”at the end of the unit.
Looking Ahead
Figure 5.68 In theCanadian Rockies (A),sedimentary rock is seen at the surface. In theAmerican Rockies (B),“basement” rock is at the surface.

414 MHR • Planet Earth
Mountains can be formed by the conver-gence of continental plates and oceanic plates.The continental plate is lighter and rides overthe oceanic plate. Melted rock wells up underthe edge of the overriding plate, pushing upmountains. The melted rock can breakthrough the surface and erupt as volcanoes.
Usually more than one of these processesoccurs. A combination of different processescreates complex mountains.
Ages of MountainsWhat does a “young” mountain look like?What does an “old” mountain look like?Mountains that are jagged at the top areyoung; mountains that are more rounded areolder. Think back to the rock cycle in Topic 2and try to identify another difference in
appearance between a young and an old mountain range. Would you describe the Rockies as an old or a young mountain
range? Some of the peaks in the Rockies are so high that they are snow-covered all year. The Rockies are one of many younger mountainranges in the world, with the Himalayas in India being the youngest andhighest. The top of Mount Everest in the Himalayas, like you, is stillgrowing taller! The Laurentian Mountains in Québec are not as high asthe Rockies. They are an older mountain range that is in the process ofbeing worn down.
Mountain Ranges
Alps Himalayas Rockies
Urals Carpathians Laurentians
Andes Great Dividing Range63
852
741
17
6
8
3
4
52
QueenCharlotte
fault
WASH.
MountGaribaldi
MountSt. Helens
MountHood
OREGON
SanAndreas
fault
Juan deFucaridge
Juan deFucaplate
NorthAmerican
plate
Mendicinofracture
zone
Pacificplate
Transform boundary(platessliding pasteach other)
Convergentboundary
Volcanoes
Divergentboundary
Key
Figure 5.69 The subductionof the Juan de Fuca plateoff the west coast of NorthAmerica has caused avariety of features. Thesedimentary rocks havebeen uplifted, folded, andfaulted. Magma bodieshave also been created that rise in the crust,forming volcanoes.
Figure 5.70 Compare thismap of mountain rangeswith your map ofearthquakes and volcanoes.Most of the westerncoastline of North andSouth America are areaswhere rock surfaces arepushing against each other.

Mountains • MHR 415
Building a Mountain-Building TheoryWhat is a mountain? The term mountain has no simple definition because there areso many different ways mountains can be built. In this investigation you are going toinvestigate the location of many of Earth’s mountain ranges. You will create a legendto distinguish mountains from each other based on how they were formed. As well,you will expand on an existing theory or develop a theory of your own to explainmountain distribution.
QuestionWhere are the major mountains found on Earth’s surface and what has created them?
Apparatustransparency provided by yourteacher
water soluble transparency pens (3 colours)
atlas or other source of mountainlocations
ProcedureResearch the location ofEarth’s major mountainranges. Be sure to include the mountain ranges underthe oceans.
Classify the mountainsbased on how they wereformed.
Choose a separate colourfor each type of mountaincategory. Use the trans-parency and the specialtransparency pens.
Record the location of asmany mountain ranges asyou can on the transparency.
Add a legend to yourtransparency to explain yoursystem of colouring.
You probably foundmountains for which youcould not explain the origin.
Form a hypothesis abouthow these mountains mighthave developed or expandone of the ideas in the textbook.
5-K5-K
Analyze1. What categories did you create to classify your mountains?
Why?
2. Where do most of the mountains on Earth’s crust occur?
3. Put the transparency you made for this investigation on yourmap of volcanoes and earthquakes from Inquiry Investigation5-J, Patterns in Earthquake and Volcano Locations. Whatsimilarities can you observe between the location of moun-tain ranges and that of volcanoes?
Conclude and Apply 4. How do the locations of mountain ranges compare with the
locations of plate boundaries? What are the exceptions?
5. Describe at least three different ways in which mountainscan be created.
Extend Your Knowledge6. Predict where new mountain ranges might occur in the next
3 to 4 million years. On which facts do you base your prediction?
7. Write a definition of the word “mountain.”
S K I L L C H E C K
Initiating and Planning
Performing and Recording
Analyzing and Interpreting
Communication and Teamwork

416 MHR • Planet Earth
1. How are folded mountains formed?
2. What are two actions of Earth’s crust that cancreate a fault?
3. How is a fault block mountain formed?
4. How are complex mountains formed?
5. What is an anticline? What is a syncline?What does each indicate to a geologist?
6. Thinking Critically Why do you think theHimalayas are getting taller and theLaurentians are getting smaller?
7. Thinking Critically Explain how theOlympic Mountains were formed, usingFigure 5.73 as a guide.
Olympic Mountains(coastal range)
folded sedimentary andmetamorphic rocks
Juan de Fuca plate
0 200 km
Cascadevolcanoes
T O P I C 7 Review
Room at the Top
Scenic mountainous areas have long been popular vacation spots. In a small group, brainstorm what sorts of businesses would likely be found in mountainous areas.
What sort of business might you be interested in starting in this type of area? Write adescription of your business, explaining what service it would provide, who its clients wouldbe, and why you think it could be successful. With the help of an adult, try to arrange aninterview with someone who runs a similar type of business in your own community.
Before the interview, prepare questions such as these:
• How did you plan your business before you actually started?
• How has your business grown?
• What have you learned from having your own business?
Figure 5.71 Mount Rundle, near Banff, Alberta,has been uplifted and then tilted.
Figure 5.72 Castle Mountain is located betweenBanff and Jasper. Can you see the almosthorizontal layers of sedimentary rock uplifted?
Figure 5.73 The convergent plate boundary justoff the coast of British Columbia.

Wrap-up Topics 4–7 • MHR 417
If you need to check an item, Topic numbers are provided in brackets below.
Key Termsmantlecontinental driftsonarsea floor spreadingconverging platesdiverging platesplatestheory of plate tectonics
convection currentsubduction zonesseismographbedrockRichter scaleseismic wavesaftershocksprimary (P) waves
secondary (S) wavessurface wavesfocusepicentrefaultventsdormant Ring of Fire
anticlinesynclinethrust faultingfault block mountainscomplex mountains
T O P I C S 4 – 7Wrap-up
Reviewing Key Terms1. In your notebook, match the description in column A with the correct term in
column B. There will be some terms left over. Do not write in this book!
• fastest travelling earthquake wave
• surface location of an earthquake
• second type of earthquake wave generated
• bottom portion of a rock fold
• person who studies earthquakes
• scale used to measure earthquake magnitude
• wave that causes the most damage
• upward portion of a rock fold
• rock break location under the ground
• huge ocean wave caused by earthquake
• epicentre (5)
• focus (5)
• P wave (5)
• anticline (7)
• vents (6)
• seismologist (5)
• tsunami (5)
• Richter scale (5)
• surface wave (5)
• syncline (7)
• S wave (5)
• dormant (6)
• Ring of Fire (6)
• aftershocks (5)
BA
Understanding Key Concepts2. Name the layers beneath Earth’s crust. Which layer
is thickest? Which layer is hottest? (4)
3. How does technology help us to understand whether the layers of Earth are solid or liquid? (6)
4. Explain the theory of plate tectonics. (4)
5. Describe the three kinds of rock movement that can cause earthquakes. (5)
6. Explain two main processes of mountain building. (7)