Top-performing airlines TOP 10 Council of Advisers ... · 2013 TPA Council of Advisers ... and...
4
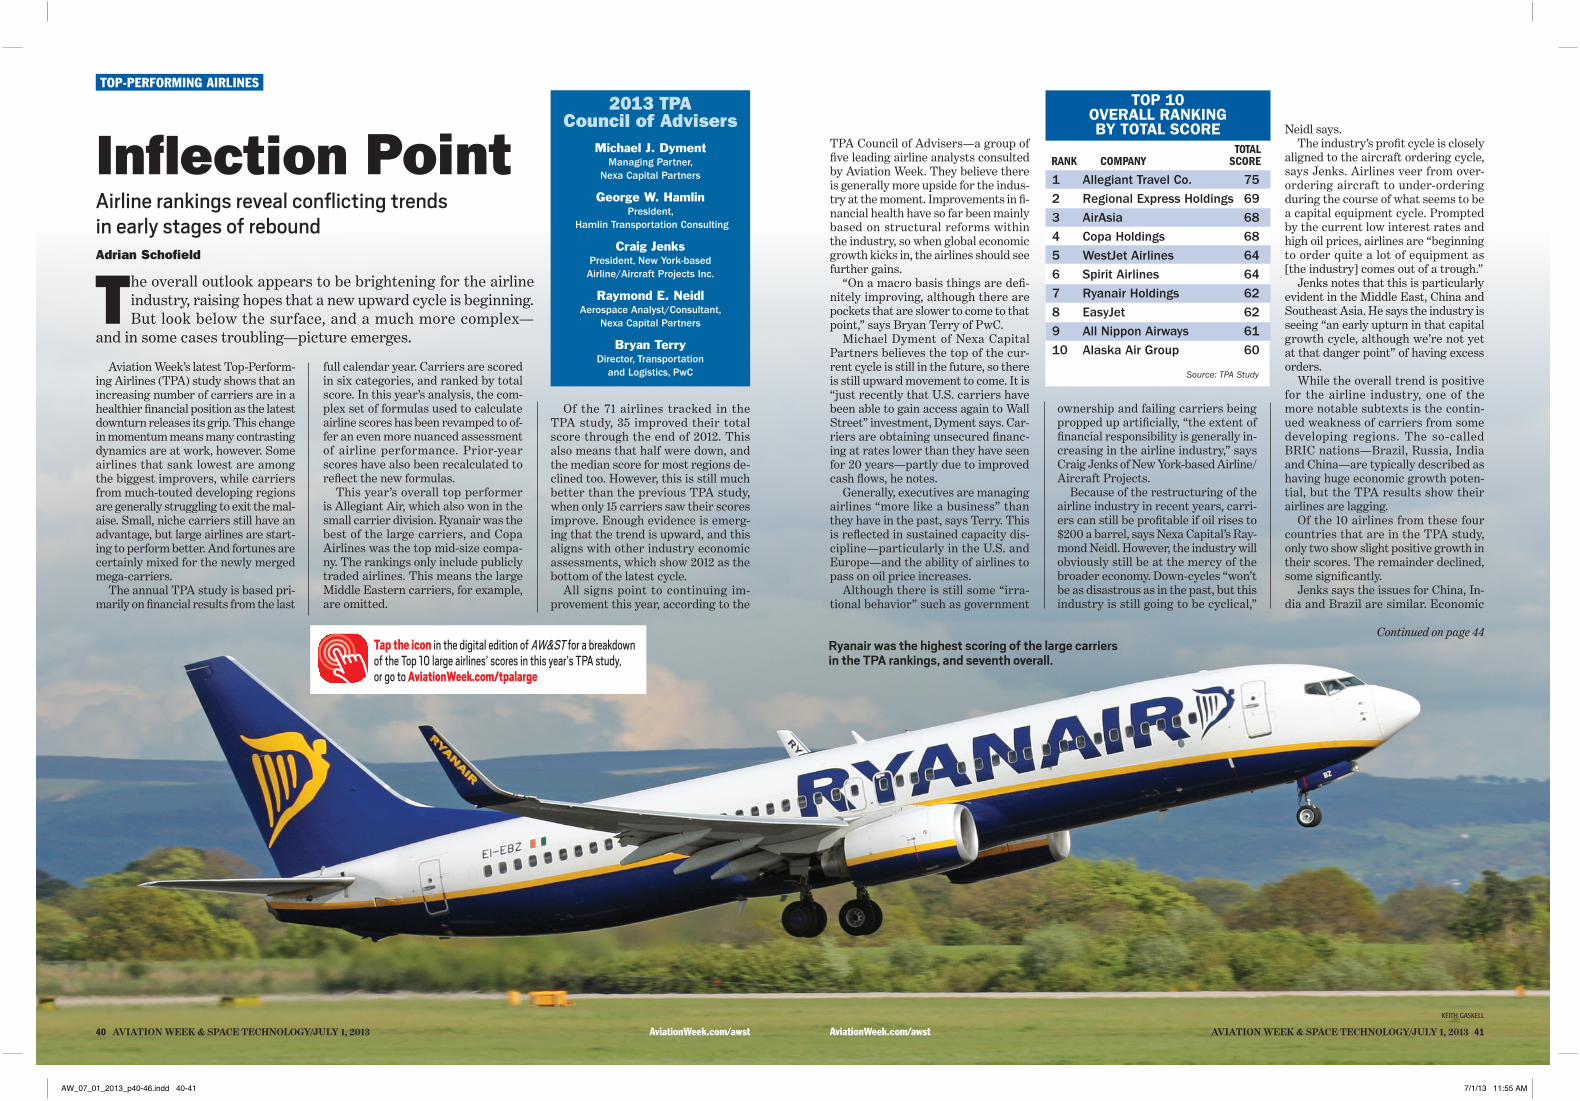
Of the 71 airlines tracked in the TPA study, 35 improved their total score through the end of 2012. This also means that half were down, and the median score for most regions de- clined too. However, this is still much better than the previous TPA study, when only 15 carriers saw their scores improve. Enough evidence is emerg- ing that the trend is upward, and this aligns with other industry economic assessments, which show 2012 as the bottom of the latest cycle. All signs point to continuing im- provement this year, according to the TOP-PERFORMING AIRLINES TOP 10 OVERALL RANKING BY TOTAL SCORE TOTAL RANK COMPANY SCORE 1 Allegiant Travel Co. 75 2 Regional Express Holdings 69 3 AirAsia 68 4 Copa Holdings 68 5 WestJet Airlines 64 6 Spirit Airlines 64 7 Ryanair Holdings 62 8 EasyJet 62 9 All Nippon Airways 61 10 Alaska Air Group 60 Source: TPA Study 2013 TPA Council of Advisers Michael J. Dyment Managing Partner, Nexa Capital Partners George W. Hamlin President, Hamlin Transportation Consulting Craig Jenks President, New York-based Airline/Aircraft Projects Inc. Raymond E. Neidl Aerospace Analyst/Consultant, Nexa Capital Partners Bryan Terry Director, Transportation and Logistics, PwC T he overall outlook appears to be brightening for the airline industry, raising hopes that a new upward cycle is beginning. But look below the surface, and a much more complex— and in some cases troubling—picture emerges. Aviation Week’s latest Top-Perform- ing Airlines (TPA) study shows that an increasing number of carriers are in a healthier financial position as the latest downturn releases its grip. This change in momentum means many contrasting dynamics are at work, however. Some airlines that sank lowest are among the biggest improvers, while carriers from much-touted developing regions are generally struggling to exit the mal- aise. Small, niche carriers still have an advantage, but large airlines are start- ing to perform better. And fortunes are certainly mixed for the newly merged mega-carriers. The annual TPA study is based pri- marily on financial results from the last Adrian Schofield Inflection Point Airline rankings reveal conflicting trends in early stages of rebound TPA Council of Advisers—a group of five leading airline analysts consulted by Aviation Week. They believe there is generally more upside for the indus- try at the moment. Improvements in fi- nancial health have so far been mainly based on structural reforms within the industry, so when global economic growth kicks in, the airlines should see further gains. “On a macro basis things are defi- nitely improving, although there are pockets that are slower to come to that point,” says Bryan Terry of PwC. Michael Dyment of Nexa Capital Partners believes the top of the cur- rent cycle is still in the future, so there is still upward movement to come. It is “just recently that U.S. carriers have been able to gain access again to Wall Street” investment, Dyment says. Car- riers are obtaining unsecured financ- ing at rates lower than they have seen for 20 years—partly due to improved cash flows, he notes. Generally, executives are managing airlines “more like a business” than they have in the past, says Terry. This is reflected in sustained capacity dis- cipline—particularly in the U.S. and Europe—and the ability of airlines to pass on oil price increases. Although there is still some “irra- tional behavior” such as government Neidl says. The industry’s profit cycle is closely aligned to the aircraft ordering cycle, says Jenks. Airlines veer from over- ordering aircraft to under-ordering during the course of what seems to be a capital equipment cycle. Prompted by the current low interest rates and high oil prices, airlines are “beginning to order quite a lot of equipment as [the industry] comes out of a trough.” Jenks notes that this is particularly evident in the Middle East, China and Southeast Asia. He says the industry is seeing “an early upturn in that capital growth cycle, although we’re not yet at that danger point” of having excess orders. While the overall trend is positive for the airline industry, one of the more notable subtexts is the contin- ued weakness of carriers from some developing regions. The so-called BRIC nations—Brazil, Russia, India and China—are typically described as having huge economic growth poten- tial, but the TPA results show their airlines are lagging. Of the 10 airlines from these four countries that are in the TPA study, only two show slight positive growth in their scores. The remainder declined, some significantly. Jenks says the issues for China, In- dia and Brazil are similar. Economic full calendar year. Carriers are scored in six categories, and ranked by total score. In this year’s analysis, the com- plex set of formulas used to calculate airline scores has been revamped to of- fer an even more nuanced assessment of airline performance. Prior-year scores have also been recalculated to reflect the new formulas. This year’s overall top performer is Allegiant Air, which also won in the small carrier division. Ryanair was the best of the large carriers, and Copa Airlines was the top mid-size compa- ny. The rankings only include publicly traded airlines. This means the large Middle Eastern carriers, for example, are omitted. ownership and failing carriers being propped up artificially, “the extent of financial responsibility is generally in- creasing in the airline industry,” says Craig Jenks of New York-based Airline/ Aircraft Projects. Because of the restructuring of the airline industry in recent years, carri- ers can still be profitable if oil rises to $200 a barrel, says Nexa Capital’s Ray- mond Neidl. However, the industry will obviously still be at the mercy of the broader economy. Down-cycles “won’t be as disastrous as in the past, but this industry is still going to be cyclical,” AviationWeek.com/awst AVIATIONWEEK&SPACETECHNOLOGY/JULY1,2013 41 40AVIATIONWEEK&SPACETECHNOLOGY/JULY1,2013 AviationWeek.com/awst KEITH GASKELL Continued on page 44 Ryanair was the highest scoring of the large carriers in the TPA rankings, and seventh overall. Tap the icon in the digital edition of AW&ST for a breakdown of the Top 10 large airlines’ scores in this year’s TPA study, or go to AviationWeek.com/tpalarge AW_07_01_2013_p40-46.indd 40-41 7/1/13 11:55 AM
Transcript of Top-performing airlines TOP 10 Council of Advisers ... · 2013 TPA Council of Advisers ... and...
Of the 71 airlines tracked in the TPA study, 35 improved their total score through the end of 2012. This also means that half were down, and the median score for most regions de-clined too. However, this is still much better than the previous TPA study, when only 15 carriers saw their scores improve. Enough evidence is emerg-ing that the trend is upward, and this aligns with other industry economic assessments, which show 2012 as the bottom of the latest cycle.
All signs point to continuing im-provement this year, according to the
Top-performing airlinesTOP 10
OVERALL RANKING BY TOTAL SCORE
TOTALRANK COMPANY SCORe
1 AllegiantTravelCo. 752 RegionalExpressHoldings 693 AirAsia 684 CopaHoldings 685 WestJetAirlines 646 SpiritAirlines 647 RyanairHoldings 628 EasyJet 629 AllNipponAirways 6110 AlaskaAirGroup 60
Source: TPA Study
2013 TPA Council of Advisers
Michael J. DymentManagingPartner,
NexaCapitalPartners
George W. HamlinPresident,
HamlinTransportationConsulting
Craig JenksPresident,NewYork-basedAirline/AircraftProjectsInc.
Raymond E. NeidlAerospaceAnalyst/Consultant,
NexaCapitalPartners
Bryan TerryDirector,Transportation
andLogistics,PwC
The overall outlook appears to be brightening for the airline industry, raising hopes that a new upward cycle is beginning. But look below the surface, and a much more complex—
and in some cases troubling—picture emerges.
Aviation Week’s latest Top-Perform-ing Airlines (TPA) study shows that an increasing number of carriers are in a healthier financial position as the latest downturn releases its grip. This change in momentum means many contrasting dynamics are at work, however. Some airlines that sank lowest are among the biggest improvers, while carriers from much-touted developing regions are generally struggling to exit the mal-aise. Small, niche carriers still have an advantage, but large airlines are start-ing to perform better. And fortunes are certainly mixed for the newly merged mega-carriers.
The annual TPA study is based pri-marily on financial results from the last
Adrian Schofield
Inflection PointAirline rankings reveal conflicting trends in early stages of rebound
TPA Council of Advisers—a group of five leading airline analysts consulted by Aviation Week. They believe there is generally more upside for the indus-try at the moment. Improvements in fi-nancial health have so far been mainly based on structural reforms within the industry, so when global economic growth kicks in, the airlines should see further gains.
“On a macro basis things are defi-nitely improving, although there are pockets that are slower to come to that point,” says Bryan Terry of PwC.
Michael Dyment of Nexa Capital Partners believes the top of the cur-rent cycle is still in the future, so there is still upward movement to come. It is “just recently that U.S. carriers have been able to gain access again to Wall Street” investment, Dyment says. Car-riers are obtaining unsecured financ-ing at rates lower than they have seen for 20 years—partly due to improved cash flows, he notes.
Generally, executives are managing airlines “more like a business” than they have in the past, says Terry. This is reflected in sustained capacity dis-cipline—particularly in the U.S. and Europe—and the ability of airlines to pass on oil price increases.
Although there is still some “irra-tional behavior” such as government
Neidl says.The industry’s profit cycle is closely
aligned to the aircraft ordering cycle, says Jenks. Airlines veer from over-ordering aircraft to under-ordering during the course of what seems to be a capital equipment cycle. Prompted by the current low interest rates and high oil prices, airlines are “beginning to order quite a lot of equipment as [the industry] comes out of a trough.”
Jenks notes that this is particularly evident in the Middle East, China and Southeast Asia. He says the industry is seeing “an early upturn in that capital growth cycle, although we’re not yet at that danger point” of having excess orders.
While the overall trend is positive for the airline industry, one of the more notable subtexts is the contin-ued weakness of carriers from some developing regions. The so-called BRIC nations—Brazil, Russia, India and China—are typically described as having huge economic growth poten-tial, but the TPA results show their airlines are lagging.
Of the 10 airlines from these four countries that are in the TPA study, only two show slight positive growth in their scores. The remainder declined, some significantly.
Jenks says the issues for China, In-dia and Brazil are similar. Economic
full calendar year. Carriers are scored in six categories, and ranked by total score. In this year’s analysis, the com-plex set of formulas used to calculate airline scores has been revamped to of-fer an even more nuanced assessment of airline performance. Prior-year scores have also been recalculated to reflect the new formulas.
This year’s overall top performer is Allegiant Air, which also won in the small carrier division. Ryanair was the best of the large carriers, and Copa Airlines was the top mid-size compa-ny. The rankings only include publicly traded airlines. This means the large Middle Eastern carriers, for example, are omitted.
ownership and failing carriers being propped up artificially, “the extent of financial responsibility is generally in-creasing in the airline industry,” says Craig Jenks of New York-based Airline/Aircraft Projects.
Because of the restructuring of the airline industry in recent years, carri-ers can still be profitable if oil rises to $200 a barrel, says Nexa Capital’s Ray-mond Neidl. However, the industry will obviously still be at the mercy of the broader economy. Down-cycles “won’t be as disastrous as in the past, but this industry is still going to be cyclical,”
aviationWeek.com/awst� aviation�week�&�space�technology/July�1,�20134140���aviation�week�&�space�technology/July�1,�2013� aviationWeek.com/awst
Keith GasKell
Continued on page 44Ryanair was the highest scoring of the large carriers in the TPA rankings, and seventh overall.
Tap the icon in the digital edition of AW&ST for a breakdown of the Top 10 large airlines’ scores in this year’s TPA study, or go to AviationWeek.com/tpalarge
AW_07_01_2013_p40-46.indd 40-41 7/1/13 11:55 AM

c
42���aviation�week�&�space�technology/July�1,�2013� aviationWeek.com/awst
c
aviationWeek.com/awst� aviation�week�&�space�technology/July�1,�201343
WesTJeT airlinesRank: 2nd, revenues of $2-6 billion2012 sales: $3.4 billion
WestJet has been one of the standouts in North America in recent years. In this year’s study, the Canadian low-cost carrier was fifth overall and second in its region, behind only Al-legiant. This proves that it not only performs well relative to Air Canada in its local market, but also compared to the larger airlines over the border. WestJet has just reported its 32nd consecutive profitable quarter, and consistently achieves double-digit return on invested capital—some-thing of a rarity among airlines in the region. The most notable feature of its TPA score is the liquidity metric, where it is rated with the highest possible score of 99. The carrier will be hoping the launch of its Encore re-gional subsidiary will further boost its performance.
12MONThS ReVeNUe TOTALRANK COMPANY eNdiNg ($ millions) SCORe
REVENUES GREATER THAN $6 BILLION
1 RyAnAIR HoldIngS Dec.’12 $6,356 622 AllNipponAirways Dec.’12 18,084 613 SingaporeAirlines Dec.’12 12,177 554 TurkHavaYollari Dec.’12 8,317 515 AirChina Dec.’12 15,787 516 DeutscheLufthansa Dec.’12 39,248 497 AeroflotRussianAirlines Dec.’12 8,138 488 QantasAirways Dec.’12 16,348 479 SouthwestAirlines Dec.’12 17,088 4510 USAirwaysGroup Dec.’12 13,831 4511 CathayPacificAirways Dec.’12 12,822 4312 ChinaSouthernAirlines Dec.’12 15,845 4213 ThaiAirways Dec.’12 6,718 4114 AirCanada Dec.’12 12,117 4115 ChinaEasternAirlines Dec.’12 13,847 4016 DeltaAirLines Dec.’12 36,670 4017 UnitedContinentalHoldings Dec.’12 37,152 3718 AirFrance-KLM Dec.’12 33,376 3519 LatamAirlinesGroup Dec.’12 9,771 3520 AMRCorp Dec.’12 24,855 3521 KoreanAirLines Dec.’12 11,959 3522 InternationalAirlinesGroup Dec.’12 23,539 3423 SAS Jan.’13 6,290 31
1 CoPA HoldIngS Dec.’12 $2,249 682 WestJetAirlines Dec.’12 3,427 643 EasyJet Sep.’12 5,991 624 AlaskaAirGroup Dec.’12 4,657 605 AirNewZealand Dec.’12 3,738 526 HainanAirlines Dec.’12 4,596 517 GarudaIndonesia Dec.’12 3,473 478 EVAAirways Dec.’12 4,101 459 GrupoAeromexico Dec.’12 3,040 4510 ChinaAirlines Dec.’12 4,898 4411 SkyWest Dec.’12 3,534 4312 AviancaHoldings Dec.’12 4,328 4213 RepublicAirways Dec.’12 2,811 4214 Finnair Dec.’12 3,190 4215 JetBlueAirways Dec.’12 4,982 4116 NorwegianAirShuttle Dec.’12 2,237 4117 TransatA.T. Oct.’12 3,720 4118 VirginAustralia Dec.’12 4,160 4019 ElAlIsraelAirlines Dec.’12 2,016 3320 AirBerlin Dec.’12 5,611 3021 MalaysianAirlineSystem Dec.’12 4,301 2922 AsianaAirlines Dec.’12 5,536 2723 JetAirways(India) Mar.’12 3,282 2524 GOL Dec.’12 4,096 17
REVENUES $2-6 BILLION
all nippon airWaysRank: 2nd, revenues greater than $6 billionSales (12 months through Dec. 2012): $18.1 billion
All Nippon Airways can claim to be the best of the major full-service car-riers in the TPA rankings. In last year’s study, which used a different methodology, ANA was the only one in the large-airline category to increase its score. In the latest TPA findings, it is the top-ranked major airline that is not a low-cost carrier. Additionally, it is the only one of the Top 10 airlines overall that has revenue greater than $10 billion, and the only one of the Top 18 with revenue greater than $15 billion. The carrier ranks highly in liquidity and earnings performance scores, but really shines in the busi-ness model performance measure, where it has the best score of any large airline. ANA is an exception to the trend of smaller carriers outper-forming the giants.
regional express Holdings
Rank: 2nd, revenues of $250 million-$2 billionSales (12 months through Dec. 2012): $275 million
Australia’s Regional Express (Rex) always punches well above its weight in the TPA rankings, and this year is no exception. It comes in second over-all, and is the top-scoring Asia-Pacific airline this year. While carriers world-wide struggle to make regional air service profitable, Rex demonstrates what can be achieved through strong management. With the highest busi-ness model performance score of any airline this year, Rex also rated highly in the financial health and liquidity metrics. The carrier is the smallest—by annual revenue—of any carrier in the TPA analysis, which reinforces a recurring theme of the TPA study that an airline’s financial success is not proportional to its scale.
12MONThS ReVeNUe TOTALRANK COMPANY eNdiNg ($ millions) SCORe
REVENUES $250 MILLION-2 BILLION
Notes:
Publicly traded airlines only. Scores range from 1 to a maximum value of 99.
The methodology for these rankings can be found on page 47.
Top-performing airlines
Aviation Week Intelligence Network subscribers can go to: aviationWeek.com/awin/Tpa for expanded rankings tables that break out each airline’s scores in the six categories. Extensive data pages for each carrier can also be accessed, as well as additional analysis and tables. These include a universal rankings list, full year-on-year score change list and five-year average score rankings.
joepriesaviation.net
Copa HoldingsRank: 1st, revenues of $2-6 billion2012 sales: $2.2 billion
Copa has been one of the peren-nial high-scorers in the TPA small-airline category, although it was often overshadowed by other stellar performers in this group. This year, its revenues increased enough to lift it into the medium-sized airline category, where it was comfortably the top-scorer. This was all the more remarkable considering that Copa’s score actually declined, as it was af-fected by the malaise that influenced all the Latin American carriers in the TPA rankings. However, Copa’s fundamental strengths remain, and its dip is likely to be temporary. It has a geographical advantage with its hub being ideally placed to connect North and Latin America, and it has the right fleet and business plan to exploit this niche.
joepriesaviation.net joepriesaviation.net
Keith GasKell
1 AllegIAnT TRAvel Co. Dec.’12 $909 752 RegionalExpressHoldings Dec.’12 275 693 AirAsia Dec.’12 1,617 684 SpiritAirlines Dec.’12 1,318 645 AirArabia Dec.’12 801 596 CebuAir Dec.’12 916 567 IcelandairGroup Dec.’12 896 548 VuelingAirlines Dec.’12 1,421 529 AerLingus Dec.’12 1,813 5110 Chorus-JazzAir Dec.’12 1,710 5011 KenyaAirways Mar.’12 1,300 4412 ShandongAirlines Dec.’12 1,764 4213 HawaiianHoldings Dec.’12 1,962 4214 Comair Dec.’12 554 3915 FlybeGroup Sep.’12 974 3916 AegeanAirlines Dec.’12 857 3917 TransasiaAirways Dec.’12 343 3718 TigerAirwaysHoldings Dec.’12 634 3719 AirMauritius Dec.’12 597 3220 TunisAir Jun.’12 789 3121 PALHoldings Dec.’12 1,756 2322 SpiceJet Mar.’12 821 923 PakistanInternationalAirlines Sep.’12 1,374 824 MeridianaFly Oct.’12 822 1
AW_07_01_2013_p40-46.indd 42-43 7/1/13 11:55 AM

c
44���aviation�week�&�space�technology/July�1,�2013� aviationWeek.com/awst
c
aviationWeek.com/awst� aviation�week�&�space�technology/July�1,�201345
Top-performing airlines
TOP 10, EUROPE TOTALRANK COMPANY SCORe
1 RyanairHoldings 622 EasyJet 623 IcelandAirGroup 544 VuelingAirlines 525 TurkHavaYollari 516 AerLingus 517 DeutscheLufthansa 498 AeroflotRussianAirlines 489 Finnair 4210 NorwegianAirShuttle 41
Source: TPA Study
TOP 5, LATIN AMERICA TOTALRANK COMPANY SCORe
1 CopaHoldings 682 GrupoAeromexico 453 AviancaHoldings 424 LatamAirlinesGroup 355 GOL 17
Source: TPA Study
Continued from page 41
US Airways had the highest score of the major U.S. legacy carriers, which generally saw a resurgence in their TPA scores.
jay selMan
30
35
40
45
50
55
60
65
70
2008 2009 2010 2011 2012
Asia-Paci cEurope Latin America North America
Median total TPA scores by region
Source: TPA Study
TOP 10, NORTH AMERICA TOTALRANK COMPANY SCORe
1 AllegiantTravelCo. 752 WestJetAirlines 643 SpiritAirlines 644 AlaskaAirGroup 605 Chorus-JazzAir 506 SouthwestAirlines 457 USAirwaysGroup 458 SkyWest 439 RepublicAirways 4210 HawaiianHoldings 42
Source: TPA Study
growth has been slower than expect-ed—although China’s is still robust—and there has been a high rate of air-line capacity growth in all three.
The BRIC airlines are particularly focused on their very large domestic markets, says Jenks. This makes it more difficult to transfer capacity to international routes when their do-mestic economies slow. India, China and Brazil do not have strong global long-haul airline brands, or strong long-haul hubs, he says. For airlines in these countries, their “international route capacity is inferior to the in-bound routes and branding of foreign competitors.”
Another feature of the TPA results is that some of the most troubled car-riers in previous years are now among the most improved, says Jenks. For example, Thai Airways, American Airlines, Malaysia Airlines, Finnair and Air Berlin are among the top im-provers in their categories.
In some ways, “this is what you’d ex-pect in an early upturn environment,” Jenks says. But it also demonstrates that “nothing focuses the mind like a near-death experience.” TPA Project Manager and aviation analyst Michael Lowry emphasizes that all these car-riers had a lot of scope to make gains since they had such low scores. But they have also “executed significant re-
structuring programs and succeeded.”A trend that is no surprise in a
strengthening industry environment is improved performance of the larger carriers—particularly the U.S. legacy airlines. This is in contrast to last year’s TPA analysis, where the woeful performance of the large-carrier cat-egory was a notable feature. Although the scoring formula has been revised since then, only one of the airlines in this category saw its score increase in last year’s study.
But despite this relative improve-ment of the majors, it is still the small-er niche carriers that are the star per-formers of the TPA rankings. Four of the Top Six airlines overall are from the small category, and eight of the Top
15. “Small is still better, but the gap is starting to close,” Neidl says.
As in previous years’ TPA studies, the successful smaller airlines occupy lucrative niches and are at an optimal point in their growth cycles.
George Hamlin of Hamlin Trans-portation Consulting observes that despite the better performance of the large carriers, there are still only three represented in the Top 15. It is the “small carriers that are reinvigorating the industry,” he says. A closely related dynamic is the preponderance of com-paratively new airlines at the top end of the table, Hamlin says. Only two of the Top 10, and five of the Top 20, were in existence before 1970.
Another trend is that many of the
“true” low-cost carriers—including Spirit Airlines, EasyJet, Southwest Airlines and JetBlue Airways—saw score declines. Hamlin, however, cautions against overestimating this effect, since LCCs are still very well represented in the Top 10.
Rather than linking LCC perfor-mance to the cycle, Hamlin says the LCC declines in the U.S. and Europe represent a “rebalancing,” and that “history is still being written as to how the balance between the LCCs and legacies” will evolve.
One of the main features of the global airline industry in recent years has been the number of mergers and acquisitions among leading carriers. However, the TPA results show that the jury is still very much out on how successful the wave of consolidation has been.
On one hand, there are carriers like Delta Air Lines and Lufthansa that ap-pear to have digested their mergers/acquisitions, and their performances went up this year. Delta has logged an increased score in four of the past six years.
But others are not yet enjoying the same lift. In the large category, three of the most dramatic score declines were Latam, International Airlines Group, and United Airlines—all of which have recently completed mergers.
The more recent mergers are ob-viously at a disadvantage when com-pared to linkups that are more mature.
“It takes a minimum of two years for a successful merger, and in some cases longer,” Neidl says.
However, execution is still a variable factor. The relative TPA ranks show that “mergers can be done right, but if they are not executed to perfection, they can be problematic,” says Hamlin.
Jenks notes that macroeconomic is-sues also come into play. For example, British Airways “saw a pot of gold at the end of the rainbow” with its merger with Iberia, but “at the other end of the rainbow was Spain” and its struggling economy.
Likewise, the LAN-TAM merger has coincided with an economic slump in Brazil, TAM’s home market. Lowry points out that while “the economics [of the deal] were spot on, the timing was lousy.”
The advisers stress that some of the link-ups are not yet true mergers. Air France-KLM and IAG, for exam-ple, have not integrated some crucial parts of their operations, meaning that they miss some of the advantages of mergers.
As with previous TPA studies, air-line fortunes vary widely by region. When the carriers are grouped geo-graphically, most regions saw a decline in median scores—although the drop was shallower. North America was an exception, with the previous decline leveling off in 2012.
North America also provides the highest-ranked carrier overall. Alle-giant’s gain of 4.2 points was enough to move it above other perennial strong performers.
Allegiant considers itself more of a travel company than an airline, and it has a business model like no other car-rier in its region. It relies more heav-ily than its peers on ancillary revenue, from holiday packages and inflight services. It buys used rather than new aircraft, and operates older types—mainly MD-80s. Allegiant’s network is predominantly aimed at connecting small markets to holiday destinations, with relatively low frequency.
Other carriers also target ancillary revenue, but they have not succeeded to the degree Allegiant has. Neidl says that while airlines can replicate some elements of what Allegiant is doing, the business model itself would not work for anyone else—especially the larger airlines. Allegiant is the ulti-mate example of a small airline find-ing a niche that works and exploiting
it, Hamlin says.Southwest has typically been the
highest-ranked of the U.S. major car-riers, but it has slipped again and it was almost overtaken by US Airways. The legacy network carriers generally fared well, with all seeing a score in-crease apart from United.
Neidl says United’s recent perfor-mance has been relatively disappoint-ing. However, the advisers agree that the airline has the strongest assets and
AW_07_01_2013_p40-46.indd 44-45 7/1/13 11:55 AM

c
Top-performing airlines
46���aviation�week�&�space�technology/July�1,�2013� aviationWeek.com/awst
BEST FIVE-YEAR AVERAGE SCORE (2008-12)
TOTALRANK COMPANY SCORe
1 AllegiantTravelCo. 742 RegionalExpressHoldings 703 CopaHoldings 684 AirArabia 655 AirAsia 646 SingaporeAirlines 607 RyanairHoldings 598 WestJetAirlines 589 AllNipponAirways 5710 HainanAirlines 56
Source: TPA Study
TOP 10, ASIA-PACIFIC TOTALRANK COMPANY SCORe
1 RegionalExpressHoldings 692 AirAsia 683 AllNipponAirways 614 CebuAir 565 SingaporeAirlines 556 AirNewZealand 527 HainanAirlines 518 AirChina 519 QantasAirways 4710 GarudaIndonesia 47
Source: TPA Study
network, so it has the potential to be the best of the U.S. carriers.
In Canada, WestJet continues to rise, and is second in the mid-sized cat-egory of carriers and in the Top Five overall. Air Canada, however, is much farther back, and the advisers say it is being pressured on all sides—by West-Jet domestically, and foreign carriers in international markets.
Latin American airlines overall did not fare well in the TPA rankings. All five of the carriers from this region included in the study saw their scores fall, mostly by large margins. Despite this, Copa was still the top-ranked air-line in the mid-sized group and fourth overall.
The main problem is that Brazil’s economic woes are dragging down many carriers. Overcapacity is also a factor, as rapid airline growth outstrips demand.
This region is “down but not out,” Neidl says. “This will still be a growth region and it is going to be very impor-tant for airlines.” Copa remains strong, and Latam will be a powerful player when it has moved beyond the integra-tion process.
In Europe, the strongest performers are still the large LCCs Ryanair and EasyJet. However, the most notable improvements in this region have come from some of the smaller airlines. In many cases they are rebounding from serious slumps, thanks to restructur-ing efforts.
Of the majors, Lufthansa is trending upward as it absorbs airline acquisi-tions. Turkish Airlines is also up, and its recent expansion appears to be bearing fruit.
The other two majors, however, have slipped further into the doldrums, as their mergers—which are somewhat limited in scope—have not produced enough benefits to offset Europe’s shaky economic climate. The LCCs have also been causing the majors headaches in short-haul markets, leading them to reconsider their ap-proaches to regional and short-haul networks, Jenks says.
The European majors are also much more vulnerable to the big Middle Eastern carriers, which are taking larger shares of long-haul traffic. The legacy airlines have been hurting on the cargo side too, thanks to the competi-tion from the integrated cargo carriers and the Middle Eastern airlines, and the global downturn in the cargo mar-
ket. In contrast to a relatively optimis-tic outlook for the U.S. majors, the large European airlines face “some inherent structural difficulties,” says Terry.
The Asia-Pacific region is seeing a wide range of trends, as befits such a vast and diverse area. Some LCCs such as AirAsia continue to perform strongly. But the large Asian airlines have not shown the strength they have in past TPA studies.
As well as the familiar culprits of global economic weakness and new competition from LCCs and other long-haul connecting carriers, Asian airlines are even more exposed to the cargo slump than their European peers.
China’s slowing economic growth has also been a major factor. The Chinese carriers generally saw their scores decline in the TPA study, and other Asian airlines that are heavily re-liant on Chinese routes also took a hit.
Rapid fleet expansion and over-reli-ance on domestic traffic have become problematic for Chinese airlines due to cooling demand. However, Terry points out that although it is not meet-ing expectations, growth is going on in China. It is still an “under-served mar-ket with tremendous upside,” he says. Because of this, the large number of aircraft orders by Chinese carriers is rational in the long term.
Of the airlines that use nearby hubs to connect traffic to China, the slow-down is a cautionary lesson. “It is good to have exposure to China, but that does not mean that your future should depend on it,” Jenks says. “If you are a really good long-haul hub operator, you have a portfolio of thousands of geographically diversified connecting markets, so if some are weak, this can be offset by other strong ones.”
Singapore Airlines (SIA) is one such carrier, and it is consistently ranked among the best large airlines. Hamlin says that with SIA “we continue to see excellent execution of a quality prod-uct.” However, regarding its low-cost subsidiary Scoot, the advisers believe the jury is still out on whether it can succeed.
Cathay Pacific, meanwhile, has yet again declined. One adviser describes Cathay as being “squeezed on a lot of fronts, but its brand is what is [keep-ing] it up.”
All Nippon Airways (ANA) is once again a strong performer. Its overall ranking of ninth makes it the top ma-
jor airline that is not a low-cost carrier.Jenks says ANA is seeing gains from
its revenue-sharing agreements with partner airlines on European and U.S. routes, which began in mid-to-late 2011. Its results are also helped by the 2012 bounce-back from the demand slump related to the 2011 earthquake and tsunami. Going forward, ANA should start to see efficiency gains from its growing Boeing 787 fleet. Increased slot availability at the Tokyo airports is also providing a boost.
Of course, most of the above also ap-plies to Japan Airlines. JAL was not included in this year’s rankings—not enough data was available since the carrier was relisted in September, fol-lowing its emergence from bankruptcy. However, early data indicate that JAL would have scored very highly. There is “room for both [Japanese carriers] to do well,” says Terry. c
AW_07_01_2013_p40-46.indd 46 7/1/13 11:55 AM