TOP-DOWN VS. BOTTOM UP -...
108
WORKING T OWARDS CONSENSUS ON SYSTEMATIC PROTECTED AREAS PLANNING IN ONTARIO TOP-DOWN VS. BOTTOM UP Summary of the Parks Research Forum of Ontario (PRFO) State of the Art Protected Areas Design Workshop Guelph, ON March 9-10 2006 Editors: Yolanda F. Wiersma & Thomas D. Nudds Contributors: Kristyn Ferguson, Cathy McAllister, Leif Olson & Jennifer Shuter
Transcript of TOP-DOWN VS. BOTTOM UP -...

WORKING TOWARDS CONSENSUS ON
SYSTEMATIC PROTECTED AREAS PLANNING IN ONTARIO
TOP-DOWN VS. BOTTOM UP
Summary of the Parks Research Forum of Ontario (PRFO)
State of the Art Protected Areas Design Workshop
Guelph, ON
March 9-10 2006
Editors: Yolanda F. Wiersma &
Thomas D. Nudds
Contributors: Kristyn Ferguson, Cathy
McAllister, Leif Olson & Jennifer Shuter


Top-Down vs. Bottom Up?
Working Towards Consensus on Systematic Protected Areas Planning in Ontario
Summary of the Parks Research Forum of Ontario State of the Art Protected Areas Design Workshop
March 9-10 2006 Guelph, Ontario
Edited by:
Yolanda F. Wiersma and Thomas D. Nudds
With Contributions by: Kristyn Ferguson, Cathy McAllister, Leif Olson and Jennifer Shuter

ii | P a g e
WORKSHOP SPONSORS:
Canadian Council on Ecological Areas Parks Canada
Environment Canada Parks Research Forum of Ontario
Nature Conservancy Canada University of Guelph
Ontario Parks University of Waterloo
PUBLICATION OF PARKS RESEARCH FORUM OF ONTARIO (PRFO)
Contact:
E.S.1, Room 356, University of Waterloo
Waterloo, ON N2L 3G1
Phone: 519-888-4567 ext. 32072
Fax: 519-746-2031
Web: http://www.environment.uwaterloo.ca/research/prfo/
FRONT COVER:
Map of Ontario's National Parks, National Marine Conservation Areas, Provincial Parks and
Conservation Reserves. National Parks and National Marine Conservation Areas are shown in dark
green, Provincial Parks are shown in lighter green, and Conservation Reserves are shown in purple.
Map provided courtesy of Ontario Parks.
LIBRARY AND ARCHIVES CANADA CATALOGUING IN PUBLICATION
State of the Art Protected Areas Design Workshop (2006 : Guelph, Ont.)
Top-down vs. bottom up : working towards consensus on systematic protected areas planning in
Ontario : summary of the Parks Research Forum of Ontario (PRFO) State of the Art Protected Areas
Design Workshop, Guelph, ON, March 9-10, 2006 / editors: Yolanda F. Wiersma & Thomas D.
Nudds ; contributors: Kristyn Ferguson ... [et al].
Includes bibliographical references.
ISBN 978-0-9737544-6-9
1. Parks--Ontario--Planning--Congresses. 2. Protected areas--Ontario--Planning--Congresses.
3. Parks--Ontario--Congresses. 4. Protected areas--Ontario--Congresses. I. Wiersma, Yolanda F.
(Yolanda Francine), 1973- II. Nudds, Thomas David, 1952- III. Ferguson, Kristyn, 1982- IV. Parks
Research Forum of Ontario V. Title.
QH77.C3S695 2006 333.78'309713 C2008-905855-0
© Parks Research Forum of Ontario
SUMMARY OF THE PARKS RESEARCH FORUM OF ONTARIO (PRFO) STATE OF THE ART PROTECTED AREAS DESIGN WORKSHOP, 2006
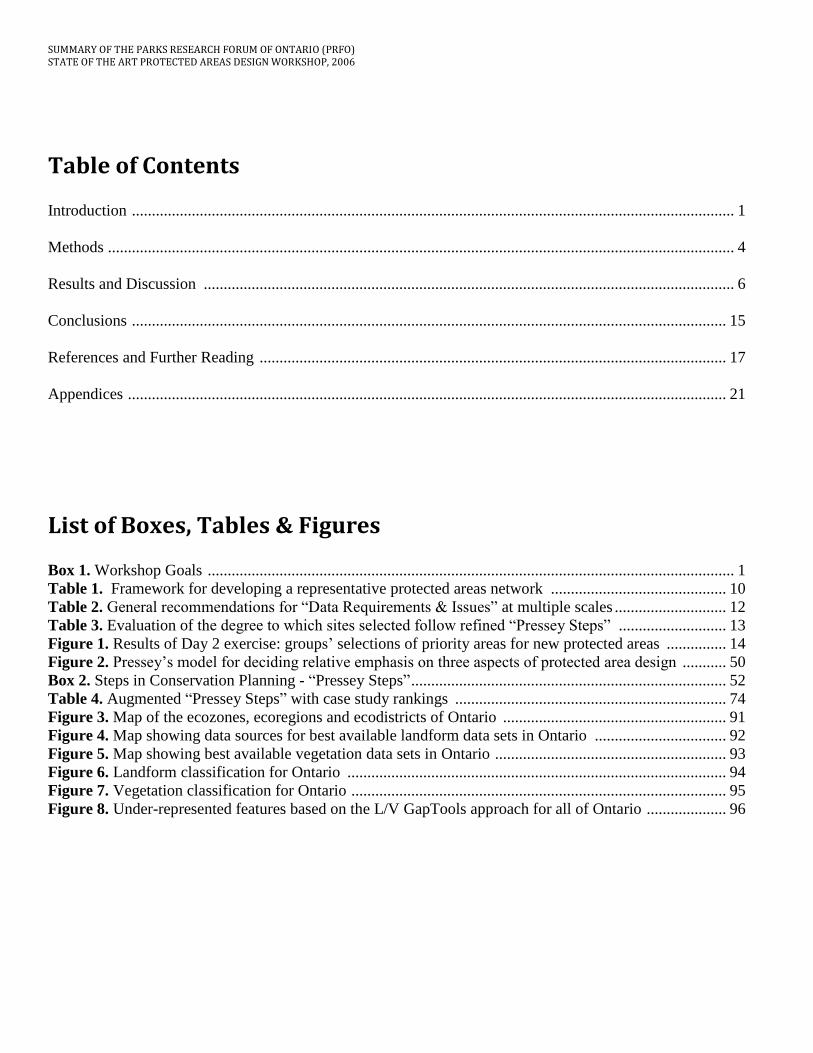
Table of Contents
Introduction ....................................................................................................................................................... 1
Methods ............................................................................................................................................................. 4
Results and Discussion ..................................................................................................................................... 6
Conclusions ..................................................................................................................................................... 15
References and Further Reading ..................................................................................................................... 17
Appendices ...................................................................................................................................................... 21
List of Boxes, Tables & Figures
Box 1. Workshop Goals .................................................................................................................................... 1
Table 1. Framework for developing a representative protected areas network ............................................ 10
Table 2. General recommendations for “Data Requirements & Issues” at multiple scales ............................ 12
Table 3. Evaluation of the degree to which sites selected follow refined “Pressey Steps” ........................... 13
Figure 1. Results of Day 2 exercise: groups‟ selections of priority areas for new protected areas ............... 14
Figure 2. Pressey‟s model for deciding relative emphasis on three aspects of protected area design ........... 50
Box 2. Steps in Conservation Planning - “Pressey Steps” ............................................................................... 52
Table 4. Augmented “Pressey Steps” with case study rankings .................................................................... 74
Figure 3. Map of the ecozones, ecoregions and ecodistricts of Ontario ........................................................ 91
Figure 4. Map showing data sources for best available landform data sets in Ontario ................................. 92
Figure 5. Map showing best available vegetation data sets in Ontario .......................................................... 93
Figure 6. Landform classification for Ontario ............................................................................................... 94
Figure 7. Vegetation classification for Ontario .............................................................................................. 95
Figure 8. Under-represented features based on the L/V GapTools approach for all of Ontario .................... 96

UMMARY OF THE PARKS RESEARCH FORUM OF ONTARIO (PRFO)
STATE OF THE ART PROTECTED AREAS DESIGN WORKSHOP, 2006
TOP-DOWN VS. BOTTOM UP? WORKING TOWARDS CONSENSUS ON SYSTEMATIC PROTECTED AREAS PLANNING IN ONTARIO
Appendices
Appendix A: Profile Reports for Case Studies ...................................................................................21
Appendix B: List of Participants ........................................................................................................45
Appendix C: Summary of Keynote Presentation
Leif Olson .........................................................................................................................................49
Appendix D: Summary of Case Study Presented by Kingston and Boan
Leif Olson .........................................................................................................................................54
Appendix E: Summary of Four Case Study Presentations
Leif Olson .........................................................................................................................................57
Appendix F: Summary of Day 1 Commentaries
Leif Olson .........................................................................................................................................67
Appendix G: Summary of Day 1 Panel Discussion
Leif Olson .........................................................................................................................................71
Appendix H: Augmented “Pressey Steps” with Case Study Rankings ...............................................74
Appendix I: Summary of Day 2 Morning Breakout Sessions
Jennifer Shuter, Kristyn Ferguson, Cathy McAllister ......................................................................76
Appendix J: Summary of Presentation by Crins and Davis
Yolanda Wiersma .............................................................................................................................89
Appendix K: Summary of Day 2 Afternoon Breakout Session
Jennifer Shuter, Kristyn Ferguson, Cathy McAllister ......................................................................97
Appendix L: Workshop Program .................................................................................................... 101
SUMMARY OF THE PARKS RESEARCH FORUM OF ONTARIO (PRFO) STATE OF THE ART PROTECTED AREAS DESIGN WORKSHOP, 2006
1 | P a g e
Introduction
The purpose of the Parks Research Form of Ontario (PRFO) is to promote and facilitate parks and
protected areas research (PRFO 2008). Previous State of the Art workshops hosted by PRFO focused on
research relevant to monitoring and climate change. This, the third “State of the Art workshop”,
examines research regarding how to best plan for representative protected areas.
The development and application of conservation science for planning and managing protected areas has
spurred interest and activities in many jurisdictions worldwide. Across Canada, government agencies,
non-government organizations (NGOs), and university-based scientists, among others, are involved in
the development of scientific approaches for selecting and designing networks of protected areas. The
purpose of this PRFO State of the Art workshop was to conduct “research on research”. Workshop
participants examined the range of scientific approaches to protected areas design and planning in
Ontario (and elsewhere), and whether and to what extent there were commonalities in protected areas
planning processes and products. A set of “best practices” was jointly developed, and a mock planning
experiment conducted with four replicated groups of workshop participants, to examine the relative
emphasis that researchers and planners currently put on different aspects of planning for networks of
protected areas.
A workshop such as this, focused on research relevant to protected areas design, was highly relevant
given the changing nature of protected areas. Early (pre-1900) parks in North America, such as Banff
and Yellowstone were established largely for their scenic and tourism values, and were essentially
islands of civilization in a sea of wilderness (Sellars 1997). In one sense, this early era of protected area
Box 1. Workshop Goals
1. To document and report on scientific approaches related to design of protected
areas and protected areas networks.
2. To identify congruencies and complementarities among the various research
approaches.
3. To identify priority areas for implementation of protected areas based on
consensus among organizations, agencies and research methods.
4. To work toward consensus on best practices for design of protected areas and
protected areas networks.
5. To identify opportunities for collaboration on future research.
6. To strengthen communication and transfer of research in this area; including
technical information, data, and understanding among involved players and
key clients.

TOP-DOWN VS. BOTTOM UP? WORKING TOWARDS CONSENSUS ON SYSTEMATIC PROTECTED AREAS PLANNING IN ONTARIO
2 | P a g e
design might be described as the “age of default” (Nudds and Wiersma 2004), when park selection,
based on scenery and other natural attributes, largely defaulted to areas of the country not otherwise
productive for agriculture, settlement or timber. Despite the fact that new national parks are sited in
accordance with a national parks plan (Parks Canada 1997), such “design by default” still seems to be
manifested in the relative ease with which remote northern parks, (sometimes dubbed “rock and ice”
parks), are able to be added to the system, compared to parks at southern latitudes.
As awareness grew about global biodiversity conservation, emphasis shifted to priorities for parks as
areas that would conserve biodiversity. As human changes on the North American landscape increased,
parks were instead perceived as islands of wilderness in a sea of civilization (e.g., Noss 1992). These
events heralded an “age of desperation” (Nudds and Wiersma 2004) with respect to acquisition of
protected areas as, understandably, in the face of competing land uses, planning emphasized saving the
“best of the last” landscapes within protected areas as quickly as possible. The planning process at this
time might be characterized as driven by consultation with, and expert opinion among, various interest
groups (environmental non-government organizations, communities, scientists, government agencies), in
a “bottom-up” approach to protected areas planning. Systematic conservation planning was in very early
stages and manifested through programs like the International Biological Program (IBP), which tried to
develop a systematic approach to mapping and documenting global biodiversity (Smith 1968). Although
the IBP led to the acquisition of “Areas of Natural and Scientific Interest” (ANSIs) in Ontario (Falls et
al. 1990), the “age of desperation” lacked a coherent, large-scale focus that integrated planning from the
“top-down” to ensure representation and persistence of biodiversity features across large regions (Nudds
and Wiersma 2004).
During the “age of desperation”, the focus was principally on “representation”, that is, setting aside
areas that were representative of regional biodiversity. For example, in Ontario, programs such as
Nature‟s Best Action Plan (Crins and Kor 2000; Nudds et al. 1998), “Lands for Life”, and “Ontario‟s
Living Legacy” (Riley 1998; OMNR 1999) attempted to represent 12% of the province‟s biodiversity in
a suite of provincial parks and conservation reserves. However, in the rush to “collect” representative
examples of biodiversity features, sites that were set aside as protected areas were not necessarily
sufficient to ensure that the biodiversity features within them would persist over the long term (Rothley
2006). This realization, coupled with opportunities provided by widespread availability of high-powered
computers and digital databases, spurred the present “age of design” (Nudds and Wiersma 2004), which
integrates field and remotely-sensed data with GIS-based modeling. This shifted the emphasis towards
large-sale, top-down planning to ensure the persistence of what is represented in protected areas
networks. For example, in Ontario, the minimum reserve area (MRA) that might allow for the
persistence of intact assemblages of terrestrial mammals was estimated by Gurd et al. (2001). In “top-
down” fashion, Wiersma and Nudds (2006) subsequently estimated how many MRA-sized protected
areas would be needed to represent mammalian diversity across Canada.
However, many parties are involved in protected areas selection in different ways, and there are a
variety of approaches and techniques. These include the use of heuristic algorithms, or techniques such
as aggregate scoring, or simulated annealing. The literature traces the development of such techniques,
as well as the development of „off-the-shelf‟ software packages (e.g., C-PLAN, SITES, MARXAN).
The goal of all of these tools and techniques is to efficiently select sites that are representative of a
greater whole, but the tools vary in their data requirements, built-in assumptions, flexibility, and ease of
application (see Vanderkam et al. 2007 for a summary). As well, real-world planning exercises vary in

SUMMARY OF THE PARKS RESEARCH FORUM OF ONTARIO (PRFO) STATE OF THE ART PROTECTED AREAS DESIGN WORKSHOP, 2006
3 | P a g e
their emphases on “bottom-up” vs. “top-down” approaches. Specifically in Ontario, different
stakeholder groups, agencies and other researchers have used different tools and techniques to identify
representative protected areas in Ontario.
The focus of this workshop was to contrast benefits and limitations across this range of tools, and to
identify whether and to what extent planning products converge between “top-down” and “bottom-up”
approaches. Through the identification of areas of convergence, we hoped to increase confidence in the
robustness of the various approaches to select sites for protection that would simultaneously represent
and conserve biodiversity. Where there was divergence in the sites selected under different scenarios,
we hoped to identify areas for productive future research.

TOP-DOWN VS. BOTTOM UP? WORKING TOWARDS CONSENSUS ON SYSTEMATIC PROTECTED AREAS PLANNING IN ONTARIO
4 | P a g e
Methods
The organization for the PRFO Protected Areas Design Workshop began in May 2005, at the PRFO
annual general meeting at the University of Guelph. A workshop steering committee was formed,
consisting of Rob Davis (OMNR), Tom Beechey (Nature Matters), Marc Johnson (Environment
Canada), Tom Nudds (University of Guelph), Bill Stephenson (Parks Canada) and Paul Zorn (Parks
Canada). Tom Nudds was appointed workshop chair, and the steering committee contracted Yolanda
Wiersma (University of Guelph) as workshop coordinator. Steve Murphy (University of Waterloo) acted
as a facilitator between the workshop steering committee and the PRFO office.
The steering committee was mindful of PRFO‟s role to advocate for research in and about parks and
protected areas. To fulfill the mandate to conduct “research about research”, the workshop committee
identified key participants who could address first-hand their own research on protected areas design in
particular parts of Ontario. Case studies were selected that exemplified different aspects of protected
areas design (e.g., at small vs. large spatial extents; with different biodiversity targets; and/or in intact
vs. fragmented landscapes). Speakers were invited in late November 2005, and each of the case study
speakers was asked to provide a detailed profile (see Appendix A), which was then provided to two
invited commentators. To keep numbers manageable, workshop participants were restricted to
individuals who were involved in some kind of work on representative protected areas design, be it in
academia, provincial or federal government, a stakeholder group, or as a private consultant. About 40
participants attended the workshop (Appendix B). Five graduate students volunteered as note takers for
the workshop. Their notes formed the basis of the various summaries appended to this report.
The workshop was held over two days in March 2006. Tom Nudds introduced the workshop topic and
the goals for the two days. Dr. Robert L. Pressey followed with a keynote address that highlighted eight
principles, or steps (referred to as “Pressey Steps” in this document), for planning protected areas (see
Appendix C). Subsequently, Steve Kingston and Julee Boan presented work using C-PLAN to develop
goals for representative protected areas in northwestern Ontario (Appendix D). The afternoon of day 1
featured four more case study presentations (Appendix E), each of which exemplified different aspects
of the issue of representative protected areas design, and highlighted different tools and data sets. Day 1
concluded with commentaries by Paul Zorn (Parks Canada) and Kris Rothley (Simon Fraser University)
(Appendix F), and a panel discussion (Appendix G).
On day 2, Tom Nudds reminded the group that two of the goals of the workshop were to identify
potential congruencies among processes and products, with respect to the projects being conducted in
Ontario and other parts of Canada. Participants were presented with a version of Pressey‟s eight steps in
representative protected areas design, as augmented by Wiersma and Nudds the previous evening based
on information collected from discussions the previous day (see Appendix H). Participants were divided
into four breakout groups, and asked to evaluate the expanded “Pressey Steps” and discuss whether
elements should be added, deleted or rearranged (Appendix I). As well, Wiersma and Nudds scored the
case studies from the previous day against the “Pressey Steps” (Appendix H), and participants were
asked to decide whether they agreed with the rankings.
The afternoon of day 2 began with Bill Crins and Rob Davis‟ overview and retrospective on the Ontario
Ministry of Natural Resources (OMNR)‟s approach to gap analysis, entitled “OMNR‟s Gap Analysis
Approach: 10 Years Later” (see Appendix J). This was followed by a short GIS demonstration of how

SUMMARY OF THE PARKS RESEARCH FORUM OF ONTARIO (PRFO) STATE OF THE ART PROTECTED AREAS DESIGN WORKSHOP, 2006
5 | P a g e
well the results of the Ontario case studies overlapped with each other. Participants then returned to
breakout groups to select up to 10 sites anywhere in Ontario they felt would contribute to representation
and persistence. The groups were instructed to make reference to the studies presented and to the
“Pressey Steps” in justifying their selection. It was emphasized that the rationale for site selection was as
important (if not more so) than the actual site selection itself. Groups presented their results in plenary,
and the workshop concluded with closing comments from Tom Nudds.
Subsequently, notes from discussions by the various breakout groups, describing the rationale for each
group‟s selection of future protected areas, were summarized (see Appendix K). Unfortunately, one
group did not complete the site-selection exercise, resulting in three replicate, mock “planning groups”.
These notes formed the database by which each breakout group was scored with respect to the extent
that the “Pressey Steps” were followed in the selection of 10 priorities for new protected areas in
Ontario (see Results). From these scorings, we identified key areas where, after significant and intense
exposure to state-of-the-art design principles over 1.5 days, our samples of protected areas researchers
and practitioners did and did not show evidence that the state-of-the-art principles were incorporated
into their deliberations.
This mock planning exercise was to address Goal 3 of the workshop: to identify priority areas for
implementation of protected areas (see Box 1). Realistically, however, participants were not expected to
draw up a definitive plan for Ontario in the space of an afternoon with no more than pens and acetate
maps. Clearly, a comprehensive planning exercise would incorporate a large volume of data on the
distribution of biodiversity in the province. Instead, rather than emphasize the products of the exercise,
i.e., which areas were chosen, the experiment was designed to elucidate the rationale that participants
used with respect to why and how sites were selected.

TOP-DOWN VS. BOTTOM UP? WORKING TOWARDS CONSENSUS ON SYSTEMATIC PROTECTED AREAS PLANNING IN ONTARIO
6 | P a g e
Results and Discussion
Workshop participants were provided with a full day of presentations by the keynote speaker and others
presenting case studies, all of which are summarized in Appendices C to E. These presentations,
together with commentaries (Appendix F) and a panel discussion (Appendix G) formed the basis for
breakout discussions on day 2.
Day 1 presentations indicated that researchers from a range of backgrounds – academia, government,
and environmental non-government organizations (ENGOs) – were actively engaged in systematic
protected areas planning. Work conducted by ENGOs appeared to be more focused on smaller (but still
quite extensive) regions than work conducted by academic researchers. Both World Wildlife Fund
Canada and the Nature Conservancy of Canada identified priority areas for protected areas planning in
specifically-defined regions (northeastern Ontario, and the Great Lakes Basin, respectively), and with
active engagement with partners (forest industry, private land owners). In contrast, academic researchers
such as Pressey, and Wiersma and Nudds, conducted research across larger regions (Australia and South
Africa, and most of Canada, respectively). The “focal” elements to be represented in each of the
research projects varied; Boan and Kingston used the OMNR‟s Landform-Vegetation (L/V) data set,
Wiersma and Nudds used disturbance-sensitive mammals, Pressey used a range of species and landform
data sets, Iacobelli and Anderson used enduring features and assessments of high conservation value
forests, and Brodribb and Kraus used assessments of coarse (landform-vegetation types) and fine-filter
(species and communities) biodiversity.
Tools for planning varied as well. Wiersma and Nudds used simple greedy heuristic algorithms, while
Crins and Davis used an MNR-developed tool called GapTool. C-PLAN was the most commonly
applied tool and was used by Pressey, Kingston and Boan, and Brodribb and Kraus, to quantify
irreplaceability. Brodribb and Kraus also made use of customized GIS models for gap analysis of
coarse-filter biodiversity. Similarly, Iacobelli and Anderson used customized software. Thus, we found
that while the general concept of systematic planning for representative protected areas was a common
goal of all the case studies, there was a great deal of variation in how this could be achieved.
There was considerable discussion on both days about the issues of representation and the importance of
meeting goals for species persistence. However, only Pressey‟s and Wiersma and Nudds‟ presentations
explicitly addressed issues of persistence and representation simultaneously. Pressey further emphasized
the importance of considering the dynamic nature of both the ecosystems to be represented/conserved
and the political sphere in which planning takes place. Clearly, one of the main directives for future
research on systematic protected areas planning in Ontario (and elsewhere) should focus on
incorporating persistence goals and dynamic contexts together with representation goals.
Given the wide range of tools, data sets, and target areas for research, it is perhaps not too surprising that
there was little congruence among sites selected within Ontario by the different research groups. At the
outset of the workshop, it was not clear that, while there might likely be differences in methods among
the case studies, these would necessarily result in incongruencies amongst planning products.
Congruency would indicate an increased level of confidence in the suitability of sites selected,
regardless of the method used to identify them (and might assuage critiques of sceptics of systematic
protected areas planning). However, different methods used by the different research groups resulted, by
and large, in very different areas of the province being identified as priorities for the establishment of

SUMMARY OF THE PARKS RESEARCH FORUM OF ONTARIO (PRFO) STATE OF THE ART PROTECTED AREAS DESIGN WORKSHOP, 2006
7 | P a g e
new protected areas. Thus, by the nature of the constraint that Ontario, apparently serendipitously, has
been “divided up” among the various groups planning and advocating for protected areas, we were
unable to achieve the workshop objective to assess the extent to which “bottom-up” and “top-down”
methods yield similar results.
Regardless, the morning of day 2 focused on contrasts among methods/approaches to systematic
protected areas planning, that is, the processes as opposed to the products. Methods and data sources to
which participants were exposed on day 1 were the foci of breakout groups (Appendix I) assigned the
task of refining the “Pressey Steps” as augmented by Wiersma and Nudds (Appendix H). Groups
identified further specific data requirements and issues that they felt needed to be addressed to carry out
the “Pressey Steps” effectively. The aggregated results from the morning breakout groups are presented
in Tables 1 and 2.
In the afternoon, groups were asked to identify ten priority sites for protection anywhere in Ontario,
integrating all the information received from the case studies, including OMNR‟s L/V approach. More
importantly, groups were specifically tasked to make reference to the refined “Pressey Steps” as
generated by the participants in their rationalization of each site chosen. The sites chosen are shown in
Figure 1 and a brief rationale for each is presented in Appendix K. Table 3 summarizes our evaluation of
the degree to which these rationales made reference to the “Pressey Steps”. Scores reflect the number of
sites chosen by each group where reference was made to that “Pressey Step” in the rationale. For
anonymity, group numbers do not correspond between Appendix K and Table 3, and are not identified
in Figure 1.
Following two days of intensive discussion on processes for selecting protected areas, and the
development of a detailed framework (the “Pressey Steps”), the breakout groups might have chosen
similar protected areas using similar criteria. However, participants were not given any data to assist
with decision-making, so variation in the “data” stored as knowledge around each table might have
yielded variation in which sites were selected in the mock-planning exercise. Regardless of the products
(sites selected among groups), given the emphasis over a day and a half discussion on process,
congruencies among groups might have been expected with respect to processes (how and why sites
were selected).
Overlays of sites chosen by the three groups showed quite a number of congruencies in the areas of
Ontario identified as priorities. Two of the three groups identified the area south of Algonquin Park as
an important area to be conserved. These same two groups also thought the Spanish River area, the Lake
Superior coast between Pukaskwa National Park and Lake Superior Provincial Park, and the Lake
Nipigon Basin were also important areas. All three groups identified areas in the vicinity of Woodland
Caribou Provincial Park (along the Manitoba border) and in the Albany-Attawapiskat-Moose Rivers
area along James Bay. However, there were also disparities in terms of the areas identified by breakout
groups. For example, only one group identified the Lake of the Woods area as important, and only one
other group felt that the area east of Opasquia Provincial Park (northwestern Ontario) should be a high
priority area. Disparities almost certainly reflect different degrees of knowledge about specific regions
of Ontario within each of the three groups. There was also a very strong bias towards identifying
potential areas in the northern part of the province. While participants were not instructed to focus on
northern Ontario (in fact, they were asked to consider potential areas anywhere in the province), with the
exception of the two groups that identified an area south of Algonquin, all sites were north of the French

TOP-DOWN VS. BOTTOM UP? WORKING TOWARDS CONSENSUS ON SYSTEMATIC PROTECTED AREAS PLANNING IN ONTARIO
8 | P a g e
River. This may reflect participants‟ awareness of the Northern Boreal Initiative (NBI) that was
underway in Ontario at the time of the workshop. The NBI has drawn a great deal of political and
research attention to land use planning north of the “Area of Undertaking”1 (approximately the 51
st
parallel). The northern bias may also reflect an implicit understanding amongst workshop participants
that it will be more feasible to establish protected areas in northern Ontario on public land than in
southern Ontario on private land (which has also been subject to a higher degree of anthropogenic
change). It may also be due to the fact that three of the presentations (Kingston and Boan, Iacobelli and
Anderson, and Crins and Davis) emphasized planning in northern Ontario.
Keeping with the spirit of the workshop, to focus on “research on research”, the various rationale for
selecting particular sites was inferred from the summaries supplied by the groups, and compared against
the augmented “Pressey Steps” developed during day 1 (Table 3). Of course, real-world planning may
involve several years of discussion and research to select a single area. Given that the breakout exercises
asked participants to “plan” ten sites in the space of an hour or so, with no extraneous data other than the
knowledge that participants brought to the table, it is not surprising that not all of the “Pressey Steps”
(especially Steps 7 to 9) were explicitly addressed in the site selection process. Still, a number of sites
were selected where few or none of the “Pressey Steps” were explicitly addressed, particularly those
steps and directives that had been the focus of quite a bit of discussion on day 1.
Two groups considered scoping and costing (and then for only five sites in total), the very first step
identified by Pressey. The bias toward identification of potential sites in northern Ontario on Crown land
may have suggested implicitly some a priori scoping and costing with respect to political feasibility
when compared to southern Ontario; however this was rarely explicitly stated in the rationale for
individual sites. Again, time limitations may have precluded thorough documentation of rationale for
each site selection.
One group mentioned stakeholders (Step 2) that could be involved in (and presumably facilitate) the
establishment of five sites. This might reflect the artificial nature of the mock planning exercise in that
participants may not have relationships with potential stakeholders in the relevant regions of Ontario, or
may not have felt comfortable speaking for existing partners/stakeholders in the breakout sessions.
Very few of the rationales for individual sites made mention of how the site addressed a specific goal
(Step 3), and only one group included discussion of the data that existed and/or would need to be
compiled to verify the majority of their proposed sites (Step 4). The latter is somewhat surprising given
the vast amount of Ontario-based knowledge about protected areas that was present at each table.
However, participants may have assumed that everyone knew what data exist, and what data are needed,
and not had sufficient time to provide detailed information on data needs in the space allowed for the
exercise. While the mock-planning exercise did not provide participants with information about existing
data sources, we expected that those at the table would collectively have good knowledge of the data
available. Although everyone in the room had been exposed to a sample of the data available via the
Ontario-based case studies, no group mentioned potential limitations of the data used for any of the case
studies (even though some used the mapped results of the case studies as part of their rationale for site
selection).
1 The “Area of Undertaking” refers to the area covered by the Class Environmental Assessment for Timber Management.

SUMMARY OF THE PARKS RESEARCH FORUM OF ONTARIO (PRFO) STATE OF THE ART PROTECTED AREAS DESIGN WORKSHOP, 2006
9 | P a g e
Many of the sites recommended (Step 5) by the groups were based solely on representation criteria, and
these were expressed generally, and not in terms of overall percentage and/or numerical targets. The
lack of reference to a minimum representation target may be due to the fact that participants were
working outside of any agency frameworks, which generally specify minimum targets. Or, it may reflect
the fact that very few groups appear to have had extensive discussions about goals (Step 3). Where
persistence targets were considered, the majority of these (with the exception of eight sites selected by
one group) were expressed in qualitative terms instead of quantitative terms, despite that discussions
throughout the two days emphasized the need to move beyond representation to persistence and to
explicitly consider minimum area requirements as part of the planning process. Two groups assessed
existing protected areas (Step 6) as part of their rationale for new protected areas, but only for five and
three of their proposed sites.
None of the groups addressed Steps 7 to 10, which is not surprising, since these generally deal with
implementation of real-world plans, something that could not be replicated in an afternoon‟s “mock
planning” exercise. Of greater significance, most of the groups bypassed Steps 1 to 4 in stating their
rationale for site selection. These steps require more expertise in social science, planning, economics,
and policy, while criteria in Step 5, where ecological knowledge is more relevant, were the most
commonly cited in the rationales for site selection. Thus, the results of the mock planning exercise may
indicate that participants have mainly interests and strengths in ecology and natural history, whereas
strengths also in social science, planning, economics, and policy are required for successful planning.
It also appears that the concept of planning ahead (establishment of goals, targets, monitoring plans,
timelines) is a potential weakness, as very few groups appeared to focus on these issues, even though all
are elements in the “Pressey Steps”. However, many of the groups who were represented at the tables
(e.g., World Wildlife Fund Canada, Ontario Parks, Nature Conservancy of Canada) do explicitly
incorporate economic and policy issues into their planning activities. Given that the scientific
representatives (and not the social/policy experts) from these organizations were at the workshop, these
strengths might not have been as well represented in the mock planning exercise as they might have
been in a real-world, comprehensive planning exercise conducted over a longer time period and with
widespread consultation and research.

TOP-DOWN VS. BOTTOM UP? WORKING TOWARDS CONSENSUS ON SYSTEMATIC PROTECTED AREAS PLANNING IN ONTARIO
10 | P a g e
Table 1. Framework for developing a representative protected areas network. Group recommendations
for “Steps”, “Directives” and “Data Requirements” were focused primarily on a single example of
protected areas planning: protected areas planning for the intact landscape in Northern Ontario
(“Northern Boreal Initiative” planning area).
PRESSEY STEPS DIRECTIVES
(ADDITIONAL
ELEMENTS) DATA/KNOWLEDGE REQUIREMENTS*
1. Scoping & costing Develop & begin
implementing a
“Communications Plan”
for communicating with
politicians, First Nations,
stakeholders
Communications = crucial
throughout process
Social science-based knowledge
Institutional arrangements
Attention to appropriate language for effectively communicating
with different groups
2. Involve
stakeholders
Early engagement of First
Nations and stakeholders
(at preliminary stages and
throughout the process)
Set up regular consultation
with stakeholders
Fine scale data collection, recording of local knowledge
Identify expertise gaps
3. Identify goals "Non-Protected" Areas
(other tools)
Acknowledge
assumptions and
limitations
Include optimal goals in
addition to minimums
Develop monitoring plans
Scale commensurability
Identification of “focal
species”
Obtain data regarding: Matrix, Connectivity & Buffers
Include the identification of excluded areas and conflicts
Consider potential focal, indicator and umbrella species
Incorporate other conservation tools into goal development and
planning process
4. Compile data Internal Adaptive
Management Feedback
Loops
Identify knowledge gaps
Conduct data
verification/quantify
uncertainty
Identification of “focal
species”
Need to implement and acknowledge existence of Adaptive
Management Feedback Loops within Step 4 (e.g. data assessment
prior to modeling)
Choose focal, indicator and umbrella species based on ecological
appropriateness and data availability and quality
Integrate data based on traditional knowledge, cultural values, and
overlapping interests

SUMMARY OF THE PARKS RESEARCH FORUM OF ONTARIO (PRFO) STATE OF THE ART PROTECTED AREAS DESIGN WORKSHOP, 2006
11 | P a g e
5. Set conservation
targets
Internal Adaptive
Management Feedback
Loops
Identify “special
elements”
Engage in matrix
management
Need to implement and acknowledge existence of Adaptive
Management Feedback Loops within this stage for example:
Model assessment & judgment
Target sensitivity (evaluate & present)
Multiple models (model evaluation process)
Informing vs. modelled layers
Include data on resilience in addition to persistence
Collect data on threats and vulnerabilities
6. Assess existing
conservation areas
Implement multiple model
runs and assess variation
in results
Terminology change:
"Protected Areas”, not
"Conservation Areas"
(more appropriate for
Ontario context)
Identify & acknowledge model agreement/disagreement using
varying data, targets, methods
7. Select new areas Select "Non-Protected"
Areas (parks)
Identify & implement decision-support tools to evaluate securement
opportunities
Consider matrix
Active First Nations & Stakeholder involvement
8. Implement
conservation action
Recognition of the
“messiness”/difficulty
associated w/ this process
Consider threats and
vulnerabilities
Acknowledge that
planning process may
modify science-based
recommendations
9. Maintain &
monitor
Plan for monitoring
should be developed in
Step 3
Ground truthing
Assess performance indicators
10. Pool and share
data
Make data and
methodology transparent
and widely available
* Although some specific “Data Requirements” were identified in relation to specific directives, general “Data
Requirements” were also identified for a hierarchy of spatial scales and/or jurisdictional contexts. These “General Data
Requirements & Issues” are listed in Table 2.

TOP-DOWN VS. BOTTOM UP? WORKING TOWARDS CONSENSUS ON SYSTEMATIC PROTECTED AREAS PLANNING IN ONTARIO
12 | P a g e
Table 2. General recommendations for “Data Requirements & Issues” at multiple spatial scales and/or
jurisdictional contexts.
SCALE DATA REQUIREMENTS & ISSUES
1. Fine scale
Local knowledge
Identify & implement decision-support tools to evaluate securement
opportunities
Include data from all diversity levels (e.g., genetic, species,
community, ecosystem)
Include biotic (e.g., vegetation types, species) and abiotic data (e.g.
landforms)
2. Boreal-specific
“Reverse matrix”, importance of size & matrix (disturbance
regimes)
Integrate scientific and traditional knowledge and management
approaches
3. Ontario-specific
“Intact boreal”, “Allocated boreal” & “Southern Ontario” planning
contexts = fundamentally different in terms of institutional
arrangements, data availability & requirements, threats to
biodiversity
General political and public support for protected areas
Integrate private land stewardship
4. Federal context
Detailed census data from Statistics Canada, facilitate data
integration & access

SUMMARY OF THE PARKS RESEARCH FORUM OF ONTARIO (PRFO) STATE OF THE ART PROTECTED AREAS DESIGN WORKSHOP, 2006
13 | P a g e
Table 3. Evaluation of the degree to which sites selected by breakout groups followed the criteria
outlined in the refined “Pressey Steps” (presented in Appendix H together with rankings of the real-
world case studies). Descriptions of sites and rationale are in Appendix K. For anonymity, group
numbers do not correspond between Appendix K and Table 3, and are not identified in Figure 1. Scores
reflect the number of sites chosen where the rationale for the inclusion of that site made reference to one
of the Pressey Steps.
AUGMENTED “PRESSEY STEPS” GROUP 1 GROUP 2 GROUP 3
1. Scoping and costing
2. Involve Stakeholders
a) identify excluded areas/conflicts
b) scale commensurability
3. Identify Goals
a) matrix management
4. Compile Data
a) uncertainty in data
b) assumptions
i) biodiversity pattern (representation) surrogates
- ecotones
ii) biodiversity (persistence) process surrogates
iii) EG&S surrogates
c) mapped biodiversity elements
5. Set Conservation Targets
a) Representation
i) %
ii) numbers
b) Persistence
i) qualitative
size
shape
connectivity
replication
climate change
fitness-based (λ)
metapopulation
focal (umbrella, indicator, keystone, etc.)
ii) quantitative
size
shape
proximity
connectivity
replication
alignment
climate change
fitness-based (λ)
metapopulation
focal (umbrella, indicator, keystone, etc.)
6. Assess Existing Conservation Areas 7. Select New Areas 8. Implement Conservation Action
a) Retention
b) Tradeoffs
9. Maintain and Monitor
a) active/passive adaptive management

TOP-DOWN VS. BOTTOM UP? WORKING TOWARDS CONSENSUS ON SYSTEMATIC PROTECTED AREAS PLANNING IN ONTARIO
14 | P a g e
Figure 1. Results of Day 2 afternoon breakout exercise. Map showing general location of sites selected
by three different groups as priority areas for the establishment of new protected areas in Ontario. The
three groups‟ selections are represented by dark green polygons, light green squares, and brown circles.
Existing protected areas are shown as light brown polygons.

SUMMARY OF THE PARKS RESEARCH FORUM OF ONTARIO (PRFO) STATE OF THE ART PROTECTED AREAS DESIGN WORKSHOP, 2006
15 | P a g e
Conclusions
The workshop illustrated that many agencies and researchers are applying scientific approaches to the
design of protected areas. The workshop provided a forum for researchers to hear about each others‟
methods, data sources and results. While we set a goal to identify congruencies and complementarities
among the various methods for engaging in systematic protected areas design, different groups in
Ontario varied quite dramatically in their approaches, data sets, and tools used. A number of the case
studies used in-house software for all or part of the analysis. While certain projects and datasets might
require customized software and GIS models to complete the analysis, without widespread sharing of
these tools (via share-ware or open-source publishing), there is a high risk of individual groups
“reinventing the wheel” and wasting valuable research time, energy, and funds to develop tools that may
already exist. As well, inconsistencies in tools and methods make it difficult for planning projects to be
reproduced by other research groups (reproducibility being the gold standard for scientific defensibility
in an experimental context) to verify results. Additionally, the variety of tools and data sets applied to
the various planning exercises may lead sceptics to conclude that systematic protected areas planning
using explicit design principles can be almost anything, leading to lack of confidence and
underinvestment. We encourage researchers to share their tools and techniques more widely, and hope
that this workshop facilitated an increased level of communication amongst protected areas researchers
involved in systematic conservation planning.
An additional goal of the workshop was to identify priority areas for implementation of protected areas,
based on consensus among organizations, agencies and research methods. The priority areas for
protection as identified in the workshop case studies showed relatively little overlap. This is due, in large
part, to differences in the way research activities and target regions in Ontario were divided up amongst
the case studies (e.g., NCC focused its analysis on the Great Lakes basin, while WWFC focused strictly
within northeastern Ontario). Only Crins and Davis‟ and Wiersma and Nudds‟ cases encompassed all of
Ontario. However, there was also little overlap in the products between these latter two projects, which
might have been due to the different biodiversity surrogates used (landform-vegetation associations vs.
disturbance-sensitive mammals) or the methodologies used (GapTool vs. persistence-based targets and
greedy-heuristic algorithms), or the scale of analysis. Such discrepancies are problematic when
presenting protected areas plans to politicians and decision makers who may view us as a homogeneous
group of “protected areas researchers”.
It is difficult to evaluate how well the workshop was able to achieve the goal of working toward
consensus on best practices. The structure of the breakout groups was intended to facilitate general
consensus, but consensus within and between breakout groups was never formally assessed.
Congruencies in priority areas that emerged out of the mock-planning exercise (Figure 1) were
encouraging. However, the rationales for site selection remained dominated by emphasis on
representation, and less of persistence. That is, sites were often selected because of presence of
rare/unique species or landform features, and with little consideration of all of the “Pressey Steps”
necessary to encourage persistence of what is represented. Given that workshop participants contributed
to the elaboration of the “Pressey Steps”, we hope that the resulting design principles captured by this
workshop find wider application in the real world of protected areas planning and implementation.
Overall, the workshop objective to conduct “research on research” was met. Feedback from participants
after the workshop was very positive, with many commenting that it was one of the most useful and

TOP-DOWN VS. BOTTOM UP? WORKING TOWARDS CONSENSUS ON SYSTEMATIC PROTECTED AREAS PLANNING IN ONTARIO
16 | P a g e
interesting workshops they had attended. The presentations and breakout discussions gave researchers
and practitioners an opportunity for in-depth discussion and sharing of ideas germane to protected areas
planning in Ontario. Despite the focus on Ontario-based issues, participants from outside Ontario
(including the keynote speaker) commented that the workshop had given them much food for thought.
We hope that the discussions generated over the two-day process allowed for networking that might
enable more collaborative research efforts in the future. As well, it is hoped that this workshop summary
will strengthen communication on protected areas planning research among interested parties. Perhaps
some future State of the Art PRFO workshop will highlight successes in research and the establishment
of protected areas that address both persistence and representation to ensure biodiversity conservation
across Ontario.

SUMMARY OF THE PARKS RESEARCH FORUM OF ONTARIO (PRFO) STATE OF THE ART PROTECTED AREAS DESIGN WORKSHOP, 2006
17 | P a g e
References and Further Reading
Ball, I.R. and H.P. Possingham. 2000. Marxan version 1.8.3. Available at:
<http://www.ecology.uq.edu.au/marxan.htm>. Accessed 2008 September 26.
Banfield, A.W.F. 1974. The Mammals of Canada. University of Toronto Press: Toronto, Ontario.
438 pp.
Box, G.E.P. 1976. Science and statistics. Journal of the American Statistical Association 71:791-799.
Cohon, J.L. 1978. Multiobjective Programming and Planning. Academic Press: New York, New York,
USA. 333 pp.
Crins, W.J. and P.S.G. Kor. 2000. Natural heritage gap analysis methodologies used by the Ontario
Ministry of Natural Resources. Version 2.0. Open File Natural Heritage Technical Report 2000-
1. Ontario Ministry of Natural Resources: Peterborough, Ontario.
Crins, W.J. and P.W.C. Uhlig. 2000. Ecoregions of Ontario: modifications to Angus Hills‟ site regions
and districts: revisions and rationale. Ontario Ministry of Natural Resources. Draft Report. 7 pp.
+ figure and table.
Cumming, S. and P. Vernier. 2002. Statistical models of landscape pattern metrics, with applications to
regional scale dynamic forest simulations. Landscape Ecology 17: 433-444.
Davis, R.G. and L. McCalden. 2004. Representing Ontario‟s ecosystems: Ontario‟s approach to
representing ecosystems in a system of protected areas. Ontario Ministry of Natural Resources:
Peterborough, Ontario. 8 pp.
Davis, R.G. 2005. GapTool users guide. Ontario Ministry of Natural Resources:
Peterborough, Ontario. 51 pp + app.
Edwards, W. 1971. Social utilities. Engineering Economist, Summer symposium Series 6.
Falls, J.B., I.D. Macdonald and T.J. Beechey. 1990. Catalogue of IBP/CT Areas in Ontario with an
Assessment of their Current Conservation Status. Unpublished report. 94 pp.
Ferrier, S., R.L. Pressey, and T.W. Barrett. 2000. A new predictor of the irreplaceability of areas for
achieving a conservation goal, its application to real-world planning, and a research agenda for
further refinement. Biological Conservation 93:303-325.
Glenn, S.M. and T.D. Nudds. 1989. Insular biogeography of mammals in Canadian parks. Journal of
Biogeography 16: 261-268.
Groves, C.R., D.B. Jensen, L.L. Valutis, K.H. Redford, M.L. Shaffer, J.M. Scott, J.V. Baumgartner, J.V.
Higgins, M.W. Beck, and M.G. Anderson. 2002. Planning for biodiversity conservation: Putting
conservation science into practice. Bioscience 52: 499-512.
Gurd, D.B., T.D. Nudds, and D.H. Rivard. 2001. Conservation of mammals in eastern North American
wildlife reserves: how small is too small? Conservation Biology 15: 1355-1363.
Hager, H.A., R.M. Gorman, and T.D. Nudds. 2006. The relative performance of umbrella species for
biodiversity conservation in island archipelagos of the Great Lakes, North America. Ecoscience
13: 475-484.
Hagmeier, E.M. 1966. A numerical analysis of the distributional patterns of North American Mammals.
II. Re-evaluation of the provinces. Systematic Zoology 15: 279-299.
Kirkpatrick, J.B., M.J. Brown, and A. Moscal. 1980. Threatened plants of the Tasmanian central east
coast. Hobart: Tasmanian Conservation Trust.
Margules, C.R. and R.L. Pressey. 2000. Systematic conservation planning. Nature 405: 243-253.
Meir, E., S. Andelman, and H.P. Possingham. 2004. Does conservation matter in a dynamic & uncertain
world? Ecology Letters 7: 615-622.

TOP-DOWN VS. BOTTOM UP? WORKING TOWARDS CONSENSUS ON SYSTEMATIC PROTECTED AREAS PLANNING IN ONTARIO
18 | P a g e
National Round Table on the Environment and the Economy (NRTEE). 2003. Securing Canada‟s
Natural Capital: A Vision for Nature Conservancy in the 21st Century. National Round Table on
the Environment and the Economy.
Noss, R.F. 1991. Indicators for monitoring biodiversity, a hierarchical approach. Conservation Biology
4: 355-364.
Noss, R.F. 1992. The wildlands project: land conservation strategy. Wild Earth Special Issue: 10-25.
Noss, R.F. 2003. A checklist for wildlands network designs. Conservation Biology 17: 1270-1265.
Nudds, T.D., C.P. Henschel, J. Kerr, D. Currie, L. Fahrig, S. Koh, and C.G. McLaughlin. 1998.
Protected area networks: Assessment of Ontario‟s „Nature‟s Best‟ action plan and
recommendations. Pp. 363-372. In: Nelson, J.G., K. VanOsch, T.J. Beechey, W.R. Stephenson,
and J. Marsh (Eds.). Parks and Protected Areas Research in Ontario, 1998. Proceedings of the
Parks Research Forum of Ontario (PRFO) Annual General Meeting, February 5-6, 1998,
Peterborough, Ontario. Parks Research Forum of Ontario (PRFO), University of Waterloo:
Waterloo, Ontario.
Nudds, T.D. and Y.F. Wiersma. 2004. Back to the future: designing protected areas using data on
historical species distributions. Pp. 141-149. In: Rehbein, C.K., J.G. Nelson, T.J. Beechey and
R.J. Payne. (Eds.) Parks and Protected Areas Research in Ontario, 2004: Planning Northern
Parks and Protected Areas. Proceedings of the Parks Research Forum of Ontario (PRFO)
Annual General Meeting, May 4-6, 2004, Lakehead University. Parks Research Forum of
Ontario (PRFO), University of Waterloo: Waterloo, Ontario.
Ontario Ministry of Natural Resources (OMNR). 1999. Ontario's Living Legacy: Approved Land Use
Strategy [CD-ROM]. Queen's Printer for Ontario: Toronto, Ontario.
Oreskes, N. 2003. The role of quantitative models in science. Pp. 13-31. In: Canham, C.D., J.J. Cole,
and W.K. Lauenroth. (Eds.) Models in Ecosystem Science. Princeton University Press: Princeton,
New Jersey, USA.
Parks Canada. 1997. National Parks System Plan. Parks Canada: Ottawa, Ontario. 106 pp.
Parks Research Forum of Ontario (PRFO). 2008. About PRFO Parks Research Forum of Ontario
(PRFO). Available at <http://www.environment.uwaterloo.ca/research/prfo/about/index.htm>
Accessed 2008 September 26.
Patterson, B.D., G. Ceballos, W. Sechrest, M.F. Tognelli, T. Brooks, L. Luna, P. Ortega, I. Salazar, and
B.E. Young. 2003. Digital Distribution Maps of the Mammals of the Western Hemisphere,
version 1.0. NatureServe: Arlington, Virginia, USA.
Pierce, S.M., R.M. Cowling, A.T. Knight, A.T. Lombard, M. Rouget, and T. Worf. 2005. Systematic
conservation planning products for land-use planning. Interpretation for implementation.
Biological Conservation 125: 441-458.
Riley, J.L. 1998. Protected areas and lands for life: will protection policies be met and available
information used? Pp. 98-104. In: Nelson, J.G., K. VanOsch, T.J. Beechey, W.R. Stephenson,
and J. Marsh (Eds.). Parks and Protected Areas Research in Ontario, 1998. Proceedings of the
Parks Research Forum of Ontario (PRFO) Annual General Meeting, February 5-6, 1998,
Peterborough, Ontario. Parks Research Forum of Ontario (PRFO), University of Waterloo:
Waterloo, Ontario.
Rothley, K.D. 2006. Finding the tradeoffs between the reserve design and representation. Environmental
Management 38: 327-337.
Saaty, T.L. 1977. A scaling method for priorities in hierarchical structures. Journal of Mathematical
Psychology 15:234-281.

SUMMARY OF THE PARKS RESEARCH FORUM OF ONTARIO (PRFO) STATE OF THE ART PROTECTED AREAS DESIGN WORKSHOP, 2006
19 | P a g e
Schmiegelow, F.K.A., S.G. Cumming, S. Harrison, S. Leroux, K. Lisgo, R. Noss, and B. Olsen. 2006.
Conservation beyond crisis management: a reverse-matrix model: BEACONS Discussion Paper
No. 1. University of Alberta.
Sellars, R.W. 1997. Preserving nature in the national parks: a history. Yale University Press: New
Haven, Connecticut, USA. 380 pp.
Simberloff, D. 1998. Flagships, umbrellas, and keystones: Is single-species management passé in the
landscape era? Biological Conservation 83: 247-257.
Smith, F.E. 1968. The international biological program and the science of ecology. Proceedings of the
National Academy of Sciences of the United States 60: 5-11.
Solomon, M., A.S. van Jaarsveld, H.C. Biggs, and M.H. Knight. 2003. Conservation targets for viable
species assemblages? Biodiversity and Conservation 12: 2435-2441.
Soulé M.E. and M.A. Sanjayan. 1998. Conservation targets: do they help? Science 279: 2106-2108.
Stocks, B.J., J.A. Mason, J.B. Todd, E.M. Bosch, B.M. Wotton, B.D. Amiro, M.D. Flannigan, K.G.
Hirsch, K.A. Logan, D.L. Martell, and W.R. Skinner. 2002. Large forest fires in Canada, 1959-
1997. Journal of Geophysical Research-Atmospheres 108(D1): Article no.8149.
Vanderkam, R.P.D., Y.F. Wiersma, and D.J. King. 2007. Heuristic algorithms vs. linear programming
for designing conservation reserve networks: evaluation of solution optimality and processing
time. Biological Conservation 137: 349-358.
Wiersma Y.F. and T.D. Nudds. 2006. Conservation targets for viable species assemblages: data
independent targets are not appropriate. Biodiversity and Conservation 15: 4555-4567.

TOP-DOWN VS. BOTTOM UP? WORKING TOWARDS CONSENSUS ON SYSTEMATIC PROTECTED AREAS PLANNING IN ONTARIO
20 | P a g e

SUMMARY OF THE PARKS RESEARCH FORUM OF ONTARIO (PRFO) STATE OF THE ART PROTECTED AREAS DESIGN WORKSHOP, 2006
21 | P a g e
Appendix A. Profile Reports for Case Studies
Prior to the workshop, the case study presenters were asked to complete a profile report outlining the
framework for their research, and to give details on their methodology and data sources. These profile
reports were given to the two commentators in advance of the workshop, and an abridged summary of
these profiles was included in the workshop program. The following profile summaries are included
here.
Presenters
Page
Steve Kingston & Julee Boan 22
Yolanda Wiersma & Tom Nudds 25
Tony Iacobelli & Colin Anderson 30
Kara Brodribb & Dan Kraus 34
Bill Crins & Rob Davis 38

TOP-DOWN VS. BOTTOM UP? WORKING TOWARDS CONSENSUS ON SYSTEMATIC PROTECTED AREAS PLANNING IN ONTARIO
22 | P a g e
Name of Presenter(s): Steve Kingston and Julee Boan
1. Title of presentation: Square pegs? Adapting conservation planning tools for an intact landscape
2. Name of representative protected area design project: Protected areas design in intact landscapes: the
Northern Boreal Initiative
3. Date of project inception: 2001 and ongoing
4. Number of staff involved in the project: 2
5. Please describe the conservation applications for your project: Results eventually to be submitted as
input to community-based land use planning, and to Ministry of Natural Resources planners as part of
landscape-level planning.
6. Brief overview of project:
Goal/purpose of project: To apply concepts of systematic conservation planning and protected areas
design, through ecological representation and conservation values mapping, as applied to Ecoregion 3S,
with a closer look at Ecodistrict 3S-4 in northwestern Ontario.
Specific objectives: To provide landscape-level advice to the community-based land use planning
processes, demonstrate the application of systematic conservation planning tools in northern Ontario,
and potentially create a model for application to planning processes through the Northern Boreal
Initiative planning areas.
Study region for project: Ecoregion 3S, specifically Ecodistrict 3S-4
Partners: Ontario Parks/CPAWS- Wildlands League
Target audience/clients: First Nation community planners, and MNR planners
7. Please list all tools and techniques used in identifying proposed representative protected areas (e.g.,
reserve selection algorithms, software packages, community consultation, etc.), and for each list source
(e.g., developed in-house; purchased; contracted out; shareware; tool described in literature; etc.):
Tool or technique Source
MNR gap tool Ontario Parks: contracted to Cuesta Systems
WWF Assessment of Representation
(AoR) tool
Developed in-house / contract
C- PLAN Shareware
HCVF Framework Described in literature

SUMMARY OF THE PARKS RESEARCH FORUM OF ONTARIO (PRFO) STATE OF THE ART PROTECTED AREAS DESIGN WORKSHOP, 2006
23 | P a g e
8. Please list specific data inputs used in the process of identifying proposed representative protected
areas, and for each, list the source of the data (e.g., fieldwork; GIS data obtained from ________;
satellite imagery obtained from _________; etc.), and year in which the data was collected.
Data input Source Year
LV
associations
MNR (Landcover 2000 satellite imagery data and an
Enhanced Landform Layer developed in 2005)
2000 and
2005
Enduring
Features
WWF / Soil Landscapes of Canada 1996
Basedata MNR Ongoing
9. Please list specific hardware platform(s) for analysis and identify what stage of the process it is used
for (e.g., data compilation, analysis, presentation of results, etc.).
Hardware platform Stage of project used
PC All
10. Please list specific software packages used as part of the project, their source (e.g., purchased;
shareware; developed in house) and identify what stage of the process it is used for (e.g., data
compilation, analysis, presentation of results, etc.).
Software package Source Stage of project used
ArcView 3.x ESRI Analysis
ArcGIS 8.2 & 9.0 ESRI Analysis, presentation of results
C-PLAN shareware Analysis, results
11. Please describe the nature of any field work conducted in support of the project.
None
12. Please list the specific project outputs (e.g., maps; databases; reports) and identify the target
audience (e.g., university researchers; government staff and management; stakeholders/partners; non-
governmental organizations; general public; etc.).
Project Output Target Audience
Databases First Nation communities/MNR
Maps First Nation communities/MNR
Reports First Nation communities/MNR
13. Please describe any process undertaken for validation of project results (e.g., peer review, public
consultation, etc.)
C-PLAN is documented in the literature, and peer-reviewed.
WWF AoR tool has undergone peer-review and has been presented through ENGO/industry/government
workshops.

TOP-DOWN VS. BOTTOM UP? WORKING TOWARDS CONSENSUS ON SYSTEMATIC PROTECTED AREAS PLANNING IN ONTARIO
24 | P a g e
14. Please list any publications (including internal reports, grey literature, conference proceedings and
peer-reviewed articles) that have arisen from the project.
High Conservation Value Forests: Ecoregion 3S – Lac Seul Uplands, Ontario (internal CPAWS-
Wildlands League, Ontario Nature).
Lipsett-Moore, G., N. Bookey, S. Kingston, and J. Shuter. 2003. Representation, Focal Species and
Systematic Conservation Planning for the Northern Boreal Initiative. Pp. 189-197. In: Lemieux,
C.J., J.G. Nelson, T.J. Beechey and M.J. Troughton (Eds.). Parks and Protected Areas Research
in Ontario, 2003, Protected Areas and Watershed Management. Proceedings of the Parks
Research Forum of Ontario (PRFO) Annual General Meeting May 8-10, 2003, University of
Western Ontario. Parks Research Forum of Ontario (PRFO), University of Waterloo: Waterloo,
ON.
15. Please identify any limitations you feel you have encountered in your specific exercise of identifying
proposed representative protected areas.
- Data and knowledge gaps
- Minimum size requirements unknown
- Wide-ranging species needs not completely understood
- Lack of knowledge on the intensity of the human footprint in the matrix
- Future protected area establishment in surrounding areas within the NBI are unknown
16. Please describe any planned refinements to further work on the project, or on related projects.
Potential to develop conservation planning model that can be shared with community planners and
applied to planning units through the Northern Boreal Initiative

SUMMARY OF THE PARKS RESEARCH FORUM OF ONTARIO (PRFO) STATE OF THE ART PROTECTED AREAS DESIGN WORKSHOP, 2006
25 | P a g e
Name of Presenter(s): Yolanda Wiersma and Thomas D. Nudds
1. Title of Presentation: Representative protected areas design for Canadian mammals.
2. Name of Representative Protected Area Project: Diversity patterns and the design of protected areas
in Canada.
3. Date of Project Inception: September 2001
4. Number of staff involved in the project: 1
5. Please describe the conservation applications for your project: This project is not linked explicitly to
any land use or protected areas planning initiative, although two non-government agencies (the Yukon
chapter of the Canadian Parks and Wilderness Society, and the Canadian Council on Ecological Areas)
have expressed interest in using the results of the project as part of their “vision” maps for identifying
representative protected areas networks. The project identifies locations of core protected areas that are
representative for mammals, and thus the results could be applied to protected areas planning. The
project does not incorporate any planning for the matrix, and assumes that the matrix may become
totally human dominated.
6. Brief overview of project:
Goal/Purpose of Project: A Ph.D. thesis to investigate how diversity patterns influence the number and
location of representative protected areas for mammals in Canada.
Specific Objectives:
a) To test whether there is a consistent “data free” percentage target that can be applied across Canada to
identify the minimum areas needed to represent mammals in protected areas that are simultaneously
large enough for species to persist.
b) To test how diversity patterns and scale affect the number of protected areas needed to represent
ecologically-defined regions.
c) To test how well existing protected areas contribute to an efficient representative protected areas
network.
Study region for Project: The mammal provinces of Canada
Partners: Thesis supervisor, Dr. T.D. Nudds; Support has been received from CPAWS-Yukon and
CCEA
Target Audience/Clients: Largely aimed at an academic audience, although ENGOs such as the
Canadian Parks and Wilderness Society and the Canadian Council on Ecological Areas have expressed
interest in using the results of the thesis.

TOP-DOWN VS. BOTTOM UP? WORKING TOWARDS CONSENSUS ON SYSTEMATIC PROTECTED AREAS PLANNING IN ONTARIO
26 | P a g e
7. Please list all tools and techniques used in identifying representative protected areas (e.g., reserve
selection algorithms, software packages, community consultation, etc.), and for each list source (e.g.,
developed in-house; purchased; contracted out; shareware; tool described in literature; etc.):
Technique Tools Source
Heuristic reserve
selection algorithms
GIS analysis
Database analysis
Limited use of PORTFOLIO
software package
Described in literature
Beta-diversity pattern
analysis
GIS analysis Developed in-house
Minimum reserve area
analysis
n/a Described in the literature
8. Please list specific data inputs used in the process of identifying representative protected areas, and
for each, list the source of the data (e.g., fieldwork; GIS data obtained from ________; satellite imagery
obtained from _________; etc.), and year in which data was collected
Data input Source Year
Digital range maps of
historical distribution of
disturbance-sensitive
mammals
Digitized from Banfield‟s mammal atlas
using grant money from Parks Canada
Data
represents
pre-
widespread
European
settlement.
Digitizing
done in
1998.
Digital range maps of
present-day distribution of
disturbance-sensitive
mammals
Nature-Serve 2003
Digital files for the
boundaries of mammal
provinces.
Digitized from Hagmeier (1966) using grant
money from Parks Canada
Data from
1966.
Digitized
in 1998.
Digital files for the
boundaries of the ecoregions
of the Yukon
Yukon Department of the Environment GIS 2001
Digital point files for the
location of existing protected
areas
Canadian Conservation Areas Database June 2003

SUMMARY OF THE PARKS RESEARCH FORUM OF ONTARIO (PRFO) STATE OF THE ART PROTECTED AREAS DESIGN WORKSHOP, 2006
27 | P a g e
9. Please list specific hardware platform(s) for analysis and identify what stage of the process it is used
for (e.g., data compilation, analysis, presentation of results, etc.).
Hardware platform Stage of project used
Windows NT workstation GIS analysis
Statistical analysis
Project write-up
10. Please list specific software packages used as part of the project, their source (e.g., purchased;
shareware; developed in house) and identify what stage of the process it is used for (e.g., data
compilation, analysis, presentation of results, etc.).
Software package Source Stage of project used
ArcView ESRI Preliminary GIS analysis
ArcINFO ESRI Later stages of GIS analysis
Excel Microsoft Identification of representative areas
S-PLUS Insightful Co. Statistical analysis
PORTFOLIO Shareware Limited use for verification of site
selection
Word Microsoft Project write-up
11. Please describe the nature of any field work conducted in support of the project:
None was carried out.
12. Please list the specific project outputs (e.g., maps; databases; reports) and identify the target
audience (e.g., staff; director; ADM; stakeholders/partners; general public; etc.).
Project Output Target Audience
Thesis Thesis examining committee
Journal articles (2) Academic community
Published conference proceedings (2) Conference attendees/academic community
Technical report (1) CPAWS-Yukon
Poster presentation (1) Conference attendees
Conference presentations (5) Conference attendees
13. Please describe any process undertaken for validation of project results (e.g., peer review, public
consultation, etc.)
- Peer review of submitted manuscripts
- Thesis exam committee

TOP-DOWN VS. BOTTOM UP? WORKING TOWARDS CONSENSUS ON SYSTEMATIC PROTECTED AREAS PLANNING IN ONTARIO
28 | P a g e
14. Please list any publications (including internal reports, grey literature, conference proceedings and
peer-reviewed articles) that have arisen from the project.
Peer Reviewed articles:
Wiersma, Y.F. and D.L. Urban. 2005. Beta-diversity and nature reserve system design: a case study
from the Yukon, Canada. Conservation Biology 19: 1262-1272.
Wiersma, Y.F., and T.D. Nudds, 2006. Conservation targets for viable species assemblages in Canada:
Are percentage targets appropriate? Biodiversity and Conservation 15: 4555-4567.
Conference Proceedings:
Nudds, T.D. and Y.F. Wiersma. 2004. Back to the future: designing protected areas using data on
historical species distributions. Pp. 141-149. In: Rehbein, C.K., J.G. Nelson, T.J. Beechey and
R.J. Payne. (Eds.) Parks and Protected Areas Research in Ontario, 2004: Planning Northern
Parks and Protected Areas. Proceedings of the Parks Research Forum of Ontario (PRFO)
Annual General Meeting, May 4-6, 2004, Lakehead University. Parks Research Forum of
Ontario (PRFO), University of Waterloo: Waterloo, ON.
Wiersma, Y.F., and T.D. Nudds. 2003. On the fraction of land needed for protected areas. Chapter 7. In:
Munro, N.W.P., P. Dearden, T.B. Herman, K. Beazley and S. Bondrup-Nielson. (Eds.) Making
Ecosystem Based Management Work. Proceedings of the Fifth International Conference on
Science and Management of Protected Areas, CD-ROM Proceedings.
Technical reports:
Wiersma, Y.F. 2002. Identifying representation goals for Yukon protected areas: a coarse-filter analysis
for the southeast Yukon. Report for the Canadian Parks and Wilderness Society – Yukon
Chapter, Whitehorse, Yukon, July 2002.
Conference Presentations:
Nudds, T.D., and Y.F. Wiersma. 2004. Back to the future: protected areas planning in Ontario. Parks
Research Forum of Ontario (PRFO): Planning Northern Parks and Protected Areas. May 4-6,
2004. Lakehead University, Ontario.
Wiersma, Y.F., and T.D. Nudds. 2003a. Is “Is 12% enough?” the right question? Parks Research Forum
of Ontario (PRFO): Protected Areas and Watershed Management. May 8-10, 2003. University of
Western Ontario, Ontario.
Wiersma, Y.F., and T.D. Nudds. 2003b. “Is 12% enough?” is the wrong question: testing hypotheses
about representation requirements for mammals in southeastern Canada. Science and
Management of Protected Areas Association Conference May 11-16, 2003. University of
Victoria, British Columbia.
Wiersma, Y.F., and T.D. Nudds. 2005. The effect of spatial scale on reserve design in Canada.
Ecological Society of America Annual Meeting, August 6-12, 2005. Montréal, Québec.
Wiersma, Y.F. T.D. Nudds, and D.L. Urban. 2005. Beta diversity and reserve design. US-International
Association for Landscape Ecology. March 12-16, 2005. Syracuse, New York.
Poster presentations:
Wiersma, Y.F. and D.L. Urban. 2004. Beta-diversity and protected areas in the Yukon. Canadian
Society of Landscape Ecology and Management. August 26-27, 2004. Wilfred Laurier
University, Ontario.

SUMMARY OF THE PARKS RESEARCH FORUM OF ONTARIO (PRFO) STATE OF THE ART PROTECTED AREAS DESIGN WORKSHOP, 2006
29 | P a g e
15. Please identify any limitations you feel you have encountered in your specific exercise of identifying
representative protected areas.
1. Data has not been ground-truthed and is limited to “extent of occurrence” rather than “area of
occupancy”, and thus there is uncertainty about data accuracy.
2. Complete data on existing protected areas is difficult to obtain, polygon GIS files for most protected
areas was not available.
3. Data was limited to mammals, thus representative network may not be adequate for other species or
features.
4. Analysis is very coarse-scale.
16. Please describe any planned refinements to further work on the project, or on related projects.
1. Use data from other taxonomic groups (e.g., birds, trees, etc.).
2. Work within mammal provinces or smaller ecologically-defined regions and incorporate more fine-
scale data to refine the delineation of representative protected areas networks.

TOP-DOWN VS. BOTTOM UP? WORKING TOWARDS CONSENSUS ON SYSTEMATIC PROTECTED AREAS PLANNING IN ONTARIO
30 | P a g e
Name of Presenter(s): Tony Iacobelli and Colin Anderson, WWF-Canada
1. Title of Presentation: Landscape analysis tools for conservation planning.
2. Name of Representative Protected Area Project: Ecosystem representation implemented through
Forest Stewardship Council (FSC) certification.
3. Date of Project Inception: 2002
4. Number of staff involved in the project: 2-3 WWF staff in collaboration with CPAWS and forest
companies (Tembec, Domtar, Al-Pac)
5. Please describe the conservation applications for your project: FSC certification requires protection
and best management via Principle 6 (Criterion 6.4 re protected areas) and Principle 9 (High
Conservation Value Forests). A gap analysis tool (Assessment of Representation or AoR) and the High
Conservation Value Forests (HCVF) framework were developed and/or improved in collaboration with
ENGOs and forest companies. The tools have been applied to meet the requirements of FSC
certification and are being implemented through forest management plans. The ENGO community,
together with certified forest companies, are working to move the candidate protected areas (deferrals)
into a more secure land use planning process.
6. Brief overview of project:
Goal/Purpose of Project: Develop and apply conservation tools consistent with systematic conservation
planning and in support of FSC certification.
Specific Objectives:
a) Credible FSC certifications
b) HCVFs identified and managed to maintain conservation attributes
c) Candidate protected areas identified and deferred from harvesting
Study region for Project: Select tenures within the commercial forest zone.
Partners: TNC, CPAWS, Tembec, Al-Pac, Domtar, FPAC
Target Audience/Clients: Conservation and forest management practitioners.

SUMMARY OF THE PARKS RESEARCH FORUM OF ONTARIO (PRFO) STATE OF THE ART PROTECTED AREAS DESIGN WORKSHOP, 2006
31 | P a g e
7. Please list all tools and techniques used in identifying representative protected areas (e.g., reserve
selection algorithms, software packages, community consultation, etc.), and for each list source (e.g.,
developed in-house; purchased; contracted out; shareware; tool described in literature; etc.)
Technique Tools Source
Enduring features gap
analysis
WWF Assessment of
Representation GIS routine
Developed in-house;
documentation available from
WWF
(ftp://forests:[email protected]
AoR GIS Tool folder)
High Conservation
Value Forests
assessment
HCVF framework Appendix 5 in FSC national boreal
standard
(http://www.fsccanada.org/boreal/)
See also the WWF/TNC HCVF
Support Document
(ftp://forests:[email protected]
HCVF Resources > HCVF
Support Document folder)
8. Please list specific data inputs used in the process of identifying representative protected areas, and
for each, list the source of the data (e.g., fieldwork; GIS data obtained from ________; satellite imagery
obtained from _________; etc.), and year in which data was collected
Data input Source Year
Enduring Feature Gap Analysis
Digital maps of enduring
features
Derived from Agriculture Canada‟s Soil
Landscapes of Canada
2002
Digital maps of existing
protected areas
Ontario Ministry of Natural Resources, with in-
house maintenance and additions
2002
Digital road network National Road Network Level 1 (via Geobase) 2003
Digital surface hydrology
network
National Scale Framework Hydrology layer (via
GeoGratis)
2003
Digital elevation model (30
arcsecond resolution)
Canada 3D (via NRCan online)
High Conservation Value Forest Assessments
(data varies by individual project, but the following is a generic list of inputs)
Special Element Occurrences NHIC
Forest Resource Inventories Industry Partner
Provincial Values Database NRVIS
Road Network Industry Partner
Digital Elevation Model MNR or Industry Partner
Forest blocks Global Forest Watch Canada
Species/Communities at Risk NatureServe
Satellite Imagery Geobase or Industry Partner
Expert Opinion Consultants, MNR or Industry Biologists
Watershed boundaries MNR

TOP-DOWN VS. BOTTOM UP? WORKING TOWARDS CONSENSUS ON SYSTEMATIC PROTECTED AREAS PLANNING IN ONTARIO
32 | P a g e
9. Please list specific hardware platform(s) for analysis and identify what stage of the process it is used
for (e.g., data compilation, analysis, presentation of results, etc.).
Hardware platform Stage of project used
Windows 2000 Pro workstation GIS analysis
Project write-up
10. Please list specific software packages used as part of the project, their source (e.g., purchased;
shareware; developed in house) and identify what stage of the process it is used for (e.g., data
compilation, analysis, presentation of results, etc.).
Software package Source Stage of project used
ArcGIS (ArcInfo+Spatial
Analyst)
ESRI GIS analysis & geoprocessing
Assessment of
Representation Extension for
ArcGIS
Developed in-house
with ESRI programming
support (ArcObjects &
VB6)
Automated gap analysis
Word Microsoft Project write-up
SFMM MNR Preliminary wood supply
impacts during site selection
process.
11. Please describe the nature of any field work conducted in support of the project:
None was carried out.
12. Please list the specific project outputs (e.g., maps; databases; reports) and identify the target
audience (e.g., staff; director; ADM; stakeholders/partners; general public; etc.).
Project Output Target Audience
HCVF Report FSC auditors and stakeholders
Protected areas methodology FSC auditors and stakeholders
FSC certificates Wood buyers, investors, forest
management stakeholders
13. Please describe any process undertaken for validation of project results (e.g., peer review, public
consultation, etc.)
Third-party audit to independent performance standards

SUMMARY OF THE PARKS RESEARCH FORUM OF ONTARIO (PRFO) STATE OF THE ART PROTECTED AREAS DESIGN WORKSHOP, 2006
33 | P a g e
14. Please list any publications (including internal reports, grey literature, conference proceedings and
peer-reviewed articles) that have arisen from the project.
Technical reports:
National HCVF Framework. 2004. Appendix 5 in the FSC Boreal Standard.
World Wildlife Fund Canada and The Nature Conservancy. 2005. High Conservation Value Forest
Support Document. WWF-Canada and TNC Discussion Paper.
ftp://forests:[email protected]
Conference Presentations:
Numerous presentations at conferences and workshops.
15. Please identify any limitations you feel you have encountered in your specific exercise of identifying
representative protected areas.
Scale – Within the FSC process, it is difficult to work at an ecoregion scale since the applicant is seeking
the certification for a particular forest tenure.
Data – There are many data gaps, but some of the obvious gaps are nationally consistent biotic units,
focal species population studies and habitat requirements, and ecosystem services.
Thresholds – It is difficult to prescribe thresholds that can apply across ecoregions, so this often requires
practitioner investigation and judgment.
16. Please describe any planned refinements to further work on the project, or on related projects.
Possible areas for improvement, although not finalized and planned with budgets, include:
i) focal species‟ habitat requirements for HCV1-Question 4
ii) predictive ecosystem types and/or pre-industrial condition to improve the analysis for HCV1-
Question 5 and HCV3-Questions 8, 9 and 11
iii) Ecosystem services related to aquatic ecosystems and hydrological processes

TOP-DOWN VS. BOTTOM UP? WORKING TOWARDS CONSENSUS ON SYSTEMATIC PROTECTED AREAS PLANNING IN ONTARIO
34 | P a g e
Name of Presenter(s): Kara Brodribb & Dan Kraus
1. Title of presentation: Great Lakes Conservation Blueprint for Biodiversity
2. Name of representative protected area design project: Great Lakes Conservation Blueprint for
Terrestrial and Freshwater Biodiversity
3. Date of project inception: 2001
4. Number of staff involved in the project: Approximately 5, + approximately 20 GIS staff, + team of
core science advisors
5. Please describe the conservation applications for your project:
NCC has been using the results of the Conservation Blueprint to more effectively focus the direction of
conservation resources. NCC has used the information to better understand and communicate the
conservation priorities and needs for different areas in the Great Lakes basin. Within areas that have
been identified as high priority in the Conservation Blueprint, NCC works with partners to develop long-
term strategic plans to better protect the most significant biodiversity values. Information from the
Blueprint is used to support a broad array of land protection strategies, including prioritizing land
parcels for acquisition and stewardship support, informing land use policy, and education.
NCC is also working with Great Lakes partners in the U.S. to develop a binational understanding of
biodiversity values and conservation. Combining this information will be important for better
understating the status, threats and conservation needs of the entire Great Lakes system. NCC and
partners are using this information to support a number of other conservation planning projects including
the Great Lakes Islands Biodiversity study, and a LaMP-based Conservation Strategy for Lake Ontario.
The Ontario Ministry of Natural Resources is using the results of the project in a number of ways
including biodiversity reporting, land use planning, protected areas monitoring, and recovery planning
for species and habitats at risk.
6. Brief overview of project:
Goal/purpose of project: The goal of the Conservation Blueprint project is to identify a network of sites
on the landscape that, if properly conserved, has the ability to sustain all elements of terrestrial and
freshwater biodiversity in the Great Lakes basin. The project methods include coarse- and fine-filter
biodiversity analysis and gap analysis.
Study region for project: Ontario portion Great Lakes Ecoregion (terrestrial: all of Ecoregions 7E, 6E,
5E, Ecodistricts 4E1, 4E3, 3E4, 3W3, 3W6, 4E2; aquatic: Great Lakes basin)
Partners: The project was coordinated by NCC, OMNR and the Natural Heritage Information Centre.
There were also partnerships with scientists from a number of other agencies including Ontario Parks,
Environment Canada, Ducks Unlimited Canada, Trout Unlimited Canada, Ontario Power Generation,
Fisheries and Oceans Canada, Royal Ontario Museum, University of Toronto, University of Guelph, etc.

SUMMARY OF THE PARKS RESEARCH FORUM OF ONTARIO (PRFO) STATE OF THE ART PROTECTED AREAS DESIGN WORKSHOP, 2006
35 | P a g e
Target audience/clients: The audience for this project is diverse and includes: NCC scientists, land
securement and stewardship personnel; ENGO scientists (terrestrial and freshwater); government
agencies (protected areas, species at risk, policy, etc.); land use planners; students; etc.
7. Please list all tools and techniques used in identifying proposed representative protected areas (e.g.,
reserve selection algorithms, software packages, community consultation, etc.), and for each list source
(e.g., developed in-house; purchased; contracted out; shareware; tool described in literature; etc.)
Tool or technique Source
Coarse-filter biodiversity analysis Custom GIS model (described in project
report)
Fine-filter biodiversity analysis C-PLAN
Gap analysis Custom GIS model (described in project
report)
8. Please list specific data inputs used in the process of identifying proposed representative protected
areas, and for each, list the source of the data (e.g., fieldwork; GIS data obtained from ________;
satellite imagery obtained from _________; etc.), and year in which the data was collected.
There were dozens of data inputs used in these studies and they are documented in the project reports
(including source, etc.).
9. Please list specific hardware platform(s) for analysis and identify what stage of the process it is used
for (e.g., data compilation, analysis, presentation of results, etc.).
Hardware platform Stage of project used
ESRI ArcGIS Entire project
10. Please list specific software packages used as part of the project, their source (e.g., purchased;
shareware; developed in house) and identify what stage of the process it is used for (e.g., data
compilation, analysis, presentation of results, etc.).
Software package Source Stage of project used
ArcGIS ESRI Throughout project
C-PLAN Fine-filter biodiversity analysis
11. Please describe the nature of any field work conducted in support of the project:
None. Areas identified in the Blueprint are subject to more detailed site evaluation and data collection in
the development of spatially specific Natural Area Conservation Plans.

TOP-DOWN VS. BOTTOM UP? WORKING TOWARDS CONSENSUS ON SYSTEMATIC PROTECTED AREAS PLANNING IN ONTARIO
36 | P a g e
12. Please list the specific project outputs (e.g., maps; databases; reports) and identify the target
audience (e.g., university researchers; government staff and management; stakeholders/partners; non-
governmental organizations; general public; etc.).
Project Output Target Audience
Technical Reports Conservation practitioners
Project data (available through OGDE) Conservation practitioners
Brochure Conservation practitioners, general public
Technical posters Conservation practitioners
CDs Conservation practitioners
Maps Conservation practitioners
Articles/features in NCC publications,
PowerPoint presentations
NCC supporters and partners
13. Please describe any process undertaken for validation of project results (e.g., peer review, public
consultation, etc.)
a) Core Science Team established for the projects which reviewed methods and results.
b) Project methods and results presented and reviewed at an International Peer Review workshop for
ecoregional assessments (including TNC and WWF).
14. Please list any publications (including internal reports, grey literature, conference proceedings and
peer-reviewed articles) that have arisen from the project.
Technical Reports
Henson, B.L., K.E. Brodribb and J.L. Riley. 2005. Great Lakes Conservation Blueprint for Terrestrial
Biodiversity. Volume 1. Nature Conservancy of Canada. 157pp.
Henson, B.L. and K. E. Brodribb. 2005. Great Lakes Conservation Blueprint for Terrestrial Biodiversity.
Volume 2. Ecodistrict Summaries. Nature Conservancy of Canada. 344pp.
Phair, C., B.L. Henson and K.E. Brodribb. 2005. Great Lakes Conservation Blueprint for Aquatic
Biodiversity. Volume 2: Tertiary Watershed Summaries. Nature Conservancy of Canada. 454pp.
Wichert, G.A., K.E. Brodribb, B.L. Henson and C. Phair. 2005. Great Lakes Conservation Blueprint for
Aquatic Biodiversity. Volume 1. Nature Conservancy of Canada. 86pp.
Conference Presentations
Multiple, including PRFO, Latornell, Carolinian Canada, Canadian Society of Environmental Biologists
Conference Proceedings
Henson, B.L., K.E. Brodribb and J.L. Riley. 2004. Great Lakes Conservation Blueprint for Terrestrial
Biodiversity on the Canadian Shield. Pp. 151-162. In: Rehbein, C.K., J.G. Nelson, T.J. Beechey
and R.J. Payne. (Eds.) Parks and Protected Areas Research in Ontario, 2004: Planning Northern
Parks and Protected Areas; Proceedings of the Parks Research Forum of Ontario (PRFO)
Annual General Meeting, May 4-6, 2004, Lakehead University. Parks Research Forum of
Ontario (PRFO), University of Waterloo: Waterloo, Ontario.

SUMMARY OF THE PARKS RESEARCH FORUM OF ONTARIO (PRFO) STATE OF THE ART PROTECTED AREAS DESIGN WORKSHOP, 2006
37 | P a g e
Kraus, D. 2005. Applying the Great Lakes Conservation Blueprint for the Strategic Protection of
Biodiversity at Multiple Scales. Pp. 61-76. In Nelson, G., T. Nudds, M. Beveridge and B.
Dempster. (Eds.) Protected Areas and Species and Ecosystems at Risk: Research and Planning
Challenges. Parks and Protected Areas Research in Ontario, 2005. Proceedings of the Parks
Research Forum of Ontario (PRFO) and Carolinian Canada Coalition (CCC) Annual General
Meeting May 5-7, 2005, University of Guelph. Parks Research Forum of Ontario (PRFO),
University of Waterloo: Waterloo, Ontario.
Mandrak, N.E. and K.E. Brodribb. 2005. How Well Do Parks Protect Fish Species at Risk in Ontario?
Pp. 205-220. In: Nelson, G., T. Nudds, M. Beveridge and B. Dempster. (Eds.) Protected Areas
and Species and Ecosystems at Risk: Research and Planning Challenges. Parks and Protected
Areas Research in Ontario, 2005. Proceedings of the Parks Research Forum of Ontario (PRFO)
and Carolinian Canada Coalition (CCC) Annual General Meeting May 5-7, 2005, University of
Guelph. Parks Research Forum of Ontario (PRFO), University of Waterloo: Waterloo, ON.
15. Please identify any limitations you feel you have encountered in your specific exercise of identifying
proposed representative protected areas.
- Assessment of the viability of representative ecological systems and species occurrences requires
ground-truthing.
- Some proposed areas may not be available for conservation.
16. Please describe any planned refinements to further work on the project, or on related projects.
In priority landscapes NCC and partners will be enhancing the results of the Conservation Blueprint
based on local information and knowledge, and an assessment of threats and opportunities.
Full reports are available at:
http://www.natureconservancy.ca/files/frame.asp?lang=e_®ion=1&sec=science

TOP-DOWN VS. BOTTOM UP? WORKING TOWARDS CONSENSUS ON SYSTEMATIC PROTECTED AREAS PLANNING IN ONTARIO
38 | P a g e
Name of Presenter(s): Bill Crins and Rob Davis
1. Title of presentation: OMNR‟s approach to life science representation
2. Name of representative protected area design project:
Numerous protected area selection and design projects, including Lands for Life, Room to Grow, FSC
forest certification exercises, Areas of Natural and Scientific Interest (ANSI) program, Northern Boreal
Initiative, and various land securement opportunities with conservation partners
3. Date of project inception: The approach to representing terrestrial life science features based on
landform/vegetation associations was introduced in the late 1990s. GapTool and enhanced spatial data
sets were developed during 2004 and 2005 to help automate this approach.
4. Number of staff involved in the project: Two directly, with broader involvement for advice and
technical assistance
5. Please describe the conservation applications for your project: MNR‟s framework for representing
life science features based on landform/vegetation associations was used extensively in selecting the
suite of 378 protected areas recommended during Lands for Life and regulated during Ontario‟s Living
Legacy.
The GapTool application and its reports on ecological representation are being implemented in three
ways:
a) Reporting on the current status of ecological representation
Reports on the current status of ecological representation are being used for several purposes. These
purposes include identifying existing gaps in ecological representation, conducting life science
inventories for individual protected areas, and preparing management direction for individual protected
areas.
Protecting representative features is a key goal of MNR. To allow monitoring of current status, Ontario
Parks keeps standard GapTool tabular and map reports up to date for all of Ontario‟s ecodistricts and
protected areas, and posts these reports on the MNR Intranet system.
b) Value-added reports
The tables and maps produced with GapTool are being incorporated within other reports that build on
the information and provide additional interpretation.
Ecodistrict Life Science Reports are being prepared for several ecodistricts across Ontario on a priority
basis. These reports provide an assessment of ecological representation within an ecodistrict‟s regulated
protected areas, assess the design of that protected area system, and help to determine best bets for
candidate protected areas should such opportunities arise.

SUMMARY OF THE PARKS RESEARCH FORUM OF ONTARIO (PRFO) STATE OF THE ART PROTECTED AREAS DESIGN WORKSHOP, 2006
39 | P a g e
Results from GapTool are being used as a basis for reporting on ecological representation for the 2006
State of the Forest Report and the 2006 State of the Protected Areas Report.
c) Conservation planning
MNR is using GapTool and its associated data sets as part of various conservation planning initiatives
across Ontario. The tool is designed to support “what if” analysis scenarios involving potential new
protected areas.
GapTool is one of several tools that can be used within systematic conservation planning, in which
protected area systems are generally designed to represent various elements of biodiversity and help
ensure their persistence through time, at relatively low cost to other values such as resource extraction or
development. Tools such as C-PLAN (Margules and Pressey 2000) and MARXAN (Ball and
Possingham 2000) are better suited for designing potential protected areas. Once suites of potential
protected areas are designed, GapTool may be used to assess how these alternatives would contribute to
filling gaps in representation.
d) Software and data sets
The GapTool software is available to MNR staff upon request. Ecologists, biologists, foresters, analysts
and GIS technicians are the primary users.
A user‟s guide has been prepared to accompany the software application. Training workshops in using
the application and interpreting its results have been provided, and more are planned.
Ontario Parks maintains and distributes the data sets used in MNR gap analyses. These data sets include
ELC ecodistricts, several classes of regulated protected areas, and landform/vegetation features.
6. Brief overview of project:
Goal/purpose of project: Since no jurisdiction has completely catalogued its biological diversity, various
surrogates are used to represent the range of biodiversity. MNR has chosen to use naturally occurring
landform/vegetation associations as surrogates to represent the range of biodiversity in terrestrial
ecosystems. MNR‟s minimum requirements are to represent at least 1% or 50 hectares of each naturally-
occurring landform/vegetation association within each of Ontario‟s 71 ecodistricts.
GapTool automates and simplifies a process that MNR has been conducting since the late 1990s using
GIS functions. It reduces the time required to complete gap analyses, ensures more consistent results,
and allows information to be more readily kept up to date. Ontario Parks has also centralized and
improved the quality assurance of provincial GIS data sets used to assess ecological representation;
these include ecodistricts, protected areas, and landform/vegetation associations.
Specific objectives: Depends on the conservation planning initiative.
Study region for project: All of Ontario

TOP-DOWN VS. BOTTOM UP? WORKING TOWARDS CONSENSUS ON SYSTEMATIC PROTECTED AREAS PLANNING IN ONTARIO
40 | P a g e
Partners: Broader OMNR
Target audience/clients: Ontario Parks, broader OMNR, forest industries, Environmental NGOs
7. Please list all tools and techniques used in identifying proposed representative protected areas (e.g.,
reserve selection algorithms, software packages, community consultation, etc.), and for each list source
(e.g., developed in-house; purchased; contracted out; shareware; tool described in literature; etc.)
Tool or technique Source
GapTool – analytical tool designed to be
installed on the user‟s computer. It extends
the normal capabilities of ArcGIS.
Programmed using Visual Basic and
ArcObjects.
The effort was funded and led by Ontario
Parks, with participation across the broader
OMNR. ESSA Technologies Ltd. of
Ottawa, Ontario led a needs analysis to
define user requirements and technical
options. Cuesta Systems Inc. of Burlington,
Ontario performed programming and
technical development.
Spatial data sets on ELC ecodistricts,
various classes of protected areas,
landforms/vegetation associations
Developed in-house – see question 8 below

SUMMARY OF THE PARKS RESEARCH FORUM OF ONTARIO (PRFO) STATE OF THE ART PROTECTED AREAS DESIGN WORKSHOP, 2006
41 | P a g e
8. Please list specific data inputs used in the process of identifying proposed representative protected
areas, and for each, list the source of the data (e.g., fieldwork; GIS data obtained from ________;
satellite imagery obtained from _________; etc.), and year in which the data was collected.
Data input Source Year
Ecodistricts based on Ontario‟s Ecological Land
Classification System (GIS shapefiles)
Developed in-house
by Ontario Parks
2003
Protected area data sets (GIS shapefiles):
Regulated provincial parks
Regulated conservation reserves
Recommended protected areas
Wilderness areas
National parks
Developed in-house
and maintained by
Ontario Parks as part
of its normal business
Updated
continually
Ontario Parks has prepared three data sets to
represent landform/vegetation associations across
Ontario. All three are in the format of 25-metre
grids.
LV28: A provincially consistent but somewhat
coarse data set based on 1:1 million Geology of
Ontario quaternary geology mapping, and Land
Cover 28 classified remote sensing imagery
collected during 1986-1997. This data set
maintains consistency with information used
for Lands for Life and other planning processes
prior to 2005.
LV2000: A composite data set based on the
best available geological information within
each ecodistrict translated to a consistent
legend of landforms, and the best available
remotely sensed land cover imagery within
each ecodistrict. Land Cover 2000 imagery is
used to represent vegetation for all of Ontario
except the south. In Ecoregions 6E and 7E,
2002 LANDSAT imagery is used for the
Greenbelt area and Land Cover 28 is used
elsewhere.
LVFRI: A composite data set based on the best
available geological information within each
ecodistrict translated to a consistent legend of
landforms, and Forest Resources Inventory
(FRI) data classified into a set of 45 vegetation
classes based on tree species composition and
non-forest attributes. LVFRI provides higher
resolution vegetation coverage than LV2000
for about 28 of Ontario‟s 71 ecodistricts across
most of the Area of the Undertaking for Forest
Management.
Developed in-house
by Ontario Parks
LV28: 1999
LV2000:
2005- 2006
LVFRI: 2005-
2006

TOP-DOWN VS. BOTTOM UP? WORKING TOWARDS CONSENSUS ON SYSTEMATIC PROTECTED AREAS PLANNING IN ONTARIO
42 | P a g e
9. Please list specific hardware platform(s) for analysis and identify what stage of the process it is used
for (e.g., data compilation, analysis, presentation of results, etc.).
Hardware platform Stage of project used
Windows-based personal computer with
minimum 512 megabytes (Mb) of random
access memory (RAM)
Gap analysis of under-represented features
under current protected areas and scenarios
of potential new protected areas
10. Please list specific software packages used as part of the project, their source (e.g., purchased;
shareware; developed in house) and identify what stage of the process it is used for (e.g., data
compilation, analysis, presentation of results, etc.).
Software package Source Stage of project used
ArcMap Version 8.2 or 8.3 ESRI All
ESRI Spatial Analyst for ArcGIS ESRI All
GapTool Ontario Parks All
Excel (for tabular results) Microsoft All
Adobe Reader Version 7 or newer
(to view PDF output maps)
Adobe All
11. Please describe the nature of any field work conducted in support of the project:
None conducted to support the project. However maps and tabular results are used in conducting life
science inventories for individual protected areas.
12. Please list the specific project outputs (e.g., maps; databases; reports) and identify the target
audience (e.g., university researchers; government staff and management; stakeholders/partners; non-
governmental organizations; general public; etc.).
Project Output Target Audience
Technical papers (e.g., Crins and Kor 2000) and
communications bulletins (e.g., Davis and
McCalden 2004)
Primarily OMNR ecologists, biologists,
foresters, analysts, GIS technicians
GapTool software application and associated data
sets
Primarily OMNR ecologists, biologists,
foresters, analysts, GIS technicians
Formatted maps, tabular reports, and GIS
shapefiles on current ecological representation for
all of Ontario‟s 71 ecodistricts and 600+ regulated
protected areas
Primarily OMNR ecologists, biologists,
foresters, analysts, GIS technicians
GapTool users guide Primarily OMNR ecologists, biologists,
foresters, analysts, GIS technicians
Training workshops Primarily OMNR ecologists, biologists,
foresters, analysts, GIS technicians
Presentations (perhaps 20 to date) Primarily OMNR ecologists, biologists,
foresters, analysts, GIS technicians
Value-added reports (Ecodistrict Life Science
Reports, 2006 State of the Forest Report, 2006
State of Protected Areas Report)
“State Of” reports intended for public, ENGOs,
other jurisdictions; Internal reports intended
primarily for ecologists, biologists, foresters

SUMMARY OF THE PARKS RESEARCH FORUM OF ONTARIO (PRFO) STATE OF THE ART PROTECTED AREAS DESIGN WORKSHOP, 2006
43 | P a g e
13. Please describe any process undertaken for validation of project results (e.g., peer review, public
consultation, etc.)
Public consultation associated with protected area selection and design projects such as Lands for Life,
Room to Grow, FSC forest certification exercises.
Identification and review of sites for possible designation as Areas of Natural and Scientific Interest
(ANSIs) and for potential securement.
14. Please list any publications (including internal reports, grey literature, conference proceedings and
peer-reviewed articles) that have arisen from the project.
Crins, W.J. and P.S.G. Kor. 2000. Natural heritage gap analysis methodologies used by the Ontario
Ministry of Natural Resources. Version 2.0. Open File Natural Heritage Technical Report 2000-
1. Ontario Ministry of Natural Resources: Peterborough, Ontario.
Crins, W.J., and P.W.C. Uhlig. 2000. Ecoregions of Ontario: modifications to Angus Hills‟ site regions
and districts: revisions and rationale. Ontario Ministry of Natural Resources. Draft Report. 7 pp.
+ figure and table.
Davis, R.G. and L. McCalden. 2004. Representing Ontario‟s ecosystems: Ontario‟s approach to
representing ecosystems in a system of protected areas. Ontario Ministry of Natural Resources:
Peterborough, Ontario. 8 pp.
Davis, R.G. 2005. GapTool users guide. Ontario Ministry of Natural Resources:
Peterborough, Ontario. 51 pp + app.
15. Please identify any limitations you feel you have encountered in your specific exercise of identifying
proposed representative protected areas.
This approach doesn‟t go as far as identifying potential protected areas. It only identifies under-
represented natural features. Under-represented landform/vegetation associations often serve as building
blocks for identifying potential protected areas as conservation planning opportunities arise. During
conservation planning, other protected area selection criteria including condition, diversity, ecological
functions, and special features are considered, as are other values such as wood supplies, mineral
potential, and water power potential.
Although representation is the primary concept used to identify possible additions to Ontario‟s system of
protected areas, it is not the only one. MNR uses the following five criteria when selecting and
designing protected areas:
Landscape Criterion 1: Representation
o Terrestrial features based on landform/vegetation associations
o Aquatic features will be assessed once aquatic representation framework is prepared
Landscape Criterion 2: Condition
o Freedom from anthropogenic disturbances such as roads, mining, and timber harvesting
Site Criterion 1: Diversity
o Landscape diversity
o Species Diversity

TOP-DOWN VS. BOTTOM UP? WORKING TOWARDS CONSENSUS ON SYSTEMATIC PROTECTED AREAS PLANNING IN ONTARIO
44 | P a g e
Site Criterion 2: Ecological functions
o Hydrological functions
o Size, shape and connectivity
o Limiting habitat components
Site Criterion 3: Special features
o Rare species and vegetation communities
o Specialized habitats
o Recognized areas
Ontario Parks assesses any candidate protected areas on the basis of all these selection criteria; however
GapTool is helpful only with the representation criterion.
This life science representation framework and GapTool address only representation of terrestrial life
science features. OMNR currently lacks a framework with which to assess representation of aquatic
features.
16. Please describe any planned refinements to further work on the project, or on related projects.
It is possible that GapTool may be further developed in the future. Possible future enhancements
include:
ergonomic improvements such as better handling of landform/vegetation associations that are
omitted from analysis
representation of old growth forests
representation of aquatic life science features; and/or
updating to newer versions of ArcGIS software
The provincial landform/vegetation data sets, such as LV2000 and LVFRI, may be updated periodically
as required, depending on availability of new data and resources to complete the work.
OMNR is interested in working with partners in helping to identify and design potential protected areas
that provide the best contribution to biodiversity representation and persistence. For example, OMNR is
working in cooperation with WWF-Canada to identify gaps based on the organizations‟ two different
representation frameworks. The two sets of results can be viewed in the form of “overlapped gap maps”,
and combined for use in analytical tools such as C-PLAN and MARXAN.

SUMMARY OF THE PARKS RESEARCH FORUM OF ONTARIO (PRFO) STATE OF THE ART PROTECTED AREAS DESIGN WORKSHOP, 2006
45 | P a g e
Appendix B. List of Participants Colin Anderson
World Wildlife Fund Canada
245 Eglinton Ave. E., Suite 410
Toronto, ON, M4P 3J1
416.559.8800 x7246
Anna Baggio
Wildlands League
Suite 380 401 Richmond St. W.
Toronto, ON, M5V 3A8
416.971.9453 x47
Julee Boan
Ontario Nature/CPAWS
P.O. Box 398
Thunder Bay, ON, P7C 4W1
807.474.2285
Kara Brodribb
Nature Conservancy of Canada
110 Eglinton Ave. W. Suite 400
Toronto, ON, M4R 1A3
416.932.3202
Bill Crins
Ministry of Natural Resources
P.O. Box 7000, 300 Water Street
Peterborough, ON, K9J 8M5
705.755.1946
Steve Cumming
University of Laval
Départment des sciences de bois et de
la forêt
Pavillon Abitibi-Price, bureau 3143-A
Québec, QC, G1K 7P4
418.656.2131 x2593
Rob Davis
Ministry of Natural Resources
P.O. Box 7000, 300 Water Street
Peterborough, ON, K9J 8M5
705.755.1731
Rolph Davis
LGL & Natural Conservancy of Canada
Box 280
King City, ON, L7B 1A6
905.833.1244
Christine Doucet
Wilderness and Ecological Reserves
Advisory Council
1189 Main Rd.
Frenchman‟s Cove, NL, A0L 1E0
709.637.2372
Kristyn Ferguson
Faculty of Environment
University of Waterloo
200 University Ave. West
Waterloo, ON, N2L 3G1
Evan Ferrari
Wildlands League
380-401 Richmond Street W.
Toronto, ON, M5V 3A8
416.971.9453 x43
Joyce Gould
Alberta Natural Heritage Information
Centre
9820 106 Street
Edmonton, AB, T5K 2J6
780.427.7702
Trevor Hesselink
Wildlands League
380-401 Richmond St. West
Toronto, ON, M5V 3A8
416.971.9453 x33
Tony Iacobelli
World Wildlife Fund Canada
245 Eglinton Ave. East, Suite 410
Toronto, ON, M4P 3J1
416.489.8800
Stephanie Janetos
Ontario Parks
300 Water Street, 6th
floor south
Peterborough, ON, K9J 8M5
705.755.1728
Eva Kennedy
Ontario Parks
P.O. Box 7000, 300 Water Street
Peterborough, ON, K9J 8M5
705.755.5049
Steve Kingston
Ontario Parks
435 James St. South, Suite 221D
Thunder Bay, ON, P7E 6S8
807.475.1761
Dan Kraus
Nature Conservancy of Canada
5420 Highway 6 North R.R.5
Guelph, ON, N1H 6J2
519.826.0068
Chris Lemieux
Faculty of Environment
University of Waterloo
200 University Ave. West
Waterloo, ON, N2L 3G1
Cathy McAllister
Faculty of Environment
University of Waterloo
200 University Ave. West
Waterloo, ON, N2L 3G1
Mike McMurtry
Ministry of Natural Resources, NHIC
300 Water Street, Floor 2N
Peterborough, ON, K9J 8M5
705.755.2167

TOP-DOWN VS. BOTTOM UP? WORKING TOWARDS CONSENSUS ON SYSTEMATIC PROTECTED AREAS PLANNING IN ONTARIO
46 | P a g e
Natasha Morril
Ontario Parks, Wabakimi Provincial
Park
435 James St. South, Suite 221D
Thunder Bay, ON, P7E 6S8
807.475.1509
Erin Mosley
Ministry of Natural Resources
435 James Street South
Thunder Bay, ON, P7E 6S8
807.475.1525
Steve Murphy
Faculty of Environment
University of Waterloo
200 University Ave. West
Waterloo, ON, N2L 3G1
519.888.4567 x5616
Gord Nelson
Faculty of Environment
University of Waterloo
200 University Ave. West
Waterloo, ON, N2L 3G1
Tom Nudds
Department of Integrative Biology
University of Guelph
Guelph, ON, N1G 2W1
519.824.4120 x53074
Leif Olsen
Carleton University
1125 Colonel By Drive
Ottawa, ON, K1S 5B6
613.520.2600 x3863
David Pearce
Wildlands League
Suite 380 401 Richmond St. West
Toronto, ON, M5V 3A8
416.971.9453 x40
Jennie Pearce
Pearce and Associates Biological
Research
1405 Third Line East
Sault Ste. Marie, ON, P6A 6J8
705.253.1745
Robert Pressey
The Ecology Centre
University of Queensland
St. Lucia, QLD, 4072 Australia
61.7.3365.2454
Michele Proulx
Ontario Parks, Northwest Zone
435 James Street S.
Thunder Bay, ON, P7E 6S8
807.475.1477
Danijela Puric-Mladenovic
Ministry of Natural Resources
300 Water Street
Peterborough, ON, K9J 8M5
705.755.3262
Justin Quiroutte
Parks Canada
2630 Sheffield Rd.
Ottawa, ON, K1A 0M5
613.998.7244
Justina Ray
Wildlife Conservation Society
720 Spadina Ave. #600
Toronto, ON, M5S 2T9
416.850.9038 x22
John Riley
Nature Conservancy of Canada
110 Eglinton Ave. West, Suite 400
Toronto, ON, M4R 1A3
416.932.3209
Kris Rothley
School of Resource and Environmental
Management
Simon Fraser University
8888 University Drive
Burnaby, BC, V5A 1S6
604.291.3954
Jen Shuter
Department of Integrative Biology
University of Guelph
Guelph, ON, N1G 2W1
519.824.4120 x56307
Lisa Solomon
Ontario Parks, Quetico Provincial Park
108 Saturn Ave.
Atikokan, ON, P0T 1C0
807.597.5022
Samantha Song
Environment Canada
4999 98th
Ave. Suite 200
Edmonton, AB, T6B 2X3
780.951.8965
Bill Stephenson
Parks Canada
18973 Paragon Rd. RR 1
Cornwall, ON, K6H 5R5
613.931.2977
Rob Vanderkam
Environment Canada
351 St. Joseph Blvd.
Gatineau, QC, K1A 0H3
819.953.1444
Yolanda Wiersma
Department of Biology
Memorial University
St. John‟s, NL, A1B 3X9
709.737.7499

SUMMARY OF THE PARKS RESEARCH FORUM OF ONTARIO (PRFO) STATE OF THE ART PROTECTED AREAS DESIGN WORKSHOP, 2006
47 | P a g e
Joanna Wilson
Department of Environment and
Natural Resources
Government of the NWT
P.O. Box 1320
Yellowknife, NT, X1A 2L9
867.920.8751
Paul Zorn
Parks Canada
2630 Sheffield Rd.
Ottawa, ON, K1A 0M5
613.998.7248

TOP-DOWN VS. BOTTOM UP? WORKING TOWARDS CONSENSUS ON SYSTEMATIC PROTECTED AREAS PLANNING IN ONTARIO
48 | P a g e
The following five appendices (Appendix C to Appendix G) are summaries of the talks given on Day 1 of
the workshop. These include the keynote presentation by Dr. Pressey (Appendix C), the case study
presentation by Julee Boan and Steve Kingston (Appendix D), and the presentations on current
protected areas projects (Appendix E), together with a summary of the commentaries (Appendix F) and
of the panel discussion that followed (Appendix G). Copies of the power point slides that correspond to
these talks can be obtained by contacting the PRFO coordinator (see the PRFO website for contact
information). However, please note that the contents of these slides remain the copyright of the
presenters, and any use of the images therein should not be made without express consent of the
authors/presenters.

SUMMARY OF THE PARKS RESEARCH FORUM OF ONTARIO (PRFO) STATE OF THE ART PROTECTED AREAS DESIGN WORKSHOP, 2006
49 | P a g e
Appendix C. Summary of Keynote Presentation
Systematic Methods for Protected Area Design: Where have we been, where do we need to go?
Presenter: Dr. Robert L. Pressey, University of Queensland Summarized by Leif Olson
Department of Biology, Carleton University
The principle of complementarity is a critical factor in efficient conservation planning and the design of
protected area networks. The idea of complementarity arose independently four times over the 1970s
and 1980s, beginning with a small publication in the Tasmanian Monograph in the early 1980s
(Kirkpatrick et al. 1980). The contributions of Tony Robello, Chris Margules and Robert Pressey further
developed the theory and methods related to this principle. Complementarity, as it is defined today, is at
the heart of systematic reserve design. Planning with complementarity in mind involves the selection of
conservation areas such that each contains features that others lack; the result is a set of reserves that
together cover a wide range of biodiversity. Traditional methods of reserve design often select marginal
areas or over-focus reserves on certain cover types, leading to uneven representation of biodiversity.
Explicit targets are generally required to ensure that some minimum level of coverage is met. The
definition of these targets must be appropriate to the nature of the features themselves. Planning for the
simple presence of species or landcover features without more defined quantitative targets may result in
nonviable populations. This process ensures the efficiency of the resultant conservation network,
highlighting endemic hotspots that have considerable conservation value.
Designs for small sets of species over restricted areas is possible by hand, but as the number of species,
the extent of the planning area, and the complexity of the target constraints increase, computer assisted
algorithmic procedures become essential. As computing power has expanded, the number of
publications involving complementary methodologies has increased, topping ten per year in 1993.
Specialized software, such as the C-PLAN planning package, has become more recognized amongst
conservation planners. However, while the methodology has become more commonplace, the successful
implementation of these designs has lagged behind. The reasons for this are manifold.
The challenge of successful conservation implementation lies, first, in the challenge of representation of
extant biodiversity patterns, and the persistence of the processes that produce and maintain this pattern.
Second, reserve selection with C-PLAN implicitly assumes the rapid implementation of these reserves.
As real-world constraints often produce incremental implementation, the retention of biodiversity
pattern and process over time presents an even greater challenge. Conservation methods must therefore
explicitly consider persistence, representation and retention, if long-term, realistic strategies of
conservation are to be effective (see Figure 2).

TOP-DOWN VS. BOTTOM UP? WORKING TOWARDS CONSENSUS ON SYSTEMATIC PROTECTED AREAS PLANNING IN ONTARIO
50 | P a g e
Figure 2. Pressey‟s model for deciding relative emphasis on three aspects of protected area design –
representation, retention, and persistence – depending on which properties of biodiversity are the focus
of conservation, and the speed at which the system can be implemented.
Representation
There exist serious limitations to the simple complementarity methods used in the initial C-PLAN
package. Its use in generating a minimum set of complementary conservation areas gives only one
answer, despite the possibility of many equivalent designs. Without a clear picture of what the potential
options are, it produces a false sense of confidence in the outcome. For this reason, C-PLAN was refined
in 1995 to include the concept of “Irreplaceability”, a measure of the likelihood of needing a given area
to achieve conservation targets. This relative metric changes as targets are met or revised, and allows for
a more adaptive procedure to guide reserve selection. Groups of stakeholders and experts can be
involved at each stage of the algorithmic selection process, choosing individual sites based on their
calculated irreplaceability value and the additional valuation given by expert/ground-truth information.
As each site is selected (and retained), the irreplaceability map can be recalculated.
The use of software algorithms and human experts should be seen as complementary, not competitive,
approaches to conservation planning. By comparing the similarities and differences of the two
approaches, (and there are generally examples of both in any situation), it is possible to identify
unquantified uncertainties in the datasets, and arrive at more realistic assessments of conservation
potential. Expert opinion brings unquantified information to the decision process that would otherwise
remain in the minds of stakeholders. By explicitly involving these groups from the outset the selection
procedure becomes less a black-box process, which may reduce the likelihood of objections to any
proposed solution sets. At the same time, however, inevitable taxonomic and geographic biases in all
expert opinion require explicit and transparent design procedures. Data-driven selection algorithms add
a degree of impartiality that might otherwise compromise the conservation process.

SUMMARY OF THE PARKS RESEARCH FORUM OF ONTARIO (PRFO) STATE OF THE ART PROTECTED AREAS DESIGN WORKSHOP, 2006
51 | P a g e
Temporal Vulnerability and Retention of Biodiversity
Designing conservation reserves based solely on the distribution of features of interest has serious
potential shortcomings. Without explicit knowledge of the threatening processes at work across the
planning region, in terms of the likelihood and imminence of detrimental effects, it becomes impossible
to realistically identify regions of conservation priority. Those areas with both high irreplaceability and
high vulnerability must be given special attention. Conservation planners must first focus on methods
for predicting threats, and then decide on appropriate planning responses to mitigate those threats.
Incremental reserve adoption requires explicit knowledge regarding expected rates of land cover and
land use change. Information such as urban expansion plans and potential funding limitations are critical
constraints to incremental conservation plans, and lacking this knowledge can be detrimental. The trade-
off between vulnerability and implementation can be difficult to reconcile. Many highly vulnerable areas
may prove to be poor choices for reserves, due to the magnitude of the threats. Highly fragmented
landscapes may contain high species diversity, but may not provide sufficient quality to maintain these
populations over time. The question of triage becomes paramount: when do we walk away from these
areas? The assessment that a given area is „not viable‟ is often taxonomically biased, and may disregard
important process-based contributions an area makes beyond its ability to support charismatic taxa.
Persistence
The preservation of processes that produce and maintain biodiversity may prove to be the most
important factor in the success of conservation activities; in fact, it may take logical primacy, since
retention of representative nonviable reserves would seem less important than retention of
representative, viable ones. The maintenance of metapopulation dynamics and interspecific interactions
(such as pollinator-plant symbiosis, competition, herbivory or predator-prey cycles) is critical to the
persistence of diversity in a community. Patch dynamics such as disturbance, succession and resource
availability often play important roles in community structure. Regular movement ability over both short
and long distances fulfills short term habitat and resource requirements, and long term adaptations to
climate driven range adjustments. Ongoing work in the Cape Floristic region of South Africa is
explicitly focused on assessing the contributions of these factors towards biodiversity structure and
function, and the implications of these effects on conservation planning. Three factors are highlighted
for attention:
1. Biophysical Templates
These are features of the landscape that play key roles in the dynamics, structure and persistence of
biodiversity, such as drought refugia (gorges and runoff areas), climatic gradients, migration routes,
physical gradients (sand movement corridors, erosion pathways), and dispersal barriers as regional
subdivisions.
2. Qualitative design criteria
These are factors such as size, shape, connectivity and replication that are presently difficult to explicitly
define, but that play important roles in determining the success of conservation efforts. They can be used
as design preferences for future protected area network designs, and as categories for reviewing existing

TOP-DOWN VS. BOTTOM UP? WORKING TOWARDS CONSENSUS ON SYSTEMATIC PROTECTED AREAS PLANNING IN ONTARIO
52 | P a g e
protected areas (for example size class analysis). Recent advances in the C-PLAN software have
introduced a linkage to the MARXAN planning software, which allows design criteria such as total
reserve perimeter to influence the selection process, preferentially selecting areas that are adjacent to
previously selected or protected areas. The key limitation is that they are qualitative; these criteria
cannot be used to produce specific and explicit design requirements for particular processes in particular
regions. Planning without quantitative goals can be very difficult: How big does a reserve need to be?
How can we combine competing design criteria?
3. Quantitative design criteria
With quantitative targets, systematic reserve design is more rigorous. The advantage is that these targets
provide explicit stopping criteria, and allow direct evaluation of the success of conservation effort.
Without these, conservation simply becomes a matter of selecting areas, and either celebrating the
success or lamenting the failure of the protected area design. With explicit targets, even failures can be
informative, and in turn ensure that further effort has greater success. Species-specific life history
characteristics can be used to produce spatial or geographic targets. These quantitative targets can
include size, shape (perimeter/edge ratios, fractal dimension, and geometry), connectivity (defined in
numerous ways dependent on species-specific movement ability), alignment (affects solar insolation and
other climatic considerations, as well as impacting connectivity and migratory suitability), and
replication (targets derived from metapopulation theory). Quantitative design can be addressed in three
stages:
Stage 1 (essential): Interpret requirements of processes as quantitative targets for design criteria
Stage 2 (highly desirable): Map the options for achieving design targets across the region
Stage 3 (desirable): Dynamic link between software for planning and software for modelling
persistence of processes (e.g., population viability analyses [PVAs] for selected focal – perhaps
umbrella – species, but see Simberloff 1998; Hager et al. 2006).
There are several steps, not necessarily sequential (Box 2, hereinafter “Pressey Steps”), to planning for
conservation, and software plays different roles at each stage.
Box 2. Steps in Conservation Planning – “Pressey Steps”
1. Scoping and Costing
2. Identification and involvement of stakeholders
3. Identification of goals
4. Compile data
5. Set conservation targets
6. Assess existing conservation areas
7. Select new conservation areas
8. Implement conservation action
9. Maintain and monitor new and existing conservation areas

SUMMARY OF THE PARKS RESEARCH FORUM OF ONTARIO (PRFO) STATE OF THE ART PROTECTED AREAS DESIGN WORKSHOP, 2006
53 | P a g e
Software such as C-PLAN facilitates identification and involvement of stakeholders, data requirements
(both coverage and quality), and conservation targets. The key purposes, however, relate to assessment
of existing reserves, selection of new areas, and implementation and monitoring of the overall network.
Questions have been raised regarding different techniques required in public versus private lands, and
between different types of stakeholder groups (aboriginal groups, industry and forestry landowners,
private residential developers, stewardship councils, and recreation/tourism companies). While these
questions are by no means resolved, it has been suggested that involving stakeholders as early as
possible in the decision process can lead to more effective and agreeable goals and targets, as well as
alleviate the „black box‟ problem, whereby stakeholders are presented with (and subsequently reject) a
conservation management plan without an understanding of the data and methods that went into its
creation. This early involvement may also preclude later stakeholder „pullout‟, although realistically this
may require pre-existing legal commitment to the planning process.
Further comments have raised the possibility of „deferral areas‟, which while not officially designated as
a protected area, may be identified and monitored pending further conservation effort. Further
development of „matrix-management‟ strategies is warranted to mitigate threatening behaviour in areas
surrounding defined protected areas. However, from a systematic viewpoint, the data, tools and
procedures for the identification of these areas are identical, only differing in the policy and
implementation of these designations.
Finally, commentators have stressed the concern that not enough money and effort is directed towards
the maintenance and monitoring of protected areas, resulting in a decrease in intensive management over
time, and an increase in „benign neglect‟, which may reduce the effectiveness of extant protected areas.
There exists a necessary feedback loop between maintenance/monitoring and the assessment and
selection of conservation areas. Without effective monitoring, the benefits of quantitative targets cannot
be realized, and the effectiveness of those targets at realizing stated conservation effort goals cannot be
evaluated.

TOP-DOWN VS. BOTTOM UP? WORKING TOWARDS CONSENSUS ON SYSTEMATIC PROTECTED AREAS PLANNING IN ONTARIO
54 | P a g e
Appendix D. Summary of Case Study Presented by Kingston and Boan
Square Pegs? Adapting conservation planning tools for an intact landscape
Presenters: Steve Kingston, Ontario Parks and Julee Boan, Wildlands League/Ontario Nature Summarized by Leif Olson Department of Biology, Carleton University
Conservation reserves today are concentrated in easily protected areas that are of low economic and
charismatic value, such as lakes, burns, and wetlands, which are not always of high priority for
conservation. These reserves are often located in a matrix of high intensity economic processes such as
agriculture, forestry and mining. Systematic conservation planning procedures have been developed to
identify priority regions for biodiversity conservation in these sorts of fragmented landscapes. In this
context, the procedures are efficient, data driven, goal oriented, flexible and transparent. But how well
do these methods work in areas such as the northern boreal forest, where the landscape is effectively
unfragmented with little to no ongoing human development or resource extraction? In other regions, the
units of selection (forest patches, for example) are more immediately obvious and are usually dictated by
extant features. In areas predominated by relatively intact ecological systems, with small human-
dominated patches, what is the best method for determining contiguous units of selection and defining
conservation reserves? Is an efficiency-based selection procedure even appropriate in a landscape like
the intact boreal forest? Or would it be a better strategy to identify the most marginal, lowest quality
areas and allow human activity only in these regions, the so-called „Reverse Matrix‟ approach
(Schmiegelow et al. 2006)?
Ecoregion 3S
The ecoregion classification approach is a terrestrial system based on established climate patterns,
surficial geology, geography, physiography and topography. Ecoregions are further subdivided into
ecodistricts, which serve as a standard scale of conservation planning. Ecoregion 3S is situated in
northwestern Ontario, adjacent to the Manitoba border. It is dominated by intact boreal forest, covering
6.6 million hectares of land. Numerous headwaters fall within its borders, with watercourses running
north, east and west. There is a candidate for UNESCO World Heritage designation within the
Ecoregion. Currently, the area is mainly north of the legal limit for forestry, and much of the area
licensed for logging within the ecoregion has not yet been harvested. Most of the ecoregion contains few
roads and is largely unallocated to industry; 3% of the ecoregion has been designated for mining.
Presently, 5% of the area is protected; however, change is expected as hydroelectric development,
mining and forestry pressures increase. In response to this, local First Nation communities are taking an
active role in conservation planning activities, and are keen to develop new economic activities.
Indigenous knowledge in this area generally has a strong spatial focus around existing communities and
established hunting and trapping routes. The OMNR has responsibility in this region through the
Northern Boreal Initiative. The Species at Risk Act has designated the Wolverine (Gulo gulo) and
Woodland Caribou (Rangifer tarandus), both of which are found throughout the ecoregion.

SUMMARY OF THE PARKS RESEARCH FORUM OF ONTARIO (PRFO) STATE OF THE ART PROTECTED AREAS DESIGN WORKSHOP, 2006
55 | P a g e
There is a unique and significant opportunity for a different approach to conservation planning in the
relatively intact landscape of Ecoregion 3S, and an opportunity to evaluate the full spectrum of options
to balance development and conservation goals before a significant human footprint is established in the
area.
C-PLAN reserve planning in the 3S ecoregion
The study area was subdivided into 200 hectare hexagon sites, for a total of 34,000 sites. Sensitivity
analysis across a range of scales (50 ha to 10,000 ha) suggest that the results are very consistent across
scale in this ecoregion. A variety of feature categories were considered for reserve design (focal species,
umbrella/keystone species, and biodiversity surrogates) and a surrogate approach was chosen, using
Landform Vegetation (LV) associations as a surrogate for forest biodiversity. These LV associations use
a synthesis of landform (20 classes, based on quaternary and bedrock geology) and vegetation classes
(interpreted from 25 m x 25 m landcover information, with 19 classes) to produce 70 to 140 unique
classifications. These LV associations were used to determine C-PLAN targets, with an overall target
percentage for Ecoregion 3S of 12.9%. Individual LV targets were inversely scaled by rarity, such that
the rarest classes had the most stringent requirements for coverage (approaching 100% for areas of very
rare LV associations) and common LV associations receiving 12% targets. A second surrogate for
biodiversity was the World Wildlife Fund Canada‟s „Enduring Features‟ classification, a set of polygons
derived from soil landscapes with targets provided from theoretical understanding of fire and
disturbance regimes in the region. Using the „sites by features‟ matrix, the C-PLAN software generated
„Site Irreplaceability” and „Summed Irreplaceability‟ maps, which display the total unique contribution
each site makes towards meeting the target values (see Ferrier et al. 2000 for more detailed
methodology).
Added to these explicit target layers were a set of informing layers, the attributes of which are
ecologically or culturally relevant, but were not suitable for inclusion directly as features due to the
paucity of data. These layers could either be of conservation interest (e.g., caribou calving areas) or
constraints (e.g., high mineral potential) on the selection of protected areas within the ecoregion. This
method allowed for extensive additional data to be overlaid during the selection process, without forcing
them as targets in the Irreplaceability calculations. Using these informing layers and the summed
Irreplaceability maps, planners and stakeholders together can iteratively select areas for conservation
until targets are met.
Numerous conservation design scenarios can be constructed for the study region. By comparing the
sensitivity of the final reserve size to the initial target values, it is possible to assess how realistic such
targets are. (In other words, how likely is it to expect a target requiring the protection of 90% of the
study region, or conversely, how many targets can be met if we protect only 30% of the region?) Used in
an iterative fashion, this procedure allows planners to explore the range of conservation potential within
the region, and produce more informed conservation strategies. No one „best‟ approach to conservation
is likely to present itself. By hedging bets, using different strategies to delimit various conservation
scenarios, and identifying overlap between these strategies, risk of error resulting from one scenario is
considered to be spread, and planning decisions more informed.

TOP-DOWN VS. BOTTOM UP? WORKING TOWARDS CONSENSUS ON SYSTEMATIC PROTECTED AREAS PLANNING IN ONTARIO
56 | P a g e
Challenges of systematic planning
Many challenges stand in the way of the successful implementation of systematic reserve design in this
region. Designating and managing core reserve areas without knowing the expected human footprint
within the matrix is fraught with difficulty. New developments are currently under consideration without
details on the expected levels of resource extraction. Ill-defined factors such as connectivity (corridor-
design, stepping stones, etc.), and habitat quality impacts (edge effects potentially mitigated through
buffers, upstream riparian degradation, etc.), cannot easily be integrated into this framework without
elaborate theoretical development and more extensive monitoring activity.
Fine-filter focal species approaches may have limited application in this region, again chiefly limited by
data and theoretical constraints. Far-ranging species, such as caribou, have extensive and discontinuous
habitat requirements that may not be identified by periodic location-based range estimates. Migration
routes and seasonal habitat use are factors that are difficult to directly incorporate into quantitative
landcover-based conservation targets.
The choice of biodiversity surrogates must be critically evaluated, with respect to the character and
quantity of associated biodiversity. It may be that such coarse-filter approaches will only take us so far,
and must be supplemented with more species-specific conservation planning. The degree to which
species area-requirements are satisfied by these surrogate measures is also in need of study (through
PVAs, disturbance theories, and metapopulation-level assessments).
Finally, integrating conservation activity across a wide range of stakeholders is critical to effective and
holistic planning decisions. Ongoing community land use planning must be tempered and informed by
regional conservation perspectives. The sheer number of potential stakeholders will require cross-
jurisdictional collaborations between First Nations and all provincial and federal agencies, as well as
support from local communities, planners, resource managers, conservation groups, and industry
resource developers.
Commentary
Joanna Wilson raised the question of how First Nation involvement is proceeding. The community of
Pikangikum has already proceeded with a local-level conservation plan through the Whitefeather Forest
Initiative, and has been working in tandem with Ministry of Natural Resources planners and foresters.
Fine-scale GIS planning incorporated local expert-knowledge, but little progress has been made towards
establishing quantitative conservation targets or integrating regional conservation perspectives. Policy
makers must set targets in conjunction with local communities, so as to alleviate the „black box‟
conundrum when presented with a finalized network design. Finally, reference was made towards
ongoing refinements to geographic landcover information in the boreal region, such as the remote
sensing methods used by Mike Collins with the University of Calgary.

SUMMARY OF THE PARKS RESEARCH FORUM OF ONTARIO (PRFO) STATE OF THE ART PROTECTED AREAS DESIGN WORKSHOP, 2006
57 | P a g e
Appendix E. Summary of Four Case Study Presentations
Summarized by: Leif Olson
Department of Biology, Carleton University
Current Protected Area Project #1: Landscape Representation in North Saskatchewan
Presenter: Steve Cumming, Université Laval
In designing protected areas to conserve landscape features in areas of high resource extraction, land
cost usually matters. Thus the typical problem: How can we locate protected areas in cost effective
regions while meeting conservation goals? Representation of species alone is often not enough; we also
need to preserve the function of ecosystems. Landscapes can be evaluated based on their composition
(the land cover types, extant species or other features that are found within them) and their configuration
(the context in which the landscape is embedded). In areas with complex or unknown species
compositions, designing reserves to explicitly maximize connectivity creates a network of protected
areas that have importance from their configuration, independent of their contribution to feature targets.
Long term planning may benefit from a focus on the preservation of temporally invariant components of
the landscape.
When evaluating the design of existing protected areas in Saskatchewan, a focus on landscape cover
representation was taken. Saskatchewan Environment and Resource Management (SERM) have
previously used the Saskatchewan Land Classification „Enduring Features‟, spatial units based on soil
and watershed characteristics as units for representation. Forest Inventory data, used by the forest
industry for planning purposes, is widely available at high resolution, but often too data rich to be used
for conservation planning. The sheer number of landcover classes and the dynamic nature of forest
structure require less precise and more enduring classifications. By evaluating forest inventory data by
way of Intrinsic Mesic Patch Structures (Cummings and Vernier 2002), larger more temporally
homogenous units can be derived. This can then be used to measure the degree of landscape
representation in Saskatchewan‟s existing protected areas. Representation was evaluated based on the IP
composition and size structure, the presence of large, intact patches within the reserve, and expert-based
evaluation of critical caribou habitat.
Sub-compositional analysis provides a useful tool to assess the landcover composition contained within
the Representative Areas Network of Saskatchewan. It is particularly useful when dealing with
proportional data, such as landcover percentages found within protected areas. It provides a rigorous
statistical methodology for cover representation evaluations. The use of contour isolines can identify the
different compositional distributions of landcover within different protected areas. Expert-defined
critical caribou habitat can also be assessed, identifying cover compositions that are used in a
complementary fashion by caribou herds. This leads towards more systematic, patch-based reserve
construction.

TOP-DOWN VS. BOTTOM UP? WORKING TOWARDS CONSENSUS ON SYSTEMATIC PROTECTED AREAS PLANNING IN ONTARIO
58 | P a g e
Current Protected Area Project #2: Representative Protected Areas for Mammals in Canada
Presenter: Yolanda Wiersma
Two primary issues in the design of conservation areas are those of ecological integrity and biological
representation. Ecological integrity concerns the long term persistence of ecological processes. An
effective protected area should contain characteristic natural compositions and abundances of native
species, in arrangements that are likely to undergo persistent natural rates of change. At the same time, a
protected area network must also represent natural features in an efficient fashion (maximizing the
representation while minimizing the total area required for protection). With this in mind, it is possible
to assess the effectiveness of current protected areas, for species with known habitat requirements and
distributions. This analysis is restricted to disturbance-sensitive mammal species (Glenn and Nudds
1989). Banfield (1974) created a set of range maps to represent large mammal occurrence extent prior to
widespread European settlement. The NatureServe site (Patterson et al. 2003) provides range estimates
for modern day mammal distributions. Using these two range sets as data layers for systematic
conservation design, it is possible to compare and contrast reserves designed for historical ranges with
existing reserves. The historical range maps are presumed to be equivalent to current ranges in relatively
unaltered parts of the country. In addition, historical benchmarks can be used to evaluate whether
existing protected areas are meeting targets for representation and ecological integrity.
When using systematic reserve design, it is important to address both biodiversity representation and
persistence. Using techniques such as population viability analysis (PVA) and island biogeographic
theory, estimates for the minimum amount of habitat required for single-species large mammals have
ranged from 1800-17,000 km2. Gurd et al. (2001) provide estimates for the minimum reserve size for
large mammals at 5000km2 (with a range from 2700-13,000km
2). The assumption is that reserves larger
than this minimum size are able to maintain persistent populations of large mammals, at low risk of
insularization-induced extirpation. The question then becomes one of representation. How many and
which reserves of this minimum size are required to protect all large mammals?
Many researchers have suggested that percentage targets (a given proportion of the total area of a
planning region) are sufficient for representation and persistence of ecological integrity in that planning
region (Soulé and Sanjayan 1998; Solomon et al. 2003). The question of how consistent these
percentage targets are between ecologically significant regions has not been previously addressed. This
project uses the following methodology to address this question. Using the existing and historical
species range data, heuristic reserve selection algorithms generate minimum representative sets of
reserves using 2700km2, 5000km
2 and 13,000km
2 planning units. Using the mammal provinces of
Canada (Hagmeier 1966) as „ecologically significant regions‟, the differences in regional percentage
area required for a representative minimum sets were evaluated. The results of the selection are
compared between historical and present day range estimates.
Heuristic reserve selection algorithms iteratively select sites until a priori stopping criteria are met.
These heuristics re-evaluate these criteria after each selection, „learning‟ as reserves are added to the
system. This produces an efficient complementary set of sites. The selection process can weight sites by
the species it contains. Richness-based selection prioritizes sites by the gross number of species it
contains. Rarity-based selection inversely weights each species by its specific number of occurrences in

SUMMARY OF THE PARKS RESEARCH FORUM OF ONTARIO (PRFO) STATE OF THE ART PROTECTED AREAS DESIGN WORKSHOP, 2006
59 | P a g e
the study region. The algorithm will continue selecting sites until all species are present in at least one
site. Rarity-based selection generally required fewer sites to achieve conservation of all species, as
evidenced by species accumulation curves for each reserve design. Reserve designs required between
three to ten sites for complete coverage of all species. There was no consistent percentage of area per
mammal province required for a complementary design. The actual size of a selection unit made little
difference in the total proportion of the study area required. There appeared to be great variation
between reserve networks based on historical vs. modern-day data, with the modern data yielding results
that, generally, required fewer sites for complementary coverage. Existing reserves were, in fact, less
efficient than a randomly selected set of sites, and much less effective than algorithm selection
procedures.
In conclusion, this analysis suggests that there is no „magic bullet‟ percentage target for representative
protected areas. Varying ecological conditions in different geographic areas will require different goals
and strategies for efficient and effective reserve design. Estimates of historic species distributions are
not useful for present day conservation planning, even in relatively pristine parts of the country.

TOP-DOWN VS. BOTTOM UP? WORKING TOWARDS CONSENSUS ON SYSTEMATIC PROTECTED AREAS PLANNING IN ONTARIO
60 | P a g e
Current Protected Area Project #3: Landscape Analysis Tools for Conservation Planning
Presenters: Tony Iacobelli, Colin Anderson, WWF-Canada
Planning for Biodiversity Conservation
Current consensus in the conservation management community is that it is best to plan over relatively
large spatial extents (Groves et al. 2002). Planning at this scale must involve both strict protection in
critical core habitats, as well as good management in the intervening landscapes (NRTEE 2003;
Margules and Pressey 2000). This planning process must be rigorous and scientifically defensible (Noss
2003).
Forest Stewardship Council Certification
The fundamental conservation goals of a biodiversity vision are as follows (Noss 1991): The
representation of all native habitats, and the maintenance of a) viable populations of all native species;
b) essential ecological processes; and c) resilience to ecological change. To this end, the Forest
Stewardship Council (FSC) has introduced a voluntary third-party forest certification procedure. The
certification criteria are performance-based social, economic and environmental standards that are
introduced as a vehicle for landscape-level conservation planning. Currently more than 15 million
hectares are certified across Canada, with another 15 million committed to certification.
Two principles or criteria of the Forest Stewardship Council speak directly to this procedure:
Principle 9: “Management activities in high conservation value forests shall maintain or enhance the
attributes which define such forests. Decisions regarding high conservation value forests shall always
be considered in the context of a precautionary approach.”
Criterion 6.4: “Representative samples of existing ecosystems within the landscape shall be protected in
their natural state and recorded on maps, appropriate to the scale and intensity of operations and the
uniqueness of the affected resources.”
Principle 9 is addressed through the identification, assessment and selection of high conservation value
forests. Criterion 6.4 is used to identify gaps in the representation of enduring features in the landscape.
This is consistent with conservation design principles, whereby coarse-filter approaches are used to
evaluate representation of biodiversity, landcover composition and other enduring features, and fine-
filter approaches fill gaps by identifying critical habitat for significant species and other special features.
Conservation Planning Tools: Assessment of Representation
Representation can be easily assessed using automated, landscape-level gap analysis routines. The WWF
procedures assess the representation of physical habitats by ecodistrict, using enduring features (derived
from the Soil Landscapes of Canada, 1:1M scale) as the base unit. When evaluating protected areas, size
guidelines based largely on fire regime data (Stocks et al. 2002) were used to assess enduring features
compared at multiple scales (stand, patch and regional scales). Ecoregions can be grouped into Natural
Disturbance Zones of similar disturbance regimes. Areas were evaluated using the Representation

SUMMARY OF THE PARKS RESEARCH FORUM OF ONTARIO (PRFO) STATE OF THE ART PROTECTED AREAS DESIGN WORKSHOP, 2006
61 | P a g e
Scoring Matrix, by protected area size and connectivity (largest contiguous block protected with the
enduring feature, total area protected, and size of the largest overlapping network, all compared against
in situ guidelines), environmental gradients (the proportion of elevation range captured), shoreline and
stream habitats (the proportional amount of riparian area captured) and habitat quality (road density
compared to a priori thresholds).
Site Selection: High Conservation Value Forests
The emphasis within the Forest Stewardship Council has shifted from special status/old growth forests
to the concept of High Conservation Value Forest (HCVF or the most outstanding or critical forests).
This conservation value is defined in 6 ways:
Value 1: Concentrations of biodiversity such as: the presence of species at risk or endemic species;
critical habitat for seasonal concentrations of species; critical habitat for regionally significant species;
edge of range or outlier species; existing or candidate designations
Value 2: Large landscape level forests, i.e. Boreal thresholds are as follows:
globally significant, > 500 000 ha; nationally significant, 200 000 – 500 000 ha; regionally significant,
50 000 – 200 000 ha
Value 3: Rare ecosystems, containing attributes such as rare ecosystem types, declining ecosystem
types, remnant intact fragments, diverse or unique forest ecosystems
Value 4: Basic services of nature such as sources of drinking water, mediating drought or controlling
stream flow and water quality, erosion control, barriers to destructive fire, mediating micro-climates
Value 5: Community values. These are values that are fundamental to meeting basic needs of local
communities (as defined by local communities through consultation).
Value 6: Cultural values are those that are critical to local communities‟ traditional cultural identity
Case Example: Northeastern Ontario
This region is a nearly contiguous FSC landscape. There are presently ten certified forests in the region,
with many more actively pursuing certification. There exists the opportunity to use FSC Criterion 6.4 as
a process for landscape-level protected areas planning. Collaborative workshops have been held with
tenure-holders and ENGO representatives to identify candidate protected areas. The identification of
these candidates occurs at the tenure-level, but representation is assessed at the ecodistrict level. A
priority list of gaps has been identified by the level of representation and the tenure-holder
responsibility. Responsibility is defined as proportional to the tenure overlap with enduring features.
This iterative process assesses the reasons underlying lower scores (e.g. the existing protected areas are
too small, not contiguous, or too degraded by roadways and human activity), and scans for potential land
use conflicts using MNR NRVIS and other industry data. The HCVF assessment procedure is used to
develop candidate sites to cover existing coverage gaps. Representation can then be re-assessed
including these new candidate sites.

TOP-DOWN VS. BOTTOM UP? WORKING TOWARDS CONSENSUS ON SYSTEMATIC PROTECTED AREAS PLANNING IN ONTARIO
62 | P a g e
Limitations of the Process
Many stakeholders have not become fully involved in the workshop activities. Both First Nations and
MNR input is presently absent from the procedure. Candidate areas must also undergo additional public
consultation to ensure that all constraining factors have been identified. The forest management planning
process also lacks a formal mechanism for deferring areas from harvest. Presently these areas must be
„hidden‟ in marten core habitat, riparian buffers, etc. Significant gaps also exist in essential data, such as
habitat requirements and even more basic services of nature. These data are available for specific species
and specific regions, but large contiguous data are required for effective regional planning. The
methodology for resolving tenure-based decisions with ecoregion-level requirements also needs further
development.
Benefits of the Process
Tangible conservation gains have already been made through this procedure. Over 700,000 ha across
Canada have already been deferred from industrial activity. Positive industry engagement in protected
areas planning is encouraged, as industry is seen as a partner in the planning effort, lending up-front
support in the form of datasets and expert knowledge. This shift from more confrontational approaches
eases the planning process and encourages adoption of the proposals. Industry partners such as FPAC
have supported the development of conservation tools, and bodies such as Tembec, Domtar and Al-Pac
are currently using these tools and approaches in their activities.
For more information, and documentation, please visit: http://wwf.ca/AboutWWF/WhatWeDo/ConservationPrograms/ForestsAndTrade/AoR/Default.asp

SUMMARY OF THE PARKS RESEARCH FORUM OF ONTARIO (PRFO) STATE OF THE ART PROTECTED AREAS DESIGN WORKSHOP, 2006
63 | P a g e
Current Protected Area Project #4: Conservation Planning at the Nature Conservancy of Canada: Great Lakes Conservation Blueprint for Biodiversity
Presenters: Kara Brodribb and Dan Kraus
The Nature Conservancy's conservation goal is “...the long term survival of native species and
community types through the design and conservation of portfolios of sites within ecoregions.” To this
end, a conservation framework has been developed to guide planners and stakeholders through a four-
stage iterative process. These stages are:
1) Setting Priorities: The identification of essential data, the creation of conservation blueprints, and the
recognition of „action sites and great places‟, those areas that have anthropogenic conservation priority.
2) Planning Sites: Site documentation (data collection, threat assessment), stewardship statements of
intent, and site-level conservation planning.
3) Conservation Action: Site securement, stewardship programs and site-level restoration or threat
abatement.
4) Measuring success: Biodiversity monitoring, viability analysis, assessment of threat status.
These stages form a cycle of conservation activity, whereby threats are assessed, mitigating actions are
performed, and the success of those actions are quantified and used to inform the next iteration of
conservation management. Including monitoring and assessment directly in the procedure ensures that
the process remains focused on conservation goals, rather than on the implementation of potential
conservation strategies. As data quality improves and the result of ongoing conservation effort becomes
clear, the strategies and priorities of future conservation efforts can be adapted to improve their success
and efficiency.
Conservation Blueprint Design
The first step of a conservation blueprint involves the selection of conservation targets, whether at the
scale of individual species, ecological communities, or ecological systems. Next, through ecological
theory or expert opinion, conservation goals are set for each target unit, in terms of their number and
distribution. Finally, an assessment of target viability based on the present occurrences of targets must
be performed. This may be used to prioritize action and focus on those targets that would most benefit
from conservation action. These viability assessments can include information such as population size,
habitat (and therefore population) condition and landscape context.
Once goals and priorities have been identified, the focus must shift to the acquisition of a portfolio of
sites to achieve these goals. Factors such as connectivity and replication should be explicitly considered
to produce a complementary and resilient portfolio network. Finally, a multi-site action strategy must be
developed, focusing on sites that have high conservation value, that complement existing protected
areas, are facing immediate (and manageable) threats, are feasible, and are located in areas where great

TOP-DOWN VS. BOTTOM UP? WORKING TOWARDS CONSENSUS ON SYSTEMATIC PROTECTED AREAS PLANNING IN ONTARIO
64 | P a g e
leverage exists (in the form of local community or stakeholder support) to effectively implement
conservation action.
Conservation Targets
(Eds. note: „Targets‟, as used here, is synonymous with „features‟ as used by Pressey and others, and
refers to the species or natural features of conservation interest)
Targets should be selected so as to represent all spatial scales. This can be achieved through the use of a
combination of coarse and fine-filter approaches, selected in order to include a range of geographic
scales of operation. On the coarse-filter side, targets may be selected at the local, intermediate or broad
scales (small patch, large patch and „matrix‟ communities or systems, respectively). On the fine-filter
side, selection is often of individual species (often those of „special concern‟) that operate on a particular
spatial scale (local, intermediate, broad or regional scales). By selecting a range of targets, each with a
different characteristic spatial scale, the final portfolio network may provide protection to a greater
range of ecological processes than a network explicitly designed with fewer spatial scales in mind.
Designing a Portfolio
Sites should be selected as part of a conservation portfolio by way of a rigorous, defensible and
transparent process. Factors that should impact this decision include irreplaceability (does a site contain
the only or best example of a conservation target?), complementarity (does a site add to or complement
the conservation targets known to occur within existing conservation lands?), efficiency (does the site
contain multiple examples of conservation targets?) and viability/sustainability (are ecological processes
and landscape patterns in place to allow for long-term persistence of the targets found at the site?). The
uses of rule-based, automated methods of representation are in parallel and comparable to Ontario
Parks/ANSI (Areas of Natural and Scientific Interest) methodologies. C-PLAN is used as a decision
support tool, to ensure efficient portfolio design. A range of criteria are used to identify parks and
ANSIs, principally representation, condition, diversity, ecological function and „special features‟. These
criteria mimic many of the principles used by the Nature Conservancy in the United States.
Case Examples: Great Lakes Conservation Blueprint Project, Ecodistrict Level Planning
The Great Lakes area contains a number of ecodistricts, comprising southern Ontario and the Canadian
Shield. The conservation goals for coarse-filter targets in this area are split between these two regions. In
the Shield region the goals were the selection of the top two examples of each terrestrial ecosystem type
per ecodistrict. Goals for Southern Ontario were the top two examples of each terrestrial ecosystem per
ecodistrict, and the top example of each terrestrial ecosystem type per physiographic region per
ecodistrict. These coarse-filter targets were scored in terms of condition (the presence of adjacent natural
areas, the distance from roads, and in the Shield region, the presence of active mine pits and quarries),
diversity (the number of landform-vegetation types), ecological function (the size of natural or core
areas, the proximity to existing protected areas and conservation lands, their ability to act as corridors
between other cores [in southern Ontario] and the amount of old growth forest [in the Shield]), and the
presence of rare targets (species, alvars, etc.). This scoring is used to generate a prioritized map for
filling in gaps in representation of landform-vegetation types and species targets.

SUMMARY OF THE PARKS RESEARCH FORUM OF ONTARIO (PRFO) STATE OF THE ART PROTECTED AREAS DESIGN WORKSHOP, 2006
65 | P a g e
A fine-filter approach in this area focuses on species of Special Concern (globally rare or SARA
designated species, endemic, declining or disjunct populations) and vegetation communities that are
globally rare, provincially rare or particularly high-quality examples. The fine-filter approach will
identify point-specific areas within each ecodistrict that are of particular importance for meeting
conservation goals.
The synthesis of the coarse and fine-filter approaches results in a regional-level blueprint of current and
proposed protected areas, and a set of ecodistrict level maps delimiting designated parks and protected
areas, additional designated natural heritage lands, and other priority stewardship lands. Each ecodistrict
is documented and described, with a general description and detail on the remaining natural landcover,
predominant land use, current conservation efforts, extant rare species and vegetation communities, and
the specific recommendations of the conservation blueprint.
This approach to conservation planning requires strong partnerships between the science team and the
stakeholders. While it is based on a scientific approach to conservation planning, it is expressed in terms
of earlier existing Ontario frameworks. Its planning area is ecologically defined, and focuses on the
representation of biodiversity across several scales. It incorporates the highest resolution data available
for each ecodistrict (often Forest Resource Inventories). It provides an explicit assessment of landscape
disturbance, and incorporates the habitat requirements of wide-ranging animals. The analysis includes
both public and private lands, including existing conservation areas. The results are transparent and
defensible. The results and suggestions of the procedure are presented at multiple scales, from the
regional to the local, and are useful for a wide range of stakeholders. The blueprint attempts to present
and acknowledge the short-comings of the data, and the recommendations derived from them.
From System to Strategy
The Nature Conservancy of Canada (NCC) is implementing the Great Lakes Conservation Blueprint at a
range of scales. At the global scale, the NCC has integrated the Ontario and U.S. Great Lakes
assessments, and identified how this region fits into the global context of conservation priorities. At the
ecodistrict scale, the blueprint evaluates and prioritizes landscapes based on targets, threats and
conservation needs, and identifies priority conservation targets and areas in each district. The integration
of terrestrial and aquatic conservation goals, together with prioritization schema (irreplaceability,
complementarity, threat assessment, population viability, opportunity) will identify priority natural
areas. Within these natural areas, the NCC works with local partners to develop Natural Area
Conservation Plans by incorporating fine-scale local data and planning information. Partners or data
providers in this process can include land trust holdings, county forests, crown land managers, species-
at-risk recovery teams, Natural Heritage plans and municipal planning/population trends. Local partners
can validate target identification, provide ground-truth information, enhance threat assessment, and
integrate local objectives. Finally, the stewardship of individual properties and the development of local
management plans to enhance the viability of targets or reduce critical threats is essential to the success
of Natural Areas Conservation Plans. These plans should work with partners to develop a coordinated
„conservation vision‟ for priority natural areas, create and maintain a dynamic and adaptive conservation
planning framework, and collect and respond to new data.

TOP-DOWN VS. BOTTOM UP? WORKING TOWARDS CONSENSUS ON SYSTEMATIC PROTECTED AREAS PLANNING IN ONTARIO
66 | P a g e
From Plan to Action example: Carden Alvar, Ecodistrict 6E9
The NCC is working in this area in conjunction with partners to select and refine conservation targets
and goals. The area contains alvar complexes, limestone plain forests, wetlands and linkages to the
Canadian Shield. Information is updated and added regarding district level provincial policy, inventory
information such as high-quality alvar locations, and land-ownership information such as the location of
conservation-minded landowners, lands owned by local land trusts, and aggregate industry-owned lands.
This local information can identify opportunities and constraints that might otherwise be overlooked by
regional level conservation schemes. Using all available information, a long-term (10+ years)
conservation plan (and a budget for its implementation) has been developed, protecting the highest
quality sites and key buffer regions, maintaining northern linkages to the Canadian Shield, developing
management plans for grazing activity and supporting further economic impact studies.
Benefits of Integrated, Multi-scale Biodiversity Conservation Planning
At the planning stage, local priorities can be set with regard to the regional ecosystem context, which
can better define irreplaceable sites, with regard to their ecological significance and their economic or
social feasibility. Without consideration of this second factor, the irreplaceability of many sites may be
underestimated. At the implementation stage, knowledge of their regional context can inspire and
empower local conservation efforts, and encourage investment and support from within the community.
The coordination of conservation partnerships can build relationships over the long term, and enhance
the success of future efforts. Local data will also facilitate the response to unexpected opportunity and
make the conservation effort more flexible and adaptable.

SUMMARY OF THE PARKS RESEARCH FORUM OF ONTARIO (PRFO) STATE OF THE ART PROTECTED AREAS DESIGN WORKSHOP, 2006
67 | P a g e
Appendix F. Summary of Day 1 Commentaries
Summarized by: Leif Olson
Department of Biology, Carleton University
Commentary 1
Kris Rothley
The idea of systematic conservation planning has only recently been recognized by conservation
planners as a useful methodology. Some have suggested that the procedure is a waste of time. However,
the examples outlined here have demonstrated its usefulness, both as an exercise (in which data is
described and examined specifically with regard to reserve design) and as a goal (in which data is
collected to facilitate a systematic conservation design). While there are similarities and differences in
the techniques and examples presented here, the commonalities tend to outweigh the differences. This is
not necessarily a good thing. All examples use datasets that have massive (and typically unspecified)
uncertainty and error associated with them. There is still a focus on representation, only occasionally
considering persistence over time. Extensive assumptions are made regarding the ability of individual
species or land cover classifications to function as indicators for habitat quality or biodiversity or scale-
dependent ecological processes. Without validation, reliance on these assumptions may lead to failure
for many conservation plans. The use of occurrence data may lead to poor inferences regarding habitat
quality. Declining populations may retreat to peripheral areas, rather than prime habitat. Protecting areas
of existing species richness may not capture the best areas for species persistence.
At the same time, there were many differences between the various approaches. The question of whether
the same toolset can be used to good effect in both fragmented human-dominated landscapes and in
unfragmented natural-cover dominated areas has not been resolved. The same methods may require
drastically different philosophical interpretations when selecting or designing protected areas. The extent
to which stakeholders are explicitly involved in the planning process also varies widely between
examples. The data available in different regions and to different planning jurisdictions may pose
difficulties in implementing comparable conservation strategies. The threats facing these different
regions also varies in extent (point sources, regional land use changes, broad-level environmental
effects, short versus long term impacts) and nature (population pressure, resource extraction, climate
changes).
Some points were not addressed by any example. The management style that is necessary for
conservation within designated core protected areas needs attention. Is the maintenance of true
„wilderness areas‟ required in all instances? Or can some more extensive management practices play a
role in successful conservation? Explicit attention must also be directed towards the management of
„matrix‟ or buffer areas surrounding core conservation areas. The success of efforts within these areas
will undoubtedly depend on the context in which they are embedded. The idea of connectivity has been
repeatedly described, but not explicitly defined. Any measure of connectivity will almost certainly have
a species or taxonomic bias, which may lead to undesirable decisions.

TOP-DOWN VS. BOTTOM UP? WORKING TOWARDS CONSENSUS ON SYSTEMATIC PROTECTED AREAS PLANNING IN ONTARIO
68 | P a g e
Very little attention has been directed towards monitoring and measuring the success of conservation
efforts, particularly in terms of the survival and reproduction of populations. Additionally, the potential
biological significance of ecotones has not been addressed. An adaptive management approach, treating
protected areas as experiments, may yield answers to these unresolved questions. Ongoing monitoring
programs in conjunction to changes to land use practices may provide an excellent opportunity for
research in this area.
The reliance on the „minimum set‟ is potentially dangerous as faulty assumptions may lead to the
underestimation of the requirements necessary for species persistence. The question „if this reserve
network is implemented, will it work?‟ must be addressed, and the less confident we are with the answer
to this question, the more precautionary we must be. Minimum sets should only be used if we can
guarantee that the „protected area‟ will be preserved, and that the area will be sufficient to maintain
biodiversity at an acceptable level.

SUMMARY OF THE PARKS RESEARCH FORUM OF ONTARIO (PRFO) STATE OF THE ART PROTECTED AREAS DESIGN WORKSHOP, 2006
69 | P a g e
Commentary 2
Paul Zorn
The distinction must be made between a Protected Area Systems Plan and a Protected Area Network. A
Protected Area Systems Plan is a series of protected areas designed to represent and protect specific
natural and cultural heritage values (e.g., Ontario provincial parks, Canadian national parks). There is a
focus on ecosystem structure and composition. By contrast, a Protected Area Network may be defined as
a series of protected areas that form the basis of a comprehensive biodiversity conservation strategy that
includes buffer zones, corridors, the intervening landscape (matrix) and other factors (e.g., UNESCO
biosphere reserve model, multiple-use modules), with an explicit focus on maintaining ecosystem
processes.
For the conservation of ecological integrity, biodiversity, and the persistence of species, a Protected
Area Systems Plan is a necessary, but not sufficient strategy. Are protected areas the goal, or the tool?
With this in mind, the first recommendation is to strengthen the integration of unprotected areas to
develop a more comprehensive protected areas network (e.g., improve habitat quality within the matrix,
ecological restoration, facilitate dispersal through “stepping stones” and conservation corridors, promote
insulating protected areas through buffer zones as in biosphere reserves).
Secondly, “all models are wrong. Some are useful.” (Box 1976). Are the presented models useful? Some
are, others are not. A disconnect exists between the scale of analysis and the scale of land use decisions.
Thought must be given towards the delivery mechanisms of these plans. With the exception of northern
Ontario, the majority of land securement for conservation will be done through municipal governments
and private stewardship. The scale of protected area network goals, data and targets should be
commensurate with the scale of relevant decision making processes. There must be an increased focus
on the human dimension of the conservation process. Multiple groups are necessary to implement a
successful protected areas network in Ontario. Multiple competing values and priorities need to be
addressed to create a solution that people can buy into. By building consensus early on, goals and targets
can be established to ensure successful implementation later in the planning process. It is recommended
that planners apply tools and methods that explicitly involve and incorporate a range of stakeholders,
multiple objectives and values. Examples to consider include simple multi-attribute rating techniques
(Edwards 1971), multiple criteria evaluations (Saaty 1977), and multi-objective programming (Cohon
1978). A nested, multi-scale approach (top-down, bottom-up) that is commensurate with the scale of
land use decisions will be key. The adoption of this approach through early-stage consensus building is
critical.
Remember Occam‟s Razor. As we add complexity (variables) to a model the amount of new,
independent information gained decreases as uncertainty (through error propagation) increases. Adding
complexity often weakens, not strengthens, a model. In ecology, relatively few variables will generally
capture the majority of a pattern. Thought must be given to the best use of the best available data. The
data used for protected area design in Ontario is of variable quantity and quality (e.g., data grain issues,
false-absences, temporal context, bias). The uncertainty inherent in these data is usually unknown and
often not explicitly incorporated into models.

TOP-DOWN VS. BOTTOM UP? WORKING TOWARDS CONSENSUS ON SYSTEMATIC PROTECTED AREAS PLANNING IN ONTARIO
70 | P a g e
But how much uncertainty is too much? Engagement of stakeholders prior to analysis is valuable. As we
increase stakeholder comfort in data and targets, we increase their comfort with the model output. We
may not have consensus on explicit targets, but there exists agreement on the direction. Data focused
approaches must be balanced with theory-driven approaches: Identify a parsimonious set of variables
from ecological theory (e.g., meta-population theory, landscape ecology) that are known to positively
effect species persistence but can be measured with relatively low error. Produce simplified models by
focusing only on those variables of primary importance (e.g., habitat amount, connectivity) that
complement other models. A parsimonious approach deriving from existing ecological theory will guide
conservation plans and will produce more rigorously testable goals; the evaluation of the success of
conservation activities will be easier under these guidelines.
Finally, recall Oreskes (2003); “All models are open systems.” Existing datasets are snapshots of
dynamic processes, and all protected area networks designed from those data will reflect this.
Opportunism should be embraced, as there is no one single „correct‟ network design. The mechanisms
by which a protected areas network is to be established (e.g., private stewardship, official planning)
should inform the method, process and tools used in analysis. While there can (and should) be a strategic
approach, there is a necessity for incrementalism, opportunism, and flexibility. This calls into question
the utility of a single “optimal” design. Land use decisions are often community-based and are
influenced by political, social, economic, and environmental factors. Decision makers often have to
decide among competing land uses across multiple properties. The development of tools (multiple
criteria evaluations using pairwise comparison matrices, opportunity/constraint mapping) that allow
community groups to rank the ecological value of competing local properties within the context of a
regional protected areas network and other values and policies will help improve local decisions based
on ecological principles (models as “vision maps”), and improve stakeholder engagement.

SUMMARY OF THE PARKS RESEARCH FORUM OF ONTARIO (PRFO) STATE OF THE ART PROTECTED AREAS DESIGN WORKSHOP, 2006
71 | P a g e
Appendix G. Summary of Day 1 Panel Discussion
Summarized by: Leif Olson
Department of Biology, Carleton University
Tom Nudds opened with the comment that both Kris Rothley and Paul Zorn had thought ahead,
highlighting major issues and evaluating the day‟s presentations against their predefined observations (a
gap analysis of sorts).
Given the problems with systematic design, Rob Vanderkam (Environment Canada) asked, what else is
there? Are the existing problems insurmountable, should we turn our attention to an alternative method,
or is it worthwhile to work out the solutions? Kris Rothley answered that there are existing ways of
dealing with spatial and non-spatial uncertainty and error; they simply need to be incorporated into the
reserve design procedures. Dan Kraus responded that we have to incorporate more expert opinion, and
be transparent regarding the limitations and assumptions of our models. We need to be more specific as
to what kinds of data can be considered „good‟. Our confidence in the model is key to accepting or
rejecting the use of the model.
John Riley (NCC) asked how many systematically selected conservation areas are there that differ from
previous assessments. Can expert-derived locations be just as good? The answer was that there are some
differences, not necessarily extensive though. The shift to data-centric selection (rather than „personal
knowledge‟) is more testable, and produces a rigorous and defensible approach.
Paul Zorn noted that if the confidence or legitimacy of data is questionable, this can reduce the utility of
the model as a planning tool. Criticism of the model can bring down the whole planning process. He
maintained that the solution is to prioritize and focus on key aspects. This is harder to criticize and
planners will be on a stronger footing.
Steve Cumming commented that we need to be specific regarding what data can be considered good
enough, and what isn‟t. He directed a question towards Paul Zorn, regarding what data quality concerns
he had. Paul Zorn cited element occurrence data, and Landsat based Landcover-Vegetation
classification.
Samantha Song (Environment Canada) commented on the social science gap in the planning process.
She felt that this was an opportunity to extend the PRFO workshop concept into this field. The
application of common property theory may provide a rich body of knowledge to draw upon. There was
general agreement to this idea, without more specific discussion.
Bill Stephenson (Parks Canada) commented that the next 20 years will see a generational change in land
ownership in over 80% of southern Ontario. He felt that this was a window of opportunity, as new
owners will be reassessing the land use decisions on these properties, and that this presents an
opportunity to influence these decisions. He stressed the need to explain to people at the local level that
the land has value beyond more traditional means of assessing wealth.
Bill Crins noted that solutions that maximize the efficiency of protected areas (simple representation)
may be useful for pragmatic reasons, but that we should also explore other alternative stopping criteria.

TOP-DOWN VS. BOTTOM UP? WORKING TOWARDS CONSENSUS ON SYSTEMATIC PROTECTED AREAS PLANNING IN ONTARIO
72 | P a g e
He asked if anyone had any suggestions. Kris Rothley responded that it is interesting to look at
minimum sets, but to look at how sensitive these sets are to changes in conservation targets. Choosing a
range of targets may allow testing of reserve flexibility. She stressed the need to compare theory and
data-based approaches.
John Riley commented on the challenges of preserving ecological process. He referred to his work on
the Lands for Life program, which incorporated topographic and GIS information, and held public
consultation through open houses. These had initially focused on terrestrial systems, while most of the
public commentary focused on incorporating waterways into the design. They had to regroup and
rethink their procedures before the final results could be produced. He asked why we cannot classify
aquatic systems and incorporate groundwater into protected area designs. Steve Cumming responded
and noted that different criteria are required for the representation of aquatic systems. He made mention
of the BEACONS project, which tried to manage both aquatic and terrestrial systems. He suggested that
wetlands could serve as a backbone around which to arrange parks and protected areas. This would be
different than protecting headwaters.
Tony Iacobelli mentioned that he liked the idea and terminology of a „backbone‟, and commented on the
idea of preserving „ecosystem services‟, noting that this would be difficult to integrate into conservation
planning. He recalled that John Roff (University of Guelph) developed a plan for marine systems for the
WWF marine program, which emphasized maintenance of benthic, pelagic, and littoral mixing.
Paul Zorn mentioned the social science aspect that „we live on land‟ and referred to our „sense of place‟,
which would need to be further developed for freshwater systems. John Riley commented that under the
Fisheries Act, all fish habitat was equivalent. Anna Baggio (Wildlands League) noted that it would be
good to bring in other disciplines, but that many social scientists “don‟t believe in parks” and that the
situation was “messy”. She then went on to comment that conservation planning in the North will be
different. She mentioned the idea of calling areas „No-Go Zones‟, which would have park-like qualities,
but didn‟t want them referred to as parks.
A comment was made regarding the various degrees of protection available in conservation planning
(no-go zones, buffers), and the commenter asked to see more focus on this. Tony Iacobelli responded
with the idea of matrix management, and the idea of a two-pronged approach of protecting core
biodiversity with good land management in the matrix. He wanted to know what the role of protected
areas management was in this. Mention was made again of High Conservation Value Forests, with the
idea that some proportion of these forests would be designated core protected areas, and the rest
allocated to special management zones. Yolanda Wiersma commented that the key litmus test would be
whether the designated areas (whatever they may be called) serve as an appropriate benchmark to
evaluate management practices.
Jennie Pearce (Pearce and Associates Biological Research) referred to two aspects of Systematic
Conservation Design: a) How do we best synthesize and spatially map a variety of values, noting that we
are not especially good at doing this for the full range of important values? b) How do we best use these
values in the decision making process? She noted that these may be two separate ideas with different
agendas and strategies, and asked for a general response.

SUMMARY OF THE PARKS RESEARCH FORUM OF ONTARIO (PRFO) STATE OF THE ART PROTECTED AREAS DESIGN WORKSHOP, 2006
73 | P a g e
Tom Nudds brought the focus back to Bob Pressey‟s Figure 2 (Appendix C), and noted that we have
effectively addressed the regions assuming immediate implementation, but that we need to address a
more gradual introduction of protected areas. At this, he ceded the floor to Bob Pressey for some
concluding remarks. Bob Pressey remarked that a great deal of ground was covered at the workshop, and
that he could properly address only a couple of points. On the issue of minimum sets, he agreed with the
viewpoints previously expressed, and said that he felt that the direction of C-PLAN and of systematic
conservation planning was moving away from the idea of optimization. He noted that we will rarely, if
ever, know enough about the features to set reliable conservation targets. If we go for minimum sets
using uncertain and minimal targets, we are heading for trouble. The key would be our knowledge of
error propagation. If we cannot guarantee accuracy, then the planning process needs to be precautionary
within the limits of our knowledge. He stressed the inevitable component of subjectivity in the planning
process (which is explicitly not optimal). Any work with stakeholders brings compromise into the
planning process. Even if an optimality tool is used, the final result will rarely (if ever) approximate the
optimal solution. The role of planning in the implementation stage has lots of intriguing aspects. He
commented on the two extremes: 1) no matter what land becomes available, we should only take high
value, high threat areas; 2) take whatever becomes available without consideration. He suggested that a
middle road was the sensible route to take.
He then commented on the idea of triage, and the idea that one shouldn‟t bother focusing on the rare or
threatened features, and instead just focus on the remaining large intact areas. He suggested that we try
to untangle the differences in perspective that drive the opinions of different groups (save everything or
discard the fragments), and that this might work towards a consensus.
He remarked on the disconnect between top-down systematic regional planning, and local municipal and
community planning. The lack of understanding from the two sides is a major problem, he felt, and
arises from the differences in scale, whereby broad extent coarse resolution data can lead to different
priorities compared to fine-scale regional data. We need to work out a method of translating between
these scales.
Finally, he noted that systematic planning may produce the „plan of the day‟, as ecosystems change, data
becomes better resolved, and ground-truthing corrects for map error. External land commitments and
planning may result in the unexpected loss of areas over time. This underlines the values of decision
support systems for adjusting the „plan of the day‟ to fit the new situation. Without a doubt, there will be
some disconnect between what occurs on the computer screen and what occurs or is implemented on the
ground.
Steve Cumming concluded with the urging that spatially explicit, dynamic, process-based models must
be developed, considered, and incorporated into planning decisions to guide matrix management,
monitoring, and responses to climate change. He stressed the need to look outside the planning group to
solicit external expertise in these matters.

TOP-DOWN VS. BOTTOM UP? WORKING TOWARDS CONSENSUS ON SYSTEMATIC PROTECTED AREAS PLANNING IN ONTARIO
74 | P a g e
Appendix H. Augmented “Pressey Steps” with Case Study Rankings
Table 4. This table was developed by Nudds and Wiersma following the Day 1 presentations. The eight
steps come from Pressey‟s presentation; items in italics were added by Nudds and Wiersma. In addition,
Nudds and Wiersma ranked each of the case study presentations against the steps on a three star ranking,
with one star indicating more weakly present, and three stars indicating a strong presence of this
particular design criteria. During the morning breakout session on Day 2, participants were asked to
make modifications to the Pressey Steps and re-evaluate the rankings given, if necessary.
Augmented
Pressey Steps
Boan
&
Kingston
Cumming
Wiersma
&
Nudds
Iacobelli
&
Anderson
Brodribb
&
Kraus
1. Scoping and costing
2. Involve Stakeholders
a) identify excluded areas/conflicts
b) scale commensurability
***
*
* **
*
***
3. Identify Goals
a) matrix management
* * * ** ***
4. Compile Data
a) uncertainty in data
b) assumptions
i) biodiversity pattern
(representation) surrogates
- ecotones
ii) biodiversity (persistence)
process surrogates
iii) EG&S surrogates
c) mapped biodiversity elements
***
*
***
***
*
***
***
***
**
***
***
***
5. Set Conservation Targets
a) Representation
i) %
ii) numbers
b) Persistence
i) qualitative
size
shape
connectivity
replication
ii) quantitative
size
shape
proximity
connectivity
replication
alignment
climate change
***
**
***
***
***
*
*
***
***

SUMMARY OF THE PARKS RESEARCH FORUM OF ONTARIO (PRFO) STATE OF THE ART PROTECTED AREAS DESIGN WORKSHOP, 2006
75 | P a g e
fitness-based (λ)
metapopulation
focal (umbrella,
indicator, keystone,
etc.)
***
6. Assess Existing Conservation Areas ** *** *** * ***
7. Select New Areas *** *** *** ***
8. Implement Conservation Action
a) Retention
b) Tradeoffs
* *
9. Maintain and Monitor
a) active/passive adaptive
management

TOP-DOWN VS. BOTTOM UP? WORKING TOWARDS CONSENSUS ON SYSTEMATIC PROTECTED AREAS PLANNING IN ONTARIO
76 | P a g e
Appendix I. Summary of Day 2 Morning Breakout Sessions
Summarized by: Jennifer Shuter1, Kristyn Ferguson2, Cathy McAllister2
1Department of Integrative Biology, University of Guelph 2Faculty of Environment, University of Waterloo
General Format
The breakout groups focused on the “Pressey Steps” (Table 1) as augmented with additional criteria,
based on the information gleaned from talks the previous day (Table 2). For each of the major steps of
the process of protected areas network design, the various elements were evaluated with respect to their
relative importance, additional “missing” elements were suggested, modifications and adjustments were
made, and in some cases, the order of elements was re-prioritized. There was agreement between the
groups on some issues, but disagreement and diverse opinions on priorities on other issues. Directives
regarding new elements or the rescheduling of existing elements and the data required to address these,
are listed in Table 3; these represent a pooling of the findings from all groups. Where consensus from
the three reporting groups was not achieved, Table 3 reflects the majority opinion. Day 2 of the
workshop had four breakout groups, but only three reports are reflected here, as a written summary from
the fourth group was not submitted.
In one group, a number of people were concerned with the usefulness of this proposed framework, and
were concerned that the framework focuses on academic and theoretical rather than applied studies.
Without knowing who the framework is for, they felt it was difficult to know what issues to examine.
However, the rest of the discussion in this group was conducted assuming this should be a generic,
consistent framework that is useful to all people concerned with protected areas (including politicians,
stakeholders, ENGOs, etc.) with the goal of creating a generic, robust framework to use to identify areas
for management and conservation focus, and to help connect planning and implementation.
In another group, much of the discussion centred around the protected areas planning process for the
“intact” northern boreal area, which was presented by Kingston and Boan on the first day of the
workshop. This specific example of protected areas planning generally was used as a starting point for
discussing each of the various stages, but discussion usually widened to encompass issues which are
broadly applicable to all protected areas planning processes. A third group noted that, overall, the
template was designed so that the steps at the beginning and end of the spine reflected the organizational
aspects of the work, while the less technical aspects could be found in the middle section. It was also
noted that no projects in Ontario have, to date, achieved every part of the highly comprehensive process
outlined in Table 1. Thus, some felt that the specific examples of protected areas planning in Ontario
that were discussed at the workshop do not necessarily reveal the “best practices” represented by the
“Pressey Steps”, nor have they been evaluated with real data or “ground-truthing”. However, it was also
noted that many important Ontario-based projects and approaches (such as “Natural Spaces” or “Lands
for Life”) were not examined at all during the workshop.
In conclusion, there was general consensus that there does not appear to be one good cross-Canada
model. For this reason, the type of model represented by the “Augmented Pressey Steps”, and discussed
throughout the second day of the workshop, could be very useful.

SUMMARY OF THE PARKS RESEARCH FORUM OF ONTARIO (PRFO) STATE OF THE ART PROTECTED AREAS DESIGN WORKSHOP, 2006
77 | P a g e
A. Discussion of a Framework for Protected Areas Network Design: Major Issues
1. Dealing with Uncertainty
One group felt that uncertainty analysis should play a large role throughout the process, but especially in
Step 4 (“Compile Data”). This group felt that the first stage in data compilation should be the
identification of gaps in knowledge, with suggestions on how to fill these gaps. Project managers need to
know which questions about planning and reserve design need to be addressed before proceeding. There
should also be an effort to explicitly identify the value and the degree of confidence that different
stakeholders place in different datasets/types, not only the uncertainty and assumptions associated with
them. Because not all stakeholders understand or feel that scientific data are useful, the relevance of the
data should be articulated, and uncertainty weights assigned (based on stakeholder
acceptance/confidence). Other data types should be included during data compilation (Step 4), such as
data on traditional knowledge, cultural values, and overlapping interests. Such data may or may not be
spatially referenced.
Another group generally agreed that the open acknowledgement of uncertainty with respect to the
accuracy, precision and comprehensiveness of available datasets, as well as model structure and results,
is an important component of the conservation planning process. Although transparency with respect to
uncertainty is important, protected areas planning processes must proceed despite any uncertainty that
might be present. Therefore, measures for dealing with uncertainty must be developed and implemented.
To this end, it was argued that conservation planning must move beyond the mere acknowledgement of
uncertainty, and towards efforts to quantify uncertainty. Such quantification could include the “ground-
truthing” of remotely sensed data, model validation, or testing the sensitivity of results to parameter
estimates and/or conservation targets. Several examples of data-related uncertainty were provided,
including the validity of some of the underlying assumptions inherent in key datasets used to evaluate
representation (i.e., the World Wildlife Fund Canada‟s “Enduring Features” and the OMNR‟s
“Landform-Vegetation” types), known biases in datasets (e.g., observer error in remotely-sensed data
layers, bias towards roads and/or river-based access routes in systematically or incidentally collected
data), and “false absence”, that is data for species or community types when data collection is not
comprehensive (in terms of intensity of search effort and/or extent of geographic area covered).
This particular group agreed upon a general recommendation regarding “uncertainty”, which they felt
was applicable to Step 4 (“Compile data”), Step 6 (“Assess existing conservation areas”) and Step 7
(“Select new areas”) of the systematic protected areas planning process (Table 1). The general
recommendation was that those efforts to “deal with uncertainty” must be transparent and must extend
well beyond the acknowledgement of its existence, to include model evaluation and sensitivity testing,
data verification, and surrogacy evaluation. The question of “how much uncertainty is too much?” in
relation to data or model use was also raised. Participants agreed that the answers to such questions are
situation-specific, and that both expert and management opinions would be needed to make such
decisions.
Finally, it was cautioned that despite the positive aspects of acknowledging and dealing with
uncertainty, it is important to anticipate and develop an approach to dealing with negative reactions to
uncertainty on the part of stakeholders and/or the general public. People often perceive scientists and

TOP-DOWN VS. BOTTOM UP? WORKING TOWARDS CONSENSUS ON SYSTEMATIC PROTECTED AREAS PLANNING IN ONTARIO
78 | P a g e
science-based knowledge as providing truth and certainty. Thus, by openly acknowledging the existence
of uncertainty in relation to data, models, or ecological theory, partners run the risk of undermining
stakeholder and public confidence in the planning process.
2. Developing and Implementing a Communications Plan
All three groups reported that the importance of establishing and maintaining good communications
with stakeholders and relevant government organizations (e.g., municipal, provincial, federal and First
Nations) at the earliest stage of the protected areas planning process could not be overstated, and that
this issue should receive greater attention in the “spine”. One group suggested that Step 2 (“Involve
stakeholders”) be modified to include stakeholder involvement throughout the entire process. There was
some discussion about at what scales stakeholders can realistically be involved in such projects, and
where it is indeed meaningful to include them. One participant who had done work in Australia noted
that frequent stakeholder meetings were held for groups at the multiprovince level (about twice the size
of an Ontario ecoregion) at least once a year per project. Another participant noted that in British
Columbia and Alberta, stakeholders were extremely involved in the process, to the point of helping to
pick candidate sites for conservation. It was thought that both of these ideas could be applied in Ontario.
Another group suggested modifying Step 2 to include an identification of expertise gaps. Scientific
authorities, on-the-ground experts, and those with technical expertise and general knowledge should be
identified and involved in the process. This inclusion would be necessary to complete the rest of the
framework, as these experts would be able to help assess the situation and provide reasonable solutions.
As well, this group felt that it would be strategic to engage a professional facilitator to direct and
promote ongoing stewardship of the project. Another group questioned whether “scale
commensurability” should be included as a subheading in Step 2, but acknowledged that overlaying data
generated at different scales is important, since small scale organizations, governments or communities
tend not to look at larger scale studies. However, this group felt that scale commensurability should be
listed under Step 3 (“Identify Goals”) and not as a part of Step 2 (“Involving Stakeholders”).
Although the importance of including interested locals and non-governmental organizations in the
planning process has been increasingly recognized, it was argued that ensuring that all the relevant
levels of government accept and support the protected area planning process is of equal, if not greater,
importance. Such support could translate into earlier and more comprehensive approval of
recommendations regarding new protected areas, as well as a more rapid implementation process. For
example, it was noted that the approach adopted by Ontario Parks ecologists in planning for Ontario‟s
intact northern boreal forest thus far has met with varying levels of acceptance by different stakeholders
and governmental divisions. To ensure effective communications, it was recommended that a formal
“Communications Plan” be developed, for conveying the importance of protected areas planning and the
benefits associated with such an initiative to all relevant governmental and non-governmental agencies
and stakeholders. It was further recommended that this take place during the earliest stage of the
planning process (see Table 1), and that plan development should include efforts to identify and employ
language sets that are appropriate for effective communication with all relevant parties.
It was noted that establishing and maintaining effective communications with First Nations could be
particularly challenging, and that building a good relationship requires developing trust and
demonstrating shared concern for sustainable resource use, and for the future of the lands under
consideration. The collaboration between the Western Newfoundland Model Forest and the Innu Nation

SUMMARY OF THE PARKS RESEARCH FORUM OF ONTARIO (PRFO) STATE OF THE ART PROTECTED AREAS DESIGN WORKSHOP, 2006
79 | P a g e
was mentioned as an example of successful relationship-building between an alliance that includes
multiple partners (including various government agencies, industry and local stakeholder groups) and
First Nations.
The importance of establishing effective communication at the local level was also discussed. It was
suggested that the key to local acceptance of new protected areas is implementing education and
stewardship programs that demonstrate how reserves can provide tangible benefits to local communities
(e.g., eco-tourism related opportunities), despite associated restrictions on traditional land uses and/or
seasonal economic activities. Finally, it was argued that even if a comprehensive communications plan
is developed, and a scientifically defensible approach for assessing existing protected areas and selecting
new ones is implemented, the success of a protected areas planning initiative is primarily dependent on
the ability to take advantage of political opportunities and a supportive social climate.
3. Non-Protected Area Tools and Matrix Management
One group pointed out that the process for designing protected area networks as outlined in Table 2
appears to be biased towards landscapes with multiple land use pressures, permanent land conversion
and high levels of fragmentation. It was argued that in a planning context like Ontario‟s northern boreal
region, where the natural landscape is relatively intact, matrix management may be of equal or greater
importance than the establishment of a protected areas network. In a system driven by large-scale
disturbance, focusing on protected areas as a primary means of biodiversity conservation fails to
recognize the dynamic nature of the system. In the planning process for Ontario‟s “intact” northern
boreal region, efforts to account for the dynamic nature of the boreal ecosystem in the planning process
have focused on a qualitative assessment of the size and shape of protected areas in relation to the
landscape patterns and structure produced by the natural fire-driven disturbance regime, while the non-
protected matrix was incorporated by considering the connectivity of existing and candidate protected
areas. Examples of alternative approaches that prioritize matrix management include the creation of
“reserve complexes” consisting of “core” protected areas that receive strong protection, and surrounding
areas that receive lower levels of protection (e.g., UNESCO Biosphere Reserves), and the creation of
legal mechanisms that enable some level of protection for ecological areas where social and/or political
pressures prevent official protected area designation. Another group felt that Step 3 (“Identify Goals”)
should include the identification of excluded areas, as well as areas associated with conflicting
stakeholder objectives, which is initially mentioned in Step 2 (“Involve stakeholders”). There was some
debate around the inclusion of stakeholders in the selection of excluded areas, since bringing a large
number of people to the table might undermine the process and limit potential conservation
opportunities.
The difficulties of incorporating connectivity assessments into protected areas network design were also
discussed in one group. Specific challenges mentioned include the species-specific nature of “functional
connectivity” assessments, and the lack of certainty regarding the practical application of such
assessments in relation to reserve design. Group members recommended that in addition to traditional
protected areas, non-protected areas as tools for matrix management should be prioritized at Step 3
(“Identify goals”) and Step 7 (“Select new areas”) in the planning process (see Table 1). It was also
recommended that matrix-related attributes be considered when selecting new protected areas (i.e., when
determining total number, size, shape and location).
TOP-DOWN VS. BOTTOM UP? WORKING TOWARDS CONSENSUS ON SYSTEMATIC PROTECTED AREAS PLANNING IN ONTARIO
80 | P a g e
In a similar vein, another group discussed the issue of conservation areas networks versus conservation
systems (“blobs on the landscape”). The particular template being addressed in this discussion works
with conservation systems, but it was determined that it could and should begin to address connectivity
and networks (e.g., metapopulations). It was thought that genetic considerations could fit into the
fitness-based and metapopulation elements, and were something that should be further addressed in
conservation planning, perhaps as part of matrix management. Matrix management is currently part of
Step 3 (“Identify goals”), but this group felt it should also be prioritized under Step 5 (“Set conservation
targets”).
With regard to Step 3 (“Identification of Goals”), one group thought that adding another “assumptions”
subheading to this stage would aid in making the spine more complete. This was based on the fact that
assumptions are inherent at the commencement of any such project. However, it was noted that the
“assumptions” subheading currently included under Step 4 (“Compilation of Data”) was quite complete
and fit in well with the overall process. This group felt that the subheading could be changed to
“Assumptions and Limitations”, since it was noted that the identification of limitations was not
explicitly addressed in the spine and definitely needs to be included.
The third group felt that Step 3 (“Identify goals”) should also include a clear goal in terms of biological
achievement, and should emphasize optimizing protection, rather than finding minima for survival. This
group discussed at length the value of finding optima versus finding minima. Some argued that the goal
should be optimizing protected areas, instead of determining the minimum required areas for preserving
biodiversity. Others argued that this approach is not possible in urban settings, but may be possible in a
“reverse matrix” situation (e.g. Schmiegelow et al. 2006), such as in the north. It was noted that the
boreal areas versus the southern areas of Ontario come with entirely different conservation challenges.
In the south, goals must take increased fragmentation into account. In the north, the model should
ideally be one of nodes of development, rather than nodes of protection. This group felt that it is
important to remember that creating the protected area is not necessarily the main goal. The goal is
really what the area represents, such as protecting biodiversity. Therefore, discussions should go beyond
the protected area itself, to include a discussion about how the surrounding region can affect the
ecological integrity of the protected area. However, this group felt that this kind of scope could limit the
amount of effort that actually goes into protecting the protected areas. There is usually a range of
management options. Thus, there is a need to start with a very clear goal, and to examine the values of
those involved in order to determine to what extent goals can be achieved. Because of these factors, this
group felt that Step 3 (“Identify goals”) is a critical stage in the process.
4. Role of Systematic Conservation Planning Tools and Associated Issues
Members of one group agreed that Systematic Conservation Planning Tools, such as C-PLAN and
SITES, can have valuable roles in protected areas planning processes that involve multiple governments
(e.g., provincial, municipal, First Nations) and/or stakeholders. For example, they enable the visual
representation and explicit consideration of a variety of data types, and allow users to quantify the
contribution that specific locations could make to a protected areas network. They also provide the
opportunity for government and non-government partners in conservation planning processes to identify
gaps in existing protected area networks, and to compare and rank opportunities for acquiring new
reserves, as they arise.

SUMMARY OF THE PARKS RESEARCH FORUM OF ONTARIO (PRFO) STATE OF THE ART PROTECTED AREAS DESIGN WORKSHOP, 2006
81 | P a g e
Despite the value of Systematic Conservation Planning Tools, members of one group agreed that there
are potential difficulties and several issues that must be considered when using them. It was argued that
site selection algorithms or other models used in the conservation planning process should have a
transparent “lineage”, so that it is possible to determine why specific locations are highlighted as being
significant for protection in model outputs. Although conservation planning algorithms might provide
accurate results at the landscape scale, it was pointed out that local stakeholders often focus on specific
geographic locations, and if model results fail to correspond with prior expectations regarding the
conservation values of a local site, this could lead to blanket rejection of model outputs. C-PLAN was
mentioned as an example of a tool with a transparent “lineage”, but it was also noted that it does take
some effort and familiarity with the tool to trace this “lineage”.
Some concerns were raised about tools that require users to commit to explicit quantitative targets (e.g.,
C-PLAN), when the data available are not of sufficient quantity or quality to support such a
commitment. It was pointed out that participants in planning processes often get “caught up” in debates
regarding the appropriateness of specific target values, but that in C-PLAN, the ordinal ranking of sites
in relation to conservation value should remain roughly the same, regardless of actual target value.
Group members also provided several potential approaches for dealing with uncertainty regarding the
validity of quantitative targets, while continuing to use Systematic Conservation Planning Tools. For
example, C-PLAN allows the user to include and consider GIS-based “informing layers”, which can be
visually overlaid with the results of irreplaceability analyses (which are conducted for features that are
appropriate for quantitative target-setting). In the C-PLAN-based planning process for Ontario‟s intact
northern boreal, much of the data considered have been incorporated as target-free “informing layers”,
while only a few are considered appropriate for explicit target-setting. Other approaches for dealing with
target-related uncertainty include evaluating the sensitivity of site selection algorithm outputs to
variation in the value of quantitative targets and/or the number and type of features considered;
comparing the results of models with different structure and/or target values to determine which sites are
consistently identified as being important; and using decision support tools to implement data-free rule
sets to evaluate conservation value (e.g., rules concerning size, shape, location, acquisition costs,
impending threats, landscape context, etc.). Group members generally acknowledged that explicit target-
setting will always be a difficult part of conservation planning processes, and recommended that
uncertainty regarding targets be openly acknowledged and dealt with via sensitivity analyses and
comparisons of multiple model runs. They further recommended that explicit targets only be assigned
when there is a defensible rationale for doing so (see Table 1, Step 5 “Set conservation targets”).
Another group felt that Step 5 should include a better analysis of resilience, instead of only persistence.
This may be accomplished by adding a “threats and vulnerabilities” section. There could also be another
category in Step 5 assigned to “special elements” as conservation targets, which would include things
such as cultural values. Issues related to persistence and potential threats and vulnerabilities should also
be considered in Step 8 (“Implement Conservation Action”).
A third group noted that it was important to reconcile the representation units of percent vs. number to
include both measures of ecosystem representation and species representation. This group felt that the
issues of persistence and representation (subheadings under Step 5) could be integrated, beginning with
persistence of both ecosystem and species. Persistence is a difficult issue to put a value on, as
probabilities of persistence are constantly changing, and are affected by factors such as disturbance

TOP-DOWN VS. BOTTOM UP? WORKING TOWARDS CONSENSUS ON SYSTEMATIC PROTECTED AREAS PLANNING IN ONTARIO
82 | P a g e
regimes. This group felt that the wide discrepancies in estimates of minimum areas for persistence
between experts were cause for concern, and concluded that persistence goals need to be identified
upfront (e.g., if a massive scale effort cannot be undertaken, this should be explicitly stated). For
example, since disturbance regimes cannot be predicted with 100% certainty/accuracy, and past methods
by which to determine the size of areas which should be protected are becoming archaic, emphasis
should be placed on averaging data across large landscapes, or putting more focus on keystone species.
In one group, the issue of climate change arose during the discussion regarding persistence. While work
on climate change research is very intensive, it is something which is absolutely necessary. The Nature
Conservancy in the United States has been applying some climate change modeling to landscapes, but
the results have been very limited, especially when trying to answer the question: what is a persistent
landscape? The potential impacts of climate change are not woven into the vast majority of conservation
plans, but there has been some progress in this area, and it should be given more attention in the future.
Most of the discussion in one group focused on decision support tools designed to evaluate the
conservation value of different geographic locations, based on their current state (as indicated by a
variety of available data types), and the state of the existing protected areas network. Several group
members mentioned the potential contribution of successional models (such as OMNR‟s “B-FOLDS”),
in terms of enabling the assessment of the future conservation value of existing and candidate reserves.
Another participant cautioned that the stochasticity inherent in real successional processes means that
successional modelling outputs are relatively uninformative at the site-specific scale, and that their value
is in the landscape scale characterizations that they provide. Finally, group members emphasized the
importance of communicating with and including all stakeholders/planning partners when selecting and
implementing any conservation planning tools (see Table 1, Step 7 “Select new areas”). Criteria for
selecting areas of high value should be explicitly specified, and areas of high importance should be
identified and prioritized for conservation.
5. Role of Different Data Types and Associated Issues
The role of different data and knowledge types and the issues surrounding their use were not highlighted
as separate issues for discussion, but opinions and comments that are relevant to these topics were
expressed throughout the course of the discussion in all groups. For the purposes of this summary, the
salient points were grouped together by data/knowledge type.
a) Expert Opinion
It was suggested that the incorporation of expert opinion into the planning process can be a valuable
approach for dealing with uncertainty. It can be used to evaluate the validity of the results of data-based
models, and it can also be relied upon as an alternative source of knowledge when there is a paucity of
empirical data. For example, expert workshops that focused on identifying the specific conservation
needs of two focal species (forest-dwelling woodland caribou and wolverine) were conducted as part of
the conservation planning process for Ontario‟s northern boreal region. Although expert
recommendations have been demonstrated to be valuable, it was noted that it can be difficult for experts
to make the connection between theoretical ecological predictions and practical applications for
management (i.e., providing a “best guess”). A number of recent papers published in the peer-reviewed
literature attempted to compare expert opinion with the outputs of systematic modeling exercises.

SUMMARY OF THE PARKS RESEARCH FORUM OF ONTARIO (PRFO) STATE OF THE ART PROTECTED AREAS DESIGN WORKSHOP, 2006
83 | P a g e
Several of these demonstrated strong similarities in terms of specific locations identified as having high
conservation value using the two approaches. Finally, it was cautioned that stakeholders might have
difficulty accepting expert opinion in the absence of additional, location-specific supporting evidence.
b) Local Knowledge
Beyond its ecological value, the incorporation of local knowledge into conservation planning can be
valuable for encouraging stakeholder participation, and for fostering local and stakeholder acceptance of
the protected areas planning process. The Traditional Ecological Knowledge (TEK) of First Nation
members was discussed as part of a “bottom-up” process. Thus, although it can be very valuable at the
local scale, it tends to be less informative at the landscape level. Efforts to integrate TEK, local
knowledge, or “expert opinion” with “Western science”-based empirical knowledge gathered at local,
regional, or landscape scales were widely recognized as being important, but it was also recognized that
such integration can be difficult to achieve in practice. Expert opinion, TEK and/or local knowledge
have been integrated into systematic conservation planning processes to validate model outputs. As well,
local and traditional knowledge can been incorporated directly into the modeling process by using it to
define “prior distributions” in Bayesian approaches to modeling or data analysis, and updating those
priors with empirical data.
One group spent some time debating whether cultural values should be included in conservation. Some
argued that biodiversity should be prioritized independently of any consideration of cultural values.
However, others believed the inclusion of social factors could actually facilitate environmental
conservation. In addition, a few argued for the conservation of culture for its own sake. Some felt that
conserving culture is a part of conserving diversity, and that conservation planning can not be done in
isolation of social factors. Biodiversity and cultural concerns can be completely overlapping, and may
not be easily separated. On the other hand, others questioned whether the inclusion of culture could limit
the effectiveness of biological conservation for biodiversity.
c) Focal, Indicator and Umbrella Species
Species-specific considerations and targets for designing protected areas networks received brief
mention by one group in terms of their role in protected areas network design, and in terms of the stage
of the planning process at which they should be considered. Species-specific data can play a role in
considering the space requirements of wide-ranging species in decisions regarding protected area size.
As well, species-specific data may be useful in considering the habitat requirements of “Species-at-
Risk” (SAR) in relation to decisions regarding protected area composition (e.g., vegetation-landform
classes, aquatic features), when a given SAR experiences habitat-related threats. Species-specific
connectivity assessments (based on habitat requirements and movement behaviour) can also be
incorporated into decisions regarding network configuration and matrix management. Participants
agreed that decisions regarding appropriate focal, indicator and umbrella species and assessments of
species-specific data availability should be made at Step 3 (“Identify goals”) and Step 4 (“Compile
data”) of the process, rather than Step 5 (“Set conservation targets”) (see Table 1).

TOP-DOWN VS. BOTTOM UP? WORKING TOWARDS CONSENSUS ON SYSTEMATIC PROTECTED AREAS PLANNING IN ONTARIO
84 | P a g e
6. Additional Issues/Recommendations
Some brief comments and recommendations regarding the “spine” in general were offered by most of
the breakout groups, and are summarized below.
a) Monitoring
All groups highlighted the importance of monitoring as part of the planning process. One group
recommended that a detailed plan for monitoring be developed at a much earlier stage of the planning
process (i.e., Step 3). This plan should include clear, defensible monitoring objectives, as well as a
general plan for implementing those objectives. One group noted that indicators (i.e. the actual
features/processes being measured on the landscape) are considered in planning stages, but are often
ignored in monitoring. They felt that in Canada, targets are addressed rather than indicators being used.
That is, relatively vague targets (e.g., “maintain viable populations”) are used when specific indicators
(e.g., “maintain a population of size X in area Y”) are more appropriate. This is potentially problematic
because of issues associated with the ability to set targets in ecosystems which differ greatly from one
another. As well, obtaining the data necessary to set targets may be more difficult than obtaining data for
indicators and monitoring.
Another group specified that ground-truthing and performance indicators need to be included during the
maintenance and monitoring of a new site (Step 9 “Maintain and monitor”), and that monitoring should
be performed at a variety of scales. Evaluating and reporting procedures should also be included as part
of a feedback loop. These additions would allow for better understanding of the effectiveness of
methods for future projects. A third group unanimously agreed that adaptive management is absolutely
necessary in conservation planning, since ecosystems are so variable and dynamic by nature. This group
also suggested that plans should be identified up front as being “adaptive” or “flexible”, and that plans
should be managed in this spirit throughout their existence.
b) Adaptive Management
The groups all generally agreed that internal feedback loops should exist within and between stages in
the protected area network design process, as the two-dimension setup of the proposed “spine” could be
seen as a limitation, since planning is not a linear process. Some examples of where feedback loops
could be explicitly incorporated into the spine include a loop involving the first three stages. Costing and
scoping may not be possible until after goals are identified, and stakeholders may not be identifiable
until goals are established. Step 4 (“Compile data”) and Step 5 (“Set conservation targets”) should
contain internal adaptive management feedback loops (i.e., data assessment prior to modelling, model
evaluation, target sensitivity), and there should also be feedback loops between different stages (e.g.,
monitoring [Step 9] should inform updated assessment of existing protected areas [Step 6]). It was
recommended that both within- and between-stage feedback loops be explicitly recognized in the
“spine” (see Table 1).
c) Implementation of Conservation Action
Group members agreed that Step 8 (“Implement Conservation Action”) of the “spine” is a stage of the
process that generally unfolds over a very long time period, and can be extremely difficult to negotiate.

SUMMARY OF THE PARKS RESEARCH FORUM OF ONTARIO (PRFO) STATE OF THE ART PROTECTED AREAS DESIGN WORKSHOP, 2006
85 | P a g e
They felt that explicit acknowledgement of the “messiness” and difficulty associated with this stage was
necessary (Table 1). Another group agreed that stakeholder involvement should be stressed at Step 8
(“Implement conservation action”). Since involving stakeholders throughout the process has been seen
to be quite successful, this group recommended their continued involvement (with perhaps even broader
community involvement) at this phase of planning. This group also felt that Step 8 (“Implement
conservation action”) should recognize that while a science-based approach tends to shape the process
initially, the planning process changes and modifies a great deal of the initial work or recommendations.
Thus, this group felt it would be beneficial to include a subheading under Step 8 that could direct that
planning principles should be incorporated into an approach which remains mostly scientific.
One group decided that there should be one final heading in the process that could facilitate conservation
planning. They proposed a tenth stage to recognize the need to pool and share all data and methods,
making every methodology and project outcome transparent, and easily accessed by those outside the
effort. Increasing data access and organization, perhaps even to society in general, would lessen the need
for experts to obtain and interpret data. If this initiative could be implemented on a national level,
widespread data access would allow sharing of vital conservation planning information between
conservation groups, and better inform the entire process.
B. Discussion of Data-Related Needs and Issues at Multiple Scales
One of the major topics of discussion for several groups was the concept of scale. Scale was felt to be a
fundamental concept that should be addressed at every stage of the design process. Determining the
scale of a proposed project can help to identify stakeholders, determine realistic goals and set
appropriate conservation targets, and is one of the keys to making this template an applicable
framework. The breakout groups identified what they saw as being the major data-related needs and
issues for multiple spatial scales and/or jurisdictional contexts, including: local/fine scale; boreal-
specific; Ontario-specific; and Federal. These “Data Requirements & Issues” are listed in Table 2.
One group felt that stratification across scales (i.e., landscape, region, site) should be included explicitly
in the spine, but were uncertain as to where it might fit. This group felt that stratification of scale beyond
considering landscapes or ecodistricts (e.g., including goals for species, ecosystems, and landscapes) can
help put a focus on biodiversity, or focal species. As well, this group predicted that there would be
redundancy built into stratification.
1. Fine Scale Needs and Issues
It was suggested that the analysis of fine resolution data can provide additional insights beyond those
provided by analyses conducted using only coarse resolution data. For example, fine resolution data can
be more appropriate for analyses conducted at small spatial extents. Local and Traditional Ecological
Knowledge generally fall into the “fine scale” category and thus, the stages at which fine scale data are
collected (e.g., for assessing the conservation value of existing reserves or candidate sites, during
monitoring programs, etc.), constitute a major opportunity for First Nations and local stakeholder
involvement. It was also emphasized that decisions regarding which decision support tools are
appropriate for a given conservation planning scenario should be made with local stakeholder
involvement. Finally, it was noted that information regarding specific opportunities for land acquisition
is fine scale in nature, and is crucial to the expansion of protected area networks.

TOP-DOWN VS. BOTTOM UP? WORKING TOWARDS CONSENSUS ON SYSTEMATIC PROTECTED AREAS PLANNING IN ONTARIO
86 | P a g e
Another group noted that the species, ecosystem, and landscape levels are common levels of analysis in
conservation planning, but it was thought that more emphasis could be placed on genetic diversity, as
well as on endemic and disjunct species. This group also thought that fine scale and coarse scale target
applications should be overlaid to help focus the work, an approach which acknowledges the values of
both methods. The group noted that while classing and conserving irreplaceable vegetation types has
been highly successful, there has been little or no emphasis on irreplaceable landforms. Thus, this group
felt that at a fine-scale, one approach could be to focus more closely on landforms to find unusual
geomorphological constructs, then determine which are irreplaceable, and use them as a basis for
building a conservation network.
2. Boreal-Specific Needs and Issues
It was argued that the differences between landscapes that are relatively “intact” (e.g., Ontario‟s
northern boreal region), and those that are highly developed and contain highly fragmented natural areas
are substantial enough to justify the use of conservation frameworks that are fundamentally different.
Conservation planning initiatives in landscapes subject to intensive development pressures often focus
on identifying and protecting natural “core” areas, which are embedded in a highly developed matrix.
For an intact landscape, it was suggested that a “reverse matrix” framework for conservation planning is
more appropriate (Schmiegelow et al. 2006). Under this approach, widely scattered centres of human
activity would be viewed as “cores”, while conservation efforts should be focused primarily on
sustainable management of the surrounding natural “matrix”. In the latter context, matrix management
requires the development of size guidelines for major anthropogenic disturbances and protected areas,
which are derived from natural disturbance data and species-specific minimum area requirements. Better
data are needed on the habitat requirements of organisms selected as focal species (e.g., forest-dwelling
woodland caribou and wolverine in Ontario‟s boreal region), and more data could be obtained on guilds
that are relatively easy to sample (e.g., forest birds). Assessment of the effectiveness of surrogates of
biodiversity was also identified as an important “need” for the boreal context, and for all conservation
planning initiatives.
Some of the difficulties associated with improving the quality of species-specific and community-level
data were discussed, including the financial costs associated with implementing comprehensive studies
in large and remote areas, and sampling regimes that are biased towards access routes (e.g., logging
roads, navigable rivers). Potential approaches for dealing with these difficulties were also offered;
including the completion of “pilot projects” designed to quantify the magnitude of bias present in
various sampling regimes, and the coordination of goals and priorities amongst the different government
agencies/divisions that have some jurisdiction over protected areas or the managed landbase. In the
current Ontario context, the OMNR is attempting to apply an adaptive management approach in the
implementation of “Natural Disturbance Emulation Guidelines” for forest management; however,
Ontario Parks is not included as a regular, direct participant in the forest management planning process.
In Ontario, any effort to coordinate the goals and objectives of government agencies would require the
development of active working relationships between Ontario Parks, the rest of OMNR, Parks Canada,
and others. Other data needs that were identified as boreal-specific for conservation planning include
data relating to hydrology, particularly headwaters and topography (e.g., heights of land).

SUMMARY OF THE PARKS RESEARCH FORUM OF ONTARIO (PRFO) STATE OF THE ART PROTECTED AREAS DESIGN WORKSHOP, 2006
87 | P a g e
Finally, one group highlighted the importance of integrating traditional and scientific approaches to
planning and management in the Boreal, and acknowledged that while this might be challenging, it is
absolutely essential given the needs and lives of people in Boreal communities.
3. Ontario-Specific Needs and Issues
Group members agreed that differences in ecology, land use patterns, threats and institutional structures
in different regions of Ontario necessitate different approaches to protected area network design and
conservation planning. Three general regions were recognized, (Southern Ontario, the “Area of the
Undertaking”, and the region north of the currently allocated forest), and it was suggested that the basic
stages in the “template for protected area network design” need to be tailored to the different
circumstances (e.g., stakeholders, opportunities, etc.) and institutional structures that exist in each of the
regions.
One group noted that the type of conservation planning discussed at the workshop has not yet been
validated as legitimate, fundable or project-based work. The only similar program in North America is
the U.S. Gap Analysis Program, which tends to be more focused on mapping than on selecting
appropriate protected area habitat. This group felt that a framework is needed to support the information,
databases, and projects on conservation and biodiversity planning in Ontario. The recently-completed
work in Ontario to assign IUCN categories to protected areas will be useful. It was determined that this
should remain a priority due to the great effect it ultimately will have on conservation efforts in Ontario.
This group also noted a distinct lack of political and public support overall for conservation projects, so
a focus in Ontario to build support would be quite beneficial. Finally, it was noted that while there have
been some successes on public lands in Ontario, conservation efforts on private lands are limited and
should be explicitly addressed explicitly as soon as possible.
4. Federal Context Needs and Issues
The major issue raised in relation to the federal context was that of data availability and the need for
improving data-sharing, both within and between governmental agencies and external partners. A group
member suggested that the role of the federal government in conservation planning should include the
facilitation of data access between relevant governmental agencies and non-governmental partners.
Another participant disagreed, arguing that Provincial and Territorial governments are the major
custodians of natural resource-related data, and that federal agencies such as Parks Canada often rely
heavily on data collected by provincial government agencies. Several examples of informative data
collected at the federal level were mentioned, including detailed census and agricultural data (collected
by Statistics Canada) and climate data (collected by Environment Canada).
It was generally acknowledged that coarse resolution data of all types is relatively easy to access, but the
process for accessing finer resolution data can be frustrating due to lengthy waiting times and high user
fees. Group members generally acknowledged the need for the development of formal mechanisms to
facilitate data-sharing between different levels of government, as well as non-governmental
stakeholders. It was stated that although Land Information Ontario (LIO) was established to improve
inter-agency data access, it has yet to achieve an adequate level of progress in this area (high user fees
were mentioned as a major problem). The government of Newfoundland and Labrador was mentioned

TOP-DOWN VS. BOTTOM UP? WORKING TOWARDS CONSENSUS ON SYSTEMATIC PROTECTED AREAS PLANNING IN ONTARIO
88 | P a g e
as a positive example of inter-agency data-sharing at the provincial level (i.e., different governmental
departments are able to access each others‟ data relatively freely).
5. Future Directions
The future direction of protected areas network design at both the provincial and federal level was
briefly discussed. It was stated that Australia is still far ahead of Ontario in terms of the progressive
nature of their approach to protected area network design, and that Ontario would be well-advised to
continue to follow Australia‟s lead in terms of their approach to systematic conservation planning. In
terms of the role of the federal government in future expansions of Canada‟s protected areas network, it
was stated that the primary mandate of Parks Canada would be to support provincial efforts to select and
regulate new protected areas. Major assessments of the existing protected areas network and acquisitions
of new reserves are likely to be initiated at the provincial level.

SUMMARY OF THE PARKS RESEARCH FORUM OF ONTARIO (PRFO) STATE OF THE ART PROTECTED AREAS DESIGN WORKSHOP, 2006
89 | P a g e
Appendix J. Summary of Presentation by Crins and Davis
Summarized by: Yolanda Wiersma
Department of Biology, Memorial University
Background
The Ontario Ministry of Natural Resources‟ approach to life sciences representation was introduced in
the late 1990s. However, the OMNR has been actively engaged with protected areas system planning
since the 1970s. Protected areas system planning in this early era (1970s to early 1980s) followed life
science and earth science frameworks, with design principles based on island biogeography theory. Site
district reports were used to identify protected areas and Areas of Natural and Scientific Interest
(ANSIs). In the late 1980s and early 1990s, crown land use planning became driven by the class
environmental assessment for timber management on crown lands. The late 1990s saw a flurry of
activity to identify and delineate new protected areas under the “Lands for Life” planning process. The
identification of important representative sites following the approach described here has been used in
various planning processes, including “Lands for Life” (where it helped select a suite of 378 protected
areas), FSC Forest Certification exercises, the “Room to Grow” initiative and currently, in the Northern
Boreal Initiative (NBI), north of the “Area of Undertaking”.
The current approach to identifying representative sites is based on ecological representation at the level
of the ecodistrict (Figure 3). Landform/vegetation (L/V) associations are used as the biodiversity
surrogate, and the methods used to identify priority areas are designed to follow standards of scientific
rigour and reproducibility. Ecologically sustainable management of the intervening lands (matrix)
outside of the protected areas is assumed. Within each ecodistrict, the minimum representation threshold
is at least 1% or 50 hectares of each L/V association. Those L/V associations with less protection than
this minimum are identified as gaps in representation. This approach forms the basis of a province-wide
system, and is based on the assumption that samples of current diversity will meet representation needs.
The whole land base is analyzed, regardless of tenure; land tenure issues are addressed as potential
locations for protected areas are identified. It should be stressed that the 1%/50 ha guideline is a
minimum for representation, and is not considered adequate for long-term persistence. Potential
weaknesses of the L/V approach are that it makes use of coarse-scale data from a variety of sources and
scales (see Methods below), and it does not include species data. Representation of aquatic features (an
important and abundant ecosystem in northern Ontario) is done on an ad hoc basis, and the method does
not incorporate a dynamic/temporal component.
Methods
OMNR developed a new software tool, GapTool, in 2004-2005 to assist with the automation of the L/V
representation assessment. GapTool is written using Visual Basic and Arc Objects languages, and is
designed to extend the capabilities of ArcGIS. It was developed by OMNR with input from ESSA
Technologies Ltd. which conducted a needs analysis. Programming and technical development were
contracted to Cuesta Systems, Inc. of Burlington, Ontario.

TOP-DOWN VS. BOTTOM UP? WORKING TOWARDS CONSENSUS ON SYSTEMATIC PROTECTED AREAS PLANNING IN ONTARIO
90 | P a g e
Best available data sets were used as inputs into GapTool. Given the varied knowledge and mapping
history within Ontario, data sets vary across the province. For example, landform elements are based on
Surficial Geology data in southern Ontario, and Quaternary Geology data in the north (Figure 4).
Similarly, best available vegetation data sets include Landcover 28 (based on remotely sensed imagery
from 1986-1997) in southern Ontario, Landcover 2000 in the far north, and Forest Resource Inventory
(FRI) data in the Area of Undertaking (in central Ontario) (Figure 5). These data sets were re-
categorized to generate provincial landform (Figure 6) and vegetation classes (Figure 7), which were
then overlaid to create L/V associations.
Results
GapTool was run on the L/V data for all 71 ecodistricts in Ontario, to identify those L/V associations
that were under-represented in each ecodistrict (Figure 8). The map generated from these analyses can
be used in conjunction with reserve-planning software such as C-PLAN or MARXAN, along with data
on landscape/species diversity (where available), ecological functions, special features (rare plants,
specialized habitats, etc.), and areas with economic value (e.g., wood supply, roads, mineral potential).
GapTool can be used to assess the effectiveness of alternative scenarios in contributing to the filling of
gaps in representation, and can assist in decision making about which suite of potential areas best
represents the L/V associations.
Lessons and Limitations
The explicit gap analysis method that OMNR has developed has improved client understanding of the
importance of representation targets, but areas of misinterpretation remain. One commonly held
perception is that the method presented here does everything (boundary design, incorporation of land
value considerations, etc.), which it does not. Many have interpreted the minimum thresholds as
guidelines for adequacy of representation, when in fact they should be viewed only as minima. Some
stakeholders are concerned that the method will yield “over-representation”, while others suggest that
more ecosystem-specific thresholds are needed.

SUMMARY OF THE PARKS RESEARCH FORUM OF ONTARIO (PRFO) STATE OF THE ART PROTECTED AREAS DESIGN WORKSHOP, 2006
91 | P a g e
Figure 3. Map of the ecozones, ecoregions, and ecodistricts of Ontario. There are 71 ecodistricts in
Ontario, which are the target unit for the OMNR‟s representation analysis.
Figure 3. Map of the ecoregions, ecozones, and ecodistricts of Ontario. There are 71 ecodistricts in
Ontario, which are the target unit for the OMNR‟s representation analysis.

TOP-DOWN VS. BOTTOM UP? WORKING TOWARDS CONSENSUS ON SYSTEMATIC PROTECTED AREAS PLANNING IN ONTARIO
92 | P a g e
Figure 4. Map showing data sources for best available landform data sets in Ontario.

SUMMARY OF THE PARKS RESEARCH FORUM OF ONTARIO (PRFO) STATE OF THE ART PROTECTED AREAS DESIGN WORKSHOP, 2006
93 | P a g e
Figure 5. Map showing best available vegetation data sets in Ontario.

TOP-DOWN VS. BOTTOM UP? WORKING TOWARDS CONSENSUS ON SYSTEMATIC PROTECTED AREAS PLANNING IN ONTARIO
94 | P a g e
Figure 6. Landform classification for Ontario.

SUMMARY OF THE PARKS RESEARCH FORUM OF ONTARIO (PRFO) STATE OF THE ART PROTECTED AREAS DESIGN WORKSHOP, 2006
95 | P a g e
Figure 7. Vegetation classification for Ontario.

TOP-DOWN VS. BOTTOM UP? WORKING TOWARDS CONSENSUS ON SYSTEMATIC PROTECTED AREAS PLANNING IN ONTARIO
96 | P a g e
Figure 8. Under-represented features based on the L/V GapTools approach for all of Ontario.

SUMMARY OF THE PARKS RESEARCH FORUM OF ONTARIO (PRFO) STATE OF THE ART PROTECTED AREAS DESIGN WORKSHOP, 2006
97 | P a g e
Appendix K. Summary of Day 2 Afternoon Breakout Session
Summarized by: Jennifer Shuter1, Kristyn Ferguson2, Cathy McAllister2
1Department of Integrative Biology, University of Guelph 2Faculty of Environment, University of Waterloo
Eds. note: Group numbers here do not correspond to group numbers in Table 3. One group delineated
specific polygons for each site, which are shown in dark green in Figure 1. The others only indicated
generally where sites should be located. These are indicated on Figure 1 with small squares/circles. The
fourth breakout group did not complete the mapping exercise.
Group 1
Site 1: Region 3S - A wilderness class park should be added in Ecoregion 3S that is contiguous with
Woodland Caribou Provincial Park and this park should work in cooperation with Manitoba to ensure
contiguity across the provincial border. This area was identified in a number of studies as an important
site. It would also protect a world heritage site, and add to an existing protected area.
Site 2: James Bay Lowland - The addition of a large protected area in the James Bay Lowland would fill
gaps identified by the Ontario Ministry of Natural Resources. It is also an important area for preserving
mammals, and is part of the world‟s largest wetland. There is also a wilderness class park gap.
Site 3: Algonquin Park Extension - Extending Algonquin Park southwest in a 50% expansion would be
beneficial for many. It would contribute to the Algonquin-Adirondack conservation strategy. This area is
disturbance sensitive, and this extension would help with mitigating or adapting to climate change, and
in creating a wildlife corridor. This may be unrealistic, but there is some support and stewardship to
promote at least a partial expansion.
Site 4: Bed of Lake Nipigon; Nipigon River - The bed of Lake Nipigon and the Nipigon River should
also be protected; this area is fairly pristine compared to other areas, and is already surrounded by
protected areas. This protection should be extended to include the bed and river. This area is important
for caribou habitat, and could also serve as an important corridor, particularly because it would connect
to other parks and protected areas.
Site 5: Lake Superior connection with Pukaskwa Park - This would be a coastline area, and would be
representative of a unique location.
Site 6: Region 1E - A wilderness class park of about 450,000 hectares should be added in Ecoregion 1E.
There is a northern gap in terms of protected areas here.
Site 7: Spanish River - One final suggestion would be the establishment of an additional protected area
around the Spanish River. This would correlate with a few projects, and would be important for
mammals.

TOP-DOWN VS. BOTTOM UP? WORKING TOWARDS CONSENSUS ON SYSTEMATIC PROTECTED AREAS PLANNING IN ONTARIO
98 | P a g e
Group 2
Site 1: North of and adjacent to Woodland Caribou Provincial Park, and adjacent to the Manitoba
border (Size: 2,700km2) - This first site was chosen for two major reasons. It contains a large contiguous
clump of features that are classified as being highly under-represented under the OMNR approach, and it
serves as a northward expansion of Woodland Caribou Provincial Park and an eastward expansion of
Atikaki Wilderness Park in Manitoba. The recommended reserve size of 2,700 km2 was based on the
lower 95% confidence interval of an empirical estimation of the minimum area requirement for
disturbance-sensitive terrestrial mammals (Gurd et al. 2001; Nudds & Wiersma 2004).
Site 2: Just west & north of Brockville, ON (Size: 2,000 km2) - Several reasons for choosing this site
were provided. It is a “hotspot” of forest bird diversity, it is located within the “Algonquin to
Adirondack” corridor and it includes several under-represented OMNR landform-vegetation features.
The recommended reserve size of 2,000 km2 was based on an attempt to approach the minimum reserve
area suggested by Nudds and Wiersma (2004), tempered by feasibility considerations (i.e. development
and ownership-related constraints on land acquisition).
Site 3: Adjacent to and east of Site 1, northeast of Woodland Caribou Provincial Park (Size: 5,000 km2)
- This site was selected for the following reasons. It contains highly and moderately under-represented
landform-vegetation features (OMNR approach). It is located directly adjacent to Site 1 (in reference to
Site 1 as located by this group) and the northeast corner of Woodland Caribou Provincial Park, and thus
can serve as an expansion of these areas. It is north of the Area of Undertaking, and it had not yet been
allocated for industrial timber harvesting. The protection of Site 3 could contribute to maintaining
landscape connectivity throughout a large contiguous group of protected areas that includes candidate
Site 3, Woodland Caribou Provincial Park and Atikaki Wilderness Park in Manitoba. Finally, it was
noted that by encompassing lands in two different OMNR ecoregions, a high level of biodiversity might
be protected (relative to reserves located within a single ecoregion). The recommended reserve size of
5,000 km2 was based on the empirical estimation of the minimum area requirement for disturbance-
sensitive terrestrial mammals (Gurd et al. 2001; Nudds & Wiersma 2004).
Site 4: Immediately above the “Area of the Undertaking” in the Moose River area (Size: 5,000 km2) -
The existence of a favourable political climate for protected area establishment in the northern boreal
region, and the ease of implementation in a location without major development or resource extraction
pressures were primary reasons Site 4 was selected as a candidate protected area. Another factor is that it
contains OMNR landform-vegetation features that are moderately to highly under-represented in the
current protected areas network. The recommended reserve size of 5,000 km2 was based on the
empirical estimation of the minimum area requirement for disturbance-sensitive terrestrial mammals
(Gurd et al. 2001; Nudds & Wiersma 2004).
Site 5: Between Kashechewan and Attawapiskat, including portions of James Bay, the James Bay coast
and inland areas (Size: 5,000km2) - This site was selected for similar reasons to those identified in the
selection of Site 4, namely, that current political pressures are supportive of the establishment of new
reserves in Ontario‟s northern boreal, and that implementation could be relatively easy compared with
more populous and developed regions of the province. It was further suggested that the existence of
significant mining interests in the general vicinity of Site 5 might provide conservation agencies with
political leverage to achieve rapid acceptance and implementation of this particular protected area.

SUMMARY OF THE PARKS RESEARCH FORUM OF ONTARIO (PRFO) STATE OF THE ART PROTECTED AREAS DESIGN WORKSHOP, 2006
99 | P a g e
Additional reasons for the selection of this site include the presence of OMNR landform-vegetation
features that are highly under-represented in the current protected areas network, and the presence of a
high level of mammalian beta diversity. In an effort to include more coastal and aquatic features into the
protected areas network, the group decided to allow the boundaries of the reserve to extend past the
shore, into the waters of James Bay. The recommended reserve size of 5,000 km2 was based on the
empirical estimation of the minimum area requirement for disturbance-sensitive terrestrial mammals
(Gurd et al. 2001; Nudds & Wiersma 2004).
Site 6: Just east of Rainy River, extending northwards to Lake of the Woods (Size: 2,700 km2) - The
primary reason this site was selected was the unique ecological characteristics of the “Lake of the
Woods” area. The group‟s attention was initially drawn to the site due to the presence of one of the
significant sites identified in Wiersma & Nudds‟ presentation. But discussion focused mainly on
participants‟ personal knowledge regarding prairie influences on community structure and species
composition, which has made the region highly diverse and relatively unique in Ontario. The
recommended reserve size of 2,700 km2 was based on the lower 95% confidence interval of an empirical
estimation of the minimum area requirement for disturbance-sensitive terrestrial mammals (Gurd et al.
2001; Nudds & Wiersma 2004).
Site 7: Far north - west of Polar Bear Provincial Park, adjacent to the Manitoba border (Size: 5,000
km2) - Ease of implementation and the presence of OMNR landform-vegetation features that are highly
under-represented in the existing protected areas network were the primary reasons cited for the location
of Site 7. The recommended reserve size of 5,000 km2 was based on the empirical estimation of the
minimum area requirement for disturbance-sensitive terrestrial mammals (Gurd et al. 2001; Nudds &
Wiersma 2004).
Site 8: East of and adjacent to Winisk River Provincial Park, in central northern Ontario (Size: 2,700
km2) - Site 8 was chosen for several reasons. First, the presence of OMNR landform-vegetation features
which are highly under-represented in the existing protected areas network. Second, the realization that
with the exception of linear, river-based protected areas, both group recommendations and existing
reserves in the intact northern boreal seem to be biased towards the eastern and western borders of the
province. The final reason focused on the opportunity to expand the area of Winisk River Provincial
Park. The recommended reserve size of 2,700 km2 was based on the lower 95% confidence interval of
an empirical estimation of the minimum area requirement for disturbance-sensitive terrestrial mammals
(Gurd et al. 2001; Nudds & Wiersma 2004).

TOP-DOWN VS. BOTTOM UP? WORKING TOWARDS CONSENSUS ON SYSTEMATIC PROTECTED AREAS PLANNING IN ONTARIO
100 | P a g e
Group 3
Site 1: Sutton Ridges - This area is representative of the only true outliers of upthrust Precambrian
Shield in the entire area. The group also believes it to be one of the only remaining areas in Ontario for
polar bear denning, and thus allows persistent species focus. This region also includes a thermal karst
area. Overall, the Sutton Ridges need to be represented because there is nothing else similar to them.
Site 2: Mid-Attawapiskat - This area contains the Attawapiskat River, which boasts glacial ponds, more
karst topography and Ordovician fossil representation in the cliffs. Due to these features of interest, this
area should be a priority for conservation.
Site 3: Mid-Albany - This area has the deepest trenched river valley system in the province. It also
contains many western species not seen elsewhere in Ontario. This large area incorporates many
watersheds, disjunct elm populations, Connecticut Warbler habitat and both high- and lowlands for
maximum biodiversity.
Site 4: Kinoje-Longridge Point - This area has treed fens, moose basin, tamarack savannah, caribou and
both Half Point and Longridge Point, as well as interesting coastal dynamics such as a marine to shore
interior ecotone.
Site 5: “Woodland Caribou” - This area is an extension of woodland caribou habitat. Taking on the area
shared with the Manitoba border allows Ontario to pick up some watersheds not being properly
protected by Manitoba. Also, this area includes the Berens River, and has an interesting frequent fire
regime.
Site 6: Agutua Wendigo - In this area junctions of different ecodistricts are contained, making it highly
diverse. It is also home to one lobe of a very large moraine (the Agutua Moraine) found in the area.
Site 7: Kinoje-James Bay Coast - In the area north of the Albany River there are several important
features, including coastline, shorebirds, water birds, and staging and migration areas, which are
internationally recognized as an Important Bird Area (IBA).
Site 8: Winisk - This area includes both places in which calcareous till lies over the Precambrian Shield,
as well as protrusions of the shield.
Site 9: Opasquia East - This area represents another area of caribou habitat, and contains representative
features from the ecodistrict just next to it. There is limited knowledge about this area, so no persistence
argument can be made, but it was deemed to still be an important priority for conservation due to the
wildlife habitat it provides.
Site 10: “Top West Red Area” - A highland area exists in this region, with dry and sandy conditions as
well as high altitudes. Because of this, the area is open and prone to fires. It also contains several dead
flat areas, except where it is sloped perfectly for the long fens which characterize the area.

SUMMARY OF THE PARKS RESEARCH FORUM OF ONTARIO (PRFO) STATE OF THE ART PROTECTED AREAS DESIGN WORKSHOP, 2006
101 | P a g e
Appendix L. Copy of Workshop Program
Workshop Program
Thank you to our sponsors
Canadian Council on Ecological Areas
Environment Canada
Nature Conservancy Canada
Ontario Parks
Parks Canada
Parks Research Forum of Ontario
University of Guelph
Workshop Organizing Committee
Tom Beechey
Rob Davis
Marc Johnson
Steve Murphy
Tom Nudds (Chair)
Bill Stephenson
Yolanda Wiersma (Co-ordinator)
Paul Zorn
Volunteers
Chris Lemieux (Web Site Maintenance)
Kristyn Ferguson
Leif Olson
Jen Shuter

TOP-DOWN VS. BOTTOM UP? WORKING TOWARDS CONSENSUS ON SYSTEMATIC PROTECTED AREAS PLANNING IN ONTARIO
102 | P a g e
CONFERENCE AGENDA
March 9, Day 1: Presentations and Panel
8:00 - 8:30 a.m. Registration
8:30 a.m. Introduction and comments from Workshop Chair
9:00 a.m. KEYNOTE SPEAKER: Dr. Robert L. Pressey
Systematic methods for protected area design: where have we been, where do
we need to go?
9:45 a.m. Questions and discussion for keynote speaker
10:00 - 10:30 a.m. BREAK
10:30 -11:30 a.m. Square pegs? Adapting conservation planning tools for an intact landscape
Presenters: Julee Boan (Wildlands League) & Steve Kingston
(OMNR)
11:30 - noon Discussion and Q & A
Noon - 1:00 p.m. LUNCH BREAK (own your own, maps to local restaurants will be provided)
1:00 - 3:00 p.m. Presentations on current protected areas projects
Landscape-scale representation criteria for assessment
and construction of protected areas networks:
Compositional analysis of intrinsic patch structures
Presenter: Steve Cumming (BERL)
Diversity and representative protected areas for mammals in Canada
Presenter: Yolanda Wiersma (University of Guelph)
Landscape analysis tools for conservation planning
Presenter: Tony Iacobelli and Colin Anderson (World Wildlife Fund)
Great Lakes Conservation Blueprint for Biodiversity
Presenter: Dan Kraus (Nature Conservancy Canada)
3:00 - 3:30 p.m. BREAK
3:30 – 5:00 p.m. Panel discussion/commentary
Commentators: Kris Rothley (Simon Fraser University) & Paul Zorn
(Parks Canada)
Evening DINNER (Party room at Diana Restaurant: Participants to pay own way)
March 10
Day 2: Rolling up our sleeves
8:00 - 8:30 a.m. Outline of morning‟s activities and plenary discussion
8:30 - 9:30 a.m. Breakout session
9:30 - 10:00 a.m. BREAK
10:30 - 11:00 a.m. Breakout session
11:00 - noon Plenary presentations
Noon - 1 p.m. LUNCH BREAK (on your own)
1:00 - 1:10 p.m. Overview of OMNR LV process (Rob Davis and Bill Crins)
1:10 - 1:30 Geographic presentations
1:30 - 2:15 Breakout session
2:15 - 3:00 Plenary wrap up & closing comments