TOP-30 PRE-PACKAGED SOFTWARE COMPANIES
35
Secrets of Software Success: Chapter 2007 January 16, 2007 Gareth Morgan, McKinsey & Co Irish Software Association
description
Transcript of TOP-30 PRE-PACKAGED SOFTWARE COMPANIES

Secrets of Software Success: Chapter 2007January 16, 2007Gareth Morgan, McKinsey & CoIrish Software Association
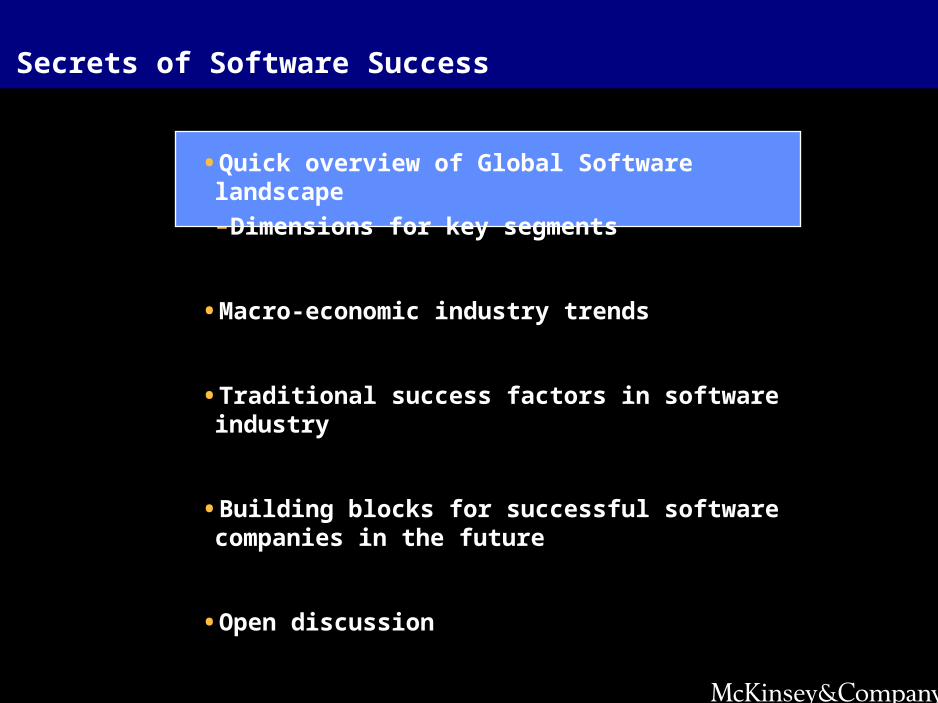
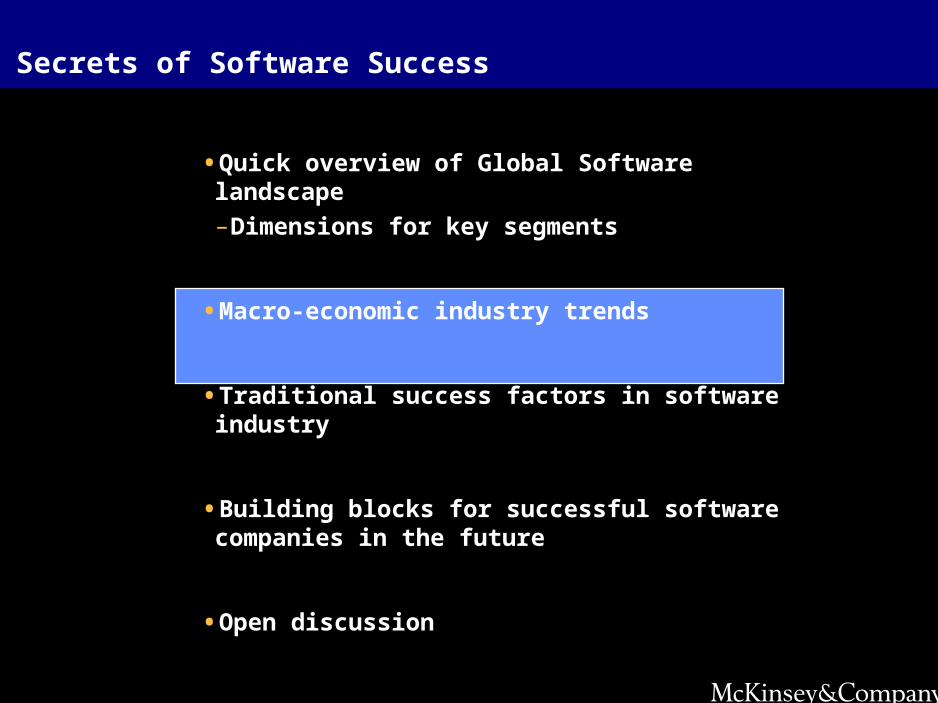
Secrets of Software Success
•Quick overview of Global Software landscape
–Dimensions for key segments
•Macro-economic industry trends
•Traditional success factors in software industry
•Building blocks for successful software companies in the future
•Open discussion
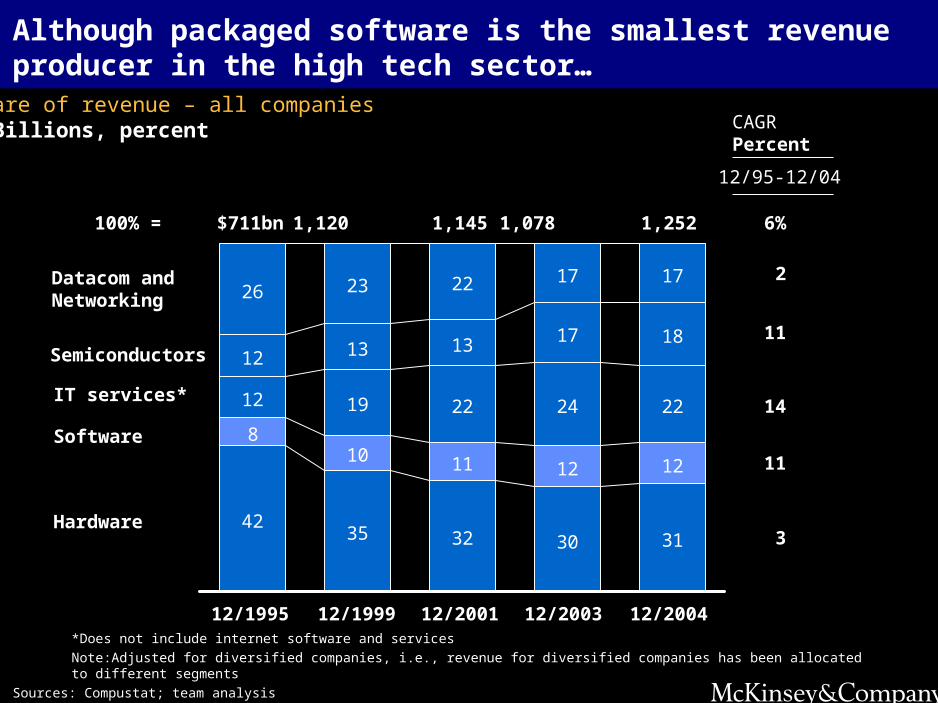
Although packaged software is the smallest revenue producer in the high tech sector…
*Does not include internet software and services
Note:Adjusted for diversified companies, i.e., revenue for diversified companies has been allocated to different segments
Sources: Compustat; team analysis
Share of revenue – all companies$ Billions, percent
4235 32 30 31
810 11 12 12
12 19 22 24 22
12 13 13 17 18
26 23 22 17 17
$711bn
IT services*
Datacom and Networking
12/200112/1995 12/1999 12/2003
100% =
Semiconductors
1,120 1,145 1,078
Software
Hardware
CAGRPercent
12/95-12/04
6%
2
11
3
11
14
12/2004
1,252
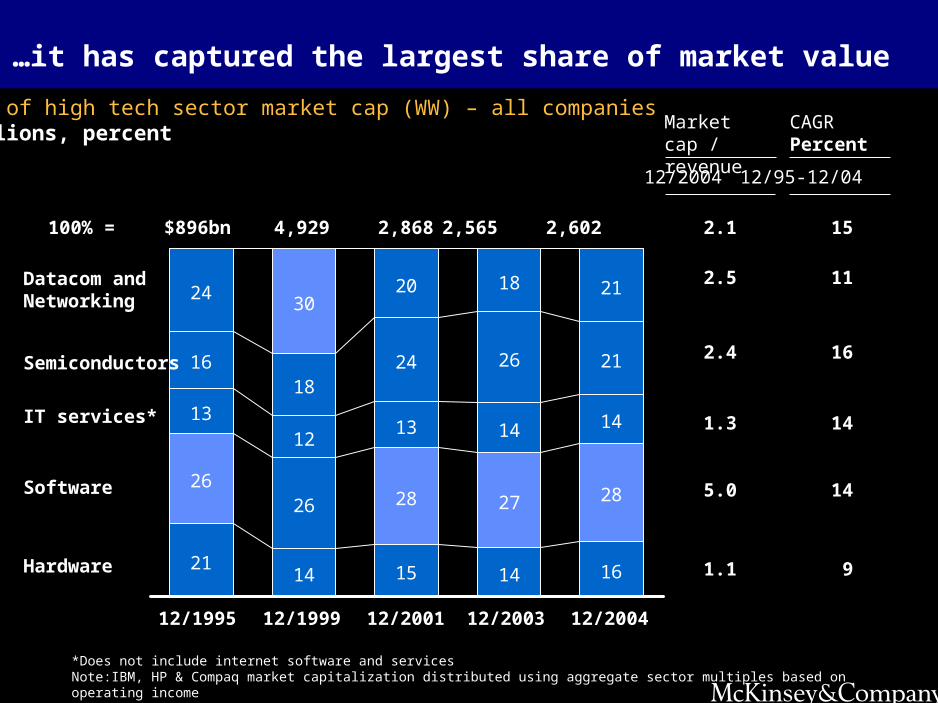
…it has captured the largest share of market value
*Does not include internet software and servicesNote:IBM, HP & Compaq market capitalization distributed using aggregate sector multiples based on operating incomeSources:Compustat; team analysis
Share of high tech sector market cap (WW) – all companies$ Billions, percent
$896bn
12/200312/1995 12/2001
100% = 4,929 2,868 2,565
CAGRPercent
12/95-12/04
15
2114 15 14 16
28
1312
13 14 14
1618
24 26 21
2430
20 18 21
26 28 2726
IT services*
Datacom and Networking
Semiconductors
Software
Hardware
11
16
9
14
14
12/1999
Market cap / revenue
2.1
12/2004
2.5
2.4
1.3
5.0
1.1
12/2004
2,602
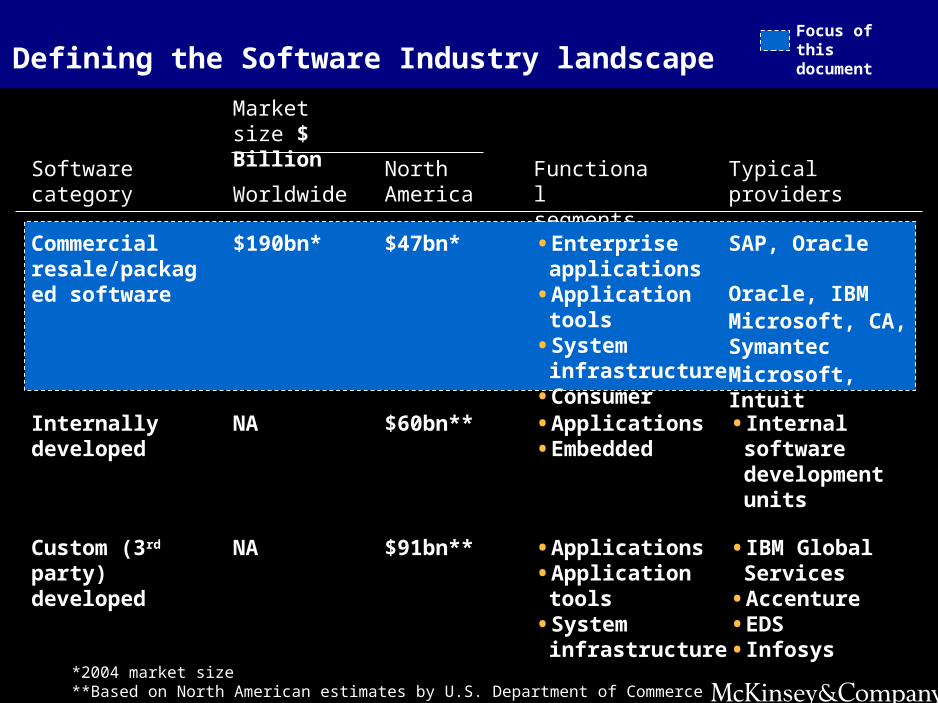
Defining the Software Industry landscape
Software category
Market size $ Billion
Functional segments
Typical providers
Commercial resale/packaged software
$190bn* • Enterprise applications
• Application tools• System
infrastructure• Consumer
SAP, Oracle
Oracle, IBMMicrosoft, CA, SymantecMicrosoft, Intuit
Internally developed
NA • Applications• Embedded
• Internal software development units
Custom (3rd party) developed
NA • Applications• Application tools• System
infrastructure
• IBM Global Services
• Accenture• EDS• Infosys
Focus of this document
WorldwideNorth America
$47bn*
$60bn**
$91bn**
*2004 market size**Based on North American estimates by U.S. Department of Commerce
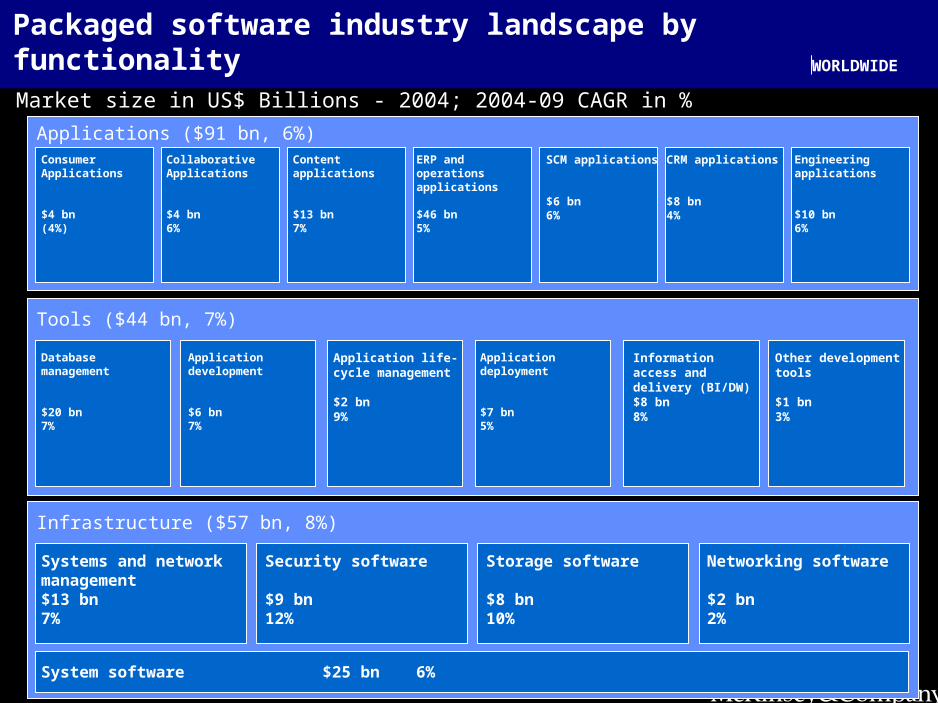
Packaged software industry landscape by functionality
Applications ($91 bn, 6%)
Market size in US$ Billions - 2004; 2004-09 CAGR in %
ConsumerApplications
$4 bn (4%)
Tools ($44 bn, 7%)
Infrastructure ($57 bn, 8%)
CollaborativeApplications
$4 bn6%
Content applications
$13 bn7%
ERP and operations applications
$46 bn5%
SCM applications
$6 bn6%
CRM applications
$8 bn4%
Engineering applications
$10 bn6%
Systems and network management$13 bn7%
Security software
$9 bn12%
Storage software
$8 bn10%
Networking software
$2 bn2%
System software $25 bn 6%
Database management
$20 bn7%
Application development
$6 bn7%
Application life-cycle management
$2 bn9%
Application deployment
$7 bn5%
Information access and delivery (BI/DW)$8 bn8%
Other development tools
$1 bn3%
WORLDWIDE
Secrets of Software Success
•Quick overview of Global Software landscape
–Dimensions for key segments
•Macro-economic industry trends
•Traditional success factors in software industry
•Building blocks for successful software companies in the future
•Open discussion
Macro-economic industry trends- observations
•Growth stabilizing; margins increasing
•Restructuring continues and investment increases
•Both supply and demand continue to globalize
0
5
10
15
20
25
1995 1998 2001 2004
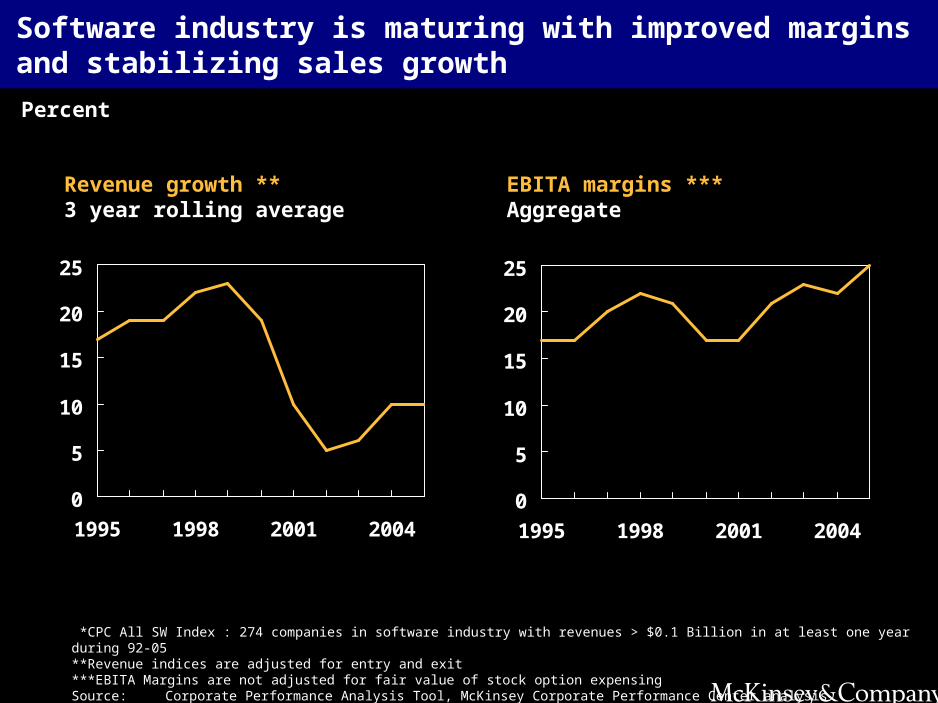
Software industry is maturing with improved marginsand stabilizing sales growth
0
5
10
15
20
25
1995 1998 2001 2004
Revenue growth **3 year rolling average
Percent
EBITA margins ***Aggregate
*CPC All SW Index : 274 companies in software industry with revenues > $0.1 Billion in at least one year during 92-05**Revenue indices are adjusted for entry and exit***EBITA Margins are not adjusted for fair value of stock option expensingSource:Corporate Performance Analysis Tool, McKinsey Corporate Performance Center analysis
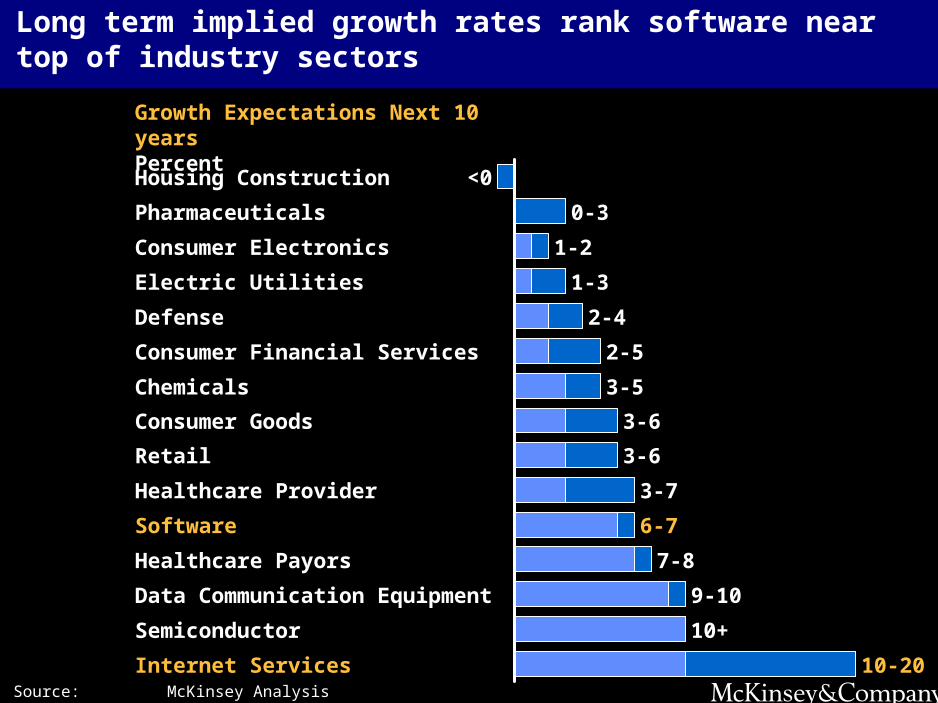
Long term implied growth rates rank software near top of industry sectors
Source: McKinsey Analysis
Data Communication Equipment
Consumer Goods
Retail
Semiconductor
Healthcare Payors
Chemicals
Defense
Healthcare Provider
Consumer Financial Services
Consumer Electronics
Electric Utilities
Housing Construction <0
Pharmaceuticals
Internet Services
10+
9-10
7-8
6-7
3-7
3-6
3-6
3-5
2-5
Software
1-3
0-3
1-2
2-4
10-20
Growth Expectations Next 10 yearsPercent
-10
0
10
20
30
40
50
1995 1998 2001 2004
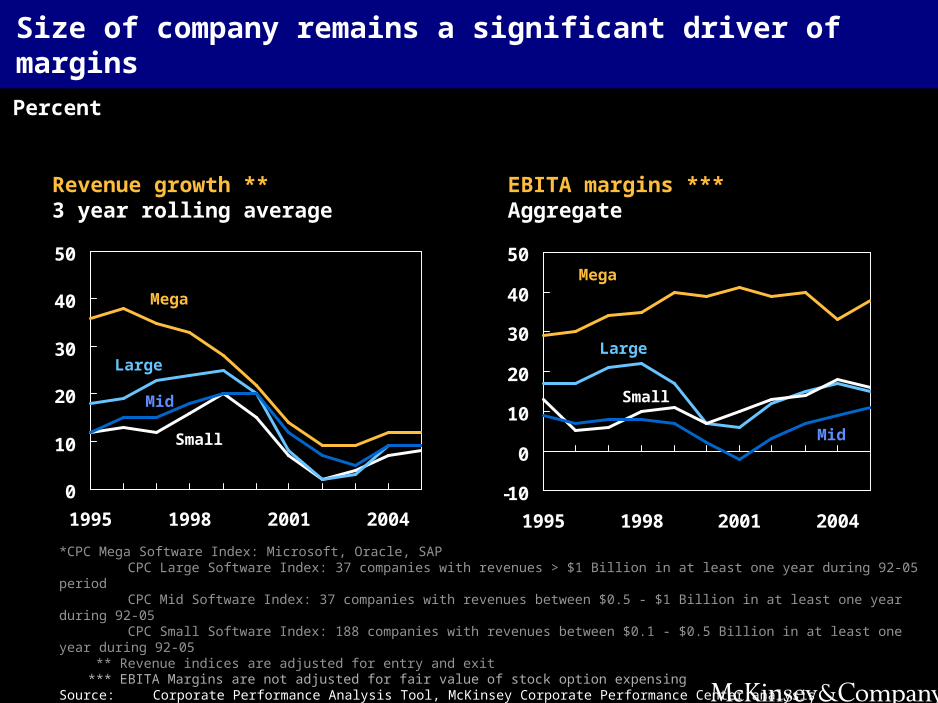
Size of company remains a significant driver of margins
0
10
20
30
40
50
1995 1998 2001 2004
Percent
Revenue growth **3 year rolling average
EBITA margins ***Aggregate
*CPC Mega Software Index: Microsoft, Oracle, SAP CPC Large Software Index: 37 companies with revenues > $1 Billion in at least one year during 92-05 period CPC Mid Software Index: 37 companies with revenues between $0.5 - $1 Billion in at least one year during 92-05 CPC Small Software Index: 188 companies with revenues between $0.1 - $0.5 Billion in at least one year during 92-05 ** Revenue indices are adjusted for entry and exit *** EBITA Margins are not adjusted for fair value of stock option expensing
Source:Corporate Performance Analysis Tool, McKinsey Corporate Performance Center analysis
Mega
Mega
LargeLarge
Mid
Mid
Small
Small
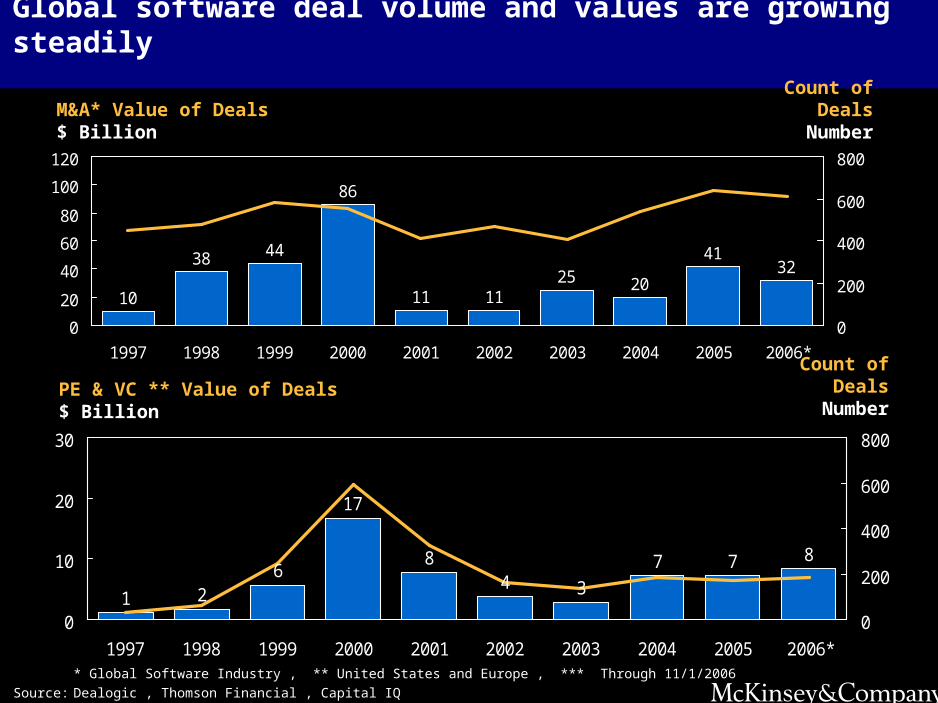
Global software deal volume and values are growing steadily
10
38 44
86
11 1125 20
4132
0
20
40
60
80
100
120
1997 1998 1999 2000 2001 2002 2003 2004 2005 2006*
0
200
400
600
800
M&A* Value of Deals$ Billion
Count of DealsNumber
* Global Software Industry , ** United States and Europe , *** Through 11/1/2006
Source: Dealogic , Thomson Financial , Capital IQ
1 26
17
84 3
7 7 8
0
10
20
30
1997 1998 1999 2000 2001 2002 2003 2004 2005 2006*
0
200
400
600
800
PE & VC ** Value of Deals$ Billion
Count of DealsNumber
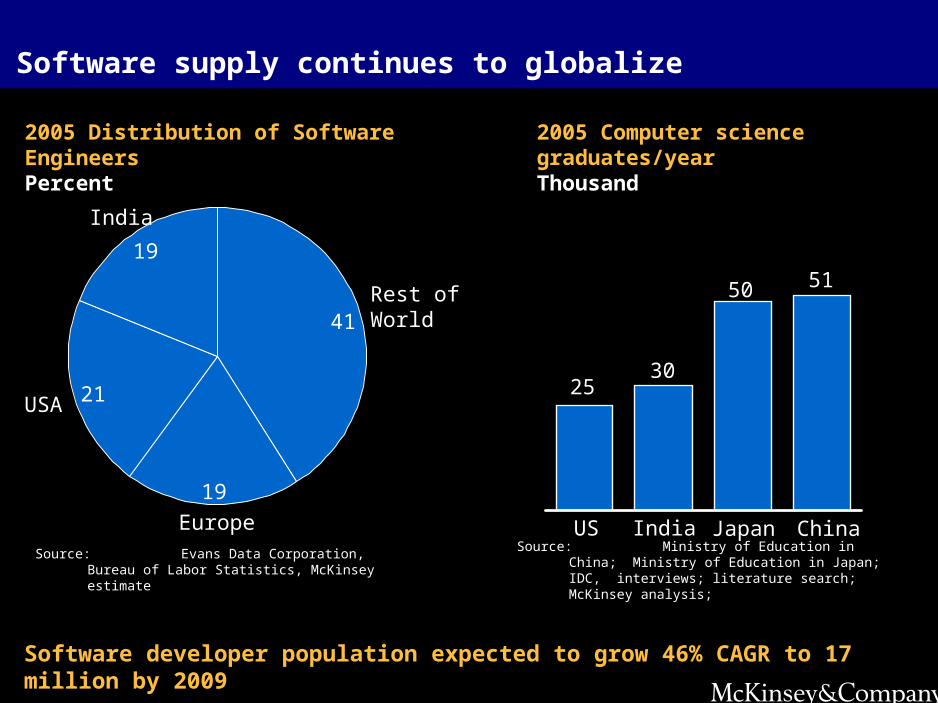
Software supply continues to globalize
2005 Computer science graduates/yearThousand
51
2530
50
US India Japan China
Source: Ministry of Education in China; Ministry of Education in Japan; IDC, interviews; literature search; McKinsey analysis;
Source: Evans Data Corporation, Bureau of Labor Statistics, McKinsey estimate
India
19
USA 21
Europe
19
Rest ofWorld41
2005 Distribution of Software EngineersPercent
Software developer population expected to grow 46% CAGR to 17 million by 2009
Secrets of Software Success
•Quick overview of Global Software landscape
–Dimensions for key segments
•Macro-economic industry trends
•Traditional success factors in software industry
•Building blocks for successful software companies in the future
•Open discussion
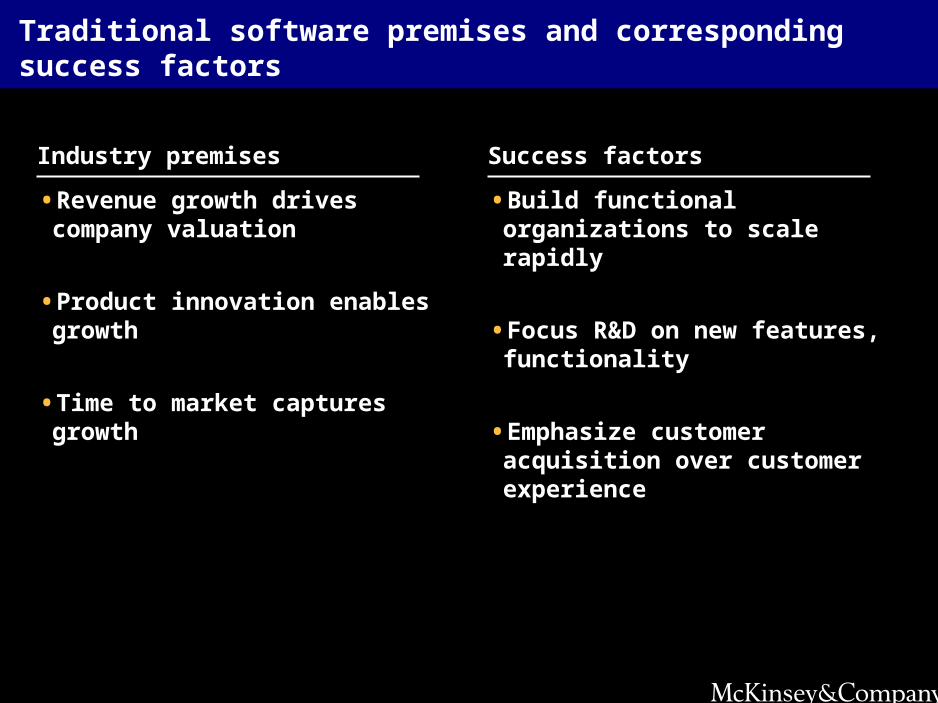
Traditional software premises and corresponding success factors
•Revenue growth drives company valuation
•Product innovation enables growth
•Time to market captures growth
Industry premises
•Build functional organizations to scale rapidly
•Focus R&D on new features, functionality
•Emphasize customer acquisition over customer experience
Success factors
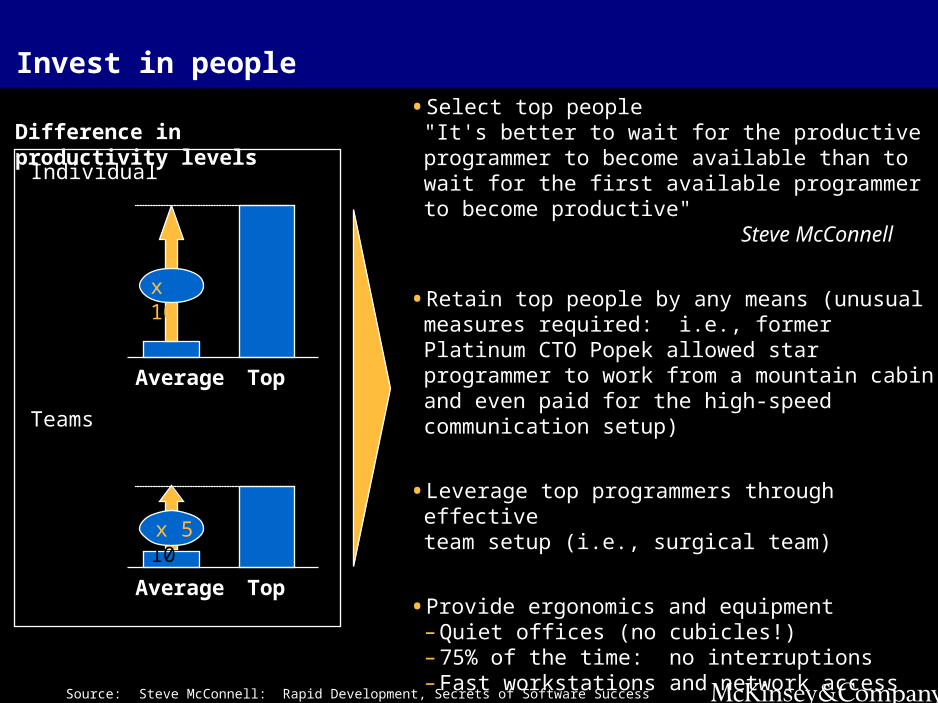
Invest in people
Source:Steve McConnell: Rapid Development, Secrets of Software Success
Difference in productivity levels
Individual
Average Top
Average Top
Teams
x 10
x 10x 5
• Select top people"It's better to wait for the productive programmer to become available than to wait for the first available programmer to become productive" Steve McConnell
• Retain top people by any means (unusual measures required: i.e., former Platinum CTO Popek allowed star programmer to work from a mountain cabin and even paid for the high-speed communication setup)
• Leverage top programmers through effective team setup (i.e., surgical team)
• Provide ergonomics and equipment– Quiet offices (no cubicles!)– 75% of the time: no interruptions– Fast workstations and network access
• Training programs– 5 - 15 days per year internal training– 1 - 4 paid external conferences– Material for autodidactic training
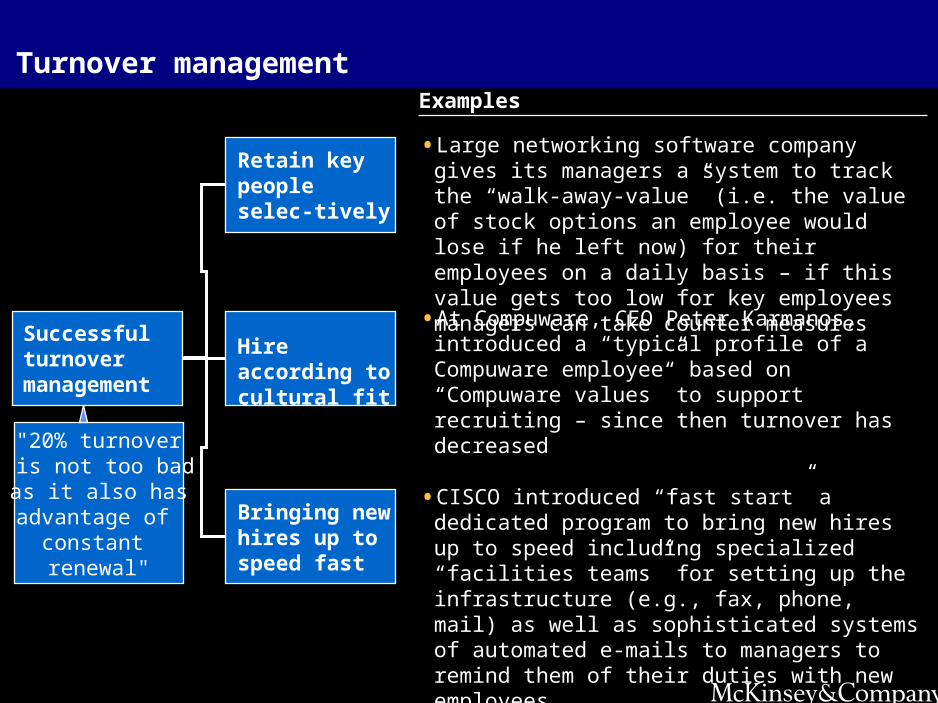
Turnover management
Source:Secrets of Software Success
Examples
• Large networking software company gives its managers a system to track the “walk-away-value” (i.e. the value of stock options an employee would lose if he left now) for their employees on a daily basis – if this value gets too low for key employees managers can take counter measures
Retain key people selec-tively
• At Compuware, CEO Peter Karmanos, introduced a “typical profile of a Compuware employee” based on “Compuware values” to support recruiting – since then turnover has decreased
Hire according to cultural fit
• CISCO introduced “fast start” a dedicated program to bring new hires up to speed including specialized “facilities teams” for setting up the infrastructure (e.g., fax, phone, mail) as well as sophisticated systems of automated e-mails to managers to remind them of their duties with new employees
Bringing new hires up to speed fast
Successful turnover management
"20% turnover is not too bad as it also has advantage of
constant renewal"
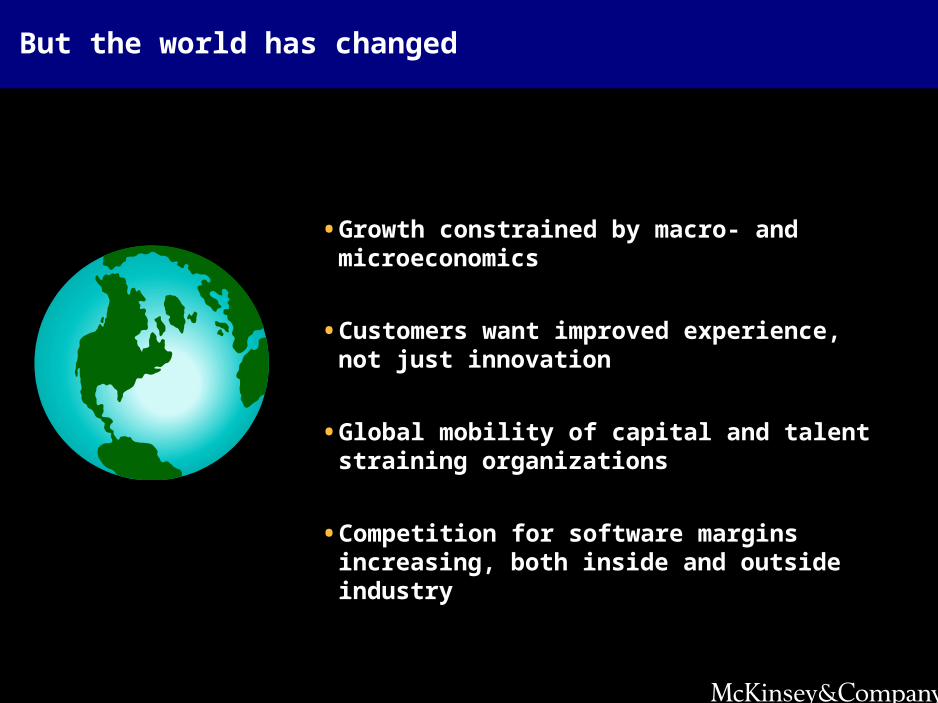
But the world has changed
• Growth constrained by macro- and microeconomics
• Customers want improved experience, not just innovation
• Global mobility of capital and talent straining organizations
• Competition for software margins increasing, both inside and outside industry
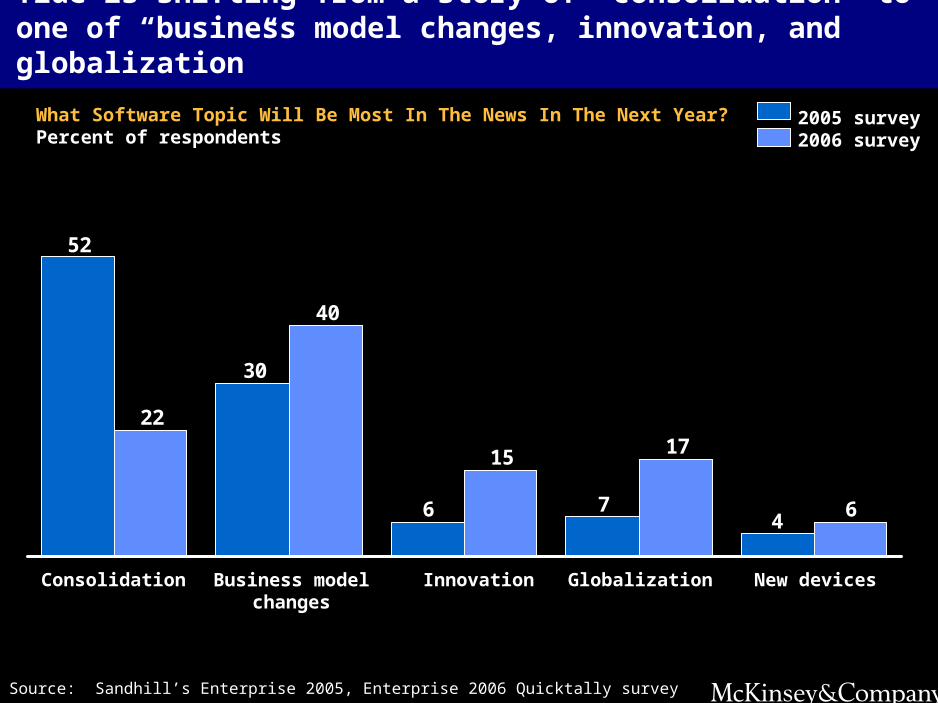
Tide is shifting from a story of “consolidation” to one of “business model changes, innovation, and globalization”
476
30
52
6
1715
40
22
Business model changes
Consolidation Innovation Globalization New devices
What Software Topic Will Be Most In The News In The Next Year?Percent of respondents
2005 survey2006 survey
Source: Sandhill’s Enterprise 2005, Enterprise 2006 Quicktally survey
Secrets of Software Success
•Quick overview of Global Software landscape
–Dimensions for key segments
•Macro-economic industry trends
•Traditional success factors in software industry
•Building blocks for successful software companies in the future
•Open discussion
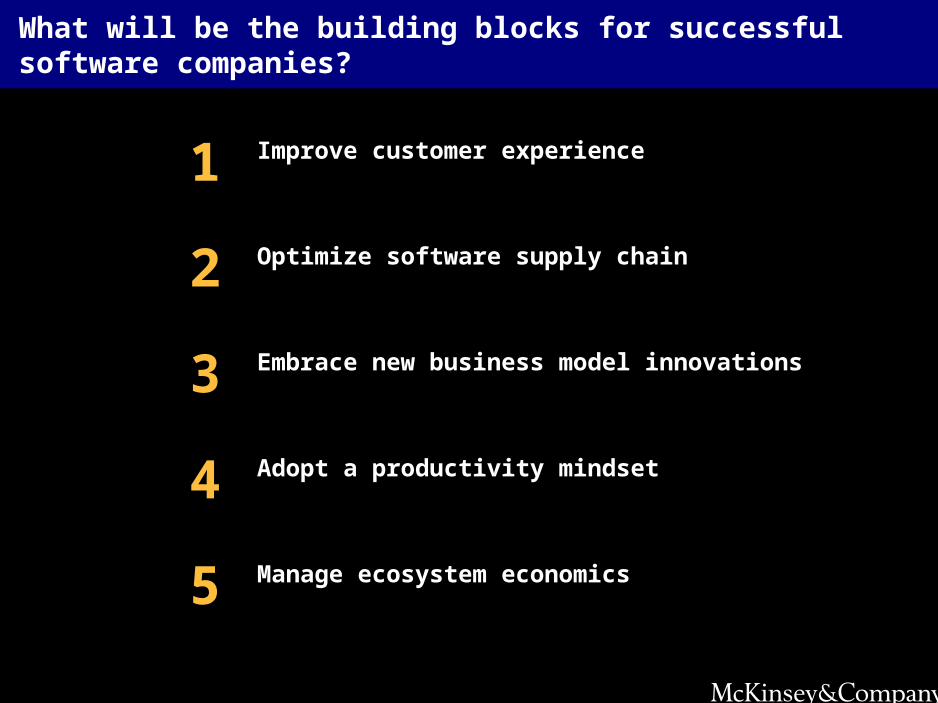
What will be the building blocks for successful software companies?
Adopt a productivity mindset4
Embrace new business model innovations3
Improve customer experience1
Optimize software supply chain2
Manage ecosystem economics5
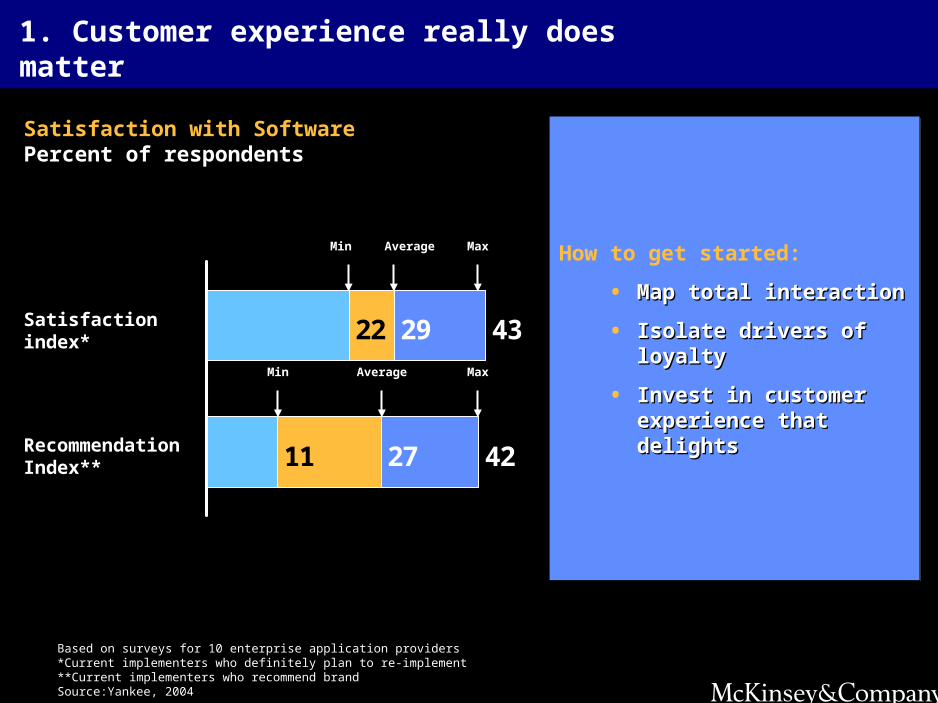
1. Customer experience really does matter
Based on surveys for 10 enterprise application providers*Current implementers who definitely plan to re-implement**Current implementers who recommend brandSource:Yankee, 2004
Satisfaction index*
Recommendation Index**
2922
11
43
4227
Min MaxAverage
Min MaxAverage
Satisfaction with Software Percent of respondents
How to get started:
• Map total interactionMap total interaction
• Isolate drivers of loyaltyIsolate drivers of loyalty
• Invest in customer Invest in customer experience that delightsexperience that delights
How to get started:
• Map total interactionMap total interaction
• Isolate drivers of loyaltyIsolate drivers of loyalty
• Invest in customer Invest in customer experience that delightsexperience that delights
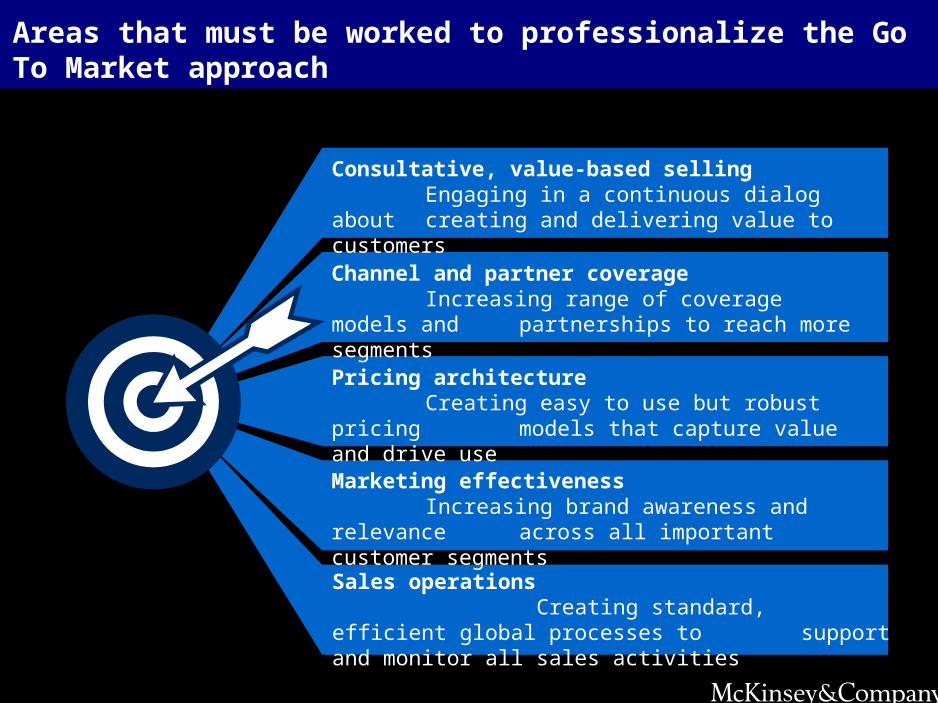
Areas that must be worked to professionalize the Go To Market approach
Consultative, value-based sellingEngaging in a continuous dialog about
creating and delivering value to customers
Channel and partner coverageIncreasing range of coverage models and partnerships to reach more segments
Marketing effectivenessIncreasing brand awareness and relevance across all important customer segments
Pricing architectureCreating easy to use but robust pricing
models that capture value and drive use
Sales operations Creating standard, efficient global processes to
support and monitor all sales activities
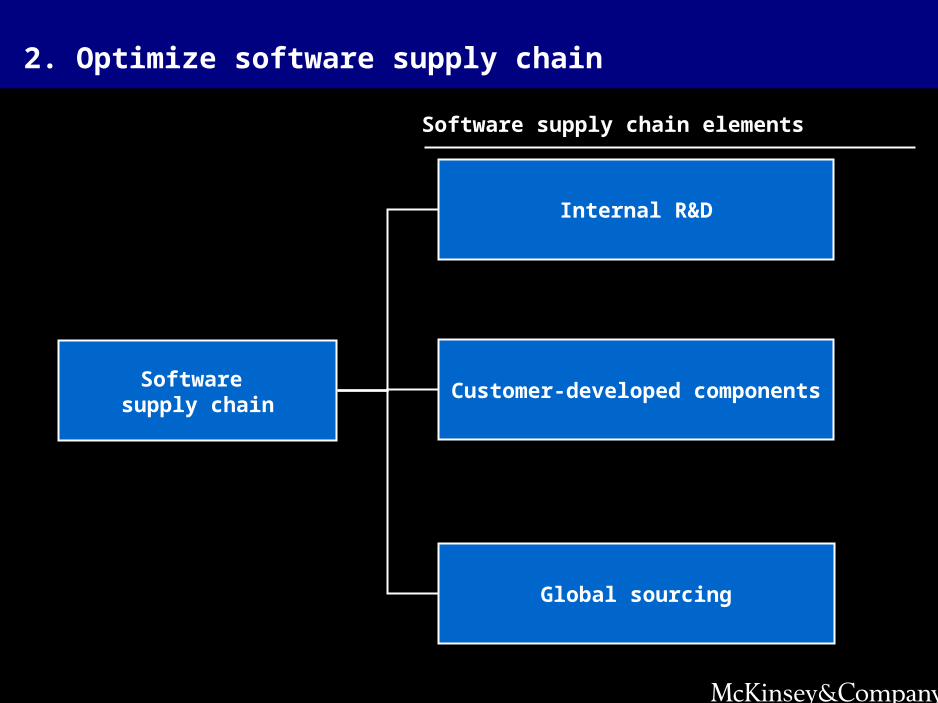
2. Optimize software supply chain
Software supply chain elements
Software supply chain
Internal R&D
Global sourcing
Customer-developed components
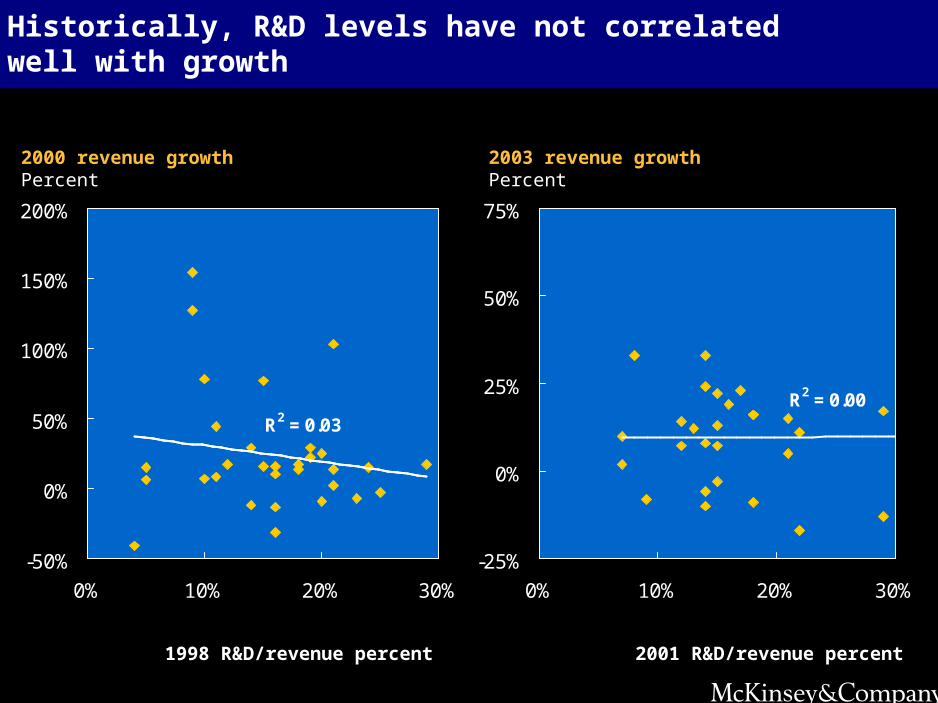
Historically, R&D levels have not correlated well with growth
2000 revenue growth Percent
1998 R&D/revenue percent
R2 = 0.03
-50%
0%
50%
100%
150%
200%
0% 10% 20% 30%
2003 revenue growth Percent
2001 R&D/revenue percent
R2 = 0.00
-25%
0%
25%
50%
75%
0% 10% 20% 30%
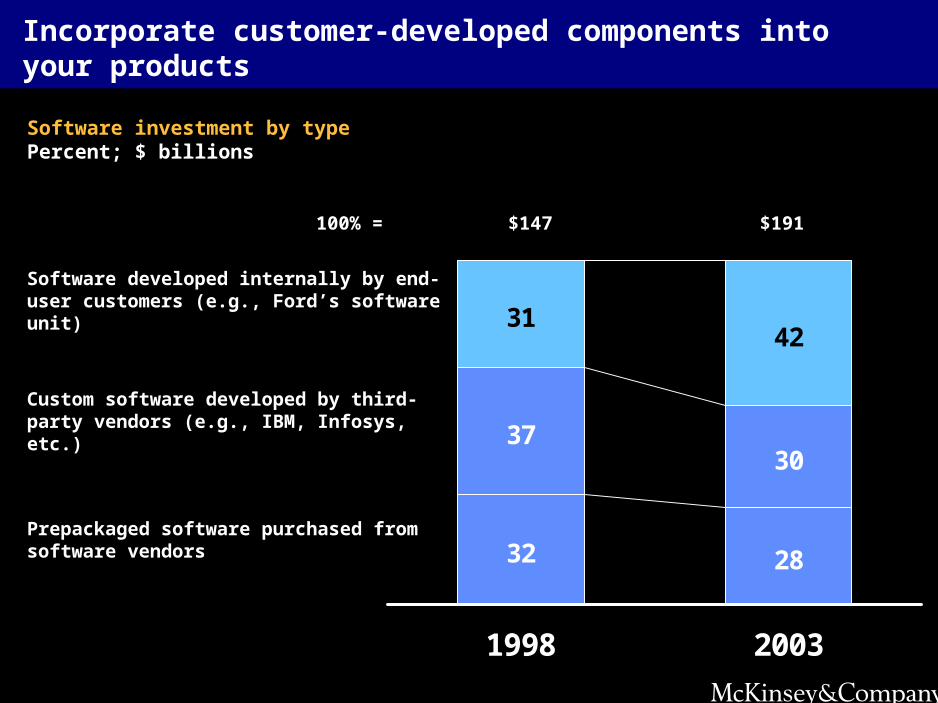
Incorporate customer-developed components into your products
Software investment by type Percent; $ billions
28
30
3142
32
37
1998 2003
Software developed internally by end-user customers (e.g., Ford’s software unit)
Custom software developed by third-party vendors (e.g., IBM, Infosys, etc.)
Prepackaged software purchased from software vendors
100% = $147 $191
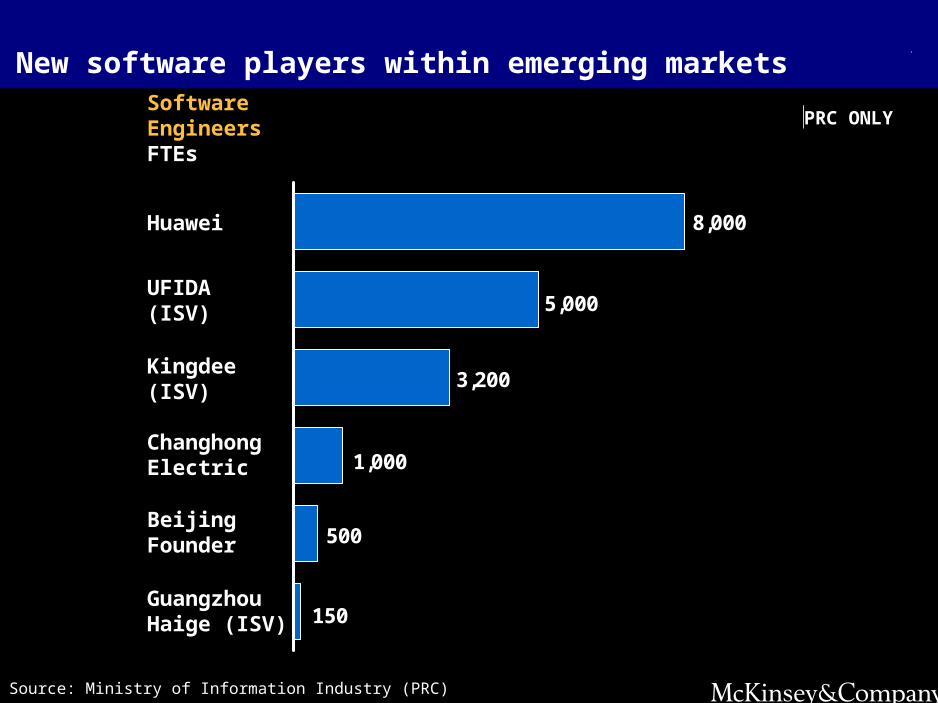
8,000
5,000
3,200
1,000
500
150
Software EngineersFTEs
Huawei
UFIDA(ISV)
Changhong Electric
Beijing Founder
Guangzhou Haige (ISV)
*Footnote
Source: Source
Kingdee(ISV)
Source: Ministry of Information Industry (PRC)
New software players within emerging markets
PRC ONLY
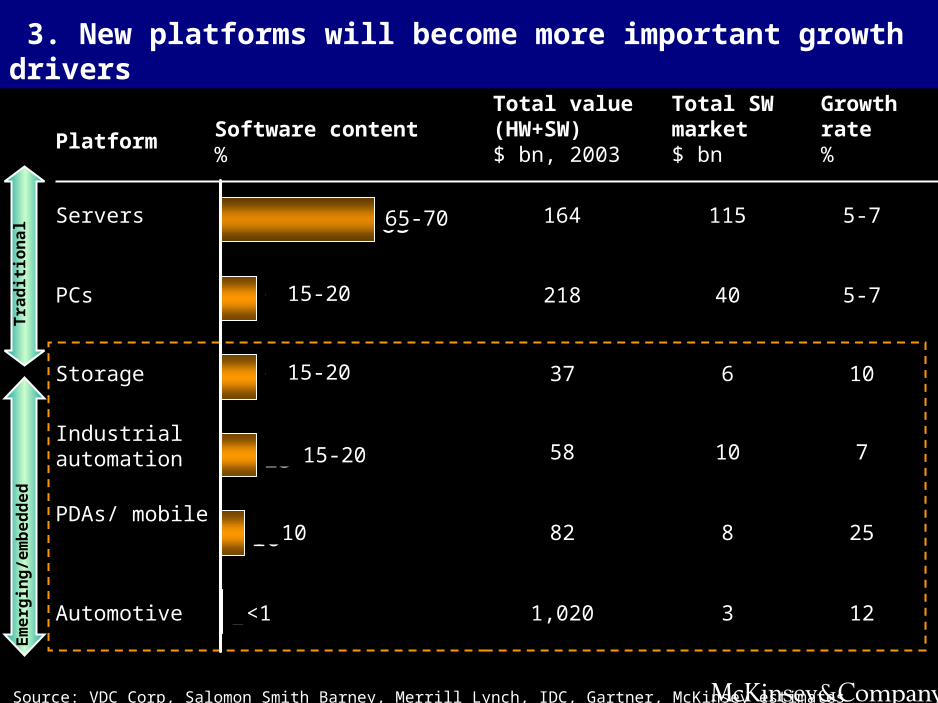
3. New platforms will become more important growth drivers
Source: VDC Corp, Salomon Smith Barney, Merrill Lynch, IDC, Gartner, McKinsey estimates
Total value (HW+SW)$ bn, 2003
PlatformSoftware content %
Total SW market $ bn
Tra
dit
ion
al
Em
erg
ing
/em
be
dd
ed
Growth rate%
PCs 218 40 5-7
Servers 164 115 5-7
Industrial automation 58 10 7
Automotive 1,020 3 12
PDAs/ mobile82 8 25
Storage 37 6 10
1
10
15
15
15
65
15-20
65-70
15-20
<1
10
15-20
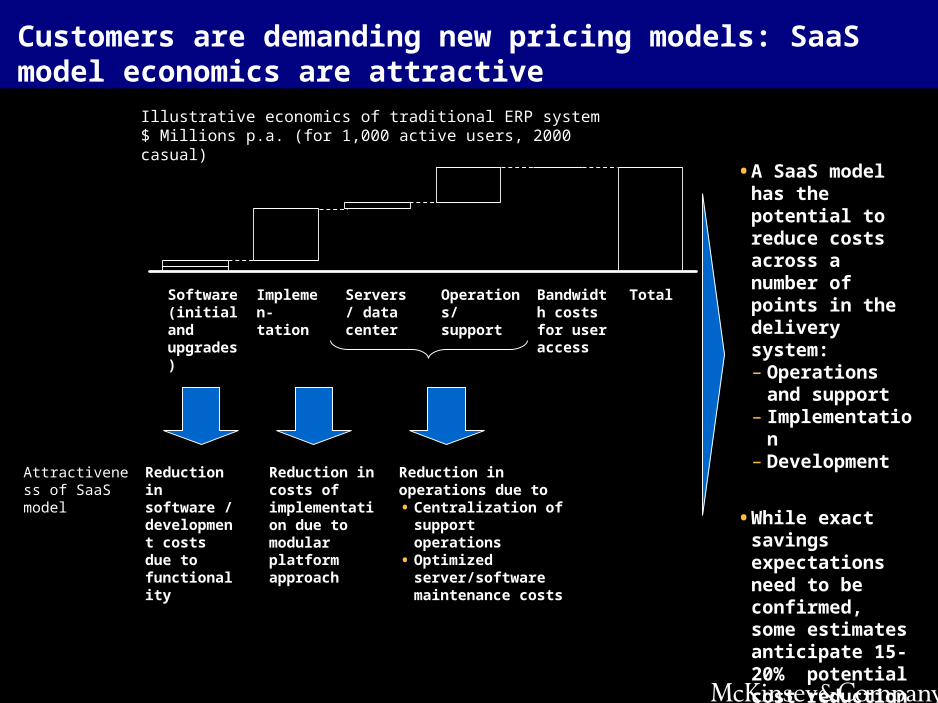
Illustrative economics of traditional ERP system $ Millions p.a. (for 1,000 active users, 2000 casual)
Software (initial and upgrades)
Implemen-tation
Servers/ data center
Operations/ support
Bandwidth costs for user access
Total
• A SaaS model has the potential to reduce costs across a number of points in the delivery system:– Operations and
support– Implementation– Development
• While exact savings expectations need to be confirmed, some estimates anticipate 15-20% potential cost reduction
Customers are demanding new pricing models: SaaS model economics are attractive
Reduction in costs of implementation due to modular platform approach
Reduction in operations due to • Centralization of
support operations• Optimized
server/software maintenance costs
Reduction in software / development costs due to functionality
Attractiveness of SaaS model
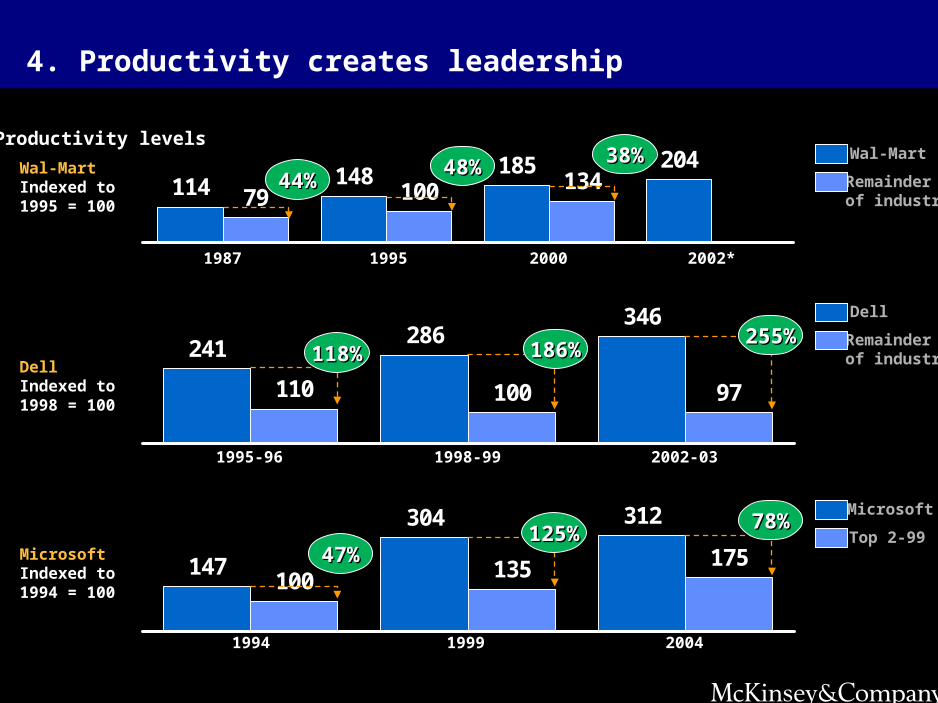
114 148 185 204
79 100 134
4. Productivity creates leadership
Wal-MartIndexed to 1995 = 100
1987 1995 2002*2000
Productivity levelsWal-Mart
Remainder of industry
241286
346
110 100 97DellIndexed to 1998 = 100
Dell
Remainder of industry118%118% 186%186%
255%255%
1995-96 1998-99 2002-03
147
304 312
100 135 175MicrosoftIndexed to 1994 = 100
Microsoft
Top 2-99
1994 1999 2004
47%47%125%125% 78%78%
44%44%48%48% 38%38%
24
35
55 53 51 49
29
1319
10 82 5 5 3 1 0
5 3 37
0.00 -0.05
0.05 -0.10
0.10 -0.15
0.15 -0.20
0.20 -0.25
0.25 -0.30
0.30 -0.35
0.35 -0.40
0.40 -0.45
0.45 -0.50
0.50 -0.55
0.55 -0.60
0.60 -0.65
0.65 -0.70
0.70 -0.75
0.75 -0.80
0.80 -0.85
0.85 -0.90
0.90 -0.95
0.95 -1.00
> 1.0
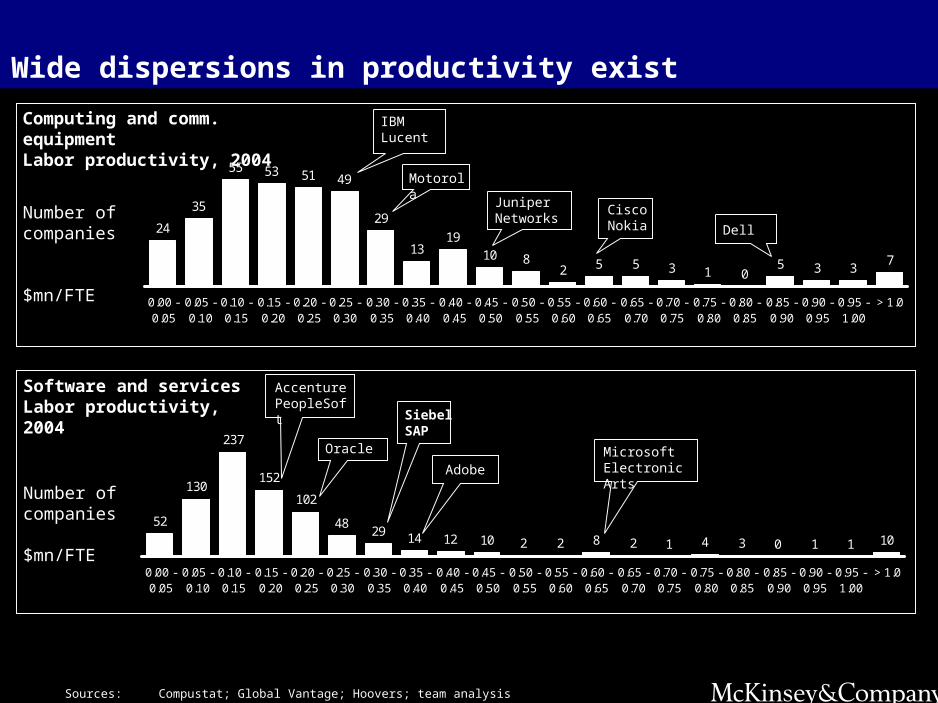
Wide dispersions in productivity exist
Sources:Compustat; Global Vantage; Hoovers; team analysis
Computing and comm. equipmentLabor productivity, 2004
Dell
CiscoNokia
Motorola
IBMLucent
Number of companies
$mn/FTE
Juniper Networks
52
130152
102
4829 14 12 10 2 2 8 2 1 4 3 0 1 1 10
237
0.00 -0.05
0.05 -0.10
0.10 -0.15
0.15 -0.20
0.20 -0.25
0.25 -0.30
0.30 -0.35
0.35 -0.40
0.40 -0.45
0.45 -0.50
0.50 -0.55
0.55 -0.60
0.60 -0.65
0.65 -0.70
0.70 -0.75
0.75 -0.80
0.80 -0.85
0.85 -0.90
0.90 -0.95
0.95 -1.00
> 1.0
Software and servicesLabor productivity, 2004
MicrosoftElectronic ArtsAdobe
Oracle
SiebelSAP
AccenturePeopleSoft
Number of companies
$mn/FTE
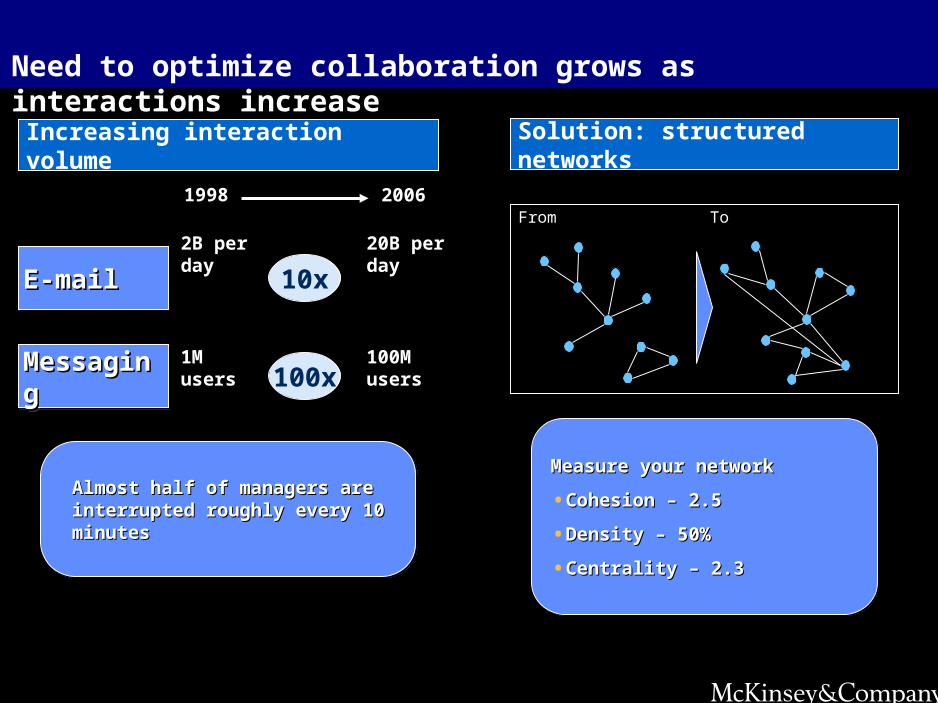
1998 2006
E-mailE-mailE-mailE-mail
2B per day
20B per day
10x
MessagingMessagingMessagingMessaging1M users
100M users100x
Increasing interaction volume
Almost half of managers are Almost half of managers are interrupted roughly every 10 minutesinterrupted roughly every 10 minutesAlmost half of managers are Almost half of managers are interrupted roughly every 10 minutesinterrupted roughly every 10 minutes
Need to optimize collaboration grows as interactions increase
Solution: structured networks
From To
Measure your networkMeasure your network
• Cohesion – 2.5Cohesion – 2.5
• Density – 50%Density – 50%
• Centrality – 2.3Centrality – 2.3
Measure your networkMeasure your network
• Cohesion – 2.5Cohesion – 2.5
• Density – 50%Density – 50%
• Centrality – 2.3Centrality – 2.3
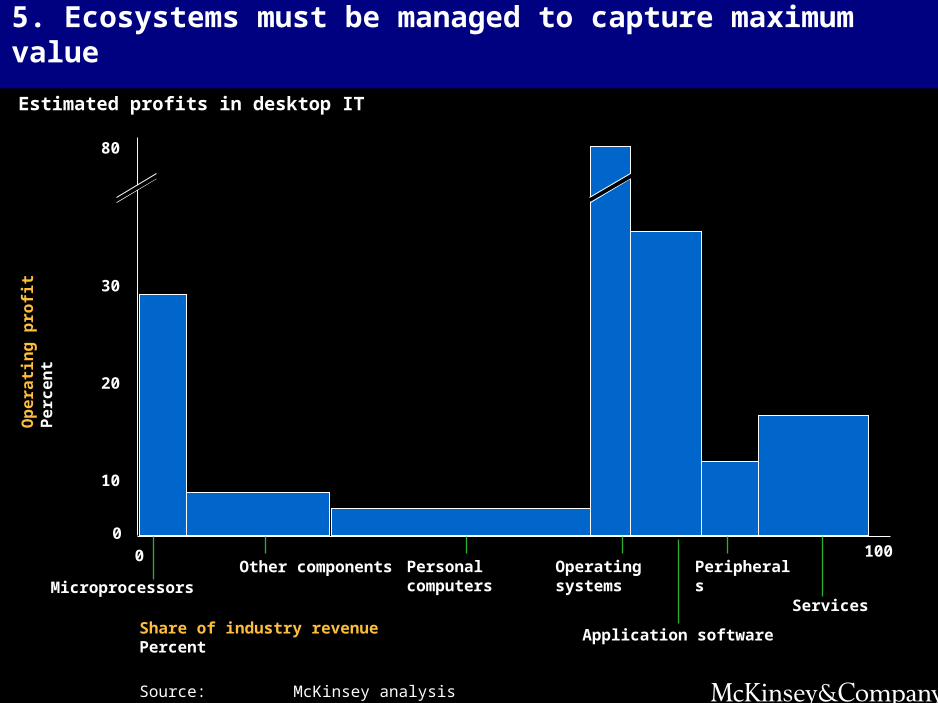
5. Ecosystems must be managed to capture maximum value
Estimated profits in desktop IT
Source: McKinsey analysis
Share of industry revenuePercent
80
0
0 100
30
20
10
MicroprocessorsOther components Personal
computersOperating systems
Application software
Peripherals
Services
Op
era
tin
g p
rofi
t P
erc
en
t
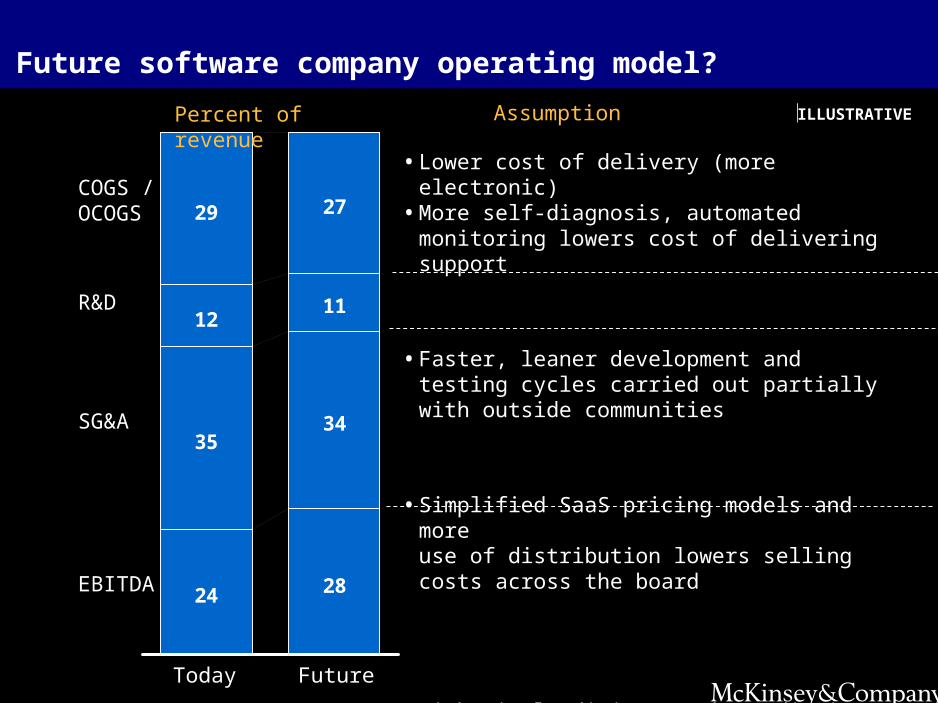
Future software company operating model?
24 28
3534
1211
29 27
SG&A
Today Future
Percent of revenue
COGS /OCOGS
R&D
EBITDA
• Lower cost of delivery (more electronic)• More self-diagnosis, automated monitoring lowers
cost of delivering support
• Faster, leaner development and testing cycles carried out partially with outside communities
• Simplified SaaS pricing models and more use of distribution lowers selling costs across the board
• High single digit growth predictions come true• Price pressure remains limited in enterprise
segments
Assumption ILLUSTRATIVE
Contact Information
Gareth MorganHigh Tech and Telecom Engagement Manager, McKinsey DublinDirect 01- 405 [email protected]