Tools of Quality in Determining the Characteristics of Services in...
6
53 “Naše more” 62(2)/2015., pp. 53-58 Tools of Quality in Determining the Characteristics of Services in Maritime Passenger Transport Alati kvalitete u određivanju karakteristika usluge u pomorskom putničkom prometu KEY WORDS maritime passenger transport fast passenger transport quality function deployment (QFD) Ishikawa diagram characteristics of maritime passenger transport service DOI 10.17818/NM/2015/2.2 UDK 656.61 : 658.56 Preliminary communication / Prethodno priopćenje Paper accepted / Rukopis primljen: 1. 2. 2015. KLJUČNE RIJEČI pomorskoputnički promet brzobrodski putnički promet quality function deployment (QFD) Ishikawa dijagram karakteristike pomorskoputničke usluge Veljko Plazibat University of Split Faculty of Maritime Studies, Split e-mail: [email protected] Maja Krčum University of Split Faculty of Maritime Studies, Split e-mail: [email protected] Summary The essential purpose of this paper is to show how the tools of quality traditionally used in production processes can be efficiently applied to determining the characteristics of services in maritime passenger transport. Defining the characteristics of services in maritime passenger transport is the key to shipping company’s performance and raising competitive advantages of the overall sea- borne passenger traffic on maritime markets. The paper is based on the application of the QFD (quality function deployment) method and the Ishikawa diagram as an auxiliary tool in the implementation of the QFD method. The insights achieved in this paper can assist the managers of shipping companies in enhancing the existing and the introduction of new competitive services in maritime passenger transport. Sažetak Temeljni cilj ovoga rada je pokazati kako se alati kvalitete, koji se tradicionalno upotrebljavaju u proizvodnim procesima, mogu učinkovito primijeniti u određivanju karakteristika prometne usluge u pomorskom putničkom prometu. Određivanje temeljnih karakteristika spomenute usluge ključno je za uspješnost brodarskih poduzeća, ali i za podizanje konkurentskih prednosti cjelokupnog pomorskoputničkog prometa na prometnom tržištu. Rad se temelji na primjeni QFD (quality function deployment) metode te Ishikawinog , kao pomoćnog alata u provođenju QFD metode. Dobivene spoznaje u radu mogu biti od pomoći menadžerima brodarskih poduzeća pri unapređenju postojećih i uvođenju novih konkurentnih usluga u pomorskoputničkom prometu. INTRODUCTION / Uvod The introduction of fast vessels marks a new era in Croatia’s maritime passenger traffic. From 2007 to 2014 the overall transit of passengers on 16 fast-vessel lines amounted to around 1,100,000 passengers, i.e. slightly less than 10% of the overall transported passengers in maritime traffic. Following an almost 100% rise in 2007 compared to 2006, the sea-borne movement on fast-vessel lines indicated certain constraints of the market potential with regard to the existing operation of fast lines established for the inter-island connection and the connection of the inhabited islands and the mainland. The increase in the existing potential of the fast passenger shipping in future implies the expected introduction of an increasing number of even faster vessels as well as the establishment of fast-vessel lines connecting major coastal ports: Rijeka – Pula, Pula – Zadar, Rijeka – Zadar, Zadar – Šibenik, Zadar – Split, Šibenik – Split, Split – Dubrovnik, Ploče – Dubrovnik, which will result in an entirely new dimension of this segment of maritime passenger traffic. Such a development could present Croatia as a land of innovative ideas and original approaches to their implementation, and become an example of introducing identical and similar inter-port fast passenger shipping lines across the entire Adriatic Sea. Obviously the establishment of the inter-port fast line services in the maritime traffic in the Republic of Croatia would contribute to reducing pressure on road transportation and would minimise the adverse effects of the road traffic. Moreover, such transport policy would enable a Tomislav Skračić University of Split Faculty of Maritime Studies, Split e-mail: [email protected]
Transcript of Tools of Quality in Determining the Characteristics of Services in...

53“Naše more” 62(2)/2015., pp. 53-58
Tools of Quality in Determining the Characteristics of Services in Maritime Passenger Transport
Alati kvalitete u određivanju karakteristika usluge u pomorskom putničkom prometu
KEY WORDSmaritime passenger transportfast passenger transportquality function deployment (QFD)Ishikawa diagramcharacteristics of maritime passenger transport service
DOI 10.17818/NM/2015/2.2UDK 656.61 : 658.56Preliminary communication / Prethodno priopćenje Paper accepted / Rukopis primljen: 1. 2. 2015.
KLJUČNE RIJEČIpomorskoputnički prometbrzobrodski putnički prometquality function deployment (QFD)Ishikawa dijagramkarakteristike pomorskoputničke usluge
Veljko PlazibatUniversity of SplitFaculty of Maritime Studies, Splite-mail: [email protected]
Maja KrčumUniversity of SplitFaculty of Maritime Studies, Splite-mail: [email protected]
SummaryThe essential purpose of this paper is to show how the tools of quality traditionally used in production processes can be efficiently applied to determining the characteristics of services in maritime passenger transport. Defining the characteristics of services in maritime passenger transport is the key to shipping company’s performance and raising competitive advantages of the overall sea-borne passenger traffic on maritime markets. The paper is based on the application of the QFD (quality function deployment) method and the Ishikawa diagram as an auxiliary tool in the implementation of the QFD method. The insights achieved in this paper can assist the managers of shipping companies in enhancing the existing and the introduction of new competitive services in maritime passenger transport.
SažetakTemeljni cilj ovoga rada je pokazati kako se alati kvalitete, koji se tradicionalno upotrebljavaju u proizvodnim procesima, mogu učinkovito primijeniti u određivanju karakteristika prometne usluge u pomorskom putničkom prometu. Određivanje temeljnih karakteristika spomenute usluge ključno je za uspješnost brodarskih poduzeća, ali i za podizanje konkurentskih prednosti cjelokupnog pomorskoputničkog prometa na prometnom tržištu. Rad se temelji na primjeni QFD (quality function deployment) metode te Ishikawinog , kao pomoćnog alata u provođenju QFD metode. Dobivene spoznaje u radu mogu biti od pomoći menadžerima brodarskih poduzeća pri unapređenju postojećih i uvođenju novih konkurentnih usluga u pomorskoputničkom prometu.
INTRODUCTION / UvodThe introduction of fast vessels marks a new era in Croatia’s maritime passenger traffic. From 2007 to 2014 the overall transit of passengers on 16 fast-vessel lines amounted to around 1,100,000 passengers, i.e. slightly less than 10% of the overall transported passengers in maritime traffic. Following an almost 100% rise in 2007 compared to 2006, the sea-borne movement on fast-vessel lines indicated certain constraints of the market potential with regard to the existing operation of fast lines established for the inter-island connection and the connection of the inhabited islands and the mainland. The increase in the existing potential of the fast passenger shipping in future implies the expected introduction of an increasing number of even faster vessels as well as the establishment of
fast-vessel lines connecting major coastal ports: Rijeka – Pula, Pula – Zadar, Rijeka – Zadar, Zadar – Šibenik, Zadar – Split, Šibenik – Split, Split – Dubrovnik, Ploče – Dubrovnik, which will result in an entirely new dimension of this segment of maritime passenger traffic. Such a development could present Croatia as a land of innovative ideas and original approaches to their implementation, and become an example of introducing identical and similar inter-port fast passenger shipping lines across the entire Adriatic Sea. Obviously the establishment of the inter-port fast line services in the maritime traffic in the Republic of Croatia would contribute to reducing pressure on road transportation and would minimise the adverse effects of the road traffic. Moreover, such transport policy would enable a
Tomislav SkračićUniversity of SplitFaculty of Maritime Studies, Splite-mail: [email protected]
54 V. Plazibat et al: Tools of Quality in Determining the Characteristics of Services in Maritime...
better valorisation of the sea and seaways.With regard to the above described potentials, the basic
task of this paper is to explore the characteristics of services in maritime passenger transport from the viewpoint of service users and to examine the competitiveness of potential inter-city fast lines in the maritime and traffic system in the Republic of Croatia. In order to achieve the purpose and goals of the research, the paper combines a number of scientific methods and tools of quality, e.g. the QFD method (Quality Function Deployment) and the Ishikawa diagram. The QFD method was designed in Mitsubishi in 1972 and was used by numerous Japanese and American companies with the purpose of solving problems regarding the product design and launching new products. [5] The method was developed to help meet customers’ requirements by developing corresponding technical specifications that were feasible through the process of designing and production. [1] Given the fact that the QFD is a very general method, it is also possible to use it beyond traditional application in the integrated development of new products. In addition to product development, the QFD is applied in the development of services. This allows the use of this method in the management of fast inter-port lines in sea-borne passenger transport. This research uses a two-phase QFD process for determining crucial characteristics of transport service in fast passenger transport and for selecting an appropriate form of transport. The structure which the QFD uses to organise information is known as the House of Quality – it is a product / service planning matrix that summarises the understanding of the customer needs. In our case, the first House of Quality presents a mutual relationship of the desirable characteristics of the service in maritime passenger traffic and the corresponding characteristics of service providers on a specific shipping route. The second House of Quality presents the relationship between the required characteristics of the passenger transport service and the characteristics of concrete forms of transport available to users on a particular route.
THEORETICAL FRAMEWORK, RESEARCH PROBLEM AND METHODOLOGICAL APPROACH / Teorijski okvir, istraživački problem i metodološki pristupThe existing domination of road traffic in the Republic of Croatia as a tourism-oriented country is not sustainable in the long run. The situation requires defining and introducing active traffic and shipping measures and policy aimed at reducing the share of the road traffic, particularly at major sea tourism destinations. Analyses of passenger traffic movement in Croatia have confirmed that sea-borne passanger traffic has increased despite global economic crisis. Analyses have proven the continuous users’ interest, as well as the vitality and importance of maritime passanger transport as a function of sustainability of Croatia’s traffic system. By introducing fast coastal inter-port passenger trades, the shippers would contribute to the realisation of the goals of the national traffic and maritime policy and would improve, considerably and directly, Croatia’s passenger shipping and maritime economy in general. Coastal runs could generate positive effects within the national maritime and traffic system in terms of balance among traffic modes. The existing 16 fast passenger lines that connect Croatian cities with the islands experience a continuous increase in passengers; it is reasonably to assume that the establishment of similar coastal services would bring new quantitative benefits to the traffic system of the Republic of Croatia. This would also result in a more adequate valorisation of the sea as an alternative to the road traffic along the coast. Consequently, passenger traffic flows would be diverted from land to sea and new forms of transport would be established.
As appropriate tools of quality in the service development process, the QFD method and Ishikawa diagram have been used for assessing the competitiveness of fast inter-port lines in the traffic system of the Republic of Croatia and for determining the essential characteristics of the services in the maritime passenger transport. The House of Quality represents an
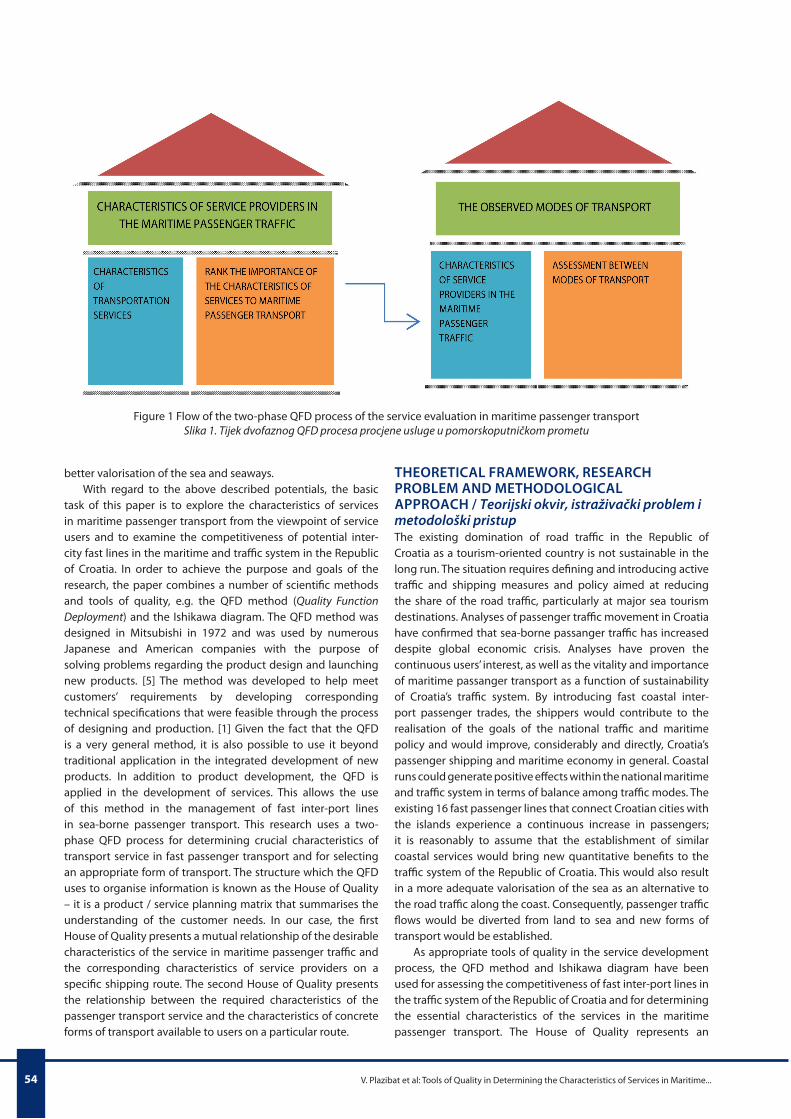
Figure 1 Flow of the two-phase QFD process of the service evaluation in maritime passenger transportSlika 1. Tijek dvofaznog QFD procesa procjene usluge u pomorskoputničkom prometu

55“Naše more” 62(2)/2015., pp. 53-58
essential QFD quality planning tool. A full QFD process consists of six Houses of Quality displayed as matrices in a graphic form. Each House of Quality is developed from the previous one so that the data entered in the columns of the previous matrix are entered in the rows of the following matrix, thus enabling the introduction of new requirements into the columns of this matrix and the transit towards the next phase of the process. In this way, the QFD method enables the customers’ qualitative requirements to be converted into quantitative requirements of the production. [6] A specific number of steps within a QFD process are arbitrarily chosen by the organisation that implements this method.
The creation of the House of Quality matrix starts by taking into account the service users in the maritime passenger transport and by determining the transport service characteristics that they find relevant. The next step involves the presentation of a two-phase QFD process with the purpose of evaluating alternative providers of transport services on a specific route. The result of each phase is displayed as a separate House of Quality that enables the ranking of the importance of individual requests and individual characteristics of a transport service. The first House of Quality displays the relationship between the service characteristics that are important for users and the characteristics of potential service providers. The flow of the QFD process is presented in Figure 1.
The characteristics of services in the maritime passenger transport are the inputs into the first matrix; they are entered in the rows and are called “Whats” as they answer to the question “what”. On the other hand, the characteristics of the service providers represent the outputs of the first matrix. They are “Hows” and are entered into the columns, answering to the question “how”. The starting point of the first House of Quality is the characteristics of the transport service that is provided on a specific route. These characteristics are then translated into the characteristics that a provider of the maritime passenger transport service should have in order to timely provide the requested service on a specific route. The central part of the House of Quality shows the mutual relationship, i.e. the connection among the characteristics, and results in the ranking of the importance of the service provider’s individual characteristics. The importance ranking serves as a rating when deciding on the form of transport. The output of the first phase is the input of the second phase, as shown in Figure 1.
In the second House of Quality, the crucial characteristics of the service provider in maritime passenger transport become the input of the matrix; they are entered into the rows, answering the question “What”. The performances of the service providers that are taken into consideration answer to the question “How”; they represent the output of the second matrix and are entered into the columns. The central part of the House displays the relationship between the inputs and outputs, showing to what extent the individual service providers meet the requested characteristics. The final result is the rating of the service providers, which allows a passenger to select a form of transport on a specific route.
The final output of the Quality Function Deployment (QFD) process of evaluating transport service providers always involves the performances of the analysed forms of transport, while the initial input depends on the number of phases, i.e. the number of constructed Houses of Quality. As for the
described two-phase QFD process, the initial input includes the characteristics of the maritime passenger transport services that are established on a particular route. Tidwell and Sutterfield (2012) suggest the application of the Ishikawa diagram for determining the initial input in the multi-phase QFD process; in this case, determining the crucial characteristics of a fast maritime passenger transport.
The Ishikawa diagram was devised by Japanese professor and quality management guru Kaoru Ishikawa, a pioneer of quality management, in the 1960s. The diagram is also known as a Fishbone diagram or a Cause and Effect diagram. It is a quality management tool that enables a logical analysis of a problem related to a process and, more importantly, identifies causes and reasons for the imperfection and the overall problem. Just like the QFD method, the Ishikawa diagram is a general tool of quality control applicable to a variety of production and non-production activities. For instance, instead of a problem that needs to be solved, the Ishikawa diagram may be aimed at an issue that needs to be better understood or elaborated in detail through teamwork.
At any rate, the first step in creating a diagram involves the definition of a problem or an issue. In our case, it is important to define the main characteristics that determine the analysed transport service in the area of passenger shipping. These characteristics enter the left side of the diagram and correspond to the causes in the classical Ishikawa diagram. Questions such as “What”, “When”, “Why” and “How” may help when determining the characteristics. Furthermore, each characteristic is additionally analysed which results in additional associated measures that correspond to the sub-causes in the classical Ishikawa diagram. These measures are entered on the left side of the diagram, below the corresponding characteristic of the transport service. The completed graphic layout of an Ishikawa diagram resembles the side view of a fish skeleton so that this tool is often called a Fishbone diagram, or even “Fishikawa” diagram.
Figure 2 shows the Ishikawa diagram defining the main characteristics of a sea-borne passenger transport service to be established on a specific route.
Once the diagram has been designed, it can be analysed. The relationships can be described mathematically:
UPP = f (S, SP, DT, IT, VP) [1]
where:UPP – maritime passenger transport serviceS – safety of maritime passenger transportSP – ability to produce a service in maritime passenger transportIT – individual travel costs in maritime passenger transportDT – social costs of maritime passenger transportVP – travel time
Overall costs of performing maritime passenger transport on a specific route include all individual travel costs, shipper’s costs (arising from the shipper’s ability to create a maritime passenger transport service) and social costs of transport.
UTPP = IT + TB + DT [2]

56 V. Plazibat et al: Tools of Quality in Determining the Characteristics of Services in Maritime...
where:UTPP – overall cost of performing maritime passenger
transportIT – individual travel costs in maritime passenger transportTB – shipper’s costs in maritime passenger transportDT – social costs of transport
The Ishikawa diagram provides a clear insight and guidelines regarding the issues on which a shipping company should focus. The diagram presents five major characteristics of the transport service to be taken into consideration, as these are the characteristics through which the transport users evaluate a specific form of transport; hence these are the characteristics that make the initial input in the first House of Quality in the two-phase QFD process: individual travel costs, travel time, safety, social costs of transport, and ability of creating the traffic service.
The next step is to define the characteristics of the providers of the maritime passenger transport service: these characteristics are necessary to meet the major characteristics of the transport service, as determined by the Ishikawa diagram. The characteristics of maritime passenger transport service are entered as rows into the first House of Quality, whereas the characteristics of the service providers are entered as columns. The third step is to determine the importance rating of each characteristic of the maritime passenger transport service with regard to other characteristics. The fourth step comprises the valuation of relationship between the characteristics of the service and the characteristics of the service provider, i.e. the assessment of the rating for each characteristic of the service
provider, which reflects the provider’s effects on the service characteristics. It is common to use the scale from 1 to 9, where 1 stands for the minimum importance (effect), while 9 represents the maximum importance (effect) [4], but other scales and other ranges can be used [2]. A 1-to-5 rating scale has been selected for the purpose of this research as this type of scale seems suitable for the examined population.
RESEARCH RESULTS AND DISCUSSION / Rezultati istraživanja i raspravaThe first House of Quality is displayed as a matrix in Table 1. The importance ratings of the transport service characteristics were defined through the method of interviewing the passengers at the route Rijeka – Rab – Novalja and back, in June 2013 (N=56). The analysis of the information provided by the respondents has produced the following average importance ratings for the individual characteristics of the maritime passenger transport service: 1) individual travel costs – 4.27; 2) social costs of traffic – 2.17; 3) travel time – 3.95; 4) safety – 3.09; and 5) ability to create the transport service – 3.74. After calculating the average grades and the value of each characteristic of the maritime passenger transport service, the importance ratings ranging from 1 to 5 have been determined. The importance ratings are entered into the penultimate row of Table 1.
After that, the individual characteristics of the service provider have been evaluated with regard to their efficiency in satisfying the individual characteristics of the maritime passenger transport service. The intensity of these effects is shown by the symbols whose explanation is provided at the bottom of Table 1. Each numerical value of the interrelationship
Figure 2 Ishikawa diagram of determining the characteristics of a maritime passenger transport serviceSlika 2. Ishikawa dijagram određivanja karakteristika usluge pomorskoputničkog prijevoza

57“Naše more” 62(2)/2015., pp. 53-58
Characteristics of the type of transport on a specific route
Characteristics of the transport service provider on a specific route
Fast passenger vessel Bus (Coach) Train Personal car
Importance ratings of the
alternative form of transport
Number of departures * 9 + 27 * 9 # 45 9
Reliability # 135 + 81 * 27 + 81 27
Price + 60 + 60 # 100 + 60 20
Speed + 72 + 72 * 24 # 120 24
Personnel * 20 * 20 * 20 0 0 20
Result 296 260 180 306 -
Result (%) 59.20% 52.00% 36.00% 61.20%
Ranking of the transport service provider on a specific route 2 3 4 1
Legend: * poor effect (rating 1), + moderate effect (rating 3), # strong effect (rating 5), no effect (rating 0).
between characteristics of the maritime passenger transport service and the characteristics of the service provider is multiplied by the importance rating of the characteristics of the service; the mathematical addition produces the overall grade for each characteristic of the provider of service in maritime passenger transport and determines its relative standing that corresponds to the share of an individual characteristic (expressed as a percentage) in the overall effect of all discussed characteristics of the service provider in maritime passenger
transport. The matrix of the House of Quality is presented in grey colour.
It consists of five rows and five columns, corresponding to the number of characteristics of the maritime passenger transport service, i.e. the number of characteristics of the service provider in maritime passenger transport. Table 1 clearly shows that the provider’s reliability and the speed of transport are the essential characteristics of the service provider, having the strongest effect on meeting the crucial service characteristics. These
Table 1 The first House of QualityTablica 1. Prva kuća kvalitete
Characteristics of the service provider in maritime passenger transport – the shipper
Characteristics of the maritime passenger transport service
Number of departures Reliability Price Speed Crew
Impo-rtance
ratings of the service
chara-cteristics
Total
Individual travel costs 0 0 * 5 # 25 + 15 0 0 5 45
Social costs of transport # 5 + 3 0 0 + 3 + 3 1 14
Travel time 0 0 + 12 0 0 # 20 + 12 4 44
Safety * 2 # 10 0 0 * 2 # 10 2 24
Ability of creating the traffic service + 9 # 15 * 9 0 0 + 9 3 42
Result 16 45 34 40 34 - 169
Relative importance of the characteristics of the maritime passenger transport service
9.46 26.62 20.11 23.66 20.11
Legend: * poor effect (rating 1), + moderate effect (rating 3), # strong effect (rating 5), no effect (rating 0).
Table 2 The second House of QualityTablica 2. Druga kuća kvalitete

58 V. Plazibat et al: Tools of Quality in Determining the Characteristics of Services in Maritime...
categories are followed by price and crew (personnel), whose relative importance amounts to 20.11%, whereas the number of departures is ranked as the least important characteristic of the maritime passenger transport service.
The construction of the first House of Quality completes the first phase of the Quality Function Deployment (QFD) process, resulting in the impartial determination of the importance ratings of the individual characteristics of the provider of maritime passenger transport service. During the second phase of the QFD process, the output of the first phase becomes the input of the second House of Quality. The advantage of the multi-stage QFD process is that the importance ratings of the next phase’s input results from mathematical operations performed in the previous phase. This implies that the ratings are not set in a subjective way, which would occur if a single-phase QFD process with only one House of Quality was used. The steps taken in the second phase of the QFD process correspond to the steps taken in the first phase. The only difference is that the crucial characteristics of the service provider now become the input, whereas the performances of the considered service providers on a specific route become the output of the House of Quality. Due to the transfer of the results from the first House of Quality, the importance ratings of the providers of service in maritime passenger transport are not determined in a subjective way. Table 2 presents the second House of Quality.
The second House of Quality provides a comparative analysis of the ability of four types of transport to meet the required characteristics. The matrix of the House of Quality is presented in gray colour. It consists of five rows and four columns, corresponding to the number of inputs and outputs. The characteristics of the transport service provider on a specific route are entered into the rows of Table 2, while the performances of the discussed types of transport are presented in columns. The importance ratings of the individual characteristics of the service provider on a specific route have been transferred from the first House of Quality into the last column of Table 2. The next step is to evaluate to what extent an individual form of transport meets each of the required characteristics. As in the first House of Quality, a 1-to-5 rating scale has been used although other scales and other ranges can be used. The assessment of the transport service provider’s ability to meet the individual characteristics is shown by the symbols whose explanation is provided at the bottom of Table 2. The numerical value of the assessment of the providers’ performances on a specific route is multiplied by the importance rating of the importance of the characteristics of the individual types of transport; a simple mathematical addition produces the overall absolute grade for the performance of each transportation form. The highest grade that can be achieved is 500. The result of each transportation form is expressed as a percentage, in order to see to what extent the required characteristics have been satisfied.
The ranking of the discussed forms of transport and their ability to meet the required characteristics is determined in line with the grades. The results are shown in the bottom row of Table 2. Transport by personal car has achieved the highest overall grade: 306 points, i.e. 62% of all required characteristics. This result could be even higher if the category “crew/personnel” was evaluated, because the users of personal cars typically boast of their driving skills, so that this category could be given the highest grade (5). In this case, transport by personal car
would satisfy as much as 81.20% of the required characteristics. This means that the domination of road traffic will continue. The second highest ranking among the transportation forms has been achieved by fast passenger vessels, totalling 296 points, i.e. meeting 59.20% of all required characteristics. The results produced by this research clearly indicate that the introduction of fast vessels can make inter-port maritime passenger transport very competitive with the transport of passengers by bus or train.
CONCLUSION / ZaključakThe initiative to organise fast inter-port passenger shipping lines arises from the need for extending market potentials of the shipping companies in this segment of maritime passenger transport, and from the need for using numerous benefits of maritime traffic which is generally safer, more reliable, more environment-friendly and economically more attractive than other modes of transportation. The introduction of fast inter-port passenger shipping lines would increase the spacial mobility of local population and tourists and decrease the seasonal quality as a dominant feature of Croatia’s maritime passenger transport. This would also enable a more adequate valuation of the sea as a mode of transport and an alternative to other forms of transport in the coastal traffic connection and transportation.
There are five major characteristics of the transport service which should be taken into consideration. They have been sorted out with the aid of the Ishikawa diagram as these are the characteristics through which the transport service users evaluate a specific form of transport. The five major characteristics, which make the initial input in the first House of Quality in the two-phase Quality Function Deployment (QFD) process, include: individual travel costs, travel time, safety, social costs of transport, and ability of creating the traffic service. The second House of Quality provides a comparative analysis of the ability of four types of transport to meet the required characteristics: fast passenger vessel, bus (coach), train and personal car. The performed analysis confirms the continuing domination of the road traffic (by car) but also indicates a competitive advantage of potential fast inter-port shipping lines with respect to the transport of passengers by bus or by train. The analysis also reveals a high competitive potential of fast inter-port lines with regard to the presently prevailing transport by personal cars.
REFERENCES / Literatura[1] Akao, Y., Mazur, G. H.: “The leading edge in QFD: past, present and future”, in:
International Journal of Quality & Reliability Management, Vol. 20, No.1, pp. 20-35.
[2] Ho, W., Dey, P. K., Lockström, M.: “Strategic sourcing: A combined QFD and AHP approach in manufacturing”, in: Supply Chain Management: An International Journal 16(6), 2011, pp. 446–461.
[3] Kesić, B., Jugović, A.: Menadžment pomorskoputničkih luka, Pomorski fakultet u Rijeci, Rijeka, 2006.
[4] Mehrjerdi, Z. Y.: “Applications and extensions of quality function deployment”, in: Assembly Automation, Vol. 30, Iss: 4, 2010, pp. 388-403.
[5] Schroeder, R.: Upavljanj eproizvodnjom, Mate d.o.o., Zagreb, 1999.[6] Tidwell, A., Sutterfield, J. S.: “Supplier selection using QFD: a consumer
products case study”, in: International Journal of Quality & Reliability Management, Vol. 29, No. 3, 2012, pp. 284-294.
[7] Krile, S., ‘’Efficient Heuristic for Non-linear Transportation Problem on the Route with Multiple Ports’’, Polish Maritime Research, Gdansk, Poland, 2013, Vol. 20, No 4, pp. 80-86
[8] Krile, S., ‘’Passage Planning with Several Ports of Loading and Discharging’’, Planiranje plovidbe s više luka ukrcaja i iskrcaja, Our sea (Naše more), Vol. 60, No 1-2, Dubrovnik, 2013. pp. 21-24
![Page 1/53 - chiptuningshop.com · Cars/LCV MANUFACTURER & MODEL Engine Fuel FID Ecu Type Module [TOOLS] OBD tools Toyota ECM All 8 Denso 76F00xx / MPC565 Toyota Gen1 Virtual Reader](https://static.fdocuments.us/doc/165x107/5e08496efc885b55a00f7c49/page-153-carslcv-manufacturer-model-engine-fuel-fid-ecu-type-module-tools.jpg)