Tools for Delivering on Green Growth - OECD.org · TOOLS FOR DELIVERING GREEN GROWTH © OECD 2011 5...
29
Tools for Delivering on Green Growth
-
Upload
nguyenngoc -
Category
Documents
-
view
218 -
download
1
Transcript of Tools for Delivering on Green Growth - OECD.org · TOOLS FOR DELIVERING GREEN GROWTH © OECD 2011 5...

Tools for Delivering on Green Growth


TOOLS FOR DELIVERING GREEN GROWTH
© OECD 2011 3
Table of contents
Tools for delivering on green growth ......................................................................................... 5
Diagnose key constraints to green growth ............................................................................... 5 Establish effective institutional arrangements .......................................................................... 7 Construct policy packages ........................................................................................................ 8 Facilitate adjustment and address transitional concerns ......................................................... 19
Tables
Table 1. Integrating green growth into economic policy .............................................. 8 Table 2. Possible policies to address green growth constraints .................................... 9 Table 3. Examples of policy challenges by development status ................................. 10 Table 4. Taxes and trading schemes: strengths and weaknesses ................................ 11 Table 5. Non-price instruments: strengths and weaknesses ....................................... 13 Table 6. Potential expenditure instruments................................................................. 15 Table 7. Possible policies to foster green innovation ................................................. 17 Table 8. Key dimensions for greening household behaviour ..................................... 18 Table 9. Boosting investment in infrastructure: barriers and solutions ...................... 19 Table 10. Possible policies to foster labour market transition to green growth ............ 20 Table 11. Reducing adverse impacts on international competitiveness ....................... 21 Table 12. Addressing competitiveness impacts on energy-intensive industries ........... 22
Figure
Figure 1. Green growth diagnostic ........................................................................................... 6


TOOLS FOR DELIVERING GREEN GROWTH
© OECD 2011 5
Tools for delivering on green growth
A range of policy options are available for driving green growth. This document outlines these
options and summarises many of the issues that need to be taken into account when embarking on a
green growth strategy.
Diagnose key constraints to green growth
As discussed in Towards Green Growth, there are a range of constraints which can prevent the
emergence of greener growth. These will vary from country to country and depending on particular
environmental issues at stake. Figure 1 develops a diagnostic framework for identifying key constraints
to greening growth. It characterises constraints to green growth as factors which limit returns to “green”
investment and innovation i.e. those activities which can foster economic growth and development while
ensuring that natural assets continue to provide the resources and environmental services on which our
well-being relies.
These constraints are divided into two categories:
The first is low overall economic returns, encapsulating factors which create inertia in
economic systems (i.e. fundamental barriers to change and innovation) and capacity
constraints, or “low social returns”.
The second is low appropriability of returns. This is where market and government failures
prevent people from capturing the full value of improved environmental outcomes and
efficiency of resource use. Examples include fossil fuel subsidies (government failure) or a lack
of incentives for constructing energy efficient buildings (split incentives) or reducing air
pollution (negative externalities).
Low economic returns which are a function of inertia constrain the expansion of new or innovative
production techniques, technologies and patterns of consumption. These constraints to green innovation
are a mixture of market failure and market imperfection. Low returns to R&D are a market failure.
Network effects (e.g. barriers to entry that arise from increasing returns to scale in networks) and the bias
in the market towards existing technologies are examples of market imperfection. The exception to this is
that government failure can arise from attempts to deal with these market failures (e.g. regulatory barriers
to competition and government monopolies in network industries).
“Low social returns” implies the absence of enabling conditions for increasing returns to low
environmental impact activities. These constraints reduce the choices of consumers and producers to
pursue “green” activities. For example, inadequate electricity or water sanitation infrastructure may lead
to water pollution or the use of high emission fuels or inefficient production of electricity. They can also
include insufficient human capital such that people are not aware of alternative sources of energy or there
is insufficient technical know-how to deploy them. In addition, at low levels of development, a mixture
of poor infrastructure with low human capital and institutional quality can mean heavy reliance on
natural resource extraction and little incentive for improved natural resource use like sustainable forest
TOOLS FOR DELIVERING GREEN GROWTH
6 © OECD 2011
management. These constraints reflect a mixture of government failure, market failures and market
imperfections.
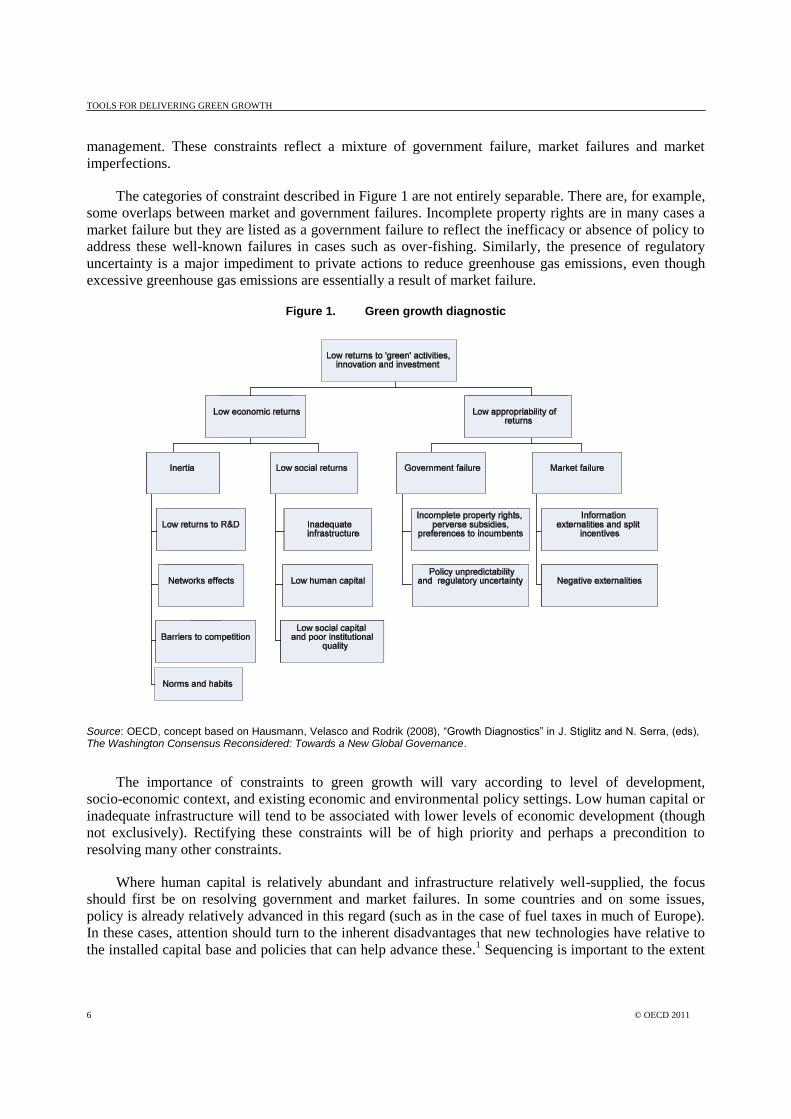
The categories of constraint described in Figure 1 are not entirely separable. There are, for example,
some overlaps between market and government failures. Incomplete property rights are in many cases a
market failure but they are listed as a government failure to reflect the inefficacy or absence of policy to
address these well-known failures in cases such as over-fishing. Similarly, the presence of regulatory
uncertainty is a major impediment to private actions to reduce greenhouse gas emissions, even though
excessive greenhouse gas emissions are essentially a result of market failure.
Figure 1. Green growth diagnostic
Source: OECD, concept based on Hausmann, Velasco and Rodrik (2008), “Growth Diagnostics” in J. Stiglitz and N. Serra, (eds), The Washington Consensus Reconsidered: Towards a New Global Governance.
The importance of constraints to green growth will vary according to level of development,
socio-economic context, and existing economic and environmental policy settings. Low human capital or
inadequate infrastructure will tend to be associated with lower levels of economic development (though
not exclusively). Rectifying these constraints will be of high priority and perhaps a precondition to
resolving many other constraints.
Where human capital is relatively abundant and infrastructure relatively well-supplied, the focus
should first be on resolving government and market failures. In some countries and on some issues,
policy is already relatively advanced in this regard (such as in the case of fuel taxes in much of Europe).
In these cases, attention should turn to the inherent disadvantages that new technologies have relative to
the installed capital base and policies that can help advance these.1 Sequencing is important to the extent

TOOLS FOR DELIVERING GREEN GROWTH
© OECD 2011 7
that resolving low returns to activities with low environmental impact will create market conditions that
are conducive to the introduction of new green technologies.
Identifying which constraints are most important is not, however, entirely sequential. In particular,
while institutions in some countries may not presently be equipped to address environmental
externalities, government failures or split incentives could be addressed. In other cases, environmental
externalities may not be fully addressed but there may still be scope to address low returns to R&D.
One constraint which is likely to be common to all countries, regardless of development, is
regulatory certainty i.e. the extent to which governments articulate and ideally legislate a clear plan for
closing the gaps between private and social return so that people can plan and act without too much risk
that governments will change the rules of the game.
The diagnosis of key constraints will require country-specific information and data from across the
environment and the economy as well as an appreciation for links to global economic and environmental
trends. The indicators discussed in Chapter 4 of Towards Green Growth provide high-level measures
which can be used to inform a diagnosis of constraints to green growth.
Establish effective institutional arrangements
In most countries, new institutional arrangements will need to be established to guide the
development of green growth strategies and to overcome the institutional inertia and silos that exist
around economic and environmental policy making. For many developing countries, this will involve
significant capacity building for integrating environmental issues into national development planning
processes, including Poverty Reduction Strategies (PRSPs). In OECD countries, the primary focus will
need to be on establishing governance structures at the highest levels of government and on ensuring
co-ordination between different areas and levels of government (OECD, 2011a).
Specific steps for developing institutional capacity will depend on whether green growth strategies
need to be incorporated into an existing and regular national development planning process or whether
such a process will need to be initiated (Clapp, Briner and Karousakis, 2010). In all cases, the goal
should be to integrate green growth into policy processes, rather than create stand-alone policy
documents or agencies. A more co-ordinated response will be needed. Table 1 lays out some of the key
strategic issues that will need to be addressed in this regard.

TOOLS FOR DELIVERING GREEN GROWTH
8 © OECD 2011
Table 1. Integrating green growth into economic policy
Strategic priorities Priority issues, actions and actors
Assess the enabling environment e.g.
Overall policy process
Strategy development process
Public dialogue
Assess existing institutional arrangements with respect to economic strategies and development planning
Link to key national policy issues e.g. infrastructure investment, food production, rural poverty
Enlist experts with an understanding of links between environmental and economic policy
Identify key actors e.g.
Government actors
Opinion formers
“Champions”
Finance, economic development or planning ministries
Environment and natural resource agencies
Sector ministries
Civil society organisations
Private sector
Identify opportunities to shape organisational incentives e.g.
Incentives
Cross-agency working
Understanding different perspectives
Assess weaknesses in current (inter-agency) institutional set-up
Enable participation of environmental agencies in key national planning and economic policy development processes e.g. involvement in key working groups
Ensure incentives for economic and budget or development planning agencies to take account of relevant environmental issues
Promote operational collaboration between key agencies
Identify best available “entry point” in National Development Plans cycle and potential role of “champions”
Prioritise according to realistic assessment of opportunities to effect improvements in policy process
Identify awareness and knowledge needs e.g.
Briefing
Training
Knowledge products
Ensure key actors in environmental agencies understand the framework and process for economic management and development planning
Awareness raising on links between environment and social impacts, for both environment and economic policy agencies
Provide knowledge products e.g. primers, case studies, exchange visits
Identify analytical tools to be adopted and develop relevant training
Country-specific evidence
Making the economic case
Policy development
Technical support/training on ecosystem services assessment and economic analysis of environmental assets and services
Technical support/training to economic analysis targeted at planning processes e.g. value of environment to specific long-term economic and social objectives
Technical support/training to analysis of effectiveness of cost-benefit of environmental policies and investments
Address options for policy influence
Revise policy priorities
Implementation strategies
Measures and investments
Provide support on using results of technical analysis to fit decision-making process
Support to “making the economic case” for specific environmental policy measures
Develop skills in communication and negotiation for environmental agencies staff
Engage civil society organisations with potential to contribute positively to policy debate
Source: Adapted from OECD (2011), “Draft Policy Guidance on Capacity Development for Environment”.
Construct policy packages
A range of policy options are available for addressing green growth constraints. These are
summarised in Table 2. Policy should take advantage of any overlapping objectives and ancillary
benefits to capture potential synergies (Karousakis, 2009). In addition to the choice of policy instruments
and objectives (e.g. whether a tax or a technology standard or infrastructure improvement over boosting
R&D), it is also important to consider issues related to how policy is implemented. Across the range of
issues to be considered, policy initiatives should, in general, be designed on the basis of the following
criteria: cost-effectiveness, adoption and compliance incentives, and ability to cope with uncertainty and
provide a clear and credible signal to investors (de Serres, Murtin and Nicoletti, 2010).

TOOLS FOR DELIVERING GREEN GROWTH
© OECD 2011 9
Table 2. Possible policies to address green growth constraints
Green growth constraints Policy options
Inadequate infrastructure Taxes
Tariffs
Transfers
Public-private partnerships
Low human and social capital and poor institutional quality Taxes
Subsidy reform/removal
Incomplete property rights, subsidies Review and reform or remove
Regulatory uncertainty Set targets
Create independent governance systems
Information externalities and split incentives Labelling
Voluntary approaches
Subsidies
Technology and performance standards
Environmental externalities Taxes
Tradable permits
Subsidies
Low returns on R&D R&D subsidies and tax incentives
Focus on general-purpose technologies
Network effects Strengthen competition in network industries
Subsidies or loan guarantees for new network projects
Barriers to competition Reform regulation
Reduce government monopoly
Policies will need to be complemented by a strengthening of institutions and integrated into national
development strategies. Some of the key dimensions include: operational independence of regulatory
agencies; integration of policy objectives into legislative arrangements to reduce regulatory uncertainty;
stable funding to environmental agencies; and multilevel governance.
In general, policy options will vary according to institutional capacity and needs associated with
different levels of development. Table 3 shows how constraints to green growth can manifest themselves
across countries and how this can imply different policy responses.
Strategies need to account for how these constraints and respective policies cut across different
sectors and government agencies. Key issues to consider in this regard include (OECD, 2008):
Are key domestic economic and sectoral policies (especially in the transport, energy,
agriculture, trade, investment, and development assistance domains) subjected to a systematic
review of their potential environmental consequences (both harmful and beneficial)?
Are proposed international trade (including export credits) arrangements screened for their
environmental impacts; where these impacts are expected to be significant, is a more detailed
environmental impact assessment then carried out?
Are opportunities for improved co-ordination between environmental, sectoral and economic
policies periodically explored, at both the national and sub-national levels?

TOOLS FOR DELIVERING GREEN GROWTH
10 © OECD 2011
The formulation of policy should follow a well-defined and iterative process:
Objectives should be informed by an assessment of business-as-usual (BAU) projections with
respect to economic and environmental trends (taking into account population and economic
growth). This will help to identify the key current and projected challenges.
An assessment of BAU should form the basis for developing a long-term vision and
accompanying interim objectives, with high-level buy-in and dialogue with major stakeholders
within and outside government.
The establishment of a long-term vision should be informed by cost-benefit analysis.
Given a set of objectives, the policy process should proceed to identify least-cost policy options
and areas for intervention - to identify policy priorities and sequencing.
Implementation of policies should incorporate regular monitoring and review the effects of
policy to assess progress towards the objectives over time. Policy should be robust but flexible,
to allow for any adjustments as new information becomes available.
Table 3. Examples of policy challenges by development status
Countries Challenges Policy options
Developed countries High greenhouse gas emission per capita
Lock-in into carbon intensive infrastructure
R&D into technological innovation
Investment into low-carbon infrastructures
Pricing externality through market-based instruments
Developing countries Industrialisation and increased energy and material consumption
Low energy efficiency
Weak legal enforcement
Shifting away from carbon-intensive infrastructure and promoting energy and material-efficient technologies
Strengthening government capacity
Technology development, diffusion and transfer
Least developed countries High dependence on natural resources (both renewable and non-renewable)
Climate vulnerability
Lack of basic infrastructure (e.g. transport, energy and water)
Insufficient financial and technical capacity in government
Avoiding open-access regime of natural resources
Increasing productivity of net resource use
Climate risk assessment of national policy, plans and programmes
Investment in infrastructure to support access to markets
Use prices where possible...
A central feature of green growth is integrating the natural asset base into everyday market
decisions. This suggests extensive use of market-based and pricing instruments. Table 4 summarises the
strengths and weaknesses of price-based instruments (based on the aforementioned criteria) and
conditions for favourable use.
Prices also offer the potential for integrating environmental considerations into fiscal reform: an
important aspect of aligning economic and environmental policy objectives. Environmentally-motivated
fiscal reform can be conducted within the envelope of existing budget constraints. It can increase the
overall efficiency of spending programmes, especially if it focuses attention on the negative impacts of

TOOLS FOR DELIVERING GREEN GROWTH
© OECD 2011 11
some subsidy programmes. It can also be an efficient new source of revenue where this is needed for
funding critical growth and welfare-enhancing expenditure programmes, such as health and education.
Table 4. Taxes and trading schemes: strengths and weaknesses
Strengths Weaknesses Conditions for favourable use
Cap-and-trade permit systems
Tend toward equalisation of pollution abatement costs, can raise revenues, continuous incentives to innovate to reduce abatement costs
Once in place will be defended by stakeholders and provide natural mechanism for financial transfers in international context
Certainty over pollution emission levels
Steep learning curve, strong learning-by-using effects, potentially high start-up administrative and transaction costs
Adoption incentives lowered by costs to producers / consumers
Concerns of competitiveness and income distribution
Potential price volatility and frequent adjustments to cap
Public-good market failure is not dominated by monitoring and information costs. Cross-border spill-over effects are important.
Sufficient institutional capacity (experience) and potential size of market sufficiently large to function properly.
Environmental damage depends on overall amount of a pollutant, not specific location or timing of emission sources. Precise control over emissions is available at reasonable cost.
Taxes or charges on pollution or exploitation of natural resource
Tends to equalise pollution abatement costs, can raise revenues, continuous incentives to innovate to reduce abatement costs
Implementation can be done through existing national institutions
Potentially high monitoring costs, uncertainty about level of pollution emissions
Adoption incentives lowered by costs to producers / consumers which are more visible than with permits
Concerns of competitiveness and income distribution
Lower predictability of future policy adjustments
Public-good market failure is not dominated by monitoring and information costs. Cross border spill-over effects are important.
Insufficient capacity or scope for a cap and trade system. Baselines can be set and verified at reasonable cost.
Taxes or charges on a proxy for pollution
Lower monitoring and administrative costs (relative to permits or direct taxes)
Implementation can be done through adjustment to existing taxes
Loss of static and dynamic efficiency relative to charges at source, which can be large in the case of distant proxy
Public-good market failure is not dominated by monitoring and information costs
Pollution sources are small and diffuse. Temporary deviations in emission levels from target have little consequences for environmental damage
Environmental damage depends on overall amount of a pollutant, not on specific location or timing of emission sources. Precise control over emissions is available at reasonable cost.
Source: De Serres et al. (2010).
That said, price-based instruments may not always be appropriate. Considering some of the key
dimensions along which price-based instruments operate can provide guidance for assessing the
appropriateness of price-based policy instruments (de Serres et al., 2010):
To what extent can the source and quantity of a pollution emission or the exploitation of a
natural resource be measured and monitored? Is the technology and procedure required to do so
available and can they be implemented at reasonable cost?
To what extent can price-based instruments be enforced effectively? Can sanctions be
envisaged in case of non-compliance?

TOOLS FOR DELIVERING GREEN GROWTH
12 © OECD 2011
What could be the main institutional or structural limitations to the implementation and smooth
functioning of pricing instruments, be they taxes or permit systems?
Existing taxes and permit systems should also be assessed:
Are there opportunities to scale back exemptions and other special provisions in existing
environmentally-related taxes?
Where a tax on a proxy is used, is it possible to tax the source of pollution more directly at
affordable cost?
Where taxes with differentiated rates are used, can the favourable rates still be justified in light
of the environmental objective? Could the objective be achieved more efficiently through a
combination of taxes and fees that would avoid tax rate differentiation?
Has the problem of market power and entry barriers been considered in the design of the cap
and trade system and is the option of broadening the sectoral coverage being reviewed? Has the
option of auctioning the permits been considered?
Where a baseline-and-credit trading system is being used, is the baseline sufficiently stringent
and transparent? Is there scope for transforming the system into a cap-and-trade scheme?
...in combination with other complementary policy instruments
Non-market instruments may also be useful where there are intractable political obstacles to
price-based measures. They can, however, reduce the cost-effectiveness of policy and thus may not
always be suitable substitutes for price-based measures irrespective of the intractability of political
obstacles (Table 5). As for price-based instruments it will be useful to check non-market instruments
against a range of criteria to assess whether they are appropriate to address a particular environmental
issue or constraint to green growth (de Serres et al., 2010):
Where price-based approaches are deemed ineffective or inapplicable at reasonable cost, can
policy objectives be set in terms of performance standards with respect to environmental
outcomes rather than in terms of specific technologies to be used?
Where performance standards are used or envisaged, to what extent do they encourage polluters
to search for and adopt low-cost abatement options through built-in adjustment mechanisms
such as standards set on best performers?
Where technology standards are used or envisaged, are monitoring and enforcement costs
substantially lower than possible alternatives based on performance? Do polluters have
sufficiently similar abatement costs? If this is not the case, can technology standards be tailored
to target differing abatement costs?
Are learning-by-doing and market size effects strong enough to require direct public support to
green technology development in addition to pricing measures for overcoming path
dependency?
How does the implicit cost of pollution abatement through technology support policies compare
with the market price of pollution where markets for pollutants are operative?
TOOLS FOR DELIVERING GREEN GROWTH
© OECD 2011 13
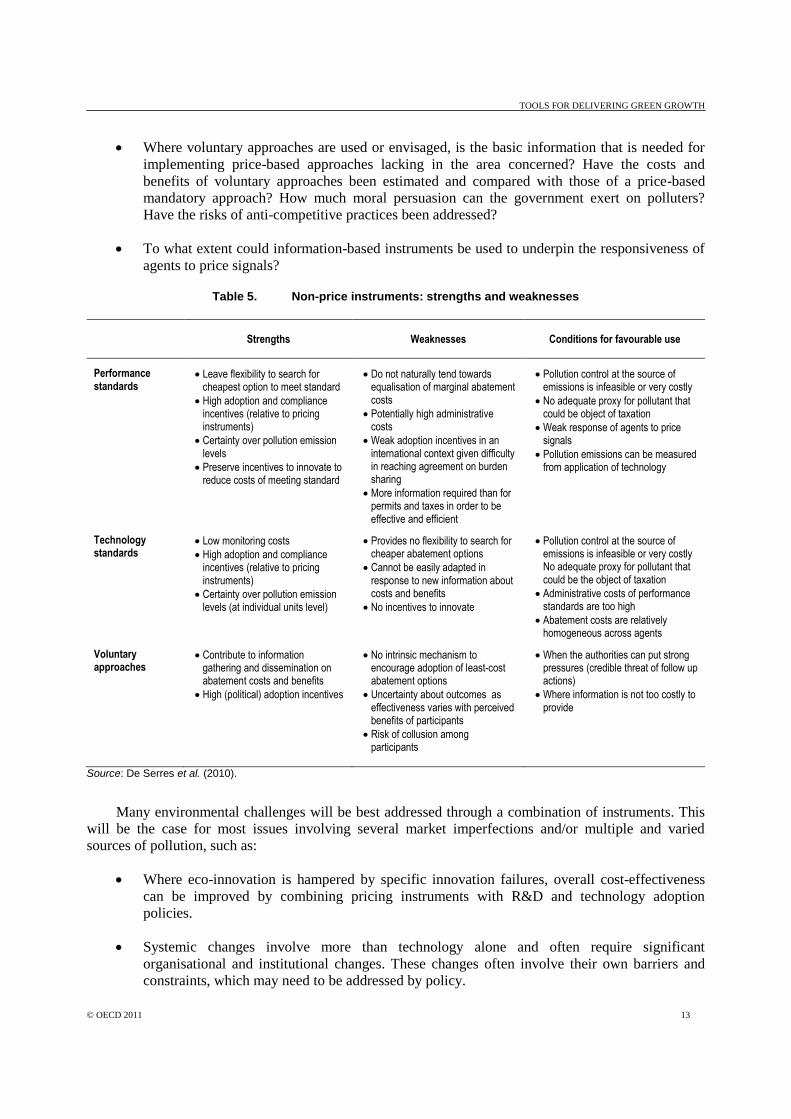
Where voluntary approaches are used or envisaged, is the basic information that is needed for
implementing price-based approaches lacking in the area concerned? Have the costs and
benefits of voluntary approaches been estimated and compared with those of a price-based
mandatory approach? How much moral persuasion can the government exert on polluters?
Have the risks of anti-competitive practices been addressed?
To what extent could information-based instruments be used to underpin the responsiveness of
agents to price signals?
Table 5. Non-price instruments: strengths and weaknesses
Strengths Weaknesses Conditions for favourable use
Performance standards
Leave flexibility to search for cheapest option to meet standard
High adoption and compliance incentives (relative to pricing instruments)
Certainty over pollution emission levels
Preserve incentives to innovate to reduce costs of meeting standard
Do not naturally tend towards equalisation of marginal abatement costs
Potentially high administrative costs
Weak adoption incentives in an international context given difficulty in reaching agreement on burden sharing
More information required than for permits and taxes in order to be effective and efficient
Pollution control at the source of emissions is infeasible or very costly
No adequate proxy for pollutant that could be object of taxation
Weak response of agents to price signals
Pollution emissions can be measured from application of technology
Technology standards
Low monitoring costs
High adoption and compliance incentives (relative to pricing instruments)
Certainty over pollution emission levels (at individual units level)
Provides no flexibility to search for cheaper abatement options
Cannot be easily adapted in response to new information about costs and benefits
No incentives to innovate
Pollution control at the source of emissions is infeasible or very costly No adequate proxy for pollutant that could be the object of taxation
Administrative costs of performance standards are too high
Abatement costs are relatively homogeneous across agents
Voluntary approaches
Contribute to information gathering and dissemination on abatement costs and benefits
High (political) adoption incentives
No intrinsic mechanism to encourage adoption of least-cost abatement options
Uncertainty about outcomes as effectiveness varies with perceived benefits of participants
Risk of collusion among participants
When the authorities can put strong pressures (credible threat of follow up actions)
Where information is not too costly to provide
Source: De Serres et al. (2010).
Many environmental challenges will be best addressed through a combination of instruments. This
will be the case for most issues involving several market imperfections and/or multiple and varied
sources of pollution, such as:
Where eco-innovation is hampered by specific innovation failures, overall cost-effectiveness
can be improved by combining pricing instruments with R&D and technology adoption
policies.
Systemic changes involve more than technology alone and often require significant
organisational and institutional changes. These changes often involve their own barriers and
constraints, which may need to be addressed by policy.

TOOLS FOR DELIVERING GREEN GROWTH
14 © OECD 2011
Where the degree of damage caused to the environment depends on the specific location or
timing of emissions, pricing instruments may need to be complemented with
command-and-control regulation such as local standards on emissions or local bans on certain
products.
Information-based instruments can be useful and effective in strengthening the responsiveness
of agents to price signals.
A combination of taxes, tradeable permits and/or performance standards may be optimal in the
cases of multiple and varied sources of pollution. However, instruments should be set so as to
minimise the differences in the implicit or explicit pollution prices across sectors.
... while avoiding overlaps
Similarly policy mixes need to avoid counter-productive overlaps of instruments. As a general rule,
policies overlap when the same people (i.e. individuals, firms, public administrations) are covered by at
least two instruments that essentially address the same environmental issue. For instance, if a firm is
covered (directly or indirectly) by both a cap-and-trade system and a tax for carbon emissions, one of the
two instruments will be redundant (Duval, 2008). Likewise, emission performance or energy efficiency
standards for the car industry may not be justified in the presence of a carbon pricing covering the
transport sector, unless they also constitute the best option to address other externalities.
Combining fixed-price policies (taxes or subsidies) is relatively transparent: if an emissions tax is in
place, the incremental incentive effect of an additional tax is similar to the incremental effect of that
policy on its own (other than perhaps some diminishing returns). But since tradable credit systems allow
overall market conditions to set the credit price – which determines the incentive effect of the policy –
any other policy that changes those market conditions will also change the credit price. As a result, the
net incentive effect of the overlapping policy can be quite different than if it were implemented alone
(Fischer and Preonas, 2010).
For example, Böhringer and Rosendahl (2010) consider the interaction between the European
Union’s Emission Trading Scheme (EU ETS) and a renewable portfolio standard (RPS). They find that a
binding RPS, by encouraging more renewable energy than the ETS alone, makes it easier to comply with
the emissions cap, reducing the permit price. This price reduction confers a greater advantage on
relatively dirty producers (e.g. coal-fired generators), while the burden of buying green credits falls on
dirty producers equally. The net effect is that the dirtiest producers actually increase their output (and
emissions), while the relatively clean non-renewable sources are displaced.
New subsidy programmes should be approached with caution...
Green growth strategies will inevitably elicit calls on government to provide funds to green sectors
or to subsidise environmental activities. In markets for consumer products such as cars, houses and
electric goods, many governments are implementing pricing schemes to support the green market. A
green growth framework demands careful scrutiny of such schemes. Table 6 summarises the strengths
and weaknesses of potential expenditure instruments and conditions for favourable use.

TOOLS FOR DELIVERING GREEN GROWTH
© OECD 2011 15
Table 6. Potential expenditure instruments
Strengths Weaknesses Conditions favourable to use
Subsidies High adoption and compliance incentives (relative to permits or taxes)
Potentially large budgetary costs
May trap excessive resources in subsidised “clean” activity
Uncertainty about impact on negative externality
No incentives to search for cheaper abatement options
Enforcement of alternative pricing instruments is difficult or very costly Activity to be subsidised is a strong substitute for targeted “dirty” activity
Subsidy programme can be designed in a relatively simple way, for a time-limited period and with minimal secondary effects
Active technology support policies
High adoption and compliance incentives
High incentives to invest in research and development of new technologies
Do not directly address negative environmental externality
Can lead to low-cost available abatement options being overlooked
Potentially large budgetary costs and deadweight losses
Uncertainty about the level of pollution emission
Technology areas where market size and learning-by-doing effects are dominant
Infrastructures in areas where network considerations are important
Source: De Serres et al. (2010).
Despite their budgetary cost, subsidies to encourage a switch to greener activities are more
commonly used than price instruments. Examples can be found in the case of industrial pollution control
and agricultural activities, notably to support the use of bio-fuels. Such schemes need to be very carefully
evaluated, however, as they are often costly and the way that such policies are designed can lead to wide
variations in cost-effectiveness.
Policy makers should consider the following issues for determining the appropriateness of
committing public funds to the promotion of green growth (OECD, 2008; de Serres et al., 2010):
Is public support provided only in cases where public goods are expected to be generated
(e.g. where significant environmental improvements would not otherwise not be provided by
producers)?
Are public support measures likely to be the most efficient and effective ways of reaching a
given environmental target?
Has the feasibility and cost of pricing the externality been directly assessed? How strong is the
substitutability between the subsidised activity and the dirty activities it is supposed to replace?
Do clear and transparent eligibility criteria exist concerning who is entitled to receive support,
and under what circumstances; has an appropriate “reference level” been established to guide
the allocation of support?
Are existing public environmental expenditure programmes consistent with the Polluter Pays
Principle and with international rules regarding state aid?
Do existing public environmental expenditure programmes have the secondary effect of
encouraging additional demand for, or supply of, polluting products or activities over the long
term?

TOOLS FOR DELIVERING GREEN GROWTH
16 © OECD 2011
Is public support allocated first to private agents that commit to achieving the largest
environmental improvement per unit of support?
... and existing programmes carefully reviewed and reformed
Before new funds are committed to green growth, governments should identify those subsidies
whose removal (or reform) would boost long-term economic growth or reduce environmental damage.
Thus, a review of subsidies should include scrutiny of support related to both economic and
environmental policy objectives. For example, high levels of production-linked price support have
traditionally been provided to the agriculture sector. This has encouraged overuse of chemical inputs, as
well as expansion of farming onto land that is of relatively low value economically – but often of high
value environmentally. In turn, this has led to efforts to address these negative environmental impacts via
programmes that are conditional on meeting certain environmental standards (cross-compliance). It will
generally prove to be more efficient and effective to reform the original subsidy than to retain (and try to
correct) the environmental problems it creates through cross-compliance requirements (OECD, 2008).
Issues to consider when engaging in subsidy reform include:
Is it clear that environmental cross-compliance programmes are leading to real environmental
improvements, and in the most efficient manner possible?
Are the beneficiaries of environmentally damaging economic subsidies, and the circumstances
under which these subsidies are provided, both transparent to the general public?
Have transitional (and time-limited) compensation measures been developed, to support the
process of reforming environmentally damaging economic subsidies?
The coherence of subsidies with other government objectives or programmes also needs to be taken
into account e.g. do existing subsidies have undue negative impacts on developing countries?
Particular attention needs to be paid to innovation and overcoming inertia…
A strong capability to innovate is an essential prerequisite for green growth with due attention given
to non-technological innovation and demand-driven innovation. Strategies should address the
specificities of innovation in the environmental area (Table 7). The use of packages of policies will be
especially important in this context because of the range of market and policy failures and imperfections
which come into play.
An essential set of criteria against which innovation policies aimed at improving environmental
performance should be measured includes (Johnstone, Haščič and Kalamova, 2010):
Stringency – how ambitious is the policy target?
Predictability –what effect does the policy have on investor uncertainty?
Flexibility – whether potential innovators are free to identify the best way to meet the
objective?
Incidence – does the policy target the environmental objective as closely as possible? and

TOOLS FOR DELIVERING GREEN GROWTH
© OECD 2011 17
Depth – that is, do incentives exist to innovate through a range of potentially ascending
objectives?
Table 7. Possible policies to foster green innovation
Policy challenge Policy options
Insufficient demand for green innovation Taxes and market-based instruments to price externalities and enhance incentives
Demand-side policies, such as public procurement, standards and regulations, in specific markets and circumstances
Lack of innovation capability Broad-based policies to strengthen innovation
Technological roadblocks and lack of radical innovation
Investment in relevant R&D, including thematic and mission-oriented research
International cooperation
Research and investment bias to incumbent technology
R&D support, tax incentives
Adoption incentives/subsidies
Technology prizes
Lack of finance Co-investment funds
Market development
Regulatory barriers to new firms Regulatory reform
Competition policy
Front-runner approaches
Lack of capabilities in SME to adopt green innovation
Access to finance
Skills development
Linking SMEs to knowledge networks
Improving information supply
Reducing regulatory burdens
Non-technological innovation City and transport planning
Regulatory reform
International technology transfer Development of capabilities
Trade and investment policies
IPR protection and enforcement
Voluntary patent pools and collaborative mechanisms
Note: A detailed toolbox to foster innovation, including green innovation, is currently being developed as a follow-up to the OECD Innovation Strategy. This Innovation Policy Platform will be released in 2012.
The ideal policy instrument will be one which is sufficiently stringent to encourage an optimal level
of innovation; stable enough to give investors adequate planning horizons for risky investments; flexible
enough to encourage novel solutions; and closely targeted on the policy goal, so as to avoid misallocation
of effort and provide incentives for continuous change.
…including ways for enabling change in consumer behaviour
Addressing barriers to behavioural change will facilitate the emergence of new patterns of demand
and increase the cost-effectiveness of policy signals aimed at producers. Special attention needs to be
given to these barriers because habits and norms can lock households into patterns of consumption which
are hard to alter. A range of policy tools should be considered in this regard. Table 8 summarises the key
issues to be addressed and policy levers that could be used to encourage the greening of consumption
behaviour.

TOOLS FOR DELIVERING GREEN GROWTH
18 © OECD 2011
Table 8. Key dimensions for greening household behaviour
Information Awareness
Can shift behaviour because o Consumers often do not know how much they consume o Labels influence consumer choice
Information needs to: o Reflect public and private benefits o Be trustworthy and easy to decipher
Of environmental issues is linked to greener consumption
It rises with educational attainment
It can be influenced by appropriately tailored education for sustainable consumption
And increases acceptability of policy reform
Alternatives Incentives
Availability of alternatives is as important as incentives, especially in public services and infrastructure
Natural monopoly can reduce consumer access to these services, so regulatory oversight is key
Such as prices, increase efficiency of consumption short-term
Drive demand for “green” consumer durables and household equipment, helping to green consumption long-term
Leveraging public and private finance for green growth
Boosting growth and development prospects while greening the growth trajectory at the same time
will require both increased investment flows into infrastructure, particularly in developing countries, and
also a shift in the composition of investment flows. To shift the composition of investment, governments
will need to assess and resolve barriers preventing or discouraging institutional investors, especially
pension funds, from investing in infrastructure which will enable greener growth2 (Table 9).

TOOLS FOR DELIVERING GREEN GROWTH
© OECD 2011 19
Table 9. Boosting investment in infrastructure: barriers and solutions
Barriers Solutions
Lack of experience and knowledge (i.e. with infrastructure, private equity and other investment vehicles or direct investments)
Encourage improved knowledge and understanding of pension fund stakeholder and supervisors on infrastructure assets
Encourage development of appropriate investment vehicles
Support consolidation and pooling of pension funds
Shortage of data (e.g. on performance, costs, risks, and relationships)
Support stronger efforts in independent data collection and objective information provision in the field of infrastructure investment
Recommend upgrade of national and supra-national statistics data collection with a view to better capture infrastructure (and other alternative asset classes)
Fees Promote higher transparency standards in private equity vehicles and direct investments
Instability (e.g. regulatory instability, political risks, and risk associated with emerging markets such as currency risk)
Enhance the investment environment
Ensure stable regulatory environment
Create a platform for dialogue between investors, financial industry and governments (e.g. the OECD)
Development national, long-term policy frameworks for key individual infrastructure sectors, improving the integration of the different levels of government in the design, planning and delivery of infrastructures through the creation of infrastructure agency/bank, and the creation of a National Infrastructure Pipeline
Encourage the study of more advanced risk analysis beyond the traditional measures, including the specific risks of infrastructure
Regulatory constraints (including accounting and investment regulations e.g. restrictions on asset classes/ liquidity/ non-listed/ diversification requirements/ leverage rules/ valuation rules)
Check funding and investment regulation is not inadvertently preventing infrastructure investments
Recommend the establishment of international guidelines for performance and risk management of infrastructure (and other alternative) vehicles
Facilitate adjustment and address transitional concerns
Jobs strategies should be tailored to address a transition to green growth
Labour market and skill policies can play an important role in facilitating the structural adjustments
associated with Green Growth, while at the same time minimising the associated social costs. Like any
major economic transformation, the transition to Green Growth will have significant employment effects.
New jobs will be created, some jobs will be at risk and many others would have to be reallocated from
grey to green sectors.
A prerequisite for a smooth and fair transition to green growth is a well functioning labour market.
The OECD Reassessed Jobs Strategy (OECD, 2006) provides a comprehensive framework for achieving
that. It shows that a carefully designed package of labour market and skill policies can assure that the
labour market is both dynamic - continuously redeploying labour from declining to growing industries
and firms - and inclusive.
Within the general framework of the Reassessed Jobs Strategy, a number of labour market and
training policies tailored to the transition to green growth will also be required, although their details are
difficult to foresee in many cases (Table 10). In particular, the greening of the economy will have an
TOOLS FOR DELIVERING GREEN GROWTH
20 © OECD 2011
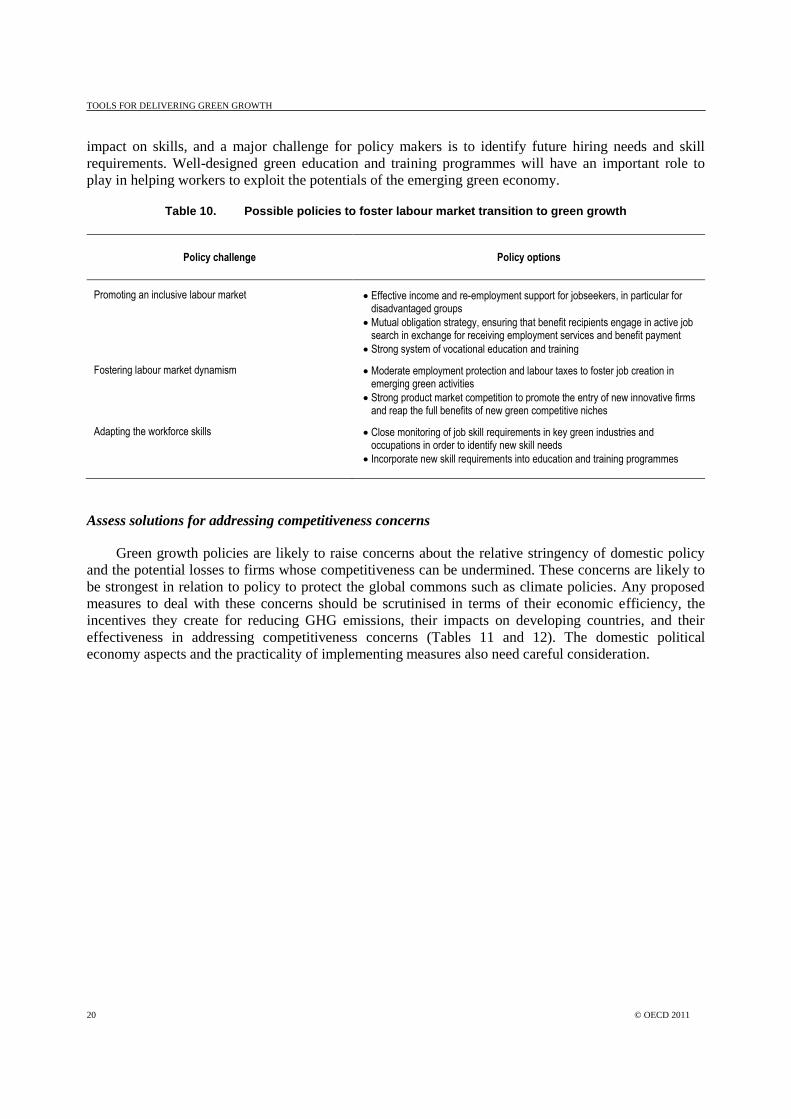
impact on skills, and a major challenge for policy makers is to identify future hiring needs and skill
requirements. Well-designed green education and training programmes will have an important role to
play in helping workers to exploit the potentials of the emerging green economy.
Table 10. Possible policies to foster labour market transition to green growth
Policy challenge Policy options
Promoting an inclusive labour market Effective income and re-employment support for jobseekers, in particular for disadvantaged groups
Mutual obligation strategy, ensuring that benefit recipients engage in active job search in exchange for receiving employment services and benefit payment
Strong system of vocational education and training
Fostering labour market dynamism Moderate employment protection and labour taxes to foster job creation in emerging green activities
Strong product market competition to promote the entry of new innovative firms and reap the full benefits of new green competitive niches
Adapting the workforce skills Close monitoring of job skill requirements in key green industries and occupations in order to identify new skill needs
Incorporate new skill requirements into education and training programmes
Assess solutions for addressing competitiveness concerns
Green growth policies are likely to raise concerns about the relative stringency of domestic policy
and the potential losses to firms whose competitiveness can be undermined. These concerns are likely to
be strongest in relation to policy to protect the global commons such as climate policies. Any proposed
measures to deal with these concerns should be scrutinised in terms of their economic efficiency, the
incentives they create for reducing GHG emissions, their impacts on developing countries, and their
effectiveness in addressing competitiveness concerns (Tables 11 and 12). The domestic political
economy aspects and the practicality of implementing measures also need careful consideration.

TOOLS FOR DELIVERING GREEN GROWTH
© OECD 2011 21
Table 11. Reducing adverse impacts on international competitiveness
Principles for policy design
Principle Description Indicators for Evaluation
(quantitative and qualitative)
Effectiveness in addressing international competitiveness impacts
Policy makers should evaluate whether measures to address competitiveness impacts achieve their objectives, such as retaining market share of polluting industries relative to foreign competitors, reducing job losses, or eliminating competitiveness-related emission leakage.
Sectoral output and employment
Sectoral profits and market share
International trade and investment flows
Emissions and leakage rates
Economic efficiency Policy makers should minimise costs to the economy from the imposition of measures to address international competitiveness impacts. For example, the overall costs of achieving a given climate policy target will be increased for a country if the measures taken to address competitiveness impacts result in lowering the emissions reduction requirements for energy-intensive industries, as this would imply some low-cost reduction options are not exploited.
Domestic welfare or GDP changes
Changes in the pricing of pollution
Cost per tonne of leakage reduced
Foregone government revenues
Incentives for minimising environmental impacts and promoting innovation
Given the stringency of proposed environmental policy targets over time, measures should maintain significant incentives for abatement and innovation. Exempting sectors from such policy would reduce their incentives for pollution reduction.
Incentives for pollution reduction (such as a price signal)
Innovation impacts (e.g. patents and changes in abatement costs)
International political economy
Effects on other countries from measures to reduce competitiveness impacts should be considered.
International GDP or welfare changes (with particular regard to impacts on the poor)
Domestic political considerations
Tradeoffs among stakeholders should be considered, as well as impacts on government revenues and transfers.
Impacts on affected stakeholder groups (e.g. employment, output)
Foregone government revenues
Implementability The administrative costs and implementation burden should be evaluated by policy makers for each measure.
Estimates of implementation burden
The ability to obtain data needed to implement policy measures
Source: OECD (2010), „‟Addressing International Competitiveness in a World of Non-Uniform Carbon Pricing: Lessons from a Decade of OECD Analysis‟‟, Policy Brief.

TOOLS FOR DELIVERING GREEN GROWTH
22 © OECD 2011
Table 12. Addressing competitiveness impacts on energy-intensive industries
Evaluation of measures
Principle
Full auction/tax (“Reference Case”)
Measures to address competitiveness impacts from climate policy: Change from Reference Case: “no change”, “+” indicating improvement of criterion from reference case, “-“ indicating reduction, and “+/-“ indicating uncertain effect)
Free Allocation Border Taxes Other Grandfathered
free allocation Output-based revenue recycling or allocation
Import Only With Export Rebate
Industry exemption
Effectiveness in addressing competitiveness impacts
Likely to impact some energy-intensive sectors
+/- Profits maintained, but market share impacts remain
+ Incentivises production
+/- Output further reduced; domestic market share may not change
+/- Preserves export market share but reduces output due to higher carbon price
+ Though indirect costs still remain
Economic efficiency
Maximises economic efficiency
+/- Efficiency of policy maintained, reduces fiscal revenues
- Production and emissions levels distorted and fiscal revenues reduced
- Barriers on imports increase costs
- Barriers on imports increase costs
- Some cost-effective abatement not implemented
Incentives for GHG mitigation and innovation
Full abatement incentives
No change - Abatement from production reductions eliminated
No change - Export exemption decreases abatement
- Very few incentives
International political economy
Mixed effect on developing country GDP and welfare
No change No change +/- Reduces developing country GDP/welfare further with uncertain effects on climate action
No change
Domestic political implications
Generally negative due to political power of energy-intensive industries
+ Reduces industry concerns over profits
+ Can allow for more ambitious policy
+/- Intermediate goods are more costly for all; some industries may perceive market share benefits from international competitors facing similar carbon costs
+ Fewer stakeholders
Implementability Similar for all participating sectors
No change - Requires common output metrics and competitive domestic market
- Analyses of embedded carbon can be costly
+ Fewer participating sectors
Source: OECD (2010), “Addressing International Competitiveness in a World of Non-Uniform Carbon Pricing: Lessons from a Decade of OECD Analysis‟‟, Policy Brief.
To ensure a more effective imposition of environmentally related taxes, without reducing a
country’s competitiveness, there are several options (OECD, 2001):
Integrate environmentally-motivated reforms better with broader fiscal reforms.
Announce the introduction of new taxes and tax rate increases well in advance, and phase out
existing rebates and exemptions gradually, thus enabling a smooth adaptation of economic
agents over a period of time.

TOOLS FOR DELIVERING GREEN GROWTH
© OECD 2011 23
In instances where exemptions and rebates are currently given for competitiveness reasons:
Impose full tax rates on industry, but channel part of the revenues back to industry in such a
way that marginal abatement incentives are maintained; for example by providing subsidies to
industrial polluters for R&D or investments aimed to reduce pollution levels.
The negative environmental effect of exemptions and rate reductions can also be limited by
ensuring that firms that currently benefit from exemptions and reduced tax rates sign up to
stringent mitigation measures.
A two-tier rate structure, with lower rates for more internationally exposed sectors, would be a
better option than full exemptions for some sectors; for example, an energy tax could have
higher rates for the health care sector and domestic building industry, and lower rates for the
petrochemical industry.
Assess and implement policies for addressing income distribution concerns
Possible strategies to compensate low-income groups include:
Lump sum compensation, calculated on the basis of average green tax payments per household,
in the form of cash transfers or credits against income tax. Cuts in income taxation may not
benefit groups of low-income households because they pay little or no income taxes (Smith,
1998). To assist the households concerned, countries can use tax credits. Tax credits are
amounts deductible from tax payable (as distinct from deductions from the tax base). Two
types of tax credits are distinguished, those (referred to as wastable tax credits) which are
limited to the amount of the tax liability and therefore cannot give rise to a payment by the
government to the taxpayer, and those (referred to as non-wastable tax credits) which are not so
limited, so that the excess of the credit over the tax liability can be paid to the taxpayer. To
compensate poorer households for the impact of environmentally related taxes, non-wastable
tax credits are the preferred option because the revenue service pays out the excess of the credit
over income tax due to qualifying households.
Income-tested compensation, with two further options. One way to calculate the amount in
compensation would measure the green tax due by average energy users or polluters against
household income. A second, more complicated mechanism would calculate the compensation
by comparing actual green tax payments of households to household income. The rationale for
this variant might be that poor households have sometimes limited options to reduce their
energy use, such as in the case of block heating. However, if it were decided that households
need not pay more than say two percent of their income in a given green tax, the price signal
would be ineffective once a household had exceeded this threshold.
Reduction of other taxes, sometimes referred to as “tax shifting”. In this situation, the
regressive impact of an environmentally-related tax is (partially) offset by a reduction in the
marginal rates of other taxes, specifically taxes on labour.

TOOLS FOR DELIVERING GREEN GROWTH
24 © OECD 2011
Notes
1 The nature of this disadvantage will vary according to existing regulatory environments. In some cases,
the regulatory environment will be such that incumbent firms enjoy an advantage over new entrants. In
other cases the lack of a supporting network may prevent deployment of innovative technologies.
2 See Inderst (2009), OECD (2011b) and OECD (2007).
References
Böhringer, C. and K.E. Rosendahl (2010), “Green Promotes the Dirtiest: On the Interaction between Black
and Green Quotas in Energy Markets”, Journal of Regulatory Economics, Vol. 37, No. 3, Springer,
Heidelberg, pp. 316-325.
Clapp, C., G. Briner and K. Karousakis (2010), “Low Emission Development Strategies: Technical,
Institutional and Policy Lessons”, OECD/IEA, Paris.
De Serres, A, F. Murtin and G. Nicoletti (2010), "A Framework for Assessing Green Growth Policies", OECD
Economics Department Working Papers, No. 774, OECD, Paris.
Duval, R. (2008), “A Taxonomy of Instruments to Reduce Greenhouse Gas Emissions and their Interactions”,
OECD Economics Department Working Papers, No. 636, OECD, Paris.
Fischer, C. and L. Preonas (2010), “Combining Policies for Renewable Energy: Is the Whole less than the
Sum of its Parts?”, Discussion Paper 10-19, Resources for the Future, Washington DC.
Hausmann, R., A. Velasco and D. Rodrik (2008), “Growth Diagnostics” in J. Stiglitz and N. Serra, eds., The
Washington Consensus Reconsidered: Towards a New Global Governance, Oxford University Press,
New York.
Inderst, G. (2009), “Pension Fund Investment in Infrastructure”, OECD Working Papers on Insurance and Private Pensions, No.32, OECD, Paris, available at www.oecd.org/dataoecd/41/9/42052208.pdf.
Johnstone, N., I. Haščič and M. Kalamova (2010), “Environmental Policy Design Characteristics and
Technological Innovation: Evidence from Patent Data”, OECD Environment Working Papers, No. 16,
OECD, Paris.
Karousakis, K. (2009), “Promoting Biodiversity Co-Benefits in REDD”, OECD Environment Working
Papers, No. 11, OECD, Paris.
OECD (2001), Environmentally Related Taxes in OECD Countries. Issues and Strategies, OECD, Paris.
OECD (2006), Boosting Jobs and Incomes: Policy Lessons from Reassessing the OECD Jobs Strategy,
OECD, Paris.
TOOLS FOR DELIVERING GREEN GROWTH
© OECD 2011 25
OECD (2007), “Principles for Private Sector Participation in Infrastructure”, OECD, Paris, available at
www.oecd.org/daf/investment/ppp.
OECD (2008), “OECD Framework for Effective and Efficient Environmental Policies”, OECD, Paris,
available at www.oecd.org/dataoecd/39/19/41644480.pdf.
OECD (2010), “Addressing International Competitiveness in a World of Non-Uniform Carbon Pricing:
Lessons from a Decade of OECD Analysis”, Policy Brief, OECD, Paris, available at
www.oecd.org/dataoecd/34/60/46533174.pdf.
OECD (2011a), “Draft Policy Guidance on Capacity Development for Environment” (forthcoming).
OECD (2011b), “Pension Fund Investment in Infrastructure: Policy Recommendations” (forthcoming).
OECD (2011c), Towards Green Growth, OECD, Paris.
OECD (2011d), Towards Green Growth - Monitoring Progress: OECD Indicators, OECD, Paris.
Smith, S. (1998), “Distributional Incidence of Environmental Taxes on Energy and Carbon: a Review of the
Policy Issues”, Paper presented at the Colloquy on Green Tax Reform and Economic Instruments for
International Co-operation: the Post-Kyoto Context, Toulouse, France, 13 May.

Tools for Delivering on Green Growth The OECD Green Growth Strategy aims to provide concrete recommendations and measurement tools to support countries‟ efforts to achieve economic growth and development, while at the same time ensure that natural assets continue to provide the resources and environmental services on which our well-being relies. The strategy proposes a flexible policy framework that can be tailored to different country circumstances and stages of development. This document accompanies the publications Towards Green Growth and Towards Green Growth: Monitoring Progress - OECD Indicators.
www.oecd.org/greengrowth