TomTom Smart Mobility Proposition - City of Moscow
10
TomTom Smart Mobility Proposition - City of Moscow Ralf- Peter Schäfer VP Traffic and Travel Information Moscow Urban Forum, June 30, 2016 1
Transcript of TomTom Smart Mobility Proposition - City of Moscow

TomTom Smart Mobility Proposition - City of Moscow Ralf-Peter Schäfer
VP Traffic and Travel Information
Moscow Urban Forum, June 30, 2016
1

Congestion is a big economic cost for society
2
Congestion up by 13% globally since 2008
SOURCE: FinancesOnline, 2014
Mexico City
Moscow City
TomTom Congestion Index Ranking
http://www.tomtom.com/trafficindex

Congestion in Moscow has been reduced
3
A reduction of 13% since its peak in 2012
Moscow wins international transport award for tackling
traffic gridlock
Moscow improved from rank #1 to #5 in TomTom´s Traffic Index

TomTom offers a wide range of toolset for city management
Monitor (Sense)
TomTom Traffic
TomTom Traffic Flow and Incidents
Real-Time Dashboard
Jam Tail
Warnings
Identify (Process)
Delay hotspots
Potential Accident
Blackspots
Critical
Routes
Parking hotspots
Analyze (Analyze)
Junction analysis
Custom Area Analysis
Custom Travel Times
Traffic
Demand
Influence (Plan)
Incident Moderation tool
Event Management
Strategic routes
Parking Routes
Inform (Influence)
Custom Traffic Monitoring
Indash / Smartphone /
PNDs
Media (Radio/TV/Web)
VMS
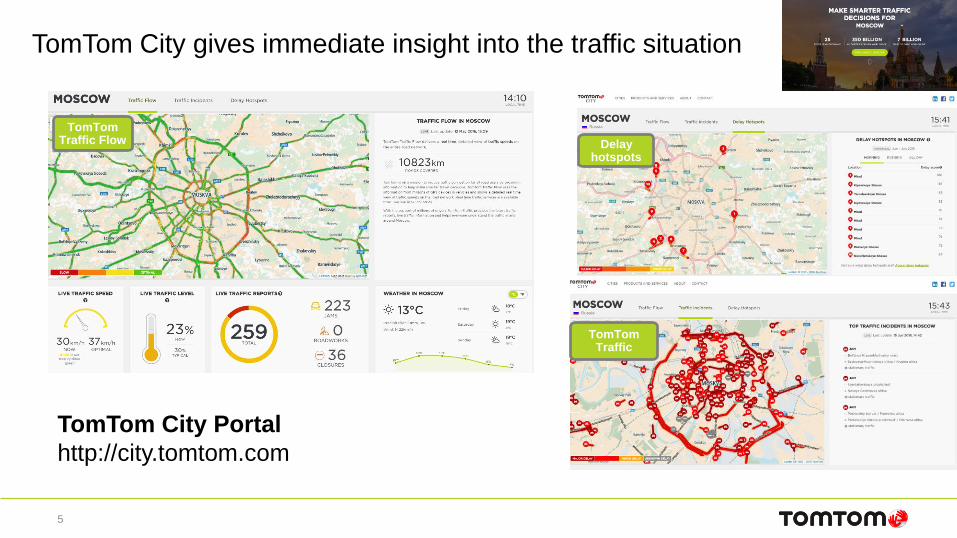
TomTom City gives immediate insight into the traffic situation
5
TomTom City Portal
http://city.tomtom.com
TomTom Traffic
TomTom Traffic Flow Delay
hotspots

Route Analytics Moscow Road Arterial (2014 vs 2016)
© 2016 TomTom. All rights reserved. 6
Route Date Range Time Set
Median Travel
Time [hh:mm:ss]
Average
Speed [kph]
Moscow Arterial Q1 2014 Night 00:27:49 62.47
Moscow Arterial Q1 2014 AM Rush 01:00:37 28.96
Moscow Arterial Q1 2014 Noon 00:38:14 39.74
Moscow Arterial Q1 2014 PM Rush 00:37:22 42.85
Q1 2014
Q1 2016
Route Date Range Time Set
Median Travel
Time [hh:mm:ss]
Average
Speed
[kph]
Moscow Arterial Q1 2016 Night 00:27:35 60.19
Moscow Arterial Q1 2016 AM Rush 00:36:31 38.69
Moscow Arterial Q1 2016 Noon 00:33:21 44.05
Moscow Arterial Q1 2016 PM Rush 00:31:13 49.11
Custom Travel Times

Selected link: links to links Selected link: zones to zones
A B
A 30 5
B 10 20
OD Matrix
Traffic Demand and Flow Analysis (Origin Destination)
Route choice
Traffic
Demand
8
Key Recommendations
9
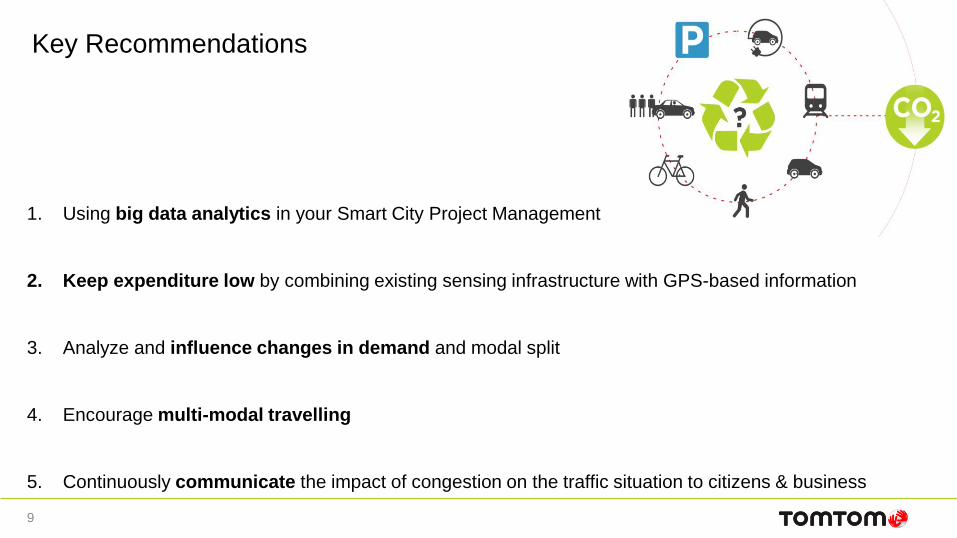
Key Recommendations
1. Using big data analytics in your Smart City Project Management
2. Keep expenditure low by combining existing sensing infrastructure with GPS-based information
3. Analyze and influence changes in demand and modal split
4. Encourage multi-modal travelling
5. Continuously communicate the impact of congestion on the traffic situation to citizens & business

10