TOMATO SUSPENSION AGREEMENT: AN ANALYSIS OF...
61
Tomato Suspension Agreement: An Analysis of U.S. Fresh Tomato Market Item Type text; Electronic Thesis Authors Felix Berrueto, Ana Georgina Publisher The University of Arizona. Rights Copyright © is held by the author. Digital access to this material is made possible by the University Libraries, University of Arizona. Further transmission, reproduction or presentation (such as public display or performance) of protected items is prohibited except with permission of the author. Download date 25/06/2018 15:18:12 Link to Item http://hdl.handle.net/10150/625886
Transcript of TOMATO SUSPENSION AGREEMENT: AN ANALYSIS OF...

Tomato Suspension Agreement: AnAnalysis of U.S. Fresh Tomato Market
Item Type text; Electronic Thesis
Authors Felix Berrueto, Ana Georgina
Publisher The University of Arizona.
Rights Copyright © is held by the author. Digital access to this materialis made possible by the University Libraries, University of Arizona.Further transmission, reproduction or presentation (such aspublic display or performance) of protected items is prohibitedexcept with permission of the author.
Download date 25/06/2018 15:18:12
Link to Item http://hdl.handle.net/10150/625886

1
TOMATO SUSPENSION AGREEMENT: AN ANALYSIS OF U.S. FRESH TOMATO
MARKET
by
Ana Georgina Felix Berrueto
____________________________
Copyright © Ana Georgina Felix Berrueto 2017
A Thesis Submitted to the Faculty of the
DEPARTMENT OF AGRICULTURAL & RESOURCE ECONOMICS
In Partial Fulfillment of the Requirements
For the Degree of
MASTER OF SCIENCE
In the Graduate College
THE UNIVERSITY OF ARIZONA
2017

2
STATEMENT BY AUTHOR
The thesis titled Tomato Suspension Agreement: An Analysis of U.S. Fresh Tomato
Market prepared by Ana Georgina Felix Berrueto has been submitted in partial fulfillment of
requirements for a master’s degree at the University of Arizona and is deposited in the
University Library to be made available to borrowers under rules of the Library.
Brief quotations from this thesis are allowable without special permission, provided that
an accurate acknowledgement of the source is made. Requests for permission for extended
quotation from or reproduction of this manuscript in whole or in part may be granted by the head
of the major department or the Dean of the Graduate College when in his or her judgment the
proposed use of the material is in the interests of scholarship. In all other instances, however,
permission must be obtained from the author.
SIGNED: Ana Georgina Felix Berrueto
APPROVAL BY THESIS DIRECTOR
This thesis has been approved on the date shown below:
June 8, 2017
Satheesh Aradhyula Date
Associate Professor

3
Table of Contents
List of Figures and Tables 5
Abstract 8
Chapter 1: Introduction 9
1.1 Introduction 9
1.2 Tomato Suspension Agreement (TSA) 10
1.3 Mexican Tomato Industry 12
1.4 Florida Tomato Industry 14
Chapter 2: Literature Review 17
2.1 Literature Review 17
Chapter 3: Data and Methods 20
3.1 Objective of the Study 20
3.2 Data 22
3.3 Descriptive Statistics 27
3.4 Empirical Models 36
3.4.1 Terminal Market Price Model 36
3.4.2 Shipping Point Price Model 37
3.4.3 Volume Model 38
Chapter 4: Results 40
4.1 Results for Price of Terminal Market Equations 40
4.2 Results for Shipping Point Price Equations 45
4.3 Results for Volume Equations of Fresh Tomatoes 50

4
Chapter 5: Conclusion 56
5.1 Conclusions 56
References 57

5
List of Figures and Tables
Figures
1.1.1 Seasonality in tomato shipments in the U.S. market by origin in 2015 (Source:
USDA-AMS) 9
1.2.1 Tomato (round and plum) volume shipped in the U.S Market (Source: USDA –
AMS) 12
1.3.1 Mexican States national participation on tomato production (Source: Mexican
Agriculture Department – SAGARPA) 13
1.3.2 Share of Mexican Tomatoes Exported to the United States by Port of Entry
(Source: USDA- AMS) 14
1.4.1 Tomato growing regions of Florida 15
1.4.2 Total Tomatoes from Florida in the U.S. Market, 1999 to 2015 (Source: USDA-
AMS) 16
3.1.1 Average volume of Floridian and Mexican Tomatoes by their type and origin,
1998-2015 (Source: USDA-AMS) 20
3.1.2 Yearly average of F.O.B. prices of tomatoes round and plum/Roma from
Florida and Mexico (Source: USDA-AMS) 21
3.2.1 Share of Fresh Tomato Types Shipped in the U.S. Market in 2015 – all origins
(Source: USDA-AMS) 23
3.2.2 Average Round Tomato Volume from Various Sources for 1998 to 2015
(Source: USDA AMS) 24
3.2.3 Average Plum Tomatoes Volume from Various Sources for 1998 to 2015
(Source: USDA-AMS) 25
3.2.4 Aggregated Average Weekly Prices of Fresh Tomatoes in Chicago Terminal
Market: By Source and Type of Tomato (Source: USDA-AMS) 25
3.2.5 Aggregated Average Weekly Prices of Fresh Tomatoes in Los Angeles
Terminal Market: By Source and Type of Tomato (Source: USDA-AMS) 26
3.2.6 Aggregated Average Weekly Prices of Fresh Tomatoes in New York Terminal
Market: By Source and Type of Tomato (Source: USDA-AMS) 26

6
4.2.1 Comparison of Prices of Mexican and Floridian Plum Tomatoes and TSA
Reference Price during winter months from 1998 to 2015 (Source: USDA-AMS
and Department of Commerce) 49
4.2.2 Comparison of Prices of Mexican and Floridian Round Tomatoes and TSA
Reference Price during winter months from 1998 to 2015 (Source: USDA-AMS
and Department of Commerce) 50
4.3.1 Volume of plum and round tomatoes from Mexico plotted against IWEEKS
using parameters of IWEEK, IWEEK^2, and IWEEK^3 from tables 4.3.2 54
4.3.2 Volume of plum and round tomatoes from Florida plotted against IWEEKS
using parameters of IWEEK, IWEEK^2, and IWEEK^3 from tables 4.3.3 55

7
Tables
1.2.1 Historical Tomato Suspension Agreement Floor Prices through the Years
(Source: United States Department of Commerce – International Trade
Administration) 11
3.3.1 Descriptive Statistics Utilized for Terminal Market Prices, using data from
winter months (October 23 to June 30) from 1998 to 2015 28
3.3.2 Descriptive Statistics Utilized for Point of Origin Prices, using data from winter
months (October 23 to June 30) from 1998 to 2015 32
3.3.3 Descriptive Statistics Utilized for Volume, using data from winter months
(October 23 to June 30) from 1998 to 2015 34
4.1.1 Least Square Estimates of Terminal Market Price Equations for Plum Tomatoes
from Mexico 40
4.1.2 Least Square Estimates of Terminal Market Price Equations for Plum Tomatoes
from Florida 41
4.1.3 Least Square Estimates of Terminal Market Price Equations for Round
Tomatoes from Mexico 43
4.1.4 Least Square Estimates of Terminal Market Price Equations for Round
Tomatoes from Florida 44
4.2.1 Least Square Estimates of Shipping Point Price Equations of Plum Tomatoes
from Mexico 45
4.2.2 Least Square Estimates of Shipping Point Price Equations of Round Tomatoes
from Mexico 46
4.2.3 Least Square Estimates of Shipping Point Price Equations of Plum Tomatoes
from Florida 47
4.2.4 Least Square Estimates of shipping Point Price Equations of Round Tomatoes
from Florida 48
4.3.1 Least Square Estimates of Volume Equations of Tomatoes from Mexico 52
4.3.2 Least Square Estimates of Volume Equations of Tomatoes from Florida 53
4.3.3 Estimated Maximum Temperature Turning Point for Tomato Shipments 54
8
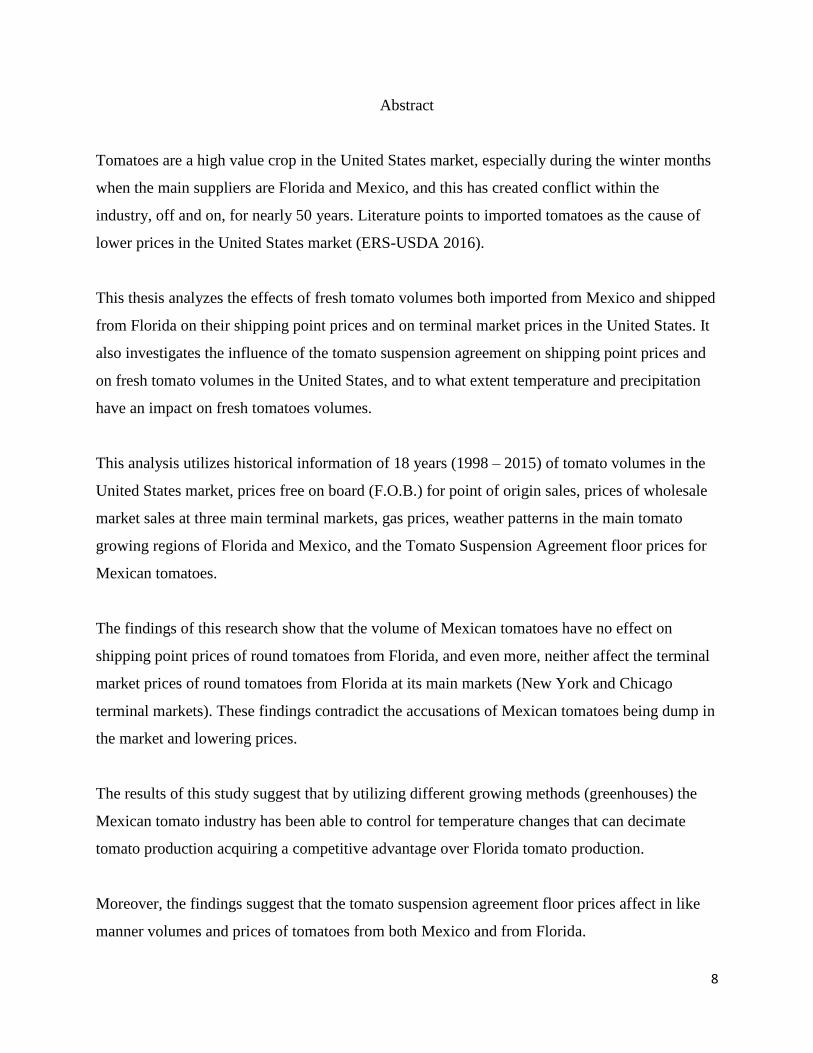
Abstract
Tomatoes are a high value crop in the United States market, especially during the winter months
when the main suppliers are Florida and Mexico, and this has created conflict within the
industry, off and on, for nearly 50 years. Literature points to imported tomatoes as the cause of
lower prices in the United States market (ERS-USDA 2016).
This thesis analyzes the effects of fresh tomato volumes both imported from Mexico and shipped
from Florida on their shipping point prices and on terminal market prices in the United States. It
also investigates the influence of the tomato suspension agreement on shipping point prices and
on fresh tomato volumes in the United States, and to what extent temperature and precipitation
have an impact on fresh tomatoes volumes.
This analysis utilizes historical information of 18 years (1998 – 2015) of tomato volumes in the
United States market, prices free on board (F.O.B.) for point of origin sales, prices of wholesale
market sales at three main terminal markets, gas prices, weather patterns in the main tomato
growing regions of Florida and Mexico, and the Tomato Suspension Agreement floor prices for
Mexican tomatoes.
The findings of this research show that the volume of Mexican tomatoes have no effect on
shipping point prices of round tomatoes from Florida, and even more, neither affect the terminal
market prices of round tomatoes from Florida at its main markets (New York and Chicago
terminal markets). These findings contradict the accusations of Mexican tomatoes being dump in
the market and lowering prices.
The results of this study suggest that by utilizing different growing methods (greenhouses) the
Mexican tomato industry has been able to control for temperature changes that can decimate
tomato production acquiring a competitive advantage over Florida tomato production.
Moreover, the findings suggest that the tomato suspension agreement floor prices affect in like
manner volumes and prices of tomatoes from both Mexico and from Florida.

9
Chapter 1: Introduction
1.1 Introduction
Fresh tomatoes are one of the most popular vegetables (while tomatoes are botanically fruits,
they are generally considered vegetables) in the United States, and they are demanded year-
round by consumers; in 2013 the estimated consumption in the United States was 6.5 billion
pounds (Cook, 2014). To meet the increasing demand for tomatoes, fresh tomato imports are
necessary to supplement the United States seasonal supplies.
Florida and Mexico are the main suppliers of tomatoes to the United States during the winter
season (December to April), accounting for more than 80 percent of the volume in the U.S.
(Figure 1.1.1).
Figure 1.1.1 Seasonality in tomato shipments in the U.S. market by origin in 2015 (Source:
USDA-AMS)
During the winter season, fresh tomatoes from Mexico are imported to provide mainly for the
western United States. Most of Florida’s winter crop is shipped to and consumed in the eastern
United States (Boriss and Brunke, 2005).
35%27%
35% 37% 47%
19% 1% 0% 2% 10%
46% 36%
61%
67%
61% 58% 46%
49%
44% 43% 50%
58%
48% 60%
5%
6%
5%4%
7%
32%
56% 57% 49%
33%
6% 3%
-
10,000
20,000
30,000
40,000
50,000
60,000
70,000
Jan Feb Mar Apr May Jun Jul Aug Sep Oct Nov Dec
10
,00
0 L
bs
Seasonality in Tomato Shipments
Florida Mexico Other

10
Florida and Mexico compete for the United States market (Ames et al., 1996) and during winter
season, Florida growers have accused Mexican growers of dumping (selling for less than the cost
of production) fresh tomatoes in the U.S. market (Thompson, et al., 2005), and argue that the
surge in Mexican tomato imports is a reason for the depressed domestic prices (Ames et al.,
1996).
1.2 Tomato Suspension Agreement (TSA)
Fresh tomatoes during the winter months have been the center of many disputes in international
commerce since the late 19th century (Ames et al, 1996). On April 1, 1996, the United States
tomato industry filed an antidumping petition with the U.S. Department of Commerce alleging
that Mexican tomatoes were sold in the U.S. market at less than a fair value (Rudman et al.,
2013). This prompted Mexican tomato growers to sign an agreement with the United States
government to stop the antidumping investigation, and agree to sell the tomatoes at or above a
reference price for all fresh Mexican tomatoes exported to the United States. Mexican tomato
exports destined for processing facilities are exempt from the Tomato Suspension Agreement.
On June 22, 2012, the U.S. tomato industry sought to withdraw their antidumping petition and
terminate the investigation and the suspension agreement of 1996 and start a new tomato
antidumping investigation that would set quotas or tariff on tomatoes from Mexico. However,
negotiations for a revised agreement between Mexican tomato growers and the U.S. government
began and a new tomato suspension agreement was in place by March 4, 2013 with new
tomatoes categories and an increase of the reference prices as shown in table 1.2.1 that gives
historical levels of reference prices set by the Tomato Suspension Agreement since its inception
in 1996.
The tomato suspension agreement of 2013 sets different floor prices for Mexican fresh tomatoes
during the summer and winter, and specifies prices for open field/adapted-environment and

11
controlled-environment1 production2. All exporters of Mexican tomatoes, growers and non-
growers, exporting to the United States are signatories to the Agreement. According to Mexican
growers, tomato exports have complied with the new tomato suspension agreement requirements
(Flores and Lopez, 2015)3.
Table 1.2.1 Historical Tomato Suspension Agreement Floor Prices through the Years4
Tomatoes
July 1 - October 22 October 23 - June 30
Dollars per lb. Dollars per lb.
1996 $ 0.2068 $ 0.2068
2002 $ 0.1720 $ 0.2169
2008 $ 0.1720 $ 0.2169
2013 $ 0.2458 $ 0.3110
(Source: United States Department of Commerce – International Trade Administration)
The reference prices set by the tomato suspension agreement allow Mexican tomatoes to be sold
at or above the reference prices. Thus, when the market price of tomatoes is below the reference
price, Mexican tomatoes are prevented from commercial sales in the United States and are
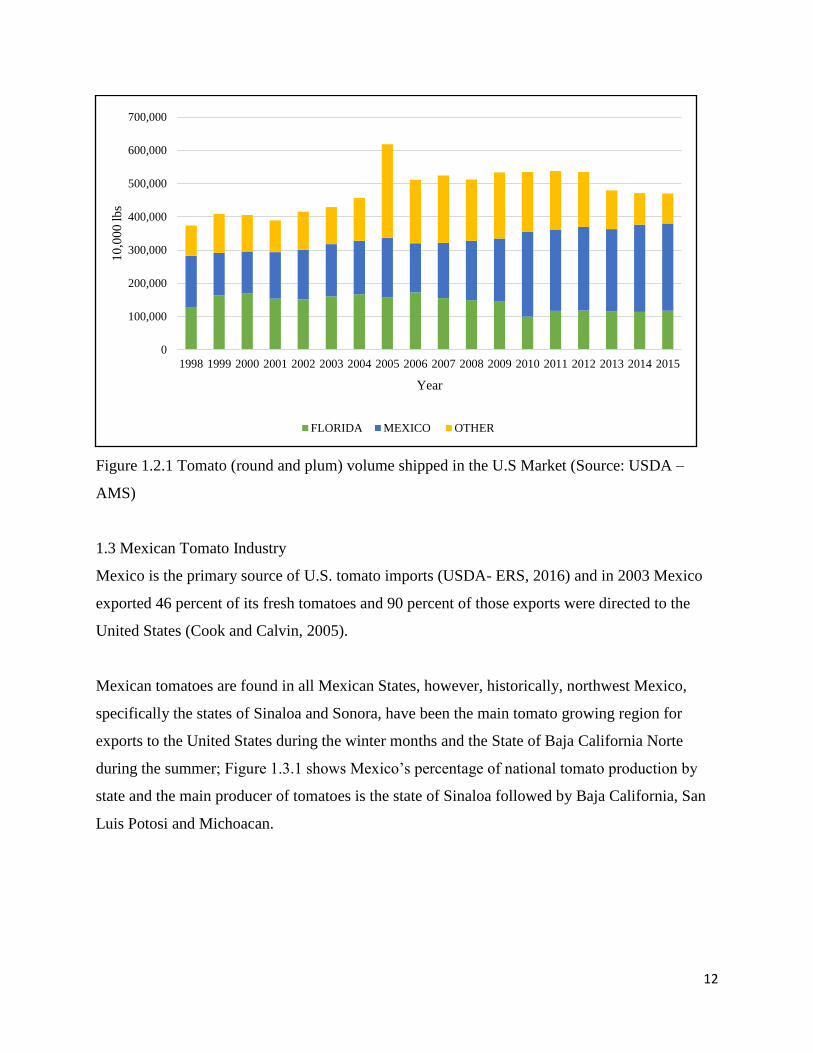
redirected to other markets, donated or destroyed. Figure 1.2.1 shows the annual market
percentage of plum and round tomatoes in the U.S. by their origin.
1 Controlled environment tomatoes are limited to those tomatoes grown in a fully-enclosed permanent aluminum or
fixed steel structure clad in glass, impermeable plastic, or polycarbonate using automated irrigation and climate
control, including heating and ventilation capabilities in an artificial medium using hydroponic methods. 2 Suspension of Antidumping Investigation on Fresh Tomatoes from Mexico: Price per pound of Open Field and
Adapted Environment, other than specialty – July 1 to October 22 $0.2458/lb, October 23 to June 30 $0.31/lb;
Controlled environment, other than specialty – July 1 to October 22 $0.3251/lb, October 23 to June 30 $0.41/lb;
Specialty, loose – July 1 to October 22 $0.3568/lb, October 23 to June 30 $0.45/lb; Specialty, packed – July 1 to
October 22 $0.4679/lb, October 23 to June 30 $$0.59/lb. (Department of Commerce - Weight Charts, 2013) 3 Signatories will fully comply with all requirements of Mexican regulations concerning identification, tracking,
verification and inspection by the relevant Mexican authorities including 3 the Ministry of Economy (SECON), the
Ministry of Agriculture (SAGARP A), SAGARPA's National Food Health, Safety and Quality Service
(SENASICA) and Customs. In accordance with Mexican regulations, non-compliance will result in the revocation
of export privileges (Department of Commerce – Suspension of Antidumping Investigation, 2013). 4 Prices of tomatoes are of open field and adapted environment other than specialty.
12
Figure 1.2.1 Tomato (round and plum) volume shipped in the U.S Market (Source: USDA –
AMS)
1.3 Mexican Tomato Industry
Mexico is the primary source of U.S. tomato imports (USDA- ERS, 2016) and in 2003 Mexico
exported 46 percent of its fresh tomatoes and 90 percent of those exports were directed to the
United States (Cook and Calvin, 2005).
Mexican tomatoes are found in all Mexican States, however, historically, northwest Mexico,
specifically the states of Sinaloa and Sonora, have been the main tomato growing region for
exports to the United States during the winter months and the State of Baja California Norte
during the summer; Figure 1.3.1 shows Mexico’s percentage of national tomato production by
state and the main producer of tomatoes is the state of Sinaloa followed by Baja California, San
Luis Potosi and Michoacan.
0
100,000
200,000
300,000
400,000
500,000
600,000
700,000
1998 1999 2000 2001 2002 2003 2004 2005 2006 2007 2008 2009 2010 2011 2012 2013 2014 2015
10
,00
0 l
bs
Year
FLORIDA MEXICO OTHER

13
Figure 1.3.1 Mexican States national participation on tomato production (Source: Mexican
Agriculture Department – SAGARPA)
In recent years tomato cultivation areas for export to the United States have expanded to other
regions of Mexico, increasing export volumes and extending seasons. This expansion can be
explained by the growing greenhouse production of tomatoes in Mexico; compared to
conventional growing methods, greenhouse techniques increase yield and decrease production
risk (Asci, et al., 2013).
According to the Mexican Protected Horticulture Association (AMHPAC), production under
greenhouse in Mexico had increased to more than 57,000 acres in 2015 from 1,951 acres in
2000. Seventy percent of the greenhouse production in Mexico in 2015 was tomatoes and 80
percent of all greenhouse production was destined to the United States. Mexico has more
greenhouse tomato area than either the United States or Canada (Cook and Calvin, 2005).
The highest number of greenhouses are in the northeast of Mexico with more than 13,000 acres,
followed by western Mexico with over 4,800 acres (AMHPAC, 2015); the expansion of tomato
growing areas is reflected in the increase of tomato volume imports through southern Texas ports
Sinaloa
Baja California
San Luis Potosi
Michoacan
Percentage of National Production
Higher than 10% 6 to 10% 1 to 5% Less than 1%

14
of entry. Figure 1.3.2 shows how exports of Mexican tomatoes to the United States have
increased through Texas and other ports of entry.
Figure 1.3.2 Share of Mexican Tomatoes Exported to the United States by Port of Entry (Source:
USDA- AMS)
The increased importation of tomatoes from Mexico is not likely to diminish as it is estimated
that U.S. produce imports from Mexico through land ports will increase 32 percent from 2012 to
2020, and most of the growth will occur through Texas ports of entry, with imports expected to
grow 62 percent (Palma, et al., 2013).
1.4 Florida Tomato Industry
Tomatoes are the number one value crop for Florida (USDA-NASS 2016) and the state has been
first in the United States in producing fresh-market tomatoes for decades (USDA-ERS, 2016),
supplying tomatoes largely for winter months.
According to the Florida Tomato Committee5, Florida’s tomato industry is believed to have
started in 1870s, with the major farms to grow tomatoes for the U.S. market in Manatee County
5 http://www.floridatomatoes.org/tomato-101/
0
20000
40000
60000
80000
100000
120000
140000
160000
10
,00
0 l
bs.
Nogales Texas Otay Mesa Other

15
in west-central Florida; by 2013 Florida’s tomato production was estimated to be one billion
pounds. Florida’s main tomato production areas comprise the counties of Pinellas, Hillsborough,
Polk, Osceola, Brevard, and all counties situated to their south6 (see Figure 1.4.1 for map of
Florida production areas).
Figure 1.4.1 Tomato growing regions of Florida (Source: Author)
Tomatoes grown in Florida are harvested from October to June, with the most active harvesting
months being November to May (USDA – NASS 2016). In 2016 Florida produced fresh-market
tomatoes on 30,000 to 40,000 acres, about one-third of total U.S. fresh-tomato acreage, a share
that has barely changed since the 1960s (USDA-ERS 2016).
According to the National Agricultural Statistics Service (USDA 2016), in 2015 Florida planted
acreage for tomatoes decreased two percent compared to the previous year. The lack of increased
fresh-tomato acreage has impacted the availability of tomatoes from Florida; additionally,
Florida tomato production is grown on open field raised beds (USDA-NIFA 2006), which
exposes the crop to weather events. Figure 1.4.2 shows the decrease of tomato shipments coming
out of the State of Florida, in 2010 there is a sharp decrease of tomato shipments from Florida
6 Florida Tomato Committee

16
due to abundant rains and sub-freezing temperatures during the first months of the year (Florida
Department of Agriculture and Consumer Services 2011).
Figure 1.4.2 Total Tomatoes from Florida in the U.S. Market, 1999 to 2015 (Source: USDA-
AMS)
Florida producers have traditionally benefited from the high prices during the winter tomato
market because they produce tomatoes in the off-season of the United States; however,
competition with Mexican producers has affected their profits (Asci, et al., 2013). Additionally,
mature green tomatoes, the main tomato grown in Florida, have seen increased competition from
greenhouse production of tomatoes which are preferred by consumers (Cook and Calvin, 2005).

17
Chapter 2: Literature Review
2.1 Literature Review
Ward (1982) studied the linkage and price transmission of retail, wholesale, and shipping point
prices and found that wholesale price increase is not immediately passed back to shipping point
to the same degree as when prices decrease, noticing generally a lag between wholesale price
changes and shipping point price changes for fresh vegetables.
Ames et al. (1996) analyzed consumer welfare impact by setting tariffs on Mexican winter
tomato imports as requested by Florida producers’ 1996 petition. Their model included a demand
for domestic tomato consumption equation, two supply equations, two retail price equations and
an identity equation to bind the market segments together. Their model confirms that retail price
movement follows wholesale price movement closely in the U.S. tomato market. It was also
estimated that increasing tariffs on Mexican tomato imports would reduce the import price, but
the volume would only decline about one percent.
Padilla-Bernal et al. (2000) estimated the impact of several economic and trade policy factors on
the volume of fresh tomato imports from Mexico to the United States during the 1990s. The
study developed a U.S.-Mexico tomato trade model, and took into consideration trading costs,
volume of Mexican imports, exchange rate, tariffs, etc. The model used was a simultaneous
equation system that included three behavioral equations, an identity to represent the excess U.S.
demand for Mexican tomatoes, and a trading cost function. The results of this study supported
their theory that much of the trade in the U.S. market is related to institutionalized trading
relationships (commercial agreements) and that the quantity supplied of fresh tomatoes from
Mexico to the U.S. market is insignificantly related to the entry market price of tomatoes and the
exchange rate.
Padilla-Bernal et al. (2003) examined the relationship between major shipping points and
terminal markets for Mexican imported, Florida and California tomatoes. They utilized the quasi-
maximum-likelihood estimation for an extended parity bounds model for supply regions from

18
Mexican imports, California and Florida, on three representative terminal markets: Los Angeles,
Chicago and Boston. However, they noted that only the western markets have received Mexican
tomato shipments on a weekly basis and Chicago and Boston did not receive Mexican tomatoes
year-round, possibly due to the distance from Mexican shipping points. The results showed that
as distance between markets increases, the risk of doing business in those markets increases,
probably due to time lags for shipping and the associated loss in quality. Consequently, the
probability of having higher non-observable transaction cost or a longer adjustment period
increases.
Thompson et al. (2005) analyzed the impact of the Tomato Suspension Agreement on imports of
fresh tomatoes from Mexico; specifically, the impact of the floor price on Mexican tomato
imports and supply-response for Florida fresh tomatoes. The study included the calculation of
“growing degree days” to estimate the potential duration of harvest; a model for shipments of
round tomatoes; a supply-response equation for Florida fresh tomatoes; and procedures for
testing for distinct switching regimes/policies. The study found that price and quantity of fresh
tomatoes from Florida are determined simultaneously; and it found evidence that there was a
change in Florida supply-response of fresh tomatoes once the Tomato Suspension Agreement
was in place, where Florida shipments were more responsive to own-price changes when prices
of Mexican tomatoes were near the reference price of the Tomato Suspension Agreement.
Amizkuzuno et al. (2012) analyzed the impact of border and distance on price transmission
between tomato markets in Ghana and Burkina-Faso. They selected four major fresh tomato
consumer markets in Ghana and analyzed them when Burkina-Faso was the major source of
tomatoes and when Ghana’s fresh tomato supply was local. The analysis helped determine
whether distance and international border matter for price transmission. It utilized two variants of
a vector error correction model (VECM) focusing on prices and trade regimes, the standard and a
regime-dependent one. The results show that producer and consumer markets do not drift apart
in the long run; there is evidence of an interstate tomato market, where market prices adjust to
achieve long-run market equilibrium. It was concluded that an increase in geographic distance
and presence of international borders between markets appear to weaken, all other thing being
equal, the speed of price transmission between producer market and consumer market.

19
This study takes into consideration the findings of the work previously mentioned, however it
differentiates itself from these by tying together the analysis of terminal market prices of
tomatoes based on volume and their shipping point prices, with the analysis of shipping point
prices of tomatoes based on their volume and the restrictions of the Tomato Suspension
Agreement (TSA), and with the analysis of volume of tomatoes based on the TSA restrictions,
weather variables and seasonality. In addition this investigation gathers historical information
about production areas, volumes and prices of fresh tomatoes at shipping points and terminal
markets for 18 years (1998 to 2015). This analysis helps to have a broader understanding on the
tomato market in the United States and the implications of the TSA for Mexican and Floridian
tomatoes.

20
Chapter 3: Data and Methods
3.1 Objective of the Study
The objective of this study is to analyze different factors that influence the price of winter
tomatoes7 at terminal markets and shipping points. The study also looks at what drives tomato
volumes up or down and analyzes the effect of the tomato suspension agreement on the volume
of tomatoes in the United States market. Figure 3.1.1 shows the average volume of tomatoes
from Mexico and Florida throughout the weeks of the year from 1998 to 2015.
Figure 3.1.1: Average volume of Floridian and Mexican Tomatoes by their type and origin,
1998-2015 (Source: USDA-AMS)
Literature indicates that shipping-point prices for field grown tomatoes in the United States have
frequently been under pressure because of imports and greenhouse products (USDA- ERS,
2016); therefore, this study also looks at volume in the United States market, especially that from
imported tomatoes from Mexico, to see if there is a significant impact in the prices of tomatoes
in the United States market. Figure 3.1.2 shows the average F.O.B. prices of round and
plum/Roma tomatoes from 1998 to 2015.
7 Mature green, vine ripe, and Roma or plum tomatoes are the scope of this study.

21
Figure 3.1.2 Yearly average of F.O.B. prices of tomatoes round and plum or Roma8 from Florida
and Mexico (Source: USDA-AMS)
Mexico has had a long trade relationship with the United States, and has provided tomatoes for
many decades. The historical trade information allows comparisons of volume and prices during
different weather conditions in Mexico and the United States to better understand possible
factors that influence the tomato market in the United States.
The interest factors included in the study are volume of tomatoes in the United States, segregated
by volume from Mexico, and Florida; shipping point prices of tomatoes from Florida and
Mexico (Nogales, AZ, Otay Mesa, and Texas). Shipping cost based on the price of fuel during
the same time periods, and weather-related factors in the main tomato growing regions of Florida
and Mexico during the winter months.
For both tomatoes from Mexico and Florida in the Los Angeles, Chicago and New York terminal
markets, respectively, it is expected to see a negative coefficient for volumes as the more product
8 Roma tomatoes are synonymous of plum tomatoes.

22
is available the lower the prices would be. Shipping point prices and shipping cost are expected
to have positive coefficients because of cost transmission.
Likewise for shipping point prices of tomatoes from Mexico and Florida, it is anticipated to see a
negative coefficient for volumes. There is no prior expectation on the Tomato Suspension
Agreement indicator (TSADUMMY) effect on shipping point prices; the coefficients could be
either positive and show that when the TSA floor prices are binding Mexican tomatoes the
marketers will push to quote higher prices, and the market will follow the rise in prices; or
negative and show that the market will push prices down to pay the least possible price allowed.
For tomato volume results, a positive coefficient is expected for temperatures and a negative
coefficient for squared temperature as warm weather helps tomato plants to start and increase
production up to a certain temperature. Once this temperature is reached production of tomatoes
will decrease. Precipitation is expected to have a negative coefficient given that rain can damage
the quality of tomatoes. A negative TSADUMMY coefficient is expected for Mexican tomatoes
if the floor prices are binding. However, it is possible to see a positive TSADUMMY coefficient
for tomatoes from Florida if Florida producers seek an “opportunistic” behavior (Thompson et al.
2005). Seasonality is expected to be a significant factor for all tomatoes.
3.2 Data
All the data gathered for the analysis came from public domain sources. The information
presented is weekly, and reflects seasonal floor prices from the Tomato Suspension Agreement,
monthly changes in gasoline prices, as well as daily variations in temperature and precipitation.
Terminal market prices of tomatoes (round and plum), shipping point or free on board (F.O.B.)
prices of tomatoes, and volume of tomatoes in the United States were accessed through the
Agricultural Marketing Services, Market News portal (USDA). However, this information only
goes back until the second week of January 1998, so due to this information limitation, the rest
of the data gathered from other sources is narrowed to the same time period.

23
Other sources of information include the Bureau of Labor Statistics for Consumer Price Index,
all urban consumers (CPI-U), which was utilized to deflate dollar values through time (1982-
84=100); the United States Energy Information Administration for on-highway diesel fuel prices
which were utilized to account for cost of shipping; the United States Department of Commerce
– International Trade Administration, Enforcement and Compliance for Tomato Suspension
Agreement floor prices; and the National Oceanic and Atmospheric Administration (NOAA),
National Centers for Environmental Information for summaries of weather observations (air
temperature and precipitation).
This study analyzes plum and round tomatoes only as these are the most important types of
tomatoes sold in the United Sates. For example, in 2015, plum and round tomatoes accounted for
91 percent of all tomatoes sold in the U.S., while grape and cherry tomatoes accounted for about
9 percent (Figure 3.2.1).
Figure 3.2.1: Share of Fresh Tomato Types Shipped in the U.S. Market in 2015 – all origins
(Source: USDA-AMS)
Tomato prices utilized in the study to estimate wholesale prices are averages of the low price
quotes of one pound of round and plum tomatoes. All prices represent the average price of their
respective week regardless of size, color, packaging, or growing method.
Plum Tomatoes
1,455mill lbs
28%
Grape Tomatoes
350 mill lbs
7%
Cherry Tomatoes
108mill lbs
2%
Round Tomatoes
3,287 mill lbs
63%
Share of Fresh Tomatoes Shipped in the U.S. Market in 2015 by Type
24
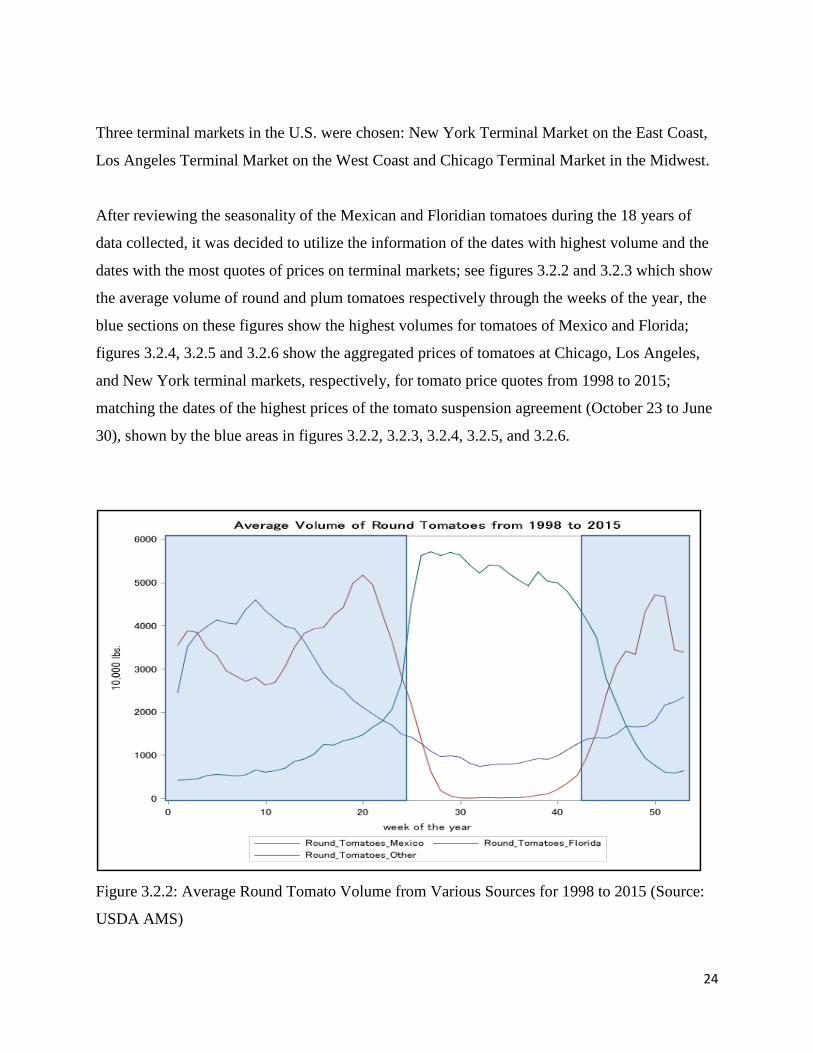
Three terminal markets in the U.S. were chosen: New York Terminal Market on the East Coast,
Los Angeles Terminal Market on the West Coast and Chicago Terminal Market in the Midwest.
After reviewing the seasonality of the Mexican and Floridian tomatoes during the 18 years of
data collected, it was decided to utilize the information of the dates with highest volume and the
dates with the most quotes of prices on terminal markets; see figures 3.2.2 and 3.2.3 which show
the average volume of round and plum tomatoes respectively through the weeks of the year, the
blue sections on these figures show the highest volumes for tomatoes of Mexico and Florida;
figures 3.2.4, 3.2.5 and 3.2.6 show the aggregated prices of tomatoes at Chicago, Los Angeles,
and New York terminal markets, respectively, for tomato price quotes from 1998 to 2015;
matching the dates of the highest prices of the tomato suspension agreement (October 23 to June
30), shown by the blue areas in figures 3.2.2, 3.2.3, 3.2.4, 3.2.5, and 3.2.6.
Figure 3.2.2: Average Round Tomato Volume from Various Sources for 1998 to 2015 (Source:
USDA AMS)

25
Figure 3.2.3: Average Plum Tomatoes Volume from Various Sources for 1998 to 2015 (Source:
USDA-AMS)
Figure 3.2.4: Aggregated Average Weekly Prices of Fresh Tomatoes in Chicago Terminal
Market: By Source and Type of Tomato (Source: USDA-AMS)

26
Figure 3.2.5: Aggregated Average Weekly Prices of Fresh Tomatoes in Los Angeles Terminal
Market: By Source and Type of Tomato (Source: USDA-AMS)
Figure 3.2.6: Aggregated Average Weekly Prices of Fresh Tomatoes in New York Terminal
Market: By Source and Type of Tomato (Source: USDA-AMS)
27
3.3 Descriptive Statistics
All the estimations utilized weekly data of winter months (week 1 to 26, and week 44 to 53)
from 1998 to 2015.
To facilitate calculations, all the variables that represent dollar values have been deflated by the
CPI (1982-84=100), and this is reflected in their values.
To analyze terminal market prices, 22 variables were considered with a maximum of 631
observations each. The variables include time measurements, average low prices of tomatoes at
terminal markets, average low prices at shipping point (F.O.B.), fuel price of diesel on highway,
and the aggregated volume of tomatoes by region; table 3.3.1 shows each of these variables.
For the shipping point prices analysis 13 variables were considered with a maximum of 631
observations each; these include time measurements, average low prices at shipping point
(F.O.B.), aggregated volume of tomatoes by region, volume of tomatoes by variety and region,
and indicator of the Tomato Suspension Agreement floor price. Table 3.3.2 shows each of the
variables utilized for shipping point prices analysis.
For the volume analysis 12 variables were considered, with a maximum of 631 observations
each. The variables include, time measurements, volumes of tomatoes by variety and region,
Maximum air temperature and precipitation by region weather stations, a week index, and an
indicator of the Tomato Suspension Agreement floor price; table 3.3.3 shows each of these
variables.
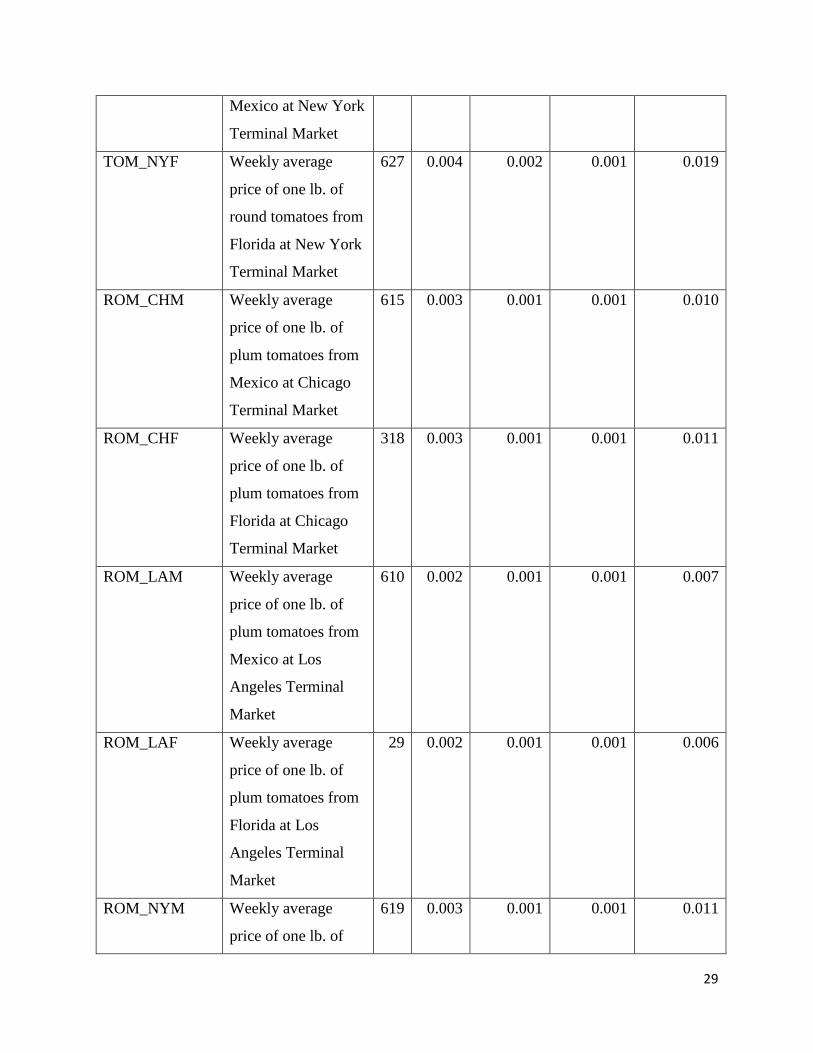
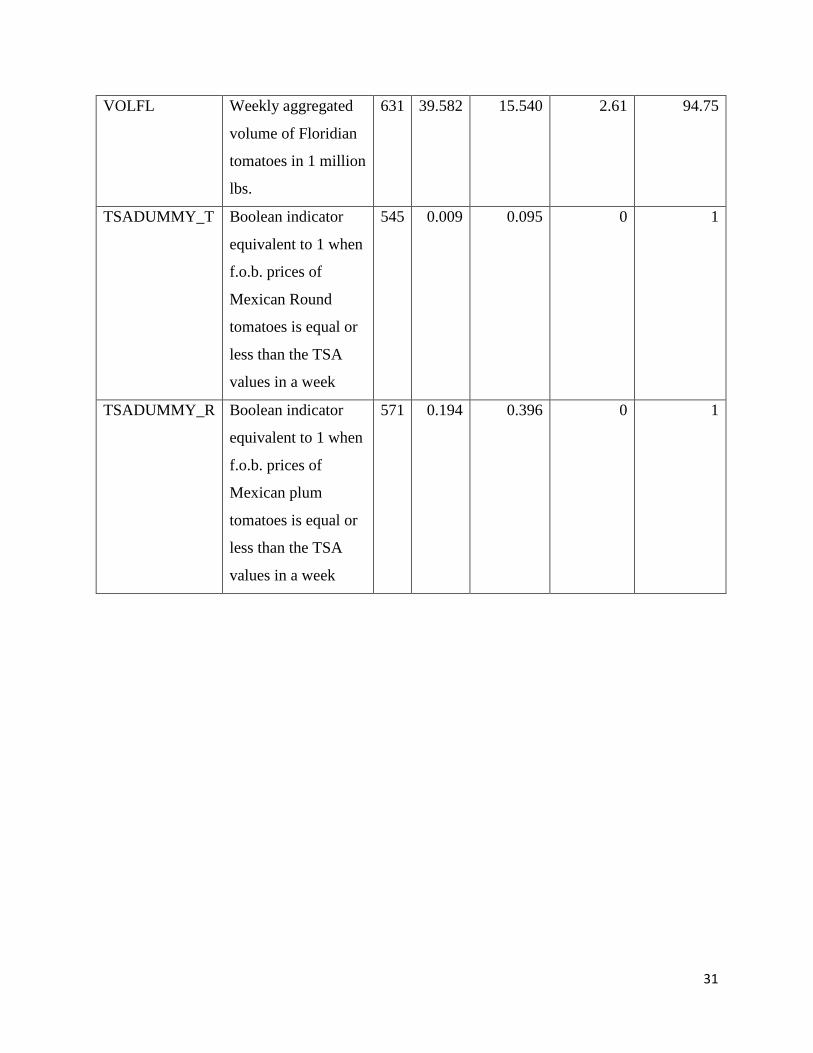
Tables 3.3.1, 3.3.2, and 3.3.3 show the variables description, the number of observations “N”,
their sample mean, standard deviation, and minimum and maximum values.

28
Table 3.3.1 Descriptive Statistics Utilized for Terminal Market Prices, using data from winter
months (October 23 to June 30) from 1998 to 2015
Variable Description N Mean Standard
Deviation
Minimum Maximum
WEEK Week of the
observation
631 22.545 16.57 1 53
TOM_CHM Weekly average
price of one lb. of
round tomatoes from
Mexico at Chicago
Terminal
618 0.004 0.001 0.002 0.012
TOM_CHF Weekly average
price of one lb. of
round tomatoes from
Florida at Chicago
Terminal Market
610 0.004 0.002 0.001 0.014
TOM_LAM Weekly average
price of one lb. of
round tomatoes from
Mexico at Los
Angeles Terminal
Market
612 0.003 0.001 0.001 0.010
TOM_LAF Weekly average
price of one lb. of
round tomatoes from
Florida at Los
Angeles Terminal
Market
318 0.002 0.001 0.001 0.006
TOM_NYM Weekly average
price of one lb. of
round tomatoes from
580 0.004 0.002 0.001 0.013
29
Mexico at New York
Terminal Market
TOM_NYF Weekly average
price of one lb. of
round tomatoes from
Florida at New York
Terminal Market
627 0.004 0.002 0.001 0.019
ROM_CHM Weekly average
price of one lb. of
plum tomatoes from
Mexico at Chicago
Terminal Market
615 0.003 0.001 0.001 0.010
ROM_CHF Weekly average
price of one lb. of
plum tomatoes from
Florida at Chicago
Terminal Market
318 0.003 0.001 0.001 0.011
ROM_LAM Weekly average
price of one lb. of
plum tomatoes from
Mexico at Los
Angeles Terminal
Market
610 0.002 0.001 0.001 0.007
ROM_LAF Weekly average
price of one lb. of
plum tomatoes from
Florida at Los
Angeles Terminal
Market
29 0.002 0.001 0.001 0.006
ROM_NYM Weekly average
price of one lb. of
619 0.003 0.001 0.001 0.011

30
plum tomatoes from
Mexico at New York
Terminal Market
ROM_NYF Weekly average
price of one lb. of
plum tomatoes from
Florida at New York
Terminal Market
598 0.003 0.001 0.001 0.012
RFOBFL Weekly average
price f.o.b. of one lb.
of plum tomatoes
from Florida districts
597 0.002 0.001 0.001 0.008
RFOBMX Weekly average
price f.o.b. of one lb.
of plum tomatoes
from Mexico
571 0.002 0.001 0.001 0.008
TFOBFL Weekly average
price f.o.b. of one lb.
of round tomatoes
from Florida
628 0.002 0.001 0.001 0.008
TFOBMX Weekly average of
price f.o.b. one lb. of
round tomatoes from
Mexico
545 0.002 0.001 0.001 0.010
GAS Weekly fuel price of
diesel on highway, in
dollars per gallon
631 0.012 0.004 0.006 0.021
VOLMX Weekly aggregated
volume of Mexican
tomatoes in 1 million
lbs.
631 44.408 19.658 9.74 100.77
31
VOLFL Weekly aggregated
volume of Floridian
tomatoes in 1 million
lbs.
631 39.582 15.540 2.61 94.75
TSADUMMY_T Boolean indicator
equivalent to 1 when
f.o.b. prices of
Mexican Round
tomatoes is equal or
less than the TSA
values in a week
545 0.009 0.095 0 1
TSADUMMY_R Boolean indicator
equivalent to 1 when
f.o.b. prices of
Mexican plum
tomatoes is equal or
less than the TSA
values in a week
571 0.194 0.396 0 1

32
Table 3.3.2 Descriptive Statistics Utilized for Point of Origin Prices, using data from winter
months (October 23 to June 30) from 1998 to 2015
Variable Description N Mean Standard
Deviation
Minimum Maximum
WEEK Week of the
observation
631 22.545 16.570 1 53
VOL_RMX Weekly volume of
plum tomatoes from
Mexico in 1 million
lb. units
631 17.034 9.649 0 48.61
VOL_RFL Weekly volume of
plum tomatoes from
Florida in 1 million
lb. units
631 4.754 2.521 0 14.39
VOL_TMX Weekly volume of
round tomatoes from
Mexico in 1 million
lb. units
631 27.374 13.385 4.91 74.98
VOL_TFL Weekly volume of
round tomatoes from
Florida in 1 million
lb. units
631 34.828 13.868 2.13 87.96
RFOBFL Weekly f.o.b. average
minimum price of 1
lb. of plum tomatoes
from Florida
597 0.002 0.001 0.001 0.008
RFOBMX Weekly f.o.b. average
minimum price of 1
lb. of plum tomatoes
from Mexico
571 0.002 0.001 0.001 0.008

33
TFOBFL Weekly f.o.b. average
minimum price of 1
lb. of round tomatoes
from Florida
628 0.002 0.001 0.001 0.008
TFOBMX Weekly f.o.b. average
minimum price of 1
lb. of round tomatoes
from Mexico
545 0.002 0.001 0.001 0.011
VOLMX Weekly aggregated
volume of Mexican
tomatoes in 1 million
lbs.
631 44.408 19.658 9.74 100.77
VOLFL Weekly aggregated
volume of Floridian
tomatoes in 1 million
lbs.
631 39.582 15.540 2.61 94.75
TSADUMMY_T Boolean indicator
equivalent to 1 when
f.o.b. prices of
Mexican Round
tomatoes are equal or
less than the TSA
values in a week
545 0.009 0.095 0 1
TSADUMMY_R Boolean indicator
equivalent to 1 when
f.o.b. prices of
Mexican plum
tomatoes are equal or
less than the TSA
values in a week
571 0.194 0.396 0 1

34
Table 3.3.3 Descriptive Statistics Utilized for Volume, using data from winter months (October
23 to June 30) from 1998 to 2015
Variable Description N Mean Standard
Deviation
Minimum Maximum
WEEK Week of the
observation
631 22.545 16.570 1 53
VOL_RMX Weekly volume of
plum tomatoes from
Mexico in 1 million
lb. units
631 17.034 9.649 0 48.61
VOL_RFL Weekly volume of
plum tomatoes from
Florida in 1million
lb. units
631 4.754 2.521 0 14.39
VOL_TMX Weekly volume of
round tomatoes
from Mexico in 1
million lb. units
631 27.374 13.385 4.91 74.98
VOL_TFL Weekly volume of
round tomatoes
from Florida in 1
million lb. units
597 0.002 0.001 0.001 0.008
MEYERTMAX Weekly average
maximum air
temperature in ˚F at
Ft. Meyer weather
station
623 81.972 6.777 57.428 96
MEYERPRCP Weekly aggregated
precipitation
measured in inches
623 0.634 1.081 0 8.47
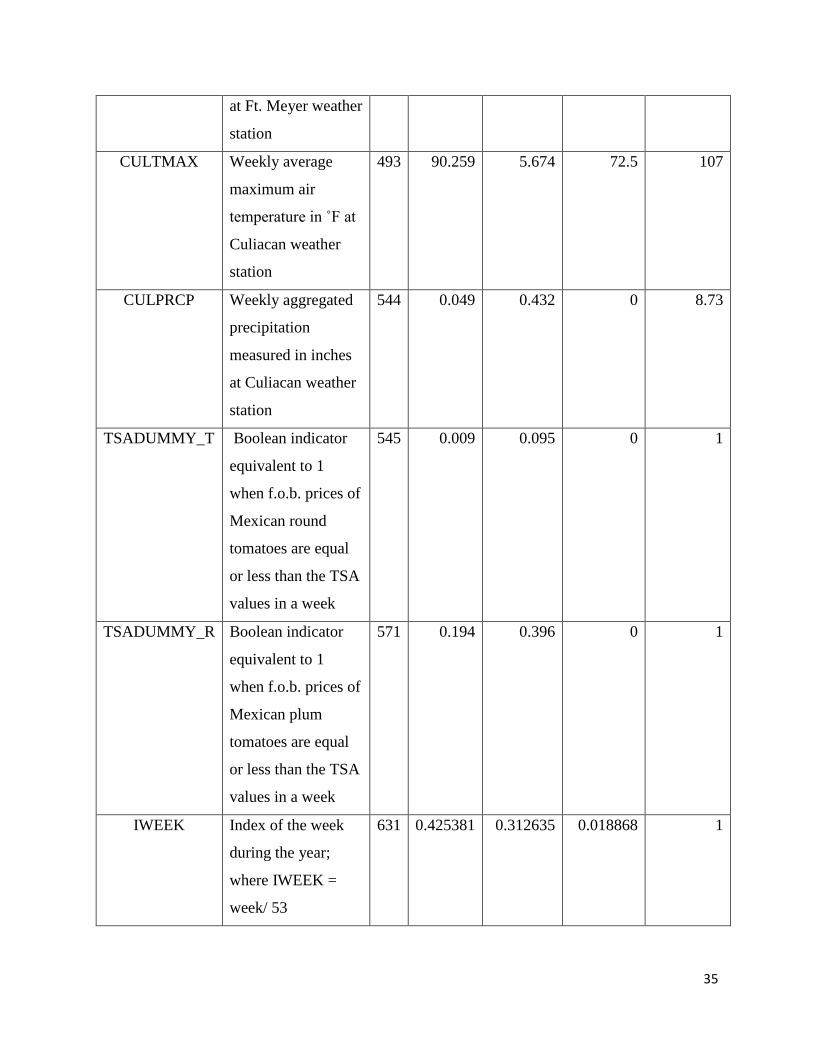
35
at Ft. Meyer weather
station
CULTMAX Weekly average
maximum air
temperature in ˚F at
Culiacan weather
station
493 90.259 5.674 72.5 107
CULPRCP Weekly aggregated
precipitation
measured in inches
at Culiacan weather
station
544 0.049 0.432 0 8.73
TSADUMMY_T Boolean indicator
equivalent to 1
when f.o.b. prices of
Mexican round
tomatoes are equal
or less than the TSA
values in a week
545 0.009 0.095 0 1
TSADUMMY_R Boolean indicator
equivalent to 1
when f.o.b. prices of
Mexican plum
tomatoes are equal
or less than the TSA
values in a week
571 0.194 0.396 0 1
IWEEK Index of the week
during the year;
where IWEEK =
week/ 53
631 0.425381 0.312635 0.018868 1

36
3.4 Empirical Models
Models used for analyzing terminal market prices, point of origin prices and tomato shipments
volumes are presented in this section.
3.4.1 Terminal Market Price Model
The terminal market prices for plum tomatoes are specified as:
(1) ROMCHMw= β11 + β21 VOLMX𝑤−1 + β31 VOLFL𝑤−1 + β41 RFOBMX𝑤−1 +
𝛽51 𝐺𝐴𝑆𝑤−1 + 𝜀𝑤
(2) ROM_CHF𝑤 = β12 + β22 VOLMX𝑤−1 + β32 VOLFL𝑤−1 + β42 RFOBFL𝑤−1 +
𝛽52 𝐺𝐴𝑆𝑤−1 + 𝜀𝑤
(3) ROM_LAMw = β13 + β23 VOLMX𝑤−1 + β33 VOLFL𝑤−1 + β43 RFOBMX𝑤−1 +
𝛽53 𝐺𝐴𝑆𝑤−1 + 𝜀𝑤
(4) ROM_LAF𝑤 = β14 + β24 VOLMX𝑤−1 + β34 VOLFL𝑤−1 + β44 RFOBFL𝑤−1 +
𝛽54 𝐺𝐴𝑆𝑤−1 + 𝜀𝑤
(5) ROM_NYMw = β15 + β25 VOLMX𝑤−1 + β35 VOLFL𝑤−1 + β45 RFOBMX𝑤−1 +
𝛽55 𝐺𝐴𝑆𝑤−1 + 𝜀𝑤
(6) ROM_NYF𝑤 = β16 + β26 VOLMX𝑤−1 + β36 VOLFL𝑤−1 + β46 RFOBFL𝑤−1 +
𝛽56 𝐺𝐴𝑆𝑤−1 + 𝜀𝑤
Where, w represents week. Definitions of the variables are given in table 3.3.1.
All of the explanatory variables, are lagged, as it was assumed a lag between shipping point
prices (Ward, 1982), volume and the terminal markets prices. A total of six terminal market
equations [(1) to (6)] for plum tomatoes are estimated.
The terminal market prices for round tomatoes are similarly specified as:
(7) TOM_CHMw = β17 + β27 VOLMX𝑤−1 + β37 VOLFL𝑤−1 + β47 TFOBMX𝑤−1 +
𝛽57 𝐺𝐴𝑆𝑤−1 + 𝜀𝑤
(8) TOM_CHF𝑤 = β18 + β28 VOLMX𝑤−1 + β38 VOLFL𝑤−1 + β48 TFOBFL𝑤−1 +
𝛽58 𝐺𝐴𝑆𝑤−1 + 𝜀𝑤

37
(9) TOM_LAMw = β19 + β29 VOLMX𝑤−1 + β39 VOLFL𝑤−1 + β49 TFOBMX𝑤−1 +
𝛽59 𝐺𝐴𝑆𝑤−1 + 𝜀𝑤
(10) TOM_LAF𝑤 = β110 + β210 VOLMX𝑤−1 + β310 VOLFL𝑤−1 + β410 TFOBFL𝑤−1 +
𝛽510 𝐺𝐴𝑆𝑤−1 + 𝜀𝑤
(11) TOM_NYMw = β111 + β211 VOLMX𝑤−1 + β311 VOLFL𝑤−1 + β411 TFOBMX𝑤−1 +
𝛽511 𝐺𝐴𝑆𝑤−1 + 𝜀𝑤
(12) TOM_NYF𝑤 = β112 + β212 VOLMX𝑤−1 + β312 VOLFL𝑤−1 + β412 TFOBFL𝑤−1 +
𝛽512 𝐺𝐴𝑆𝑤−1 + 𝜀𝑤
Definitions of the variables are explained in table 3.3.2. Similarly to terminal market equations
for plum tomatoes all of the explanatory variables are lagged. A total of six terminal market
equations [(7) to (12)] for round tomatoes are estimated.
3.4.2 Shipping Point Price Model
To estimate shipping point prices the utilization of consolidated tomato volumes from Mexico
and Florida were investigated; yet it was considered important to explain the effects of the
volume of each tomato type on shipping point prices.
The shipping point prices for plum and round tomatoes from Mexico and Florida with
consolidated volume are specified as follows:
(13) 𝑅𝐹𝑂𝐵𝑀𝑋𝑤 = 𝛽113 + 𝛽213 𝑉𝑂𝐿𝑀𝑋𝑤−1 + 𝛽313 𝑉𝑂𝐿𝐹𝐿𝑤−1 +
𝛽413 𝑇𝑆𝐴𝐷𝑈𝑀𝑀𝑌𝑤−1 + 𝜀𝑤
(14) 𝑅𝐹𝑂𝐵𝐹𝐿𝑤 = 𝛽114 + 𝛽214 𝑉𝑂𝐿𝑀𝑋𝑤−1 + 𝛽314 𝑉𝑂𝐿𝐹𝐿𝑤−1 +
𝛽414 𝑇𝑆𝐴𝐷𝑈𝑀𝑀𝑌𝑤−1 + 𝜀𝑤
(15) 𝑇𝐹𝑂𝐵𝑀𝑋𝑤 = 𝛽115 + 𝛽215 𝑉𝑂𝐿𝑀𝑋𝑤−1 + 𝛽315 𝑉𝑂𝐿𝐹𝐿𝑤−1 +
𝛽415 𝑇𝑆𝐴𝐷𝑈𝑀𝑀𝑌𝑤−1 + 𝜀𝑤
(16) 𝑇𝐹𝑂𝐵𝐹𝐿𝑤 = 𝛽116 + 𝛽216 𝑉𝑂𝐿𝑀𝑋𝑤−1 + 𝛽316 𝑉𝑂𝐿𝐹𝐿𝑤−1 +
𝛽416 𝑇𝑆𝐴𝐷𝑈𝑀𝑀𝑌𝑤−1 + 𝜀𝑤

38
An alternate specification for modeling shipping point prices is tried where individual volumes
of tomatoes by type rather than combined is used. And the shipping point prices for plum and
round tomatoes from Mexico and Florida with segregated volumes by type of tomatoes are
specified as follows:
(17) 𝑅𝐹𝑂𝐵𝑀𝑋𝑤 = 𝛽117 + 𝛽217 𝑉𝑂𝐿_𝑇𝑀𝑋𝑤−1 + 𝛽317 𝑉𝑂𝐿_𝑇𝐹𝐿𝑤−1 +
𝛽417 𝑉𝑂𝐿_𝑅𝑀𝑋𝑤−1 + 𝛽517 𝑉𝑂𝐿_𝑅𝐹𝐿𝑤−1 + 𝛽617 𝑇𝑆𝐴𝐷𝑈𝑀𝑀𝑌𝑤−1 + 𝜀𝑤
(18) 𝑅𝐹𝑂𝐵𝐹𝐿𝑤 = 𝛽118 + 𝛽218 𝑉𝑂𝐿_𝑇𝑀𝑋𝑤−1 + 𝛽318 𝑉𝑂𝐿_𝑇𝐹𝐿𝑤−1 +
𝛽418 𝑉𝑂𝐿_𝑅𝑀𝑋𝑤−1 + 𝛽518 𝑉𝑂𝐿_𝑅𝐹𝐿𝑤−1 + 𝛽618 𝑇𝑆𝐴𝐷𝑈𝑀𝑀𝑌𝑤−1 + 𝜀𝑤
(19) 𝑇𝐹𝑂𝐵𝑀𝑋𝑤 = 𝛽119 + 𝛽219 𝑉𝑂𝐿_𝑇𝑀𝑋𝑤−1 + 𝛽319 𝑉𝑂𝐿_𝑇𝐹𝐿𝑤−1 +
𝛽419 𝑉𝑂𝐿_𝑅𝑀𝑋𝑤−1 + 𝛽519 𝑉𝑂𝐿_𝑅𝐹𝐿𝑤−1 + 𝛽619 𝑇𝑆𝐴𝐷𝑈𝑀𝑀𝑌𝑤−1 + 𝜀𝑤
(20) 𝑇𝐹𝑂𝐵𝐹𝐿𝑤 = 𝛽120 + 𝛽220 𝑉𝑂𝐿_𝑇𝑀𝑋𝑤−1 + 𝛽320 𝑉𝑂𝐿_𝑇𝐹𝐿𝑤−1 +
𝛽420 𝑉𝑂𝐿_𝑅𝑀𝑋𝑤−1 + 𝛽520 𝑉𝑂𝐿_𝑅𝐹𝐿𝑤−1 + 𝛽620 𝑇𝑆𝐴𝐷𝑈𝑀𝑀𝑌𝑤−1 + 𝜀𝑤
Definition of the variables are explained in table 3.2.1. A total of eight shipping point price
equations are estimated, equations [(13) to (20)]. Utilizing the same considerations as for
terminal market price equations, all of the explanatory variables for shipping point prices are
lagged.
3.4.3 Volume Model
The volume equations utilize weather-related factors in their estimation. The utilization of
growing degree days (Thompson, et al., 2005) was considered to project the duration of harvest
from Florida and Mexico. The growing degree days are estimated by the accumulation of the
daily average temperature minus the chilling injury minimum temperature (LeStrange et al.,
2000)9. However, the results of these estimations were not conclusive (estimates were not
significant) and it was decided to utilize the maximum temperature and the squared maximum
temperature to estimate the volume of fresh tomatoes.
9 Tomato plants undergo chilling injury when night temperatures fall below 50˚F

39
The volume of round and plum tomatoes from Mexico and Florida are specified as follows:
(21) 𝑉𝑂𝐿_𝑅𝑀𝑋𝑤 = 𝛽121 + 𝛽221 𝐶𝑈𝐿𝑇𝑀𝐴𝑋𝑤−1 + 𝛽321 𝐶𝑈𝐿𝑇𝑀𝐴𝑋𝑤−12 +
𝛽421 𝐶𝑈𝐿𝑃𝑅𝐶𝑃𝑤−1 + 𝛽521 𝑇𝑆𝐴𝐷𝑈𝑀𝑀𝑌𝑤−1 + 𝛼121 𝐼𝑊𝐸𝐸𝐾 + 𝛼221 𝐼𝑊𝐸𝐸𝐾2 +
𝛼321 𝐼𝑊𝐸𝐸𝐾3 + 𝛼421 𝐼𝑊𝐸𝐸𝐾4 + 𝜀𝑤
(22) 𝑉𝑂𝐿_𝑇𝑀𝑋𝑤 = 𝛽122 + 𝛽222 𝐶𝑈𝐿𝑇𝑀𝐴𝑋𝑤−1 + 𝛽322 𝐶𝑈𝐿𝑇𝑀𝐴𝑋𝑤−12 +
𝛽422 𝐶𝑈𝐿𝑃𝑅𝐶𝑃𝑤−1 + 𝛽522 𝑇𝑆𝐴𝐷𝑈𝑀𝑀𝑌𝑤−1 + 𝛼122 𝐼𝑊𝐸𝐸𝐾 + 𝛼222 𝐼𝑊𝐸𝐸𝐾2 +
𝛼322 𝐼𝑊𝐸𝐸𝐾3 + 𝛼422 𝐼𝑊𝐸𝐸𝐾4 + 𝜀𝑤
(23) 𝑉𝑂𝐿_𝑅𝐹𝐿𝑤 = 𝛽123 + 𝛽223 𝑀𝐴𝑌𝐸𝑅𝑇𝑀𝐴𝑋𝑤−1 + 𝛽323 𝑀𝐴𝑌𝐸𝑅𝑇𝑀𝐴𝑋𝑤−12 +
𝛽423 𝑀𝐴𝑌𝐸𝑅𝑃𝑅𝐶𝑃𝑤−1 + 𝛽523 𝑇𝑆𝐴𝐷𝑈𝑀𝑀𝑌𝑤−1 + 𝛼123 𝐼𝑊𝐸𝐸𝐾 +
𝛼223 𝐼𝑊𝐸𝐸𝐾2 + 𝛼323 𝐼𝑊𝐸𝐸𝐾3 + 𝛼423 𝐼𝑊𝐸𝐸𝐾4 + 𝜀𝑤
(24) 𝑉𝑂𝐿_𝑇𝐹𝐿𝑤 = 𝛽124 + 𝛽224 𝑀𝐴𝑌𝐸𝑅𝑇𝑀𝐴𝑋𝑤−1 + 𝛽324 𝑀𝐴𝑌𝐸𝑅𝑇𝑀𝐴𝑋𝑤−12 +
𝛽424 𝑀𝐴𝑌𝐸𝑅𝑃𝑅𝐶𝑃𝑤−1 + 𝛽524 𝑇𝑆𝐴𝐷𝑈𝑀𝑀𝑌𝑤−1 + 𝛼124 𝐼𝑊𝐸𝐸𝐾 +
𝛼224 𝐼𝑊𝐸𝐸𝐾2 + 𝛼324 𝐼𝑊𝐸𝐸𝐾3 + 𝛼424
𝐼𝑊𝐸𝐸𝐾4 + 𝜀𝑤
The coefficient α4 us restricted as α4= –α1 –α2 –α3, to make sure that there are no jumps in
seasonality as we transition from the last week of one year to the first week of the next year.
Definitions of the variables are given in table 3.2.1. A total of four volume equations are
estimated, equations [(21) to (24)].
All of the explanatory variables of the volume equations are lagged, with exeption of IWEEK. It
is assumed that the events of a previous week would affect the volume sent to the market on the
following week.

40
Chapter 4: Results
4.1 Results for Price of Terminal Market Equations
Results of terminal market prices of plum tomatoes from Mexico are shown in table 4.1.1. As
expected, volume variables have negative influence on terminal market prices and are
statistically significant except for tomatoes from Florida at Los Angeles terminal market;
literature shows that tomatoes from Florida are generally commercialized in the U.S. east coast,
which could explain the lack of statistical significance of these tomatoes at Los Angeles terminal
market. Shipping point and gas prices parameters are positive and statistically significant (except
for gas prices at Chicago terminal market), showing price transmission as expected.
Table 4.1.1: Least Square Estimates of Terminal Market Price Equations for Plum Tomatoes
from Mexico
Terminal Market Price - Plum Tomatoes from Mexico
Dependent
Variable
Price of Tomatoes
from Mexico at
Chicago
(ROM_CHM)
Price of Tomatoes from
Mexico at Los Angeles
(ROM_LAM)
Price of Tomatoes
from Mexico at New
York (ROM_NYM)
Explanatory
Variables
Parameter
Estimate t Val.
Parameter
Estimate t Val.
Parameter
Estimate t Val.
Intercept 0.0014*** 8.58 0.0009*** 8.1 0.0011*** 8.23
VOLMX_LAG -0.000006*** -3.38 -0.000007*** -6.46 -0.000005*** -3.98
VOLFL_LAG -0.000005*** -2.6 -0.000001 -1.14 -0.000006*** -4.17
RFOBMX_LAG 0.9989*** 26.63 0.7916*** 32.41 0.9964*** 32.1
GAS 0.0073 1.05 0.0188*** 4.08 0.0243*** 4.17
R-Square 0.592 0.6925 0.6843
Observations
Used 562 568 561
Notes: Single, double, and triple asterisks (*) denote statistical significance at the 10%, 5%,
and 1% levels, respectively.

41
Terminal market price results for tomatoes from Florida are shown in table 4.1.2; it is important
to mention that the results of plum tomatoes from Florida at Los Angeles terminal market are
based on a sample of 29 observations limited by the number of times weekly prices of plum
tomatoes from Florida were observed at this market from 1998 to 2015. Volume parameters are
negative and statistically significant as expected, except for Florida tomatoes at Los Angeles
terminal market, like the results for plum tomatoes from Mexico. Shipping point prices are
positive and statistically significant as expected; gas prices are positive and only statistically
significant at New York terminal market. For plum tomatoes from Florida only price
transmission of its shipping point price is reflected on Chicago and Los Angeles terminal
markets given that gas prices are not significant for these markets; only New York terminal
market show price transmission for shipping point and gas prices.
Table 4.1.2: Least Square Estimates of Terminal Market Price Equations for Plum Tomatoes
from Florida
Terminal Market Price - Plum Tomatoes from Florida
Dependent
Variable
Price of Tomatoes from
Florida at Chicago
(ROM_CHF)
Price of Tomatoes from
Florida at Los Angeles
(ROM_LAF)
Price of Tomatoes
from Florida at New
York (ROM_NYF)
Explanatory
Variables
Parameter
Estimate t Val.
Parameter
Estimate t Val.
Parameter
Estimate t Val.
Intercept 0.04988*** 8.18 0.0004 1.02 0.0013*** 7.59
VOLMX_LAG -0.00047*** -7.06 -0.000031* -1.87 -0.000011*** -7.29
VOLFL_LAG -0.00022*** -3.44 0.000003 0.51 -0.000008*** -4.05
RFOBFL_LAG 0.83416*** 17.22 1.1472*** 9.88 0.8194*** 26.31
GAS 0.19738 0.93 0.0449 1.03 0.0290*** 4.19
R-Square 0.616 0.8831 0.6337
Observations
Used 313 29 578
Notes: Single, double, and triple asterisks (*) denote statistical significance at the 10%, 5%,
and 1% levels, respectively.

42
Prices of terminal markets for plum tomatoes of both Mexico and Florida show, that generally,
volumes from competing areas have a higher negative effect on terminal market prices than those
of their own volume, i.e. the volume of tomatoes from Florida had a higher negative impact on
prices of Mexican tomatoes and vice versa; with exception of Los Angeles terminal market,
where prices of Floridian and Mexican tomatoes were the volume of tomatoes from Florida was
not statistically significant (tables 4.1.1 and 4.1.2).
Results of terminal market prices of round tomatoes form Mexico are in table 4.1.3, where it is
shown that volumes are not statistically significant for neither New York nor Chicago terminal
markets. These results show that if there is an influence of the volume of tomatoes on prices this
would have to be already reflected at the shipping point price. Volume at Los Angeles terminal
market is negative as expected and statistically significant. All shipping point and gas prices for
round tomatoes from Mexico are positive and statistically significant as expected for price
transmission.
Round tomatoes from Florida terminal market prices results are shown in table 4.1.4. The
parameter estimates of volume of Mexican tomatoes are not significant at the main markets of
tomatoes from Florida, i.e. New York and Chicago; volume of tomatoes from Florida at Los
Angeles terminal market is not statistically significant like the results of plum tomatoes from
Florida and Mexico (table 4.1.1 and 4.1.2). Round tomatoes from Florida shipping point and gas
prices are positive and statistically significant as expected; except for gas prices at New York
terminal market which is not statistically significant; this result at this time cannot be explained.

43
Table 4.1.3: Least Square Estimates of Terminal Market Price Equations for Round Tomatoes
from Mexico
Terminal Market Price - Round Tomatoes from Mexico
Dependent
Variable
Price of Tomatoes from
Mexico at Chicago
(TOM_CHM)
Price of Tomatoes
from Mexico at Los
Angeles (TOM_LAM)
Price of Tomatoes
from Mexico at New
York (TOM_NYM)
Explanatory
Variables
Parameter
Estimate t Val.
Parameter
Estimate t Val.
Parameter
Estimate t Val.
Intercept 0.0019*** 7.06 0.0009*** 3.95 0.0019*** 5.48
VOLMX_LAG 0.000002 0.66 -0.000013*** -6.05 -0.000002 -0.75
VOLFL_LAG -0.000002 -0.073 -0.000011*** -4.54 0.000005 1.37
TFOBMX_LAG 0.8062*** 21.02 0.7014*** 21.82 0.8049*** 17.2
GAS 0.0204* 1.86 0.1479*** 16.21 0.0256* 1.9
R-Square 0.4615 0.5946 0.3824
Observations
Used 538 544 509
Notes: Single, double, and triple asterisks (*) denote statistical significance at the 10%, 5%,
and 1% levels, respectively.

44
Table 4.1.4: Least Square Estimates of Terminal Market Price Equations for Round Tomatoes
from Florida.
Terminal Market Price - Round Tomatoes from Florida
Dependent
Variable
Price of Tomatoes from
Florida at Chicago
(TOM_CHF)
Price of Tomatoes from
Florida at Los Angeles
(TOM_LAF)
Price of Tomatoes
from Florida at New
York (TOM_NYF)
Explanatory
Variables
Parameter
Estimate t Val.
Parameter
Estimate t Val.
Parameter
Estimate t Val.
Intercept 0.0006 1.48 0.0008*** 3.76 0.0014*** 3.96
VOLMX_LAG -0.000002 -0.56 -0.00001*** -5.91 0.0000003 0.1
VOLFL_LAG -0.000014*** -9.98 -0.00000004 -0.16 -0.000008* -1.92
TFOBFL_LAG 0.9095*** 12.31 0.8044*** 18.06 1.0666*** 15.82
GAS 0.1641*** 9.89 0.0451*** 4.93 0.0220 1.38
R-Square 0.3877 0.5837 0.3634
Observations
Used 607 316 625
Notes: Single, double, and triple asterisks (*) denote statistical significance at the 10%, 5%,
and 1% levels, respectively.

45
4.2. Results for Shipping Point Price Equations
Results for shipping point prices of both consolidated and segregated volume equations for
Mexican plum tomatoes are in table 4.2.1; for Mexican round tomatoes in table 4.2.2; for plum
tomatoes from Florida in table 4.2.3; and for round tomatoes from Florida in table 4.2.4.
Table 4.2.1: Least Square Estimates of Shipping Point Price Equations of Plum Tomatoes from
Mexico
Dependent Variable Price of Plum Tomatoes from Mexico (RFOBMX)
Consolidated Volume Segregated Volume
Explanatory Variables Parameter Estimate t Value Parameter Estimate t Value
Intercept 0.00253*** 19.83 0.00261*** 20.38
VOLMX_LAG -0.000010*** -6.53
VOLFL_LAG -0.000009*** -4.72
VOL_TMX_LAG -0.00001*** -3.25
VOL_TFL_LAG -0.000016*** -5.95
VOL_RMX_LAG -0.000017*** -4.79
VOL_RFL_LAG 0.00005*** 3.14
TSADUMMY_R_LAG -0.00407*** -6.27 -0.00036*** -5.20
R-Square 0.148 0.1692
Observations Used 559 559
Notes: Single, double, and triple asterisks (*) denote statistical significance at the 10%, 5%, and
1% levels, respectively.
46
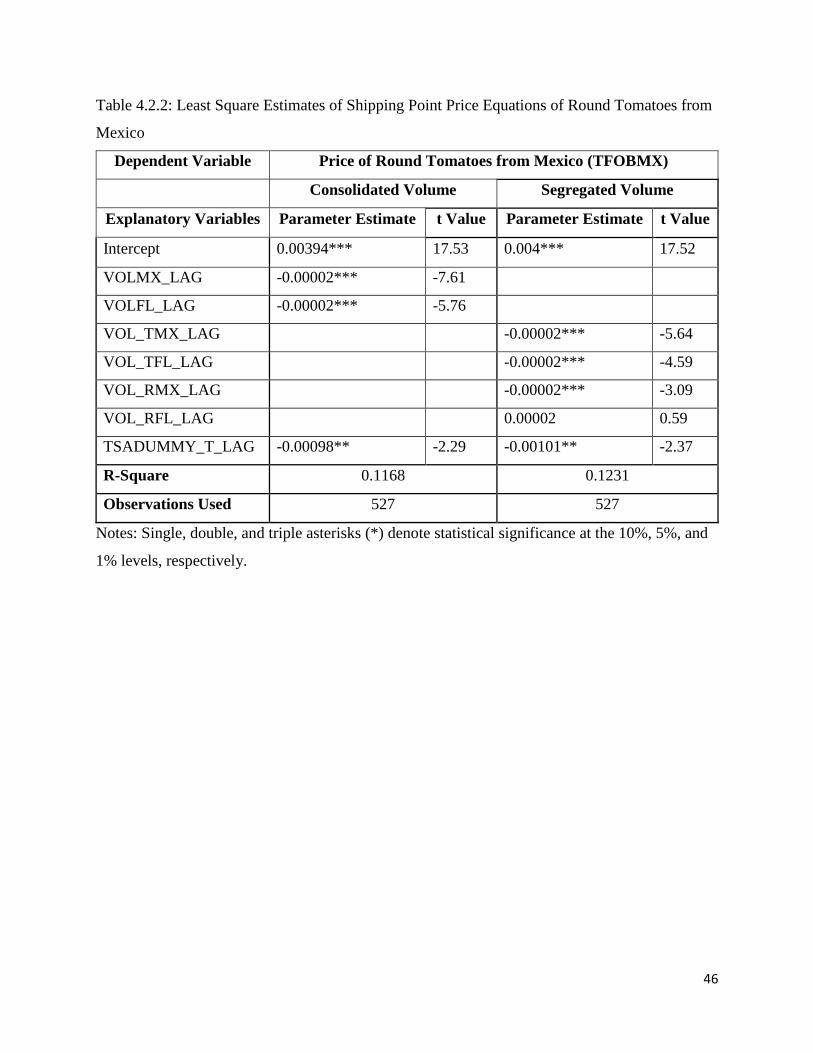
Table 4.2.2: Least Square Estimates of Shipping Point Price Equations of Round Tomatoes from
Mexico
Dependent Variable Price of Round Tomatoes from Mexico (TFOBMX)
Consolidated Volume Segregated Volume
Explanatory Variables Parameter Estimate t Value Parameter Estimate t Value
Intercept 0.00394*** 17.53 0.004*** 17.52
VOLMX_LAG -0.00002*** -7.61
VOLFL_LAG -0.00002*** -5.76
VOL_TMX_LAG -0.00002*** -5.64
VOL_TFL_LAG -0.00002*** -4.59
VOL_RMX_LAG -0.00002*** -3.09
VOL_RFL_LAG 0.00002 0.59
TSADUMMY_T_LAG -0.00098** -2.29 -0.00101** -2.37
R-Square 0.1168 0.1231
Observations Used 527 527
Notes: Single, double, and triple asterisks (*) denote statistical significance at the 10%, 5%, and
1% levels, respectively.

47
Table 4.2.3: Least Square Estimates of Shipping Point Price Equations of Plum Tomatoes from
Florida
Dependent Variable Price of Plum Tomatoes from Florida (RFOBFL)
Consolidated Volume Equation Segregated Volume Equation
Explanatory Variables Parameter Estimate t Value Parameter Estimate t Value
Intercept 0.00337*** 22.00 0.00335*** 21.82
VOLMX_LAG -0.00001*** -5.59
VOLFL_LAG -0.00002*** -7.56
VOL_TMX_LAG -0.00001** -2.44
VOL_TFL_LAG -0.00002*** -4.71
VOL_RMX_LAG -0.00002*** -4.03
VOL_RFL_LAG -0.00003 -1.49
TSADUMMY_R_LAG -0.00039*** -4.99 -0.00046*** -5.42
R-Square 0.1633 0.1702
Observations Used 539 539
Notes: Single, double, and triple asterisks (*) denote statistical significance at the 10%, 5%, and
1% levels, respectively.

48
Table 4.2.4: Least Square Estimates of Shipping Point Price Equations of Round Tomatoes from
Florida
Dependent Variable Price of Round Tomatoes from Florida (TFOBFL)
Consolidated Volume Equation Segregated Volume Equation
Explanatory Variables Parameter Estimate t Value Parameter Estimate t Value
Intercept 0.00317*** 18.29 0.00317*** 18.13
VOLMX_LAG 0.000001 0.78
VOLFL_LAG -0.00003*** -11.56
VOL_TMX_LAG -0.000003 -1.02
VOL_TFL_LAG -0.00003*** -7.32
VOL_RMX_LAG 0.00001* 1.90
VOL_RFL_LAG -0.00003 -1.27
TSADUMMY_T_LAG -0.00077** -2.15 -0.00079** -2.21
R-Square 0.2508 0.258
Observations Used 543 543
Notes: Single, double, and triple asterisks (*) denote statistical significance at the 10%, 5%, and
1% levels, respectively.
Results of volumes of both Mexico and Florida in all equations with consolidated volumes, [(13)
to (16)], show negative and statistically significant parameter estimates as expected; except for
volume of Mexican tomatoes on shipping point prices of round tomatoes from Florida, whose
coefficient is positive and has no statistical significance. In addition, results of the segregated
volume equation for round tomatoes from Florida, show that volume from round and plum
tomatoes from Mexico are not statistically significant and positive signed respectively (table
4.2.4). These results suggest that Mexican tomatoes volume has no influence on the prices of
round tomatoes from Florida.
The parameter estimates of plum tomatoes from Florida volume are not statistically significant
for shipping point prices of Mexican round tomatoes, and Floridian round and plum tomatoes;
Mexican plum tomatoes, however, show a positive sign and is statistically significant. A possible
explanation for the lack of statistical significance in these results is the amount of plum tomatoes

49
that Florida introduces to the U.S. market which in average is 3.3 million pounds per week (table
3.2.3) equivalent only to 12% of all the tomato volume from Florida. As for the statistically
significance and positive sign on the results for plum tomatoes from Mexico, a possible theory is
that the volume produced by Florida is not enough to cover the market demand (trading
relationships), therefore creating demand for plum tomatoes from Mexico, in order to
corroborate this theory further investigation needs to be done.
Parameter estimates of tomato volumes of plum and round tomatoes from Mexico, and round
tomatoes from Florida for all segregated volume equations [(17) to (20)] are negative and
statistically significant as previously expected (tables 4.2.1, 4.2.2, 4.2.3, and 4.2.4).
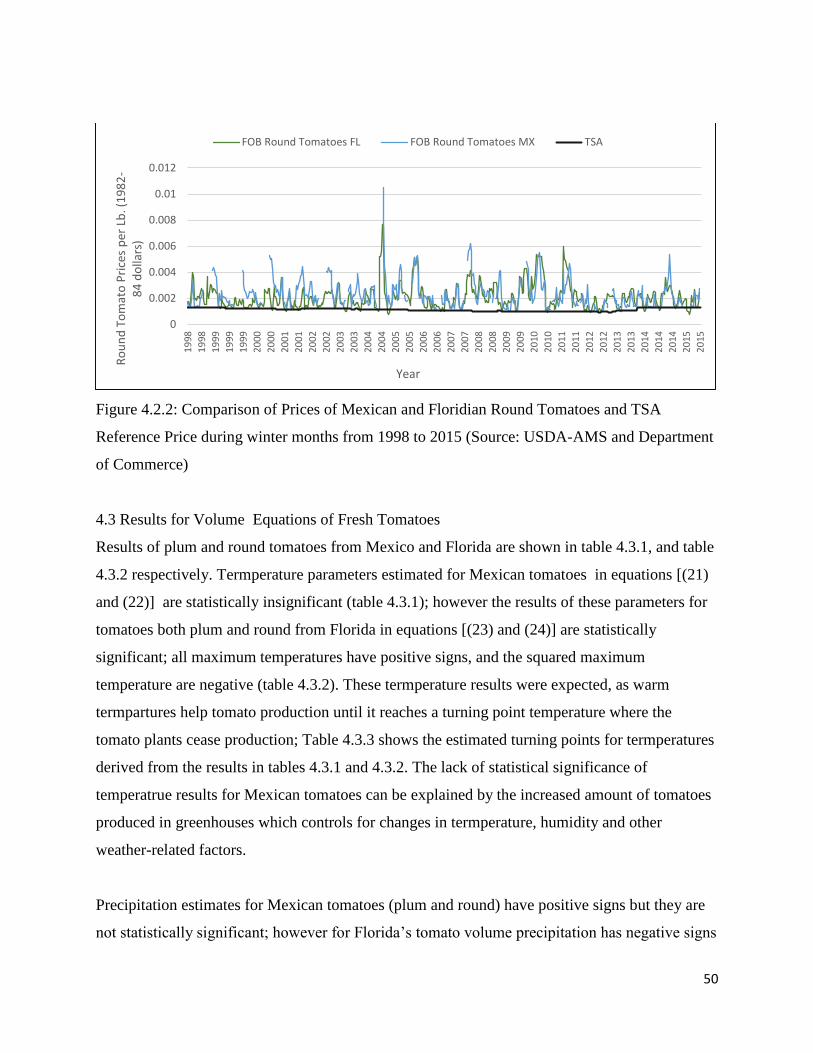
The results of the TSA indicator for all tomatoes of both Florida and Mexico in both
consolidated and segregated volume equations [(13) to (20)] are negative and statistically
significant. These results suggest that having a reference price affects negatively the prices of all
tomatoes in the market independently of their origin. Figures 4.2.1 and 4.2.2 show a comparison
of weekly prices of Mexico and Florida tomatoes and TSA reference price during the winter
months of 1998 to 2015 where it can be seen similar behaviors of f.o.b. prices for the two
regions.
Figure 4.2.1: Comparison of Prices of Mexican and Floridian Plum Tomatoes and TSA
Reference Price during winter months from 1998 to 2015. (Source: USDA-AMS and Department
of Commerce)
0
0.001
0.002
0.003
0.004
0.005
0.006
0.007
0.008
0.009
19
98
19
98
19
99
19
99
19
99
20
00
20
00
20
01
20
01
20
02
20
02
20
03
20
03
20
04
20
04
20
05
20
05
20
06
20
06
20
07
20
07
20
08
20
08
20
09
20
09
20
10
20
10
20
11
20
11
20
12
20
12
20
13
20
13
20
14
20
14
20
14
20
15
20
15
Plu
m T
om
ato
Pri
ces
per
Lb
. (1
98
2-8
4
do
llars
)
Year
FOB Plum Tomatoes FL FOB Plum Tomatoes MX TSA
50
Figure 4.2.2: Comparison of Prices of Mexican and Floridian Round Tomatoes and TSA
Reference Price during winter months from 1998 to 2015 (Source: USDA-AMS and Department
of Commerce)
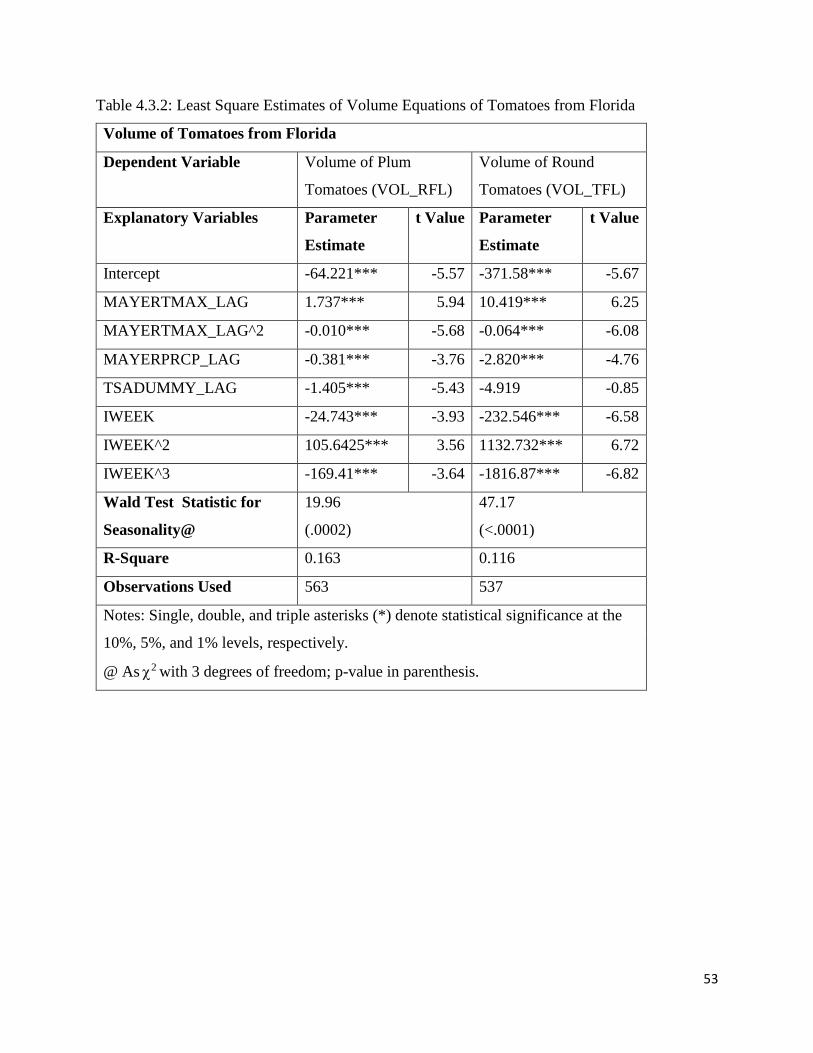
4.3 Results for Volume Equations of Fresh Tomatoes
Results of plum and round tomatoes from Mexico and Florida are shown in table 4.3.1, and table
4.3.2 respectively. Termperature parameters estimated for Mexican tomatoes in equations [(21)
and (22)] are statistically insignificant (table 4.3.1); however the results of these parameters for
tomatoes both plum and round from Florida in equations [(23) and (24)] are statistically
significant; all maximum temperatures have positive signs, and the squared maximum
temperature are negative (table 4.3.2). These termperature results were expected, as warm
termpartures help tomato production until it reaches a turning point temperature where the
tomato plants cease production; Table 4.3.3 shows the estimated turning points for termperatures
derived from the results in tables 4.3.1 and 4.3.2. The lack of statistical significance of
temperatrue results for Mexican tomatoes can be explained by the increased amount of tomatoes
produced in greenhouses which controls for changes in termperature, humidity and other
weather-related factors.
Precipitation estimates for Mexican tomatoes (plum and round) have positive signs but they are
not statistically significant; however for Florida’s tomato volume precipitation has negative signs
0
0.002
0.004
0.006
0.008
0.01
0.012
19
98
19
98
19
99
19
99
19
99
20
00
20
00
20
01
20
01
20
02
20
02
20
03
20
03
20
04
20
04
20
05
20
05
20
06
20
06
20
07
20
07
20
08
20
08
20
09
20
09
20
10
20
10
20
11
20
11
20
12
20
12
20
13
20
13
20
14
20
14
20
14
20
15
20
15
Ro
un
d T
om
ato
Pri
ces
per
Lb
. (1
98
2-
84
do
llars
)
Year
FOB Round Tomatoes FL FOB Round Tomatoes MX TSA

51
and is statistically significant (tables 4.3.1, and 4.3.2); these results are not surprising, as
precipitation levels at the Culiacan weather station on average are 0.26 in per week compared to
Ft. Meyer weather station that has an average of 1.07 in per week (see table 3.2.3). In addition,
Florida’s production of tomatoes is on open fields and the quality of the tomatoes could be
affected by rain in the area shrinking the volume of tomatoes from Florida.
The TSA indicator coefficients were expected to have positive signs for volumes of tomatoes
from Florida independently of their type, and negative signs for Mexican tomatoes, both plum
and round. Contrary to what was expected the results show negative TSA indicator’s signs for all
tomatoes (plum and round, from both Mexico and Florida); additionally the TSA indicator
coeficients for plum tomatoes from Mexico and Florida were statistically significant while the
coeficients for round tomatoes from both Mexico and Florida were not. These results suggest
that the volume of plum tomatoes from Mexico and Florida react in the same way to lower prices
by suppresing their plum tomato volume in the U.S. market, even though the TSA only binds the
sales of tomatoes from Mexico.

52
Table 4.3.1: Least Square Estimates of Volume Equations of Tomatoes from Mexico
Volume of Tomatoes from Mexico
Dependent Variable Volume of Plum
Tomatoes (VOL_RMX)
Volume of Round
Tomatoes (VOL_TMX)
Explanatory Variables Parameter
Estimate
t Value Parameter
Estimate
t Value
Intercept -47.515 -0.7 -19.532 -0.27
CULTMAX_LAG 1.199 0.79 0.856 0.52
CULTMAX_LAG^2 -0.005 -0.6 -0.004 -0.45
CULPRCP_LAG -1.169 -0.81 0.632 0.41
TSADUMMY_LAG -2.069** -2.1 -3.812 -1.15
IWEEK 123.138*** 5.94 290.853*** 13.23
IWEEK^2 -578.563*** -5.97 -1375.53*** -13.31
IWEEK^3 746.515*** 4.96 1872.398*** 11.48
Wald Test Statistic for
Seasonality@
112.13
(<.0001)
406.13
(<.0001)
R-Square 0.2546 0.6266
Observations Used 448 430
Notes: Single, double, and triple asterisks (*) denote statistical significance at the
10%, 5%, and 1% levels, respectively.
@ As 2 with 3 degrees of freedom; p-value in parenthesis.
53
Table 4.3.2: Least Square Estimates of Volume Equations of Tomatoes from Florida
Volume of Tomatoes from Florida
Dependent Variable Volume of Plum
Tomatoes (VOL_RFL)
Volume of Round
Tomatoes (VOL_TFL)
Explanatory Variables Parameter
Estimate
t Value Parameter
Estimate
t Value
Intercept -64.221*** -5.57 -371.58*** -5.67
MAYERTMAX_LAG 1.737*** 5.94 10.419*** 6.25
MAYERTMAX_LAG^2 -0.010*** -5.68 -0.064*** -6.08
MAYERPRCP_LAG -0.381*** -3.76 -2.820*** -4.76
TSADUMMY_LAG -1.405*** -5.43 -4.919 -0.85
IWEEK -24.743*** -3.93 -232.546*** -6.58
IWEEK^2 105.6425*** 3.56 1132.732*** 6.72
IWEEK^3 -169.41*** -3.64 -1816.87*** -6.82
Wald Test Statistic for
Seasonality@
19.96
(.0002)
47.17
(<.0001)
R-Square 0.163 0.116
Observations Used 563 537
Notes: Single, double, and triple asterisks (*) denote statistical significance at the
10%, 5%, and 1% levels, respectively.
@ As 2 with 3 degrees of freedom; p-value in parenthesis.

54
Table 4.3.3 Estimated Maximum Temperature Turning Points for Tomato Shipments
Dependent Variable Temperature Turning point
Plum Tomatoes from Mexico (VOL_RMX)* 119.9°F
Round Tomatoes from Mexico (VOL_TMX)* 107°F
Plum Tomatoes from Florida (VOL_RFL) 86.85°F
Round Tomatoes from Florida (VOL_TFL) 81.40°F
*Values of estimates are not statistically significant.
All of the results of seasonality estimates (IWEEK) were statistically significant. In order to
corroborate the significance of the results a joint test (Wald test) for seasonality was performed,
where the null hypothesis states that α1=0, α2=0, and α3=0 in each of the equations (21) to (24).
All of the results from the joint test show that there is seasonality in the volume availability of
tomatoes in the U.S. market (results of the joint test are in tables 4.3.1 and 4.3.2). The estimated
seasonality for Mexican and Floridian tomatoes are showed in figures 4.3.1, and 4.3.2
respectively.
Figure 4.3.1 Volume of plum and round tomatoes from Mexico plotted against IWEEKS using
parameters of IWEEK, IWEEK^2, and IWEEK^3 from table 4.3.1
-15
-10
-5
0
5
10
15
20
25
44 45 46 47 48 49 50 51 52 53 1 2 3 4 5 6 7 8 9 10 11 12 13 14 15 16 17 18 19 20 21 22 23 24 25 261 m
illio
n lb
s u
nit
s
Week of the year
Estimated Seasonality of Mexican Tomato Shipments
Mexico Plum tomatoes Mexico Round Tomatoes

55
Figure 4.3.2 Volume of plum and round tomatoes from Florida plotted against IWEEKS using
parameters of IWEEK, IWEEK^2, and IWEEK^3 from table 4.3.2
-8
-6
-4
-2
0
2
4
6
8
44 45 46 47 48 49 50 51 52 53 1 2 3 4 5 6 7 8 9 10 11 12 13 14 15 16 17 18 19 20 21 22 23 24 25 26
1 m
illio
n lb
s u
nit
s
Week of the year
Estimated Seasonality of Tomato Shipments from Florida
Florida Plum Tomatoes Florida Round Tomatoes

56
Chapter 5: Conclusion
5.1 Conclusions
Tomatoes from Mexico have had a long trade relationship with the United States, and this
relation has been full of controversy and disputes. Florida tomato growers have often accused
Mexican growers and shippers of flooding the tomato market during the winter months, the main
market window for tomatoes from Florida, and lowering prices.
This study shows, as expected, that volumes affect prices both at terminal markets and at
shipping points. However, volume of tomatoes from Mexico do not have any influence on prices
of round tomatoes from Florida at its main markets (New York, and Chicago terminal markets).
Additionally, F.O.B. prices of round tomatoes from Florida are affected by their own volumes;
Mexican tomatoes are not statistically significant when quoting prices of Floridian round
tomatoes at the shipping point. These findings contradict the frequent accusations of Mexican
tomatoes flooding the market by dumping tomatoes and lowering prices.
Additionally, the results of this study suggest that moving tomato production into greenhouses in
Mexico has given Mexican growers a competitive advantage over Florida growers by controlling
temperature changes and other weather-related factors that can decimate tomato production.
This research, in like manner, found that the floor prices of the Tomato Suspension Agreement
have the same effects on tomatoes from Florida and tomatoes from Mexico for both quoting
shipping point prices and volume behavior of plum and round tomatoes. This suggests that the
measure requested by Florida tomato growers at the Tomato Suspension Agreement affects the
tomato market for all tomatoes independently from their origin.
57
References
Agricultural Marketing Services, Market News, United States Department of Agriculture
https://www.marketnews.usda.gov/mnp/fv-home
Agricultural Marketing Services, Marketing Orders and Agreements, United States Department
of Agriculture
http://www.ams.usda.gov/AMSv1.0/ams.fetchTemplateData.do?template=TemplateN&p
age=CommoditiesCoveredUnderSection8e
Ames, Glen C.W., Jeffrey H. Dorfman, and Elisa Soares (1996). Price Analysis of Mexican
Tomato Imports: Are Antidumping Duties Warranted? Tri-National Research
Symposium, NAFTA and Agriculture: Is the Experiment Working? (1996).
http://agrinet.tamu.edu/trade/papers/tomatoes.pdf
Amizkuzno, Joseph and Samuel A. Donkoh (2012). Border Effects of Spatial Price Transmission
between Fresh Tomato Markets in Ghana and Burkina-Faso: Any Case for Promotion
Trans-Border Trade in West Africa? Selected Paper prepared for presentation at the
International Association of Agricultural Economists (IAAE) Triennial Conference, Foz
do Iguaçu, Brazil (2012).
Asci, Serhat, John J. VanSickle, and Dan Cantliffe (2013). The Potential for Greenhouse Tomato
Production Expansion in Florida – Selected Paper prepared for presentation at the
Southern Agricultural Economics Association (SAEA) Annual Meeting, Orlando, FL
(February 2013). http://ageconsearch.umn.edu/bitstream/143095/2/SAEA-2013-
The%20Potential%20for%20Greenhouse%20Tomato%20Production%20Expansion%20i
n%20Florida.pdf
Boriss, Hayley, and Henrich Brunke (2005). Commodity Profile: Tomatoes, fresh market.
Agricultural Issues Center, University of California. Agricultural Marketing Resource
Center (October 2005). http://aic.ucdavis.edu/profiles/FreshTomatoes-2005.pdf
Bureau of Labor Statistics, Consumer Price Index, United States Department of Labor. CPI
Databases. https://www.bls.gov/cpi/data.htm
Cook, Roberta (2014). Fresh Tomato Trends in the N. American Market. Department of
Agriculture and Resource Economics – University of California Davis for America
Trades Produce Conference at Tubac, AZ (March 13, 2014).

58
http://arefiles.ucdavis.edu/uploads/filer_public/2014/05/19/fpaacooktomatofinal140313.p
df
Cook, Roberta, and Linda Calvin (2005). Greenhouse Tomatoes Changes the Dynamics of the
North American Fresh Tomato Industry. United States Department of Agriculture –
Economic Research Service. Economic Research Report No. (ERR-2) 86 pp, April 2005.
https://www.ers.usda.gov/webdocs/publications/err2/15309_err2_1_.pdf
Department of Commerce. Suspension of Antidumping Investigation: Fresh Tomatoes from
Mexico (March 4, 2013). http://enforcement.trade.gov/tomato/2013-
agreement/documents/Mexico-Tomatoes-Agreement-20130304.pdf
Department of Commerce. Suspension of Antidumping Investigation: Fresh Tomatoes from
Mexico. Weight Charts (March 4, 2013). http://enforcement.trade.gov/tomato/2013-
agreement/documents/20130304-Box-Weight-Charts.pdf
Diaz Belmontes, Alfredo (2015). Horticultura Protegida en México – Retos, Amenazas
Perspectivas. Asociación Mexicana de Horticultura Protegida (AMHPAC), November
09, 2015. http://www.amhpac.org/es/index.php/descargas/item/situacion-actual-de-la-
industria-de-agricultura-protegida
Economic Research Service, United States Department of Agriculture. Fresh Tomato Industry
(February 03, 2016). http://www.ers.usda.gov/topics/crops/vegetables-
pulses/tomatoes.aspx
Economic Research Service, United States Department of Agriculture. Greenhouse Tomatoes
Change the Dynamics of the North American Fresh Tomato Industry / ERR-2.
http://www.ers.usda.gov/media/307185/err2d_1_.pdf
Florida Department of Agriculture and Consumer Services. Florida Agriculture by the Numbers
(2011).
https://www.nass.usda.gov/Statistics_by_State/Florida/Publications/Annual_Statistical_B
ulletin/FL_Agriculture_Book/2011/2011%20FL%20Ag%20by%20the%20Numbers.pdf
Florida Tomato Committee. https://www.floridatomatoes.org/
Flores, Dulce, and Joe Lopez (2015). Mexico, Tomato Annual, Mexican Tomato Production Up
Slightly. United States Department of Agriculture – Foreign Agricultural Service - Global
Agricultural Information Network. GAIN Report Number: MX5024 (June 8, 2015).

59
http://gain.fas.usda.gov/Recent%20GAIN%20Publications/Tomato%20Annual_Mexico
%20City_Mexico_6-8-2015.pdf
International Trade Administration, Enforcement and Compliance, United States Department of
Commerce. Fresh Tomatoes from Mexico: Suspension Agreement (March 07, 2011).
http://ia.ita.doc.gov/tomato/
LeStrange, Michelle, Wayne L. Schrader, and Timothy K. Hartz (2000). Fresh-Market Tomato
Production in California, University of California, Division of Agriculture and Natural
Resources, Publication 8017. http://anrcatalog.ucanr.edu/pdf/8017.pdf
National Agricultural Statistics Service, Florida Field Office, United States Department of
Agriculture. 2016 Annual Statistical Bulletin – Vegetables Melons and Berries.
https://www.nass.usda.gov/Statistics_by_State/Florida/Publications/Annual_Statistical_B
ulletin/2016/E1thru18Veg-2016.pdf
National Institute of Food and Agriculture, United States Department of Agriculture. Crop
Profile for Tomatoes in Florida (2006).
https://ipmdata.ipmcenters.org/documents/cropprofiles/FLtomatoes.pdf
National Oceanic and Atmospheric Administration (NOAA) – National Centers for
Environmental Information. https://www.ncdc.noaa.gov/cdo-web/search
Padilla-Bernal, Luz, and Dawn D. Thilmany (2000). Mexican-U.S. Fresh Tomato Trade: An
Analysis of Volume, Prices and Transaction Costs. WAEA meetings in Vancouver, BC
(July 2000).
Padilla-Bernal, Luz, Dawn D. Thilmany, and Maria L. Loureiro (2003). An Empirical Analysis
of Market Integration and Efficiency for U.S. Fresh Tomato Markets. Journal of
Agricultural and Resource Economics, Vol. 28, No. 3 (December 2003), pp. 435-450.
Palma, Marco, Flynn Adcock, Parr Rosson, and Daniel Hanselka (2013). Economic Impacts of
Increased U.S. Imports of Fresh Produce from Mexico by 2020 – CNAS Issue Brief
2013-04. Department of Agricultural Economics, Texas A&M University/Texas A&M
AgriLife Extension Service/ Texas A&M AgriLife Research (September 2013).
Rudman, Judy, and Bryan Wright (2013). Tomato Suspension Agreement Explained as
Amended March 4, 2013. USDA AMS Fruit and Vegetable Program and USDOC ITA
Import Administration (2013).
http://www.ams.usda.gov/AMSv1.0/getfile?dDocName=STELPRDC5103314

60
Thompson, Gary D., Satheesh V. Aradhyula, and Russell Tronstad (2005). Modeling Florida
Fresh Tomato Supply Response: Composite Switching Regressions with Variable
Weather-Determined Lags. American Agricultural Economics Association (2005).
United States Energy Information Administration (EIA).
http://www.eia.gov/beta/MER/index.cfm?tbl=T09.04#/?f=M
Ward, Ronald W. (1982). Asymmetry in Retail, Wholesale, and Shipping Point Pricing for Fresh
Vegetables. American Journal of Agricultural Economics, Vol. 64, No. 2 pp. 205- 212
(May, 1982).