Tom Johnson Investment Management, LLC - tjim.com Income Fact Sheet.pdf · Tom Johnson Investment...
3
201 Robert S. Kerr, Suite 510|Oklahoma City, OK 73102|P: 405‐236‐2111 F: 405‐236‐2008|www.tjim.com TJIM has a conservative philosophy for investing client assets. TJIM believes that attractive risk‐adjusted performance is best achieved by building a pru‐ dent, well‐diversified, high‐quality portfolio that addresses capital preserva‐ tion and risk. TJIM’s over‐riding goal is to provide good returns in up markets while protecting wealth when down markets inevitably occur, which should lead to outperformance over a full market cycle. TJIM Philosophy Tom Johnson Investment Management, LLC was founded in 1983 and is based in Oklahoma City, Oklahoma. TJIM’s investment team averages over 20 years of experi‐ ence. All of TJIM’s investment committee members are CFA Charterholders who collectively hold 5 MBA’s, 1 Ph.D., and one Financial Risk Manager (FRM) designation. TJIM’s team draws on the diverse knowledge and experience of each underlying mem‐ ber to provide the best investment decisions for client portfolios. TJIM manages all accounts as separate accounts with individual securities. Firm Overview TJIM Fixed Income Process Product Profile | Fixed Income Period Ending 03/31/18 TJIM’s fixed income strategies seek to tactically balance total return, income generation, liquidity and capital preservation. TJIM’s conservative investment approach invests in liquid, high‐quality bonds with an A or better rating at purchase. A combination of quantitative and qualitative analyses of fixed income markets identifies the most attractive sectors , maturities, and securities within TJIM’s fixed universe. These securities are then put through a rigorous fundamental review to determine credit worthiness. Attractive issues are combined into a portfolio that is optimized to perform in the anticipated environment. TJIM’s fixed income process is best thought of as a series of five levers . We adjust these levers based on the relative attractiveness of different risk factors in the bond market. Duration Lever ‐ Dynamically manage interest rate risk by varying duration from 75% to 125% of index level Sector Lever ‐ Strategically vary sector weights between treasuries, agencies & corporate bonds based on spread levels. Structure Lever ‐ Tactically position along the yield curve based on best risk/ reward maturities. Quality Lever ‐ Opportunistically invest in attractive credit instruments Yield Lever ‐ Maximize yield at the optimal position of the other four levers. The resultant portfolio is then continuously monitored and adjusted over time to exploit market overreactions and mispriced risk. Does Liquidity MaƩer? Liquidity risk is an often overlooked risk until it is too late and a client is stuck with unmarketable securities. TJIM seeks to minimize liquidity risk by limiting investment to the most liquid sectors of the fixed income markets, and avoid‐ ing less liquid issue types. TJIM doesn’t invest in MBS or ABS securities due to their impaired liquidity as they pay down. TJIM also limits their corporate universe to 500MM or larger issue size to ensure deep and liquid markets. Why A or beƩer? Investment grade corporate bonds typically take the largest price hit when down‐graded below investment grade. A or better gives a three notch cushion to evaluate whether to sell a deteriorating credit. Additionally, it typically takes over 30 Baa/BBB rated bonds to properly naively diversify which can create liquidity issues for individual separately managed accounts. TJIM Fixed InformaƟon Investment Style Total return—utilizing high‐quality individual bonds Investment Approach Combination of top‐down macro analysis coupled with bottom‐up fundamental research Benchmark Barclays Government Credit Index Sectors Treasuries, agencies, investment grade corporate bonds Duration range Approximately 4 to 7.5 years Restrictive policies A or better quality at purchase Inception date 1/1/1984 Portfolio Managers Richard Parry, CFA, Doug Haws, CFA, Cory Robinson, CFA, FRM, Nick Pointer, CFA Steve Schenk, CFA, Ned Schrems, CFA, Ph.D. 125% 100% 75% Long Bullet Barbell Ladder Medium Bullet Aaa Aa A TJIM Policy of A or better Treasury Agency Corporate 200% 100% Duration Structure Quality Sector Yield Tom Johnson Investment Management, LLC
Transcript of Tom Johnson Investment Management, LLC - tjim.com Income Fact Sheet.pdf · Tom Johnson Investment...
201 Robert S. Kerr, Suite 510|Oklahoma City, OK 73102|P: 405‐236‐2111 F: 405‐236‐2008|www.tjim.com
TJIM has a conservative philosophy for investing client assets. TJIM believes that attractive risk‐adjusted performance is best achieved by building a pru‐dent, well‐diversified, high‐quality portfolio that addresses capital preserva‐tion and risk. TJIM’s over‐riding goal is to provide good returns in up markets while protecting wealth when down markets inevitably occur, which should lead to outperformance over a full market cycle.
TJIM Philosophy Tom Johnson Investment Management, LLC was founded in 1983 and is based in Oklahoma City, Oklahoma. TJIM’s investment team averages over 20 years of experi‐ence. All of TJIM’s investment committee members are CFA Charterholders who collectively hold 5 MBA’s, 1 Ph.D., and one Financial Risk Manager (FRM) designation. TJIM’s team draws on the diverse knowledge and experience of each underlying mem‐ber to provide the best investment decisions for client portfolios. TJIM manages all accounts as separate accounts with individual securities.
Firm Overview
TJIM Fixed Income Process
Product Profile | Fixed Income
Period Ending 03/31/18
TJIM’s fixed income strategies seek to tactically balance total return, income generation, liquidity and capital preservation. TJIM’s conservative investment approach invests in liquid, high‐quality bonds with an A or better rating at purchase. A combination of quantitative and qualitative analyses of fixed income markets identifies the most attractive sectors , maturities, and securities within TJIM’s fixed universe. These securities are then put through a rigorous fundamental review to determine credit worthiness. Attractive issues are combined into a portfolio that is optimized to perform in the anticipated environment.
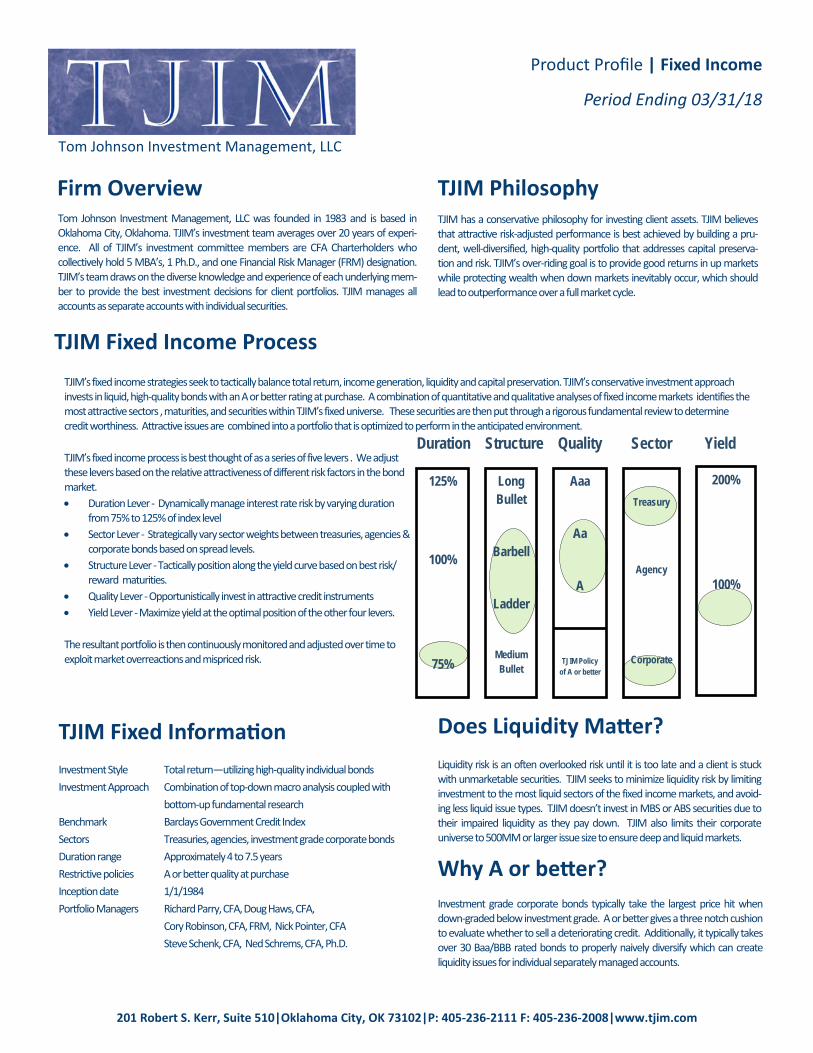
TJIM’s fixed income process is best thought of as a series of five levers . We adjust these levers based on the relative attractiveness of different risk factors in the bond market.
Duration Lever ‐ Dynamically manage interest rate risk by varying duration from 75% to 125% of index level
Sector Lever ‐ Strategically vary sector weights between treasuries, agencies & corporate bonds based on spread levels.
Structure Lever ‐ Tactically position along the yield curve based on best risk/ reward maturities.
Quality Lever ‐ Opportunistically invest in attractive credit instruments
Yield Lever ‐ Maximize yield at the optimal position of the other four levers.
The resultant portfolio is then continuously monitored and adjusted over time to exploit market overreactions and mispriced risk.
Does Liquidity Ma er?
Liquidity risk is an often overlooked risk until it is too late and a client is stuck with unmarketable securities. TJIM seeks to minimize liquidity risk by limiting investment to the most liquid sectors of the fixed income markets, and avoid‐ing less liquid issue types. TJIM doesn’t invest in MBS or ABS securities due to their impaired liquidity as they pay down. TJIM also limits their corporate universe to 500MM or larger issue size to ensure deep and liquid markets.
Why A or be er?
Investment grade corporate bonds typically take the largest price hit when down‐graded below investment grade. A or better gives a three notch cushion to evaluate whether to sell a deteriorating credit. Additionally, it typically takes over 30 Baa/BBB rated bonds to properly naively diversify which can create liquidity issues for individual separately managed accounts.
TJIM Fixed Informa on
Investment Style Total return—utilizing high‐quality individual bonds
Investment Approach Combination of top‐down macro analysis coupled with
bottom‐up fundamental research
Benchmark Barclays Government Credit Index
Sectors Treasuries, agencies, investment grade corporate bonds
Duration range Approximately 4 to 7.5 years
Restrictive policies A or better quality at purchase
Inception date 1/1/1984
Portfolio Managers Richard Parry, CFA, Doug Haws, CFA,
Cory Robinson, CFA, FRM, Nick Pointer, CFA
Steve Schenk, CFA, Ned Schrems, CFA, Ph.D.
125%
100%
75%
Long Bullet
Barbell
Ladder
Medium Bullet
Aaa
Aa
A
TJIM Policy of A or better
Treasury
Agency
Corporate
200%
100%
Duration Structure Quality Sector Yield
Tom Johnson Investment Management, LLC
201 Robert S. Kerr, Suite 510|Oklahoma City, OK 73102|P: 405‐236‐2111 F: 405‐236‐2008|www.tjim.com
TJIM Fixed BGC Modified Duration 4.95 6.56 Yield to Worst 2.97% 3.04% Current Yield 2.60% 2.88% Wtd. Avg. Maturity 5.59 8.93 Wtd. Avg. Price 98.40 100.71 Avg. Quality A/AA Aa2/Aa1
Por olio Characteris cs Top 10 Holdings
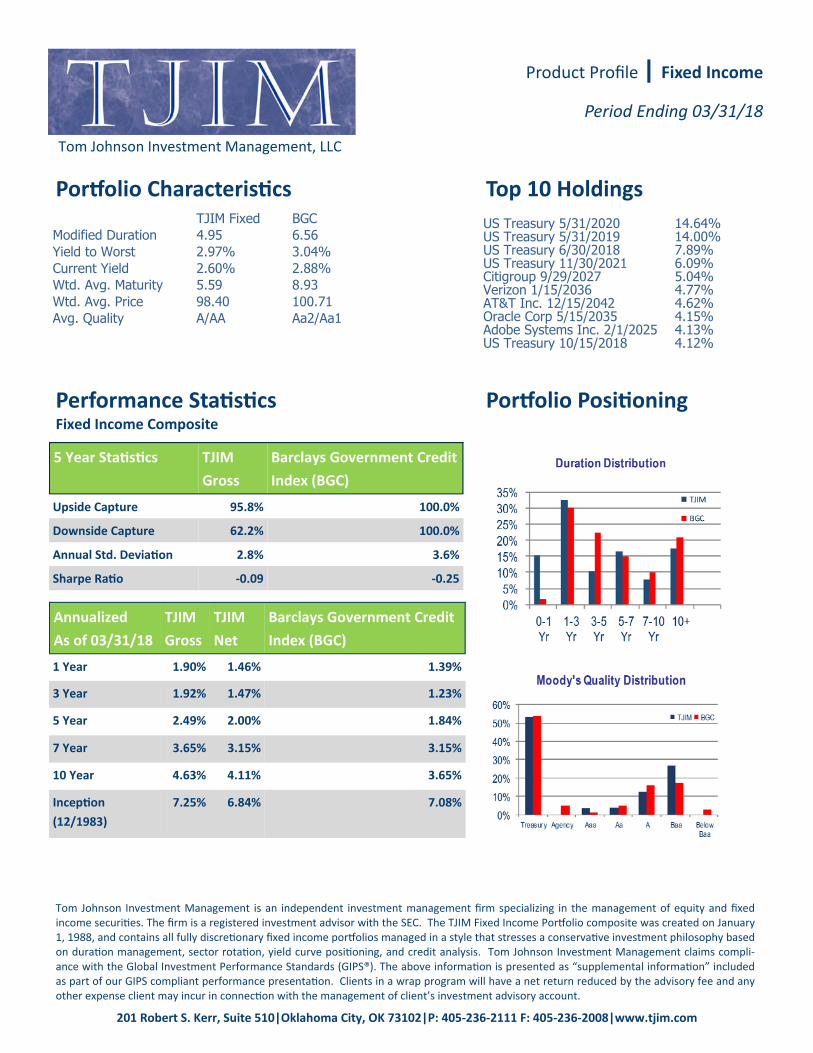
Por olio Posi oning Performance Sta s cs Fixed Income Composite
Product Profile | Fixed Income
Period Ending 03/31/18
US Treasury 5/31/2020 14.64% US Treasury 5/31/2019 14.00% US Treasury 6/30/2018 7.89% US Treasury 11/30/2021 6.09% Citigroup 9/29/2027 5.04% Verizon 1/15/2036 4.77% AT&T Inc. 12/15/2042 4.62% Oracle Corp 5/15/2035 4.15% Adobe Systems Inc. 2/1/2025 4.13% US Treasury 10/15/2018 4.12%
5 Year Sta s cs TJIM
Gross
Barclays Government Credit
Index (BGC)
Upside Capture 95.8% 100.0%
Downside Capture 62.2% 100.0%
Annual Std. Devia on 2.8% 3.6%
Sharpe Ra o ‐0.09 ‐0.25
Annualized
As of 03/31/18
TJIM
Gross
TJIM
Net
Barclays Government Credit
Index (BGC)
1 Year 1.90% 1.46% 1.39%
3 Year 1.92% 1.47% 1.23%
5 Year 2.49% 2.00% 1.84%
7 Year 3.65% 3.15% 3.15%
10 Year 4.63% 4.11% 3.65%
Incep on
(12/1983)
7.25% 6.84% 7.08%
Tom Johnson Investment Management is an independent investment management firm specializing in the management of equity and fixed income securi es. The firm is a registered investment advisor with the SEC. The TJIM Fixed Income Por olio composite was created on January 1, 1988, and contains all fully discre onary fixed income por olios managed in a style that stresses a conserva ve investment philosophy based on dura on management, sector rota on, yield curve posi oning, and credit analysis. Tom Johnson Investment Management claims compli‐ance with the Global Investment Performance Standards (GIPS®). The above informa on is presented as “supplemental informa on” included as part of our GIPS compliant performance presenta on. Clients in a wrap program will have a net return reduced by the advisory fee and any other expense client may incur in connec on with the management of client’s investment advisory account.
Tom Johnson Investment Management, LLC
Tom Johnson Investment Management, LLC
Fixed Income PortfolioPerformance Disclosure
Tom Johnson Investment Management claims compliance with the Global Investment Performance Standards (GIPS®) and has prepared and presented this report in compliance with the GIPS standards. Tom Johnson Investment Management has been independently verified for the period January 1, 2003 to December 31, 2011. The verification report is available upon request. Verification assesses whether (1) the firm has complied with all the composite construction requirements of the GIPS standards on a firm-wide basis and (2) the firm’s policies and procedures are designed to calculate and present performance in compliance with the GIPS standards. Verification does not ensure the accuracy of any specific composite presentation.Firm InformationTom Johnson Investment Management is an independent investment management firm specializing in the management of equity and fixed income securities. The firm is a registered investment advisor with the SEC. Total Firm Assets above are presented per GIPS definition. Composite InformationThe TJIM Fixed Income Portfolio composite was created on January 1, 1988, and contains all fully discretionary fixed income portfolios managed in a style that stresses a conservative investment philosophy based on duration management, sector rotation, yield curve positioning, and credit analysis. This composite does not include wrap or model portfolios. TJIM provides model strategies to various sponsoring firms and does not manage those models on a discretionary basis. A complete list and description of firm composites is available upon request. BenchmarkThe Bloomberg Barclays Government/Credit (BGC) Index includes securities in the U.S. Government and Credit Indices. The BGC Index is an unmanaged index generally considered to be representative of fixed income market activity. This index does not take into account any fees or expenses associated with the management, purchase, and sale of the components of the index. Individuals cannot invest directly in this index.Performance CalculationsValuations and returns reflect the reinvestment of dividend and interest income and are computed and stated in U.S. dollars. Performance figures are presented gross of management fees and custodial fees but net of all trading expenses. Net-of-fees returns are calculated using actual management fees that were paid. TJIM’s standard fee schedule is 1% on the first $1,000,000, 0.75% on the next $4,000,000, 0.60% on the next $5,000,000, 0.50% on the next $15,000,000, 0.45% of the next $25,000,000, 0.40% of the next $50,000,000, over $100,000,000 is quoted upon request. Fees may be negotiated depending upon a variety of variables.Composite policy requires the temporary removal of any portfolio incurring a client initiated significant cash inflow or outflow of 50% or greater of portfolio assets. The temporary removal of such an account occurs at the beginning of the quarter in which the significant cash flow occurs and the account re-enters the composite at the beginning of the quarter after the cash flow or the beginning of the quarter after the account has achieved representativeness to the style portfolio. Prior to 10/01/08, while TJIM utilized Sungard, Modified Dietz was used without revaluation.Internal dispersion is calculated using the asset-weighted standard deviation of the annual gross returns of those portfolios that were included in the composite for the entire year. For those years when less than five portfolios were included in the composite for the full year, no dispersion measure is presented.Policies for valuing portfolios, calculating performance, and preparing compliant presentations are available upon request.Performance presented herein represents past performance and does not guarantee future results.There is no guarantee any investment or TJIM’s portfolios will meet their objectives. All investments involve the risk of loss as well as the potential for gains. Individual clients may realize different results due to differing circumstances. This information is not intended to constitute legal, tax, accounting or investment advice. No bank guarantee. Not FDIC insured. May lose value.
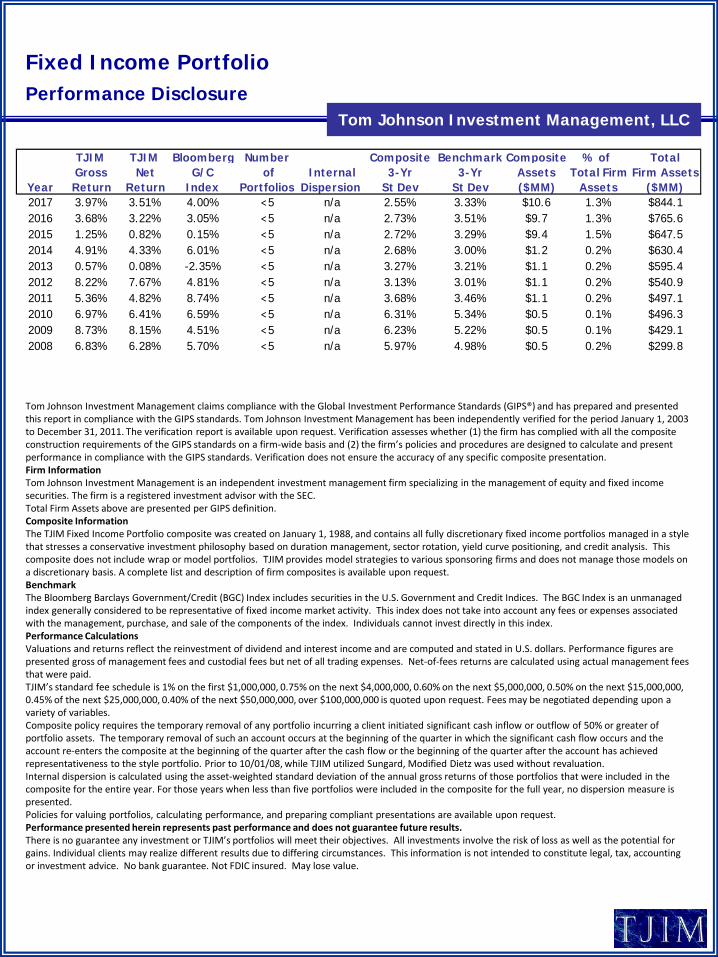
TJIM TJIM Bloomberg Number Composite Benchmark Composite % of TotalGross Net G/C of Internal 3-Yr 3-Yr Assets Total Firm Firm Assets
Year Return Return Index Portfolios Dispersion St Dev St Dev ($MM) Assets ($MM)2017 3.97% 3.51% 4.00% < 5 n/a 2.55% 3.33% $10.6 1.3% $844.12016 3.68% 3.22% 3.05% < 5 n/a 2.73% 3.51% $9.7 1.3% $765.62015 1.25% 0.82% 0.15% < 5 n/a 2.72% 3.29% $9.4 1.5% $647.52014 4.91% 4.33% 6.01% < 5 n/a 2.68% 3.00% $1.2 0.2% $630.42013 0.57% 0.08% -2.35% < 5 n/a 3.27% 3.21% $1.1 0.2% $595.42012 8.22% 7.67% 4.81% < 5 n/a 3.13% 3.01% $1.1 0.2% $540.92011 5.36% 4.82% 8.74% < 5 n/a 3.68% 3.46% $1.1 0.2% $497.12010 6.97% 6.41% 6.59% < 5 n/a 6.31% 5.34% $0.5 0.1% $496.32009 8.73% 8.15% 4.51% < 5 n/a 6.23% 5.22% $0.5 0.1% $429.12008 6.83% 6.28% 5.70% < 5 n/a 5.97% 4.98% $0.5 0.2% $299.8