Tokenism or Agency? The Impact of Women’s Reservations...
38
Tokenism or Agency? The Impact of Women’s Reservations on Panchayats in South India ∗ Timothy Besley London School of Economics Rohini Pande Yale University Vijayendra Rao World Bank Radu Ban London School of Economics September 2004 ∗ We are very grateful to the Research Committee and the South Asia Rural Unit of the World Bank for financial support. Additional budget support was provided by the World Bank Institute via a Dutch Government trust fund. Jillian Waid provided excellent research assistance. The views in this paper are exclusively those of the authors and not necessarily shared by the World Bank, or its member countries. 1
-
Upload
truongkien -
Category
Documents
-
view
221 -
download
4
Transcript of Tokenism or Agency? The Impact of Women’s Reservations...

Tokenism or Agency? The Impact of Women’sReservations on Panchayats in South India∗
Timothy BesleyLondon School of Economics
Rohini PandeYale University
Vijayendra RaoWorld Bank
Radu BanLondon School of Economics
September 2004
∗We are very grateful to the Research Committee and the South Asia Rural Unit ofthe World Bank for financial support. Additional budget support was provided by theWorld Bank Institute via a Dutch Government trust fund. Jillian Waid provided excellentresearch assistance. The views in this paper are exclusively those of the authors and notnecessarily shared by the World Bank, or its member countries.
1

1 Introduction
One of the most remarkable experiments in building inclusive democraticinstitutions has been the attempt to improve the representation of women inlocal government in India. The 73rd amendment to the Indian constitution,passed in 1992, mandated that no less than a third of the total number ofseats in village governments (panchayats), and no less than a third of theoffice of Chairperson of the panchayat should be reserved for women. Theaim of this was to ensure that women would have a voice in local governmentand, ultimately, help facilitate the formation of a more gender equal society.
There has been a lot of speculation, and some anecdotal evidence, onhow well this policy has worked. These can be classified into four broadcategories — we will label them “pessimistic” and “optimistic”:
Pessimistic:1) That women who stand for elections in reserved constituencies
would be tokens of powerful interests in the village. Poorly educated, elderlywomen from impoverished, easily manipulated, families would be picked byelites to run (e.g. Ramesh and Ali, 2001 [10]),
2) A variant of 1) saying that the women would instead be poorlyeducated but picked from the same wealthy, powerful families as the existingpolitical elite and would, therefore, serve the interest of the elite.
Optimistic:3) Effective, educated women would choose to run for elections, and
would serve to represent the interests and preferences of women.4) That women, because they are newcomers to the political process,
would be more enthusiastic and less corrupt and therefore more effectivethan entrenched male politicians. They would therefore generally improvethe quality of governance (e.g. Vyasulu and Vyasulu, 1999 [13])
Recent econometric work by Chattopadhyay and Duflo (2004b)[5] - hence-forth CD - looking at panchayats in West Bengal and Rajasthan examinedthese issues in some detail and found some evidence consistent with thethird hypothesis: Women leaders tend to invest more in goods where womenhave expressed a preference, and less in goods preferred by men. Specifi-cally, women leaders in West Bengal tend to invest more in water and roadprojects, and less in non-formal education,while in Rajasthan they investmore in water and less in roads. CD are able to identify the causal impactof reservations since they establish that reservation status is rotated amongall GPs on a random basis — which allows the reservation process to betreated as a randomized trial.
2

While CD’s results convincingly demonstrate the effectiveness of the pan-chayat reservations experiment, the results are restricted to two states, Ra-jasthan and West Bengal, of a very large and diverse country. These states,both from the north, are among the most male-biased in the country: Ra-jasthan ranks 21st and West Bengal 18th out of 24 states in a compositeindex of the status of women in India (Filmer, King and Pritchett 1998 [7]).Thus, a question remains of how applicable these results are to the rest ofthe country. One indicator of this is CD’s finding that women pradhans inreserved constituencies tend to be worse educated than pradhans (almost allmen) in unreserved constituencies, a fact that they attribute to the possi-ble existence of tokenism. This, however, begs the question of whether thisgender differential in education reflects patterns in the general populationor is a consequence of the reservations system. It also raises an importantsecondary question of whether the quality of pradhans matters more in re-served panchayats; do better educated women function more effectively aspradhans?
Another important issue, a major theme in the “action research” litera-ture, is the salience of local structures of inequality and power (e.g. Rai etal. 2001, Chp. 5 [9]) Villages dominated by powerful caste groups tend tobe much more dictatorial. Thus, when such villages are reserved for womenone expects that the pradhans would be more likely to be subservient toelites. This raises the question of whether local structures of oligarchy andinequality have more influence over women pradhans.
In this paper we examine the impact of women’s reservations in villagepanchayats in South India. The four southern states of Andhra Pradesh,Karnataka, Kerala and Tamil Nadu are interesting for two reasons:
First in contrast to West Bengal and Rajasthan, they have relatively lowgender disparities compared to the rest of the country — with Kerala rankedon the top of all major Indian states on the status of women index (Filmer,King, Pritchett 1998 [7]). Thus comparing the CD paper with these resultscould provide some valuable insights into how women’s reservations workswithin relatively more gender-equal societies.
Second the four states present an interesting comparison within them-selves in their approach to decentralization: Kerala and Karnataka havebeen among the leaders in promoting village democracy in India. Kar-nataka has had women’s reservations in place since 1959, and in 1983 itpassed landmark legislation giving panchayats a streamlined organizationalstructure that served as a model for the 73rd amendment. Kerala has hada more chequered history, but was one of the first states to adopt and im-plement the 73rd amendment. This has been followed by a commitment to
3

give panchayats meaningfully large budgets and the power and authority tomake decisions. Andhra Pradesh on the other hand, despite a long historyof panchayat legislation has not had regular elections. Moreover, since 1997the state government also instituted a system of “participatory governance”that served to undermine the authority of panchayats. Tamil Nadu, simi-larly, has instituted reforms from the 73rd amendment but without givingvillage panchayats much teeth with budgets and placing most of the deci-sion making at higher levels of government. The four states thus provide aninteresting contrast to study the impact of the 73rd amendment 1.
2 Data and Methodology
2.1 Sampling Strategy
Our sample consists of 523 villages in the four states and about 5000 house-holds within them. Details of the sampling strategy are available in Besleyet al (2004)[2]. We selected, using a strategy designed to control for path-dependencies and cultural factors while making state comparisons, two dis-tricts in AP — Medak and Chithoor, three in Karnataka — Bidar, Kolar andDakshin Kanada, two in Kerala — Kasargod and Palakkad, and two in TamilNadu — Dharmapuri and Coimbatore.
The blocks are divided into several Gram Panchayats (henceforth GPs)or village government units — each of which consist of between 1 and 6villages depending on the state. From each sampled block , in the states ofAP, KA and TN, we randomly sampled 6 GPs in every block. In Kerala thepopulation per GP is roughly double that in the other three states. For thisreason in Kerala we sampled 3 GPs in every block. This procedure gave atotal of 201 GPs. From these we selected a village sample. In AP, Karnatakaand Tamil Nadu we sampled all villages if the GP had 3 or fewer villages. Ifit had more than three villages, then we selected the pradhan’s village andrandomly selected two other villages. We excluded all villages with less than200 persons from our sampling frame. All hamlets with population over 200were considered as independent villages in drawing the sample. In Keralawe directly sampled wards instead of villages (as villages in Kerala tend tobe very large) — we sampled 6 wards per GP. This gave us a final villagesample size of 527 villages2. For sampled villages, any associated hamlets
1See (Matthew and Buch, 2000 [8]) for a detailed account of the history of panchayatsat the state level.
2The state-wise break up is AP: 69 villages, KA: 182 villages, KE: 126 wards; TN 129villages.
4
were also included as part of the sample.From every sampled block in AP, KA and TN we randomly selected 3
of our 6 sampled GPs and conducted household interviews in all sampledvillages falling in these GPs. In Kerala we randomly selected 2 GPs inone block and one GP in the other block (the selection of which block tosample how many GPs from was also random), and within sampled GPs weconducted household interviews in all sampled wards. Overall this gave usa final sample size of 5180 households3. Twenty households were sampledat random from every selected village4, of which four always belonged toScheduled Caste or Tribes (henceforth SC/ST — who benefit from affirmativeaction programs mandated by the Indian constitution). In addition to theserandomly sampled household the President of the GP — the pradhan — wasalso subjected to a household interview with some supplementary questions.Thus our sample of pradhans coincides exactly with the GPs. Pradhanswere not available for interviews in a few of our GPs — so our final pradhansample is reduced from 201 to 192.
2.2 Questionnaires
Data was collected at the village, pradhan and household level. At the vil-lage a questionnaire was administered using Participatory Rapid Appraisal(PRA) techniques (Chambers 1997[3]) to a group of men selected to repre-sent different groups in the village, to assess their views on problems in thevillage, the work done by panchayat, and obtain measures of inequality andoligarchy. In addition PRA techniques were also employed on a group of se-lected women to get measures of women’s preferences on problems faced bythe village. A facilities assessment was conducted by an investigator devotedto the task of looking at the quality of schools, clinics, roads, drinking water,and sanitation. We also obtained secondary data from the 1991 census ofIndia for the villages in our sample.
In addition to this village level data, one randomly chosen adult fromevery household in the sample was asked questions on the household’s socio-economic status, household structure, views and use of public services in
3Number of villages for household sample were: AP: 32 villages, KA: 90 villages, KE66 villages, TN 71 villages.
4The survey team leader in every village walked the entire village to map it and identifytotal number of households. This was used to determine what fraction of households in thevillage were to be surveyed. The start point of the survey was randomly chosen, and afterthat every Xth household was surveyed such that the entire village was covered (goingaround the village in a clockwise fashion with X=Number of Households/20).
5
the village, private government benefits. They were also asked to rank-order problems in the village. Since the sample is divided between maleand female respondents this provides yet another source of information ongender differences on preferences about village problems. All pradhans inthe sampled GPs had to answer the household questionnaire, but were alsoasked a series of questions to assess their knowledge about the politicalprocess — such as the names of prominent elected officials and reservationrules.
2.3 Identification
The identification method employed in this paper is very similar to CD. AllGPs within a block are selected for women’s reservation by rotation, with athird of all GPs mandated to be reserved for women pradhans at any giventime. The method of rotation varies across states and is determined by thestate’s election laws. Typically a list of GPs is prepared for each block —ordered by the proportion of women in the population, and the first GP inthe list selected for reservation in the first election, along with the fourth,the seventh and so on, skipping three in sequence. In the next election thesecond GP in the list is selected, and additional GPs picked again by skippingthree sequentially. This method, while not perfectly random, ensures thatGPs are selected for women’s reservation via an exogenous process. Twoof the states — AP and Tamil Nadu have direct elections for the pradhan —akin to a presidential system, while two — akin to a prime ministerial system- have indirect elections. Every village is divided into wards, each of whichelects a member to the panchayats, and each ward is also reserved usinga rotation system. Thus 1/3 of all GP members are always women. Inreserved GP’s with indirect elections the pradhan is elected from among thewomen ward members.
To test the exogeneity of the reservations system we regress a dummyfor women’s reservations, one at a time, on 11 measures of public servicequality and general levels of development from the 1991 census. We alsoregress it on measures of village inequality and caste composition collectedfrom our survey in 2002. Since elections in these villages were all completedprior to our survey, and census data are available to the election commis-sions to determine the composition of constituencies, if villages were selectedfor reservations on the basis of any endogenous criteria we would expect tosee a correlation between reservations status and at least some of the censusoutcomes. On the other hand if the villages were selected for reservationson the basis of some social or cultural criteria — e.g. being relatively equal
6

or unequal, or with low levels of upper caste domination, etc. — measures ofsocial inequality would be correlated with reservations status. State dum-mies are also included in all these regressions to allow for the possibilitythat states may have implemented the 73rd amendment reforms at a differ-ent pace, and used different rotation and election systems. Table 1 presentsresults from these regressions. Of the twenty variables we tested, nineteenhave coefficients that are not significantly different from zero. Only onevariable — medical facilities in the GP — is significant for reasons that areunclear. This suggests that reservations were unlikely to have been allocatedto GPs on the basis of observable characteristics and supports the assertionthat they were exogenously allocated.
If women’s reservation status is exogenously determined, then OLS re-gressions should suffice to determine the causal impact of reservations onoutcomes. One concern with this method is that the 73rd amendment alsomandated reserved seats for scheduled castes and tribes (SC/ST) on thebasis of their proportion in the village population. In the four states weare studying, SC/ST reservation overlap with women’s reservations. Thusapproximately a third of GPs with SC/ST reservations would — randomly —also be reserved for women. This is likely to confound the impact of the twotypes of reservations so we focus on contrasting GPs exclusively reserved forwomen with unreserved GPs. The impact of SC/ST reservations on pan-chayats has been examined elsewhere (Besley et al. 2004 [1], Chattopadhyayand Duflo 2004a [4]).
3 Results
3.1 Revisiting Chattopadhyay and Duflo
3.1.1 Preferences
We begin by revisiting the main results of CD who show that the impactof women’s reservations on the activities of panchayats is affected by thepreferences of women. We begin by testing whether men and women differsignificantly in their preferences for public good investments in the village.Note our data on priorities of men and women is based on a retrospectivequestion on problems faced two years ago, while CD’s is based on preferencesrevealed by the issues women petition the GP about. Therefore the prefer-ence data in the two surveys are not exactly comparable. But even with ourmethod we do notice significant differences between men and women bothin PRA and household surveys - suggesting that the information is picking
7

up gender differences. Table 2(a) reports the results comparing preferencesfrom the men’s and women’s PRA. We see that the large differences are insanitation, which women are more likely to see as a problem, and roads,which men are more likely to see as a problem. These differences are testedwith a regression controlling for village fixed effects, and we see that the dif-ferences on sanitation and roads persist after village effects are controlled.However, on five of the seven priorities there is no gender difference observed.
PRAs are better suited to looking at public goods because they are theresult of a public interaction where consensus issues are more likely to arise.To examine issues that may matter more at the level of households, we con-trast the PRA data with data on the ranking of problems from two years agoat the individual level in Table 2(b). Here we see that men have a greaterpreference for education and infrastructure, while women are more likely toconsider electricity and housing as a priority. Controlling for village fixed ef-fects, however, only the electricity and housing differences remain suggestingthat they are robust differences not driven by differences in village charac-teristics. Finally we look at the pradhans themselves in Table 3. Here wesee that women-reserved pradhans seem to express a greater preference foreducation and electricity in a simple comparison of proportions. However,controlling for village fixed effects none of these differences remain suggest-ing that they are not robust to spatial differences. Thus conditional onvillage-level effects, reserved and unreserved pradhans do not have signifi-cant differences in their ranking for problems from two years ago. Thus,while we see differences in preferences across men in women from three dif-ferent sources of data, these differences are neither consistent with CD noracross the data sources.
3.1.2 Differences in Panchayat Activities
Data on the activities of panchayats come from three sources. The majorityof the outcomes5 come from the PRA. In the PRA, respondents were askedto assess activities of the panchayats after the last election on a variety ofpublic good investments. The number of days a week a medical practitioneris available in the village is obtained from the facilities assessment. Meet-ing higher panchayat and facing problems in discharging duties are obtainedfrom the pradhan interviews. Since we have data on marginal improvementssince the last election, it is possible to test the extent to which reservations
5Overall activism; activism in water, education, health, roads, transport, sanitation,electricity, and irrigation
8

in the last election influenced panchayat activity. Table 4 presents the sum-maries for these measures of GP activism.
In understanding these results, as mentioned earlier, it should be kept inmind that in most states, other than Kerala, panchayats are rather limitedin what they can accomplish. They have limited sources of revenue that theycan choose how to spend. While they have the ability to generate revenuesvia taxes on houses, sales taxes on items produced and sold within thevillage, and other limited sources, their main sources of revenue are grantsfrom state and central governments that are tied to mandated activities suchas food for work programs or housing for scheduled castes (World Bank,2004)6. Therefore, much of the effectiveness of a panchayat depends on itsability to mobilize funds, investments and action from others — from theblock and district headquarters, from village users groups in the case of AP,and from members of the state assembly who have a fund from which theycan allocate grants to GPs (Matthew and Buch 2000 [8]).
Differences between states are easy to see in Table 2 which provide meansand standard deviations for a wide set of outcome variables from the facil-ities, PRA, and pradhan Interview questionnaires. Table 2 clearly showsthat Kerala dominates the other states in terms of the number of days aweek with medical practitioner. The PRA data provides a slightly differentperspective with Kerala less dominant. In overall GP activism, while Keralastill leads the other states — the gap is much smaller. Tamil Nadu on theother does the worst in all categories. The last two columns provide someinteresting information on the extent to which the panchayat was able tofulfill its intermediary functions. Note the low percentage of panchayats inAP that were able to meet higher levels government on a regular basis. It is6% in AP compared to 49-74% in the other states. This is suggestive of theextent to which the AP state government has shut out village panchayatsfrom its apparatus. AP panchayats also lead the states in the extent towhich they face problems with 55% of them reporting problems, comparedto between 20-32% in the other states.
Table 5 attempts to replicate CD’s results by examining the uncondi-tional difference in panchayat activities, for a variety of goods and services,in reserved and unreserved GPs. We first report mean activity levels in thetwo categories, and then the coefficient of a dummy variable for women’sreservations from a regression that controls for block fixed effects with stan-
6 In Karnataka, panchayats have access to a small grant (Rs. 100,000 in Karnataka)over which they have some discretion, while in Kerala they are relatively well funded witha variety of sources of taxation and untied grants from the state government (World Bank,2004 [14]).
9

dard errors clustered at the GP level. From the fourteen activities weexamine, only two show a significant difference between reserved and unre-served GPs: a standardized index of overall GP activity measured from thefacilities survey, and a question from the PRA on whether the GP was able toregularly meet with officials from higher levels of government. In both thesemeasures, women’s reservation has an adverse effect. Without conditioningfor anything else, but controlling for block fixed effects women’s pradhans inreserved GPs perform worse on an overall measure of GP activity, but alsoare less effective at interacting with higher levels of government. However,on the vast majority of activities, reserved pradhans do no different thanunreserved pradhans. Thus, there is no evidence to suggest that womenpradhans are acting in a manner that is more sensitive to the preferences ofwomen7.
3.2 Selection
We begin by examining the selection issue. Are women in reserved con-stituencies of worse quality than unreserved pradhans? Are they tokens?Table 6 provides some simple comparisons. Reserved pradhans are younger,worse educated (by two years of schooling), have smaller land holdings,smaller knowledge scores8, and less political experience than unreservedpradhans. Note that the standard deviations on education and the knowl-edge score are larger for reserved women than for unreserved pradhans —suggesting that women who stand for election in reserved seats are a verydiverse group. However, it is possible that these differences merely reflectgender differentials in the general population, since 87% of pradhans in un-reserved GPs are men — and women are distinctly worse educated than menon average. We can check this by comparing women who become pradhanswith women in the general population who are eligible to stand for election(they have to be over 21 and literate). This comparison shows that womenpradhans are from the top end of the distribution of women on all attributes.
Figure 1 makes this graphically clear. The distributions of age, edu-
7We also conducted an analysis, similar to CD, with activity-specific regressions wherewomen’s reservations were interacted with women’s preferences to see if these preferenceswere driving the activities of women-reserved pradhans. These results, available fromthe authors on request, also do not demonstrate any relationship between preferences andpanchayat activites.
8Knowledge scores come from a series of political knowledge questions where respon-dents were asked to identify the names of prominent leaders such as the prime ministerand chief minister, and to explain important rules such as the percentage of villages in aGP reserved for women.
10
cation, knowledge score and landholding for women-reserved pradhans areclearly much closer to those of unreserved pradhans than eligible women inthe population. This suggests that reserved and unreserved pradhans areselected in a similar manner, and are much more like each other than theyare like other members of their sex in the population.
Given the extent of dispersion in these distributions it is possible thatthere is a lot of spatial variation in attributes and that these trends may notpersist once spatial controls are included. Another possibility is that otherhousehold characteristics may be driving these differences. For instances thedifferences in knowledge score may simply suggest that women who becomepradhans come from worse-off households. A third question that requiresfurther investigation is whether women pradhans are from the same elitefamilies as men pradhans. To test all these hypotheses we run the followingOLS regression on individual level data:
Pbi = αb + κHbi +DWbi + µCbi + γVbi + εbi
Where Pbi is the set of individual i’s characteristics in block b, αb areblock fixed effects, Hbi are a set of characteristics of the individual’s house-hold — household size, religion SC/ST status, occupation and literacy ofhead, Wbi indicates whether the individual is elected pradhan in a seat re-served for women. Cbi indicates whether the individual is elected pradhanin a seat reserved for SC/STs. Vbi is a vector of inequality and oligarchy inindividual i’s village, and εbi is the error term. We run three specifications.In the first specification, the sample is the eligible (literate, above 21 yearsold) population. In this specification the coefficient D provides a measureof whether reserved(women) pradhans are different from the eligible popu-lation. In this specification we also set γ=0. In the second specification,we restrict the sample to eligible women. In this specification D measureshow different reserved(women) pradhans are from other eligible women, thusproviding a difference free of gender effects. In this specification we also setγ=0. In the third specification, we restrict the sample to the set of prad-hans. D now measures how different reserved(women) pradhans are fromunreserved pradhans in the observed attributes.
Table 7 reports the results for the coefficientD for a variety of attributes,for the three specifications mentioned above. Looking at the 3rd columnwhich compares reserved and unreserved pradhans, we see that reservedpradhans are significantly worse off than unreserved pradhans in their ed-ucation, knowledge and political experience, and also tend to be younger.
11
However, looking at the 2nd column we see that they are much better offthan comparable women in the population. Column 1 compares reservedpradhans to people of all genders, over the age of 21, and literate in thepopulation and the results are very similar to the comparison with eligiblewomen. Controlling for gender differences, women pradhans are better edu-cated, wealthier, and more knowledgeable than the general population. Thisdoes not suggest that they are tokens.
Another claim often made about women in reserved seats is that theyare drawn from the same upper caste groups that dominate village poli-tics. Table 8 compares the caste status of reserved and unreserved pradhans(keeping in mind that we are not considering women who are also in SC/STreserved seats). Here we see that reserved pradhans are less likely to bedrawn from Forward (upper) castes, and are more likely to be OBCs (otherbackward castes) or BCs (backward castes). Finally we compare unreservedand reserved women pradhans on the question of who persuaded them tocontest the election (Table 9.) We see that the responses for the two cat-egories are similar — both groups were more or less equally likely to havebeen asked to contest by political elites - Members of the Legislative Assem-bly (MLAs), previous pradhans, and important members of the community.The largest difference comes from reserved women being more likely to havebeen persuaded by spouses to run than unreserved pradhans. This couldagain be reflective of general gender differences — that women who do nothave supportive spouses are not likely to seek elected office. Thus there islittle evidence to support the notion that women pradhans — in seats exclu-sively reserved for women — are tokens. However, there is a great deal ofheterogeneity in the quality of women who become pradhans — a heterogene-ity that is reflected in the general population of women. This heterogeneitymay therefore matter in their effectiveness as pradhans.
3.3 Testing the Impact of Reservations
The structure of our data allows us to analyze the impact of reservationswithin blocks or within pairs of blocks. In our sample, a block consists of 6GPs in Andhra Pradesh, Karnataka and Tamil Nadu, and 3 GPs in Kerala.Since reservations are at GP level, the block is the smallest grouping withinwhich we can perform our analysis. In addition to considering block effects,the sampling design also allows us to form pairs of blocks across states,based on historical and cultural similarities. The districts within stateswere selected, with one exception, to focus on those that had belonged tosame administrative unit during colonial rule, but had been transferred to
12

different units when the states were reorganized in 19569. From these states,pairs of blocks (which are the next level of administrative unit) one fromeach state were selected to be similar on their majority language. Languagetends to proxy for social structure and culture in these regions — so language-matched blocks would have similar sociocultural systems. All blocks fromwithin the sampled districts are chosen to be the closest possible in theirmajority language to a block in the matching district of the neighboringstate. Since language is a good proxy in these regions for cultural differencesgiven the prevalence of caste and linguistic endogamy, language matchingallows us to partially control for "unobservable" sociocultural differences.
The advantage of using block fixed effects is that we can control forunobserved variables at the block level. The advantage of using block pairfixed effects is that it allows us to estimate state effects and thus it permitsus to examine how reservations work across states, controlling for historicand linguistic similarities. We perform the analysis with both types of fixedeffects.
3.3.1 Block Fixed Effects
In testing the impact of women’s reservation on panchayat activities, theheterogeneity in the quality of pradhans has to be kept in mind. Does thequality of the pradhan matter? Does it matter more in reserved GPs? An-other important question that has to be addressed is the extent to whichinequality and concentration of power in one caste in the village affect theeffectiveness of women pradhans? Can elite control affect panchayat gover-nance, particularly in reserved GPs? Cognizant of the exogeneity of women’sreservations, we can test these hypothesis in an OLS framework in the fol-lowing framework:
9These are the districts of Bidar and Medak from the erstwhile state of Hyderabad, nowin Karnataka and AP respectively, Pallakad, Coimbatore, Kasargod, Dakshin Kanada,Dharmapuri, and Chithoor, all from erstwhile Madras state and now in Kerala, TamilNadu, Kerala, Karnataka, Tamil Nadu and AP respectively. Since Bidar and South Kanaradistrict in Karnataka are "special" in that they represent the worst and best districts inthe state in development indicators, we also sampled Kolar district which is the oneexception to the block matching rule in our sample. Kolar was a part of erstwhileMysore state the precursor to modern Karnataka and thus does not follow the colonial-rule matching process described above. However, adding it does allow for more variationwhen we compare the other three states with Karnataka. Furthermore, Kolar has commonborders with both Chithoor in AP and Dharmapuri in TN - which allows for a three partcomparison within the same geographic area.
13

Ybv = αb + βPbv + γVbv + ηWbv + µCbv + ωDbv + φ(Pbv ∗Wbv) + θ(Vbv ∗Wbv) + εbv
Ybv is the set of panchayat activities in village v, block b, as outlined inTable 2, αb are block fixed effects, Pbv is the set of pradhan characteristics10,and Vbv is the set of village characteristics11. Table 10 provides summarystatistics for these sets of characteristics. Wbv, Cbv, and Dbv are indicatorsfor whether the GP to which the village v belongs is reserved strictly forwomen, strictly for SC/ST, and for SC/ST women, respectively. The coeffi-cient η is an estimate of the impact of women’s reservations conditioning oneverything else. φ provides an estimate of how much pradhan characteristicsmatter in villages with GPs reserved for women and θ provides an estimateof whether village characteristics such as inequality and caste dominationmatter more when the pradhan is a reserved woman. Pbv is a subset of Pbvand Vbv is a subset of Vbv
12. We test five sets of specifications. In the first setboth φ and θ are set to zero, thus focusing on the reservation effect withoutconditioning on interaction terms. The next three specifications set θ to zeroand Pbv to age, education, and political experience, respectively. This allowsfor separate interactions between reservations and pradhan characteristics.The final specification sets φ to zero and Vbv to proportion land controlledby upper castes13.
Tables 11.1 through 11.5 report the results of these regressions. Table11.1 presents the specification without interaction terms. We observe thatgenerally women’s reservation does not have an effect on GP activism. Theexception is GP activism in education, which is significantly higher in GPsreserved for women. These results also show that heterogeneity, both inPradhan and village characteristics, does influence GP activism. Specifi-cally, activism is significantly influenced by the pradhans age and, in someinstances, by their education. Pradhans in their "prime" perform betterthan "old" pradhans in terms of overall activism, activism in water, road,and irrigation issues. "Young" pradhans perform better in terms of activism10age categories: young (21-30), prime(30-50), old(50+); education categories(along
natural breaking points): 0-5 years, 5-10 years, 10-15 years, 15+; dummy for any previouspolitical experience; dummy for wealthy; landholding11proportion land controlled by upper castes; land Gini categories: low (1st quartile),
medium(interquartile range), high(4th quartile), literacy rate, fraction landless, pradhan’svillage12 13% of pradhans in unreserved GPs are women so we can also control for pradhans
sex in these regressions. Adding this slightly weakens the effect of reservation but doesnot change the effects of interactions. We do not report them.13We have also interacted reservation with the categories of the Gini coefficient but
results are not interesting.
14

in roads. Young pradhans and pradhans in prime ages are also more likelyto face problems in discharging their duties than old pradhans. Pradhanswith ten to fifteen years of education perform better than those with zeroto five years in activism in electricity issues. Pradhans with a college degree(more than fifteen years of education) perform worse in activism in sanita-tion issues. Higher levels of pradhan’s education is associated with fewerproblems for the GP. Pradhans who have previous political experience arealso less likely to face problems.
Village characteristics also influence GP activism. The higher the pro-portion land controlled by upper castes the fewer days is a medical practi-tioner available in the village. Pradhans in villages with a higher proportionof land owned by upper castes are more likely to meet with higher levels ofgovernment. Knowing that heterogeneity in pradhan and village character-istics matters, it is only natural to ask the question whether heterogeneitymatters differently in reserved constituencies. To answer these question weturn to specifications with interactions.
Tables 11.2 through 11.4 present the results for the specifications withpradhan characteristics interactions. In table 11.2 we interact women’s reser-vation with pradhan’s age. We transform age into a categorical variableand we keep "old" (age above fifty) pradhans as the omitted category. Weobserve that in several instances, age matters differently in reserved con-stituencies. However, we cannot pinpoint a consistent pattern. In GPsreserved for women, young pradhans and pradhans in their prime performworse than old pradhans in terms of number of days a week a medical prac-titioner is available in the village. Pradhans in their prime perform worsein GPs reserved for women in activism in education, but at the same timethey perform better in activism in health and irrigation. In reserved con-stituencies, pradhans in their prime are also more likely to meet with higherlevels of government suggesting that they do better in accessing resourcesfrom outside the GP.
Table 11.3 contains the results for the interaction of women’s reservationwith pradhan education. We transform education into a categorical variable,along the natural cut-off points: up to primary school(0-4 years of educa-tion), middle school to secondary school (5-9 years), completed high school(10-14 years), and completed college(15 years and more). We keep pradhanswith primary school as the omitted category. College education seems tohelp women pradhans in reserved seats. It improves their performance inmedical practitioner availability, water activism and health activism. Lowerlevels of education, however, have a mixed effect. Pradhans in reservedseats do better in activism in educated when they have either completed sec-
15
ondary of high school, but high school educated reserved pradhans performworse than reserved pradhans with primary school or less in water activismand health activism. Thus there appear to be some non-linearities in theeducation interaction in water and health activism. Note also that reservedpradhans with secondary school education also perform worse than primaryeducated pradhans in meeting higher levels of government. Thus, high lev-els of education help pradhans in reserved seats, but pradhans with middleand secondary educations do not always do better than those with primaryeducations.
Table 11.4 presents the results for the interaction with Pradhan politicalexperience, as measured in the number of terms previously served, as eitherPradhan, Vice-Pradhan, or Ward Member. Since the average number ofterms previously served is below 1(0.87), we transform political experienceinto an indicator for whether the Pradhan has ever served in either of thethree positions. We observe that, in reserved GPs, political experience helpsPradhans in terms of overall activism, activism in water issues, and activismin sanitation. Since women have significantly lower political experience thanunreserved Pradhans, these results point towards a hopeful trend. As elec-tions become more regular, and the reservations system matures, womenwill become more experienced and, consequently, more effective leaders.
In table 11.5 we attempt to explore the differential effect of heterogeneityin village characteristics across reserved and unreserved GPs. The villagecharacteristic of interest is the proportion land held by the upper castes -which indicates the extent to which upper castes are "dominant" - that isthey dominate village life (Srinivas, 1959). We observe that, in reservedGPs, a higher proportion of land held by upper castes leads to lower overallGP activism, lower activism in water and electricity issues. These resultssuggest that power in the hands of the upper caste stifles the ability ofwomen to function as pradhans in reserved constituencies. Since the castedistribution of women-reserved and unreserved Pradhans is not significantlydifferent, these results should not be interpreted as high castes blocking theefforts of low caste women, but of patriarchy being more pronounced invillages dominated by upper castes.
3.3.2 Block Pair Fixed Effects
The purpose of analyzing the effect of reservation within block pairs is toisolate state effects and to contrast the reservation effects across states.Therefore, in this subsection we are no longer interested in how pradhan andvillage heterogeneity influence the effects of reservation. Keeping in mind
16

the exogeneity of reservations, we use OLS in the following framework:
Ypv = αp + δSpv + βPpv + γVpv + ηWpv + µCpv + ωDpv + τ(Spv ∗Wpv) + εpv
Ypv is a measure of GP activism in village v, pair p. αp represents thepair fixed effects. Spv are state dummies14. The rest of the variables arethe same as the block fixed-effects specification. τ measures the extent towhich the effects of women’s reservation differ across states. We estimatetwo specifications, one without state interactions (τ=0) and one with stateinteractions.
Tables 12.1 and 12.2 present the results of the block pair fixed effectsspecifications. In table 12.1 we estimate the state effects without includinginteractions with reservation. The state effects show the patterns in statedifferences observed in the outcome summaries. Given the larger group size,there is more variance within groups and hence the significance levels ofsome of the effects change, as compared to table 10.1. However, the signs ofthe effects remains by and large the same. Furthermore, we continue to seethat heterogeneity in pradhan and village characteristics still continues tomatter. State effects also matter, with Kerala doing better than the otherstates in health and in meeting higher level panchayats, but doing worse onproblems faced by GPs., and in activism in roads.
In table 11.2 we explore the extent to which the effects of women’s reser-vation differs across states. The general pattern is that reserved constituen-cies in Kerala perform better than AP in most categories of activism. Thisis possibly because Kerala is both more gender-equal than AP, and has amore political mature reservations and electoral system at the GP level.Note that Kerala and Karnataka are do not display much difference in theirreservations effects, except that reserved GPs in Karnataka dominate Ker-ala’s in irrigation. Karnataka’s reservation system has been in place foreven longer than Kerala’s - so this again suggests that the political maturityof the reservations system improves its effectiveness. Kerala and Karnatakaare also different from AP and Tamil Nadu in having indirect elections forthe pradhan, and it is possible that this mechanism may also contribute thestate differences. We have no way of sorting out those two effects.
14We keep Kerala as the omitted category
17

4 Interpretation and Conclusion
The results of this analysis do not show a simple women’s reservations ef-fect. Unlike Chattopadhyay and Duflo (2004) there is no evidence to showthat reserved women pradhans act in ways that are more congruent with thepreferences of women. However, we do show that these women are not to-kens. They are from the upper end of the distribution of women and tend tobe far better educated, more knowledgeable about political activities, moreexperienced, and wealthier than the average woman. At the same time theyare less likely than unreserved pradhans to belong to upper caste groups,and also less likely to have been asked to run for office by political elites- which again is evidence against the tokenism hypothesis. The contrastwith Chattopadhyay and Duflo may reflect the fact that their evidence isfrom Rajasthan and West Bengal, an area of India with much higher genderdifferentials than South India where our survey was conducted.
Perhaps the primary message here is that pradhan heterogeneity matters.Women reserved pradhans are widely dispersed in their age, education, andexperience - and this matters. In particular, women pradhans in reservedGPs are unambiguously more effective when they are more experienced andwhen they have a college level education. Comparing middle and highschool education to primary education has more mixed results, but theydo indicate that education generally helps reserved women pradhans. Ageeffects also matter in women’s reservation - "prime age" women pradhansbetween the ages of 30 and 50 are more effective than "old" pradhans abovethe age of fifty in health, irrigation and networking activities, but are lesseffective in improving the availability of medical practitioners, and educationinvestments. Thus, while age matters - it does not have clear, unambiguouseffects.
Importantly, we see that women in reserved GPs perform worse whenmost of the land in the village is owned by upper castes. This suggests thatcaste structures may be correlated with structures of patriarchy making thejob of women particularly difficult when they are confronted with entrenchedhierarchies. We also see that women pradhans in reserved GPs in APperform the worst, while those in Kerala and Karnataka tend to performbetter. This again indicates the salience of the maturity of the reservationssystem since it has been in place much longer in Kerala and Karnataka thanin AP. This effect in conjunction with the positive effect of the pradhanspolitical experience together point towards a hopeful future. As womenacquire more experience via the reservations system, and as the systemcontinuous to mature, women will become more effective leaders.
18
Thus, our results are far more supportive of the "optimists" than the"pessimists." Reserved women pradhans are not tokens, and become moreeffective when they acquire more political experience and when they are welleducated. Interestingly, they do not seem to act in ways that support thepreferences of women, and when they are effective they tend to be effectiveon many different dimensions of panchayat activity. The results also sug-gest that women reserved pradhans would benefit from a more supportiveenvironment in upper caste dominated villages, and in states like AP wherethe reservations system is less mature.
References
[1] Besley, Timothy, Rohini Pande, Lupin Rahman and Vijayendra Rao,"The Politics of Public Good Provision: Evidence From Indian LocalGovernments," Journal of the European Economic Association, April-May 2004
[2] Besley, Timothy, Rohini Pande, Lupin Rahman and Vijayendra Rao,[2004b], "Decentralization in India: A Survey of South Indian Panchay-ats," mimeo
[3] Chambers, Robert, Whose Reality Counts: Putting the First Last, In-termediate Technology Publications, London, 1997
[4] Chattopadhyay, Raghabendra and Esther Duflo (2004a): "The Impactof Reservation in the Panchayati Raj: Evidence From a NationwideRandomized Experiment" , Economic and Political Weekly (forthcom-ing)
[5] Chattopadhyay, Raghabendra and Esther Duflo (2004b): "Women asPolicy Makers: Evidence From a Randomized Policy Experiment inIndia" , Econometrica (forthcoming)
[6] Chathukulam J. and M.S John (2000): "Empowerment of Women Pan-chayat Members: Learning from Kerala (India)", Asian Journal ofWomen Studies, 6(4), 66-101
[7] Filmer, King and Pritchett, "Gender Disparity in South Asia", WorldBank Policy Research Paper No. 1867, 1998
[8] Matthew, George and Nirmala Buch, Status of Panchayati Raj in theStates and Union Territories of India 2000, Institute for Social Studies,Delhi, 2000
19

[9] Rai, Manoj, Malini Nambiar, Sohini Paul, Sangeeta Singh, SatinderSahni, The State of Panchayats : A Participatory Perspective, Sam-skriti, 2001
[10] Ramesh, Asha and Bharti Ali (2001), 33 1/3: Reservation TowardsPolitical Empowerment, Books for Change, Bangalore
[11] Srinivas, MN, "The Dominant Caste in Rampura," American Anthro-pologist, Vol. 61, No. 1., pp. 1-16, February 1959
[12] Varatharajan, D, R. Thankappan, Sabeena Jayapalan, "Assessing thePerformance of Primary Health Centres Under Decentralized Govern-ment in Kerala", Health Policy and Planning 19(1), Pp: 41-51, 2004
[13] Vyasulu P. and V. Vyasulu (1999): "Women in Panchayati Raj: GrassRoots Democracy in Malgudi", Economic and Political Weekly, 34(52),3677-3686
[14] World Bank, "India: Fiscal Decentralization to Rural Governments",Rural Development Unit, South Asia Region, Report No. 26654-IN,2004
20

Table 1: Exogeneity of reservation
Variable
Marginal effect on probability of GP pradhan being reserved for
women Nr. Obs.
1991 census variables Population 0.000 196(0.136)
Proportion Women 15.480 195(1.438)
Fraction villages with educational facilities in GP -0.609 191-(1.525)
Fraction villages with medical facilities in GP -1.033 191(-2.196)**
Fraction villages with drinking water in GP -0.569 191-(1.281)
Fraction villages with postal facility in GP -0.179 191-(0.570)
Fraction villages with communication facility in GP -0.197 191-(0.564)
Fraction villages with power supply in GP -0.612 191-(1.352)
Fraction irrigated land in GP -1.212 192-(1.586)
Average distance from town in GP 0.000 192(0.015)
GP literacy -0.824 195-(0.813)
GP employment 0.223 195(0.139)
Current variables Generalized Enthropy (a=1) based on land holding -0.041 199-(0.215)
proportion inequality between caste groups -0.359 200-(0.358)
non-pradhan oligarchy -0.501 197-(0.715)
overall oligarchy -0.907 199-(0.639)
pradhan oligarchy -0.662 199-(0.601)
proportion land held by upper castes -0.075 201-(0.160)
proportion landless households -0.312 200-(0.576)
female agricultural wage rate -0.031 199-(1.609)
female construction wage rate -0.006 199-(0.892)
Notes: 1) The marginal effects are computed from individual probit regressions with state fixed effects, separately for each RHS variable2) z-values in parentheses ** significant at 5 percent 3) In a probit with all the RHS variables included a F-test cannot reject the hypothesis that all the coefficients are jointly = 0

Table 2: Summary of GP activism measuresDays with medical
practitionerOverall GP
activismGP activism in
waterGP activism in
educationGP activism in
healthGP activism in
roadsGP activism in
transportGP activism in
sanitationGP activism in
electricityGP activism in
irrigationMet higher Panchayat
Faced Problems
Andhra Pradesh -0.275 0.234 0.181 0.245 0.054 0.335 0.315 0.447 -0.067 0.366 -0.998 0.506(0.657) (0.640) (1.116) (1.114) (0.995) (1.130) (1.351) (1.336) (0.824) (1.430) (0.477) (1.113)
N 70 70 70 70 70 70 70 70 70 70 68 68Karnataka -0.251 0.087 0.106 0.055 -0.183 0.241 0.066 0.242 0.245 -0.076 0.251 -0.190
(0.836) (0.594) (1.068) (1.016) (0.988) (1.059) (1.119) (1.104) (1.280) (0.884) (0.940) (0.887)N 182 182 182 182 182 182 182 182 182 182 175 175Kerala 1.096 0.002 -0.182 -0.088 0.320 0.143 -0.069 -0.151 -0.017 0.058 0.365 0.067
(1.054) (0.489) (0.849) (0.915) (1.109) (0.824) (0.856) (0.827) (0.814) (1.064) (0.889) (1.032)N 126 126 126 126 126 126 126 126 126 126 114 114Tamil Nadu -0.508 -0.218 -0.039 -0.124 -0.057 -0.587 -0.186 -0.392 -0.241 -0.122 -0.126 -0.063
(0.380) (0.421) (0.962) (0.977) (0.861) (0.735) (0.652) (0.553) (0.734) (0.787) (1.009) (0.970)N 144 144 144 144 144 144 144 144 144 144 140 140All states 0.000 0.002 0.007 -0.004 0.005 0.001 -0.003 -0.001 0.006 0.003 0.000 0.000
(1.000) (0.553) (1.002) (1.001) (1.003) (1.003) (0.997) (1.002) (1.002) (1.004) (1.000) (1.000)N 522 522 522 522 522 522 522 522 522 522 497 497
Notes: 1)standard deviations in parentheses2)All measures are standardized across all villages
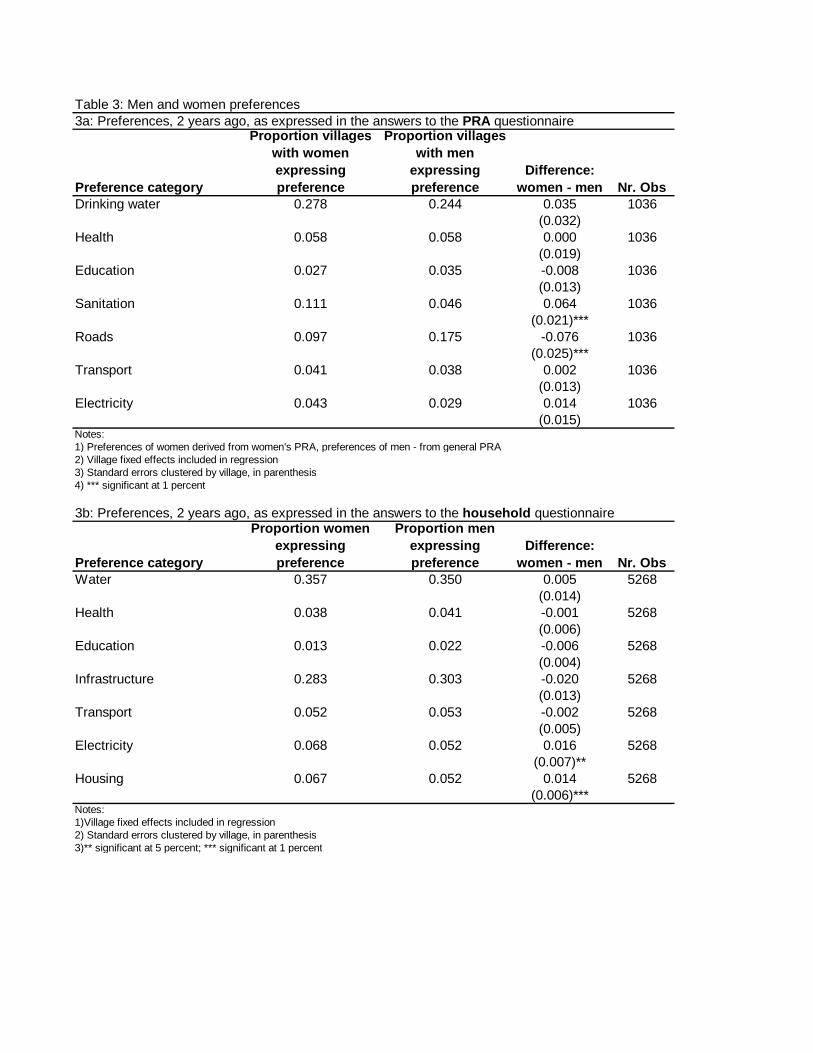
Table 3: Men and women preferences3a: Preferences, 2 years ago, as expressed in the answers to the PRA questionnaire
Preference category
Proportion villages with women expressing preference
Proportion villages with men
expressing preference
Difference: women - men Nr. Obs
Drinking water 0.278 0.244 0.035 1036(0.032)
Health 0.058 0.058 0.000 1036(0.019)
Education 0.027 0.035 -0.008 1036(0.013)
Sanitation 0.111 0.046 0.064 1036(0.021)***
Roads 0.097 0.175 -0.076 1036(0.025)***
Transport 0.041 0.038 0.002 1036(0.013)
Electricity 0.043 0.029 0.014 1036(0.015)
Notes:1) Preferences of women derived from women's PRA, preferences of men - from general PRA2) Village fixed effects included in regression3) Standard errors clustered by village, in parenthesis4) *** significant at 1 percent
3b: Preferences, 2 years ago, as expressed in the answers to the household questionnaire
Preference category
Proportion women expressing preference
Proportion men expressing preference
Difference: women - men Nr. Obs
Water 0.357 0.350 0.005 5268(0.014)
Health 0.038 0.041 -0.001 5268(0.006)
Education 0.013 0.022 -0.006 5268(0.004)
Infrastructure 0.283 0.303 -0.020 5268(0.013)
Transport 0.052 0.053 -0.002 5268(0.005)
Electricity 0.068 0.052 0.016 5268(0.007)**
Housing 0.067 0.052 0.014 5268(0.006)***
Notes:1)Village fixed effects included in regression2) Standard errors clustered by village, in parenthesis3)** significant at 5 percent; *** significant at 1 percent

Table 4: Preferences, 2 years ago, among pradhans
Preference category
Proportion women in reserved seats
expressing preference
Proportion unreserved pradhans
expressing preference Difference Nr. Obs
Water 0.370 0.425 -0.052 194(0.105)
Health 0.000 0.055 -0.061 194(0.028)
Education 0.074 0.039 0.043 194(0.057)
Infrastructure 0.296 0.276 0.053 194(0.101)
Transport 0.037 0.031 0.001 194(0.041)
Electricity 0.074 0.024 0.039 194(0.056)
Housing 0.000 0.047 -0.047 194(0.038)
Notes:1) Block fixed effects included in comparison2) Controls for SC/ST reserved seats included in comparison3) The unreserved category includes reserved for OBC4) Standard errors clustered by block, in parenthesis

Table 5: Simple means comparisonsActivity Mean reserved Mean unreserved DifferenceFrom facilities questionaireNr days w/ medical practitioner 0.312 0.020 -0.029
(1.186) (0.993) (0.288)From PRA questionaireOverall GP Activity -0.095 -0.045 0.010
(0.491) (0.510) (0.216)Gp activity in water -0.183 -0.033 -0.034
(0.875) (0.931) (0.357)GP activity in education 0.033 -0.034 0.178
(0.979) (0.986) (1.949)GP activity in health 0.068 0.057 0.087
(1.016) (1.055) (0.832)GP activity in roads -0.122 -0.107 -0.019
(0.895) (0.959) (0.233)GP activity in transport -0.204 -0.079 -0.023
(0.613) (0.885) (0.250)GP activity in sanitation -0.228 -0.097 -0.002
(0.779) (0.881) (0.022)GP activity in electricity -0.113 -0.045 -0.097
(0.778) (0.948) (0.872)GP activity in irrigation -0.012 -0.022 -0.010
(0.958) (0.959) (0.087)From Pradhan InterviewMet higher panchayat (dummy) -0.230 0.218 -0.456
(1.004) (0.952) (2.613)Faced problems (dummy) 0.010 -0.061 0.115
(1.009) (0.970) (0.670)Notes:1) block fixed effects included in regression estimating difference2) standard deviations for reserved and unreserved in parenthesis3) absolute value of t-statistic for difference clustered by GP in parenthesis4) all measures of activism are standardized across all villages5) overall GP activity from PRA is the average of standardized measures from PRA6) significant differences in bold

Table 6: Summary of individual characteristics, by class
VariableEligible
population Eligible women
Pradhan in Seats Reserved
for Women
Pradhan in Unreserved
SeatsAge 39.362 37.063 39.148 43.610
(11.906) (10.926) (10.862) (11.420)5267 2495 27 82
Education 4.433 3.422 6.074 8.390(4.556) (4.203) (4.287) (3.409)5266 2495 27 82
Landholding 2.388 2.022 7.909 9.199(5.037) (4.547) (9.597) (9.524)5268 2496 27 82
Wealthy 0.298 0.286 0.778 0.720(0.458) (0.452) (0.424) (0.452)5268 2496 27 82
Knowledge score 3.049 1.965 3.185 4.622(2.254) (1.860) (1.642) (0.898)5268 2496 27 82
Political experience 1.444 1.744(0.506) (0.927)
27 82Notes:1) The seats reserved for women do not include double reservations for SC or ST women2) Literate individuals aged 21 and above are eligible to contest pradhan elections

Figure 1: The Distributions of Individual Characteristics
Age
0.000
0.005
0.010
0.015
0.020
0.025
0.030
0.035
0.040
0.045
20 30 40 50 60 70 80Age(years)
Den
sity
eligiblewomen
generalunreserved
reserved forwomen only
Education
0.000
0.025
0.050
0.075
0.100
0.125
0.150
0.175
0.200
0.225
0.250
0 2 4 6 8 10 12 14 16 18
Education (years)
Den
sity eligible
women
generalunreserved
reserved forwomen only
Knowledge Score
0
0.1
0.2
0.3
0.4
0.5
0.6
0.7
0.8
0.9
0 1 2 3 4 5 6
Knowledge Score
Den
sity reserved for
women onlyeligiblewomengeneralunreserved
Land Holding
0
0.05
0.1
0.15
0.2
0.25
0.3
0.35
0.4
0.45
0 1 2 3 4 5 6
Land Holding
Den
sity reserved for
women onlyeligiblepopulationgeneralunreserved

Table 7: Pradhan Characteristics in seats reserved for womenIndividual Characteristic
Compared with eligible population
Compared with eligible women
Compared with unreserved pradhans
Nr. Obs. 5266 2496 184Age 2.445 2.244 -6.226
(2.138) (2.029) (2.686)***Education 2.599 2.682 -1.957
(0.737)*** (0.722)*** (0.984)**Land owned 5.607 5.526 -0.072
(1.615)*** (1.604)*** (2.086)Wealthy (dummy) 0.489 0.491 0.046
(0.085)*** (0.087)*** (0.128)Knowledge score 1.269 1.268 -1.252
(0.275)*** (0.273)*** (0.337)***Political experience -0.422
(0.209)**Notes1) Literate individuals, aged 21 and above are the eligible population2) The coefficient reported is that of the dummy for being elected in a seat reserved for women3) Block fixed effects included in all comparisons4) Controls for gender, SC/ST, elected in a seat reserved for SC/ST, elected in an unreserved seat included in comparison with eligible population5) Controls for SC/ST, elected in seat reserved for SC/ST, included in comparison with eligible women6) Controls for elected in a seat reserved for SC/ST, household characteristics (size, religion, occupation of head, literacy of head), village characteristics (inequality and oligarchy measures), included in comparison with pradhans
7) Standard errors, clustered at GP level in parentheses
8) * significant at 10 percent; ** significant at 5 percent; *** significant at 1 percent

Table 8:Caste status of women elected pradhans in reserved seats vs. unreserved pradhansCaste status Unreserved pradhans Reserved womenBC 16 7
20.78% 23.33%OBC 23 13
29.87% 43.33%SC 3 1
3.90% 3.33%Forward 35 9
45.45% 30.00%Total 77 30Notes:
1)Percentages out of total category
2)The seats reserved for OBC are considered to be unreserved seats
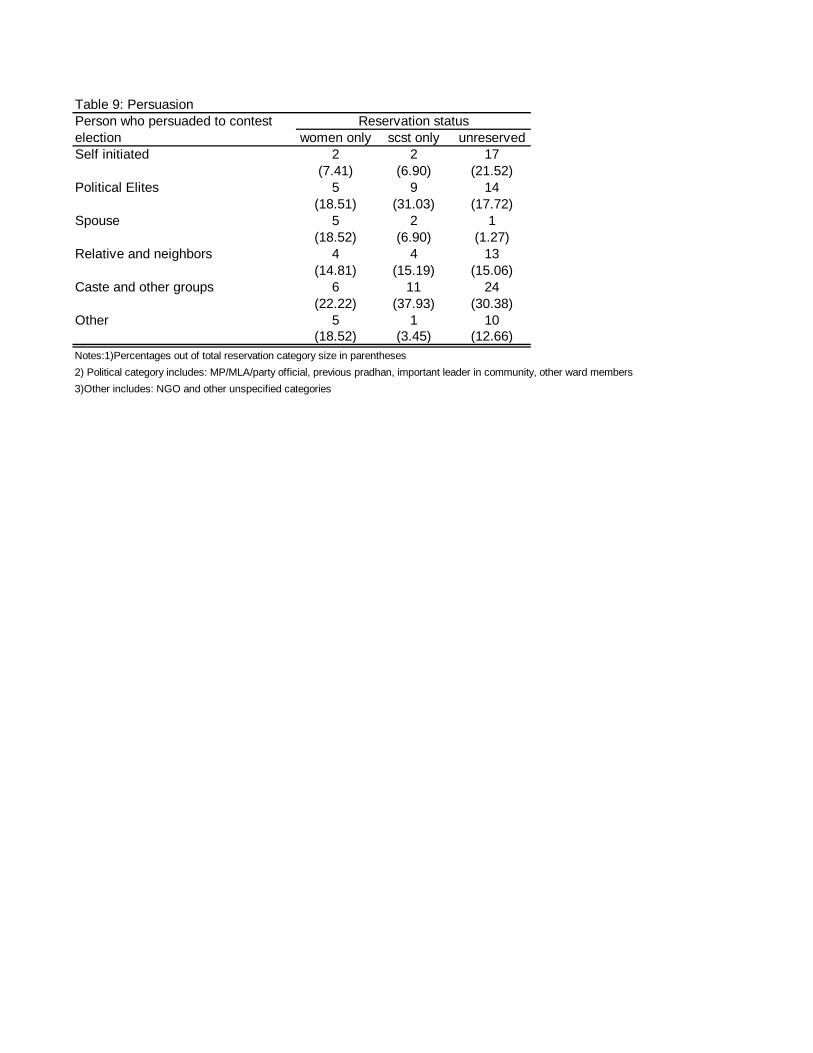
Table 9: Persuasion
women only scst only unreservedSelf initiated 2 2 17
(7.41) (6.90) (21.52)Political Elites 5 9 14
(18.51) (31.03) (17.72)Spouse 5 2 1
(18.52) (6.90) (1.27)Relative and neighbors 4 4 13
(14.81) (15.19) (15.06)Caste and other groups 6 11 24
(22.22) (37.93) (30.38)Other 5 1 10
(18.52) (3.45) (12.66)Notes:1)Percentages out of total reservation category size in parentheses
2) Political category includes: MP/MLA/party official, previous pradhan, important leader in community, other ward members
3)Other includes: NGO and other unspecified categories
Person who persuaded to contest election
Reservation status

Table 10: Summary of explanatory variablesMean SD
Pradhan Young 0.107 0.310
Pradhan Prime 0.636 0.482
Pradhan 5-9 edu yrs 0.354 0.479
Pradhan 10-14 edu yrs 0.318 0.466
Pradan 15plus edu yrs 0.113 0.317
Pradhan Wealthy 0.624 0.485
Pradhan Landholding 6.254 7.452
Pradhan Political Experience 0.610 0.488
Upper caste land proportion 0.270 0.284
Gini low 0.251 0.434
Gini high 0.251 0.434
Literacy rate 0.412 0.176
Fraction landless 0.336 0.253

Table 11.1: Effect of women's reservation, no interactionsDays with medical
practitionerOverall GP
activismGP activism in
waterGP activism in
educationGP activism in
healthGP activism in
roadsGP activism in
transportGP activism in
sanitationGP activism in
electricityGP activism in
irrigationMet higher Panchayat
Faced Problems
Reservation for SCST -0.016 0.027 0.055 -0.118 -0.130 -0.131 0.014 0.130 0.507 -0.115 0.177 0.301(0.148) (0.297) (0.331) (0.753) (0.990) (1.012) (0.087) (0.598) (2.704) (0.680) (0.819) (1.472)
Fraction SCST -0.385 -0.003 0.035 -0.122 -0.189 0.048 -0.004 0.070 0.079 0.055 -0.455 0.136(3.242) (0.032) (0.178) (0.545) (0.991) (0.291) (0.019) (0.355) (0.451) (0.232) (2.425) (0.717)
Reservation for Women -0.044 -0.010 -0.078 0.237 0.039 -0.083 -0.094 -0.066 0.032 -0.065 -0.287 -0.159(0.454) (0.174) (0.698) (2.051) (0.299) (0.813) (0.910) (0.542) (0.311) (0.406) (1.583) (0.986)
Res. for SCST Women -0.103 -0.061 0.176 -0.209 -0.184 0.218 0.095 -0.332 0.106 -0.362 -0.228 0.125(0.669) (0.509) (0.663) (0.914) (0.883) (1.070) (0.430) (1.098) (0.494) (1.848) (0.690) (0.482)
Pradhan Young 0.105 0.157 0.292 -0.125 0.138 0.417 0.020 0.082 0.137 0.291 -0.037 0.612(0.778) (1.519) (1.425) (0.693) (0.798) (2.552) (0.093) (0.410) (0.664) (1.623) (0.131) (2.261)
Pradhan Prime -0.005 0.174 0.424 0.132 -0.036 0.274 -0.007 0.151 0.166 0.292 0.067 0.495(0.048) (2.206) (3.204) (1.010) (0.245) (2.519) (0.055) (1.056) (1.172) (1.803) (0.379) (3.011)
Pradhan 5-10 edu yrs 0.102 0.006 0.083 0.065 0.027 -0.030 0.095 -0.162 0.121 -0.152 0.226 -0.599(1.230) (0.075) (0.606) (0.450) (0.246) (0.225) (0.560) (0.924) (0.762) (1.111) (1.102) (2.816)
Pradhan 10-15 edu yrs -0.009 0.075 0.186 0.263 0.149 -0.049 0.019 -0.144 0.306 -0.129 0.270 -0.618(0.084) (0.862) (1.036) (1.635) (0.989) (0.316) (0.109) (0.701) (1.843) (0.745) (1.245) (2.396)
Pradhan 15+ edu yrs -0.324 -0.126 0.250 0.156 -0.076 -0.261 -0.356 -0.650 0.309 -0.380 0.218 -0.546(1.333) (0.733) (0.883) (0.515) (0.221) (1.263) (1.575) (2.175) (1.225) (1.220) (0.951) (1.950)
Pradhan wealthy 0.098 -0.043 -0.018 -0.279 -0.236 0.070 -0.088 0.196 -0.012 0.025 0.039 0.273(1.236) (0.588) (0.144) (2.420) (2.023) (0.678) (0.575) (1.327) (0.077) (0.192) (0.232) (1.651)
Pradhan Landholding -0.005 0.005 0.014 0.009 0.013 -0.002 -0.007 0.007 0.007 -0.004 -0.006 0.018(1.076) (1.071) (1.883) (0.832) (1.858) (0.297) (0.664) (0.858) (0.737) (0.391) (0.668) (1.806)
Pradhan Political Exp 0.154 0.047 -0.225 -0.003 0.229 0.197 0.061 0.093 -0.017 0.043 0.238 -0.429(1.640) (0.502) (1.126) (0.015) (1.610) (1.130) (0.448) (0.412) (0.113) (0.209) (1.105) (1.727)
Upper caste land prop -0.360 -0.003 0.063 -0.115 0.008 -0.075 0.233 -0.017 0.039 -0.156 0.301 0.084(3.177) (0.029) (0.351) (0.746) (0.060) (0.498) (1.031) (0.107) (0.201) (0.699) (1.755) (0.526)
Low Gini -0.104 -0.042 0.143 -0.138 0.098 -0.160 -0.084 0.014 -0.238 0.034 0.075 -0.068(1.369) (0.663) (1.025) (0.974) (0.838) (1.456) (0.631) (0.108) (2.086) (0.225) (0.815) (0.579)
High Gini 0.315 -0.041 -0.342 0.222 -0.117 0.002 -0.085 -0.107 -0.023 0.124 0.103 0.069(2.458) (0.470) (1.735) (1.179) (0.837) (0.010) (0.533) (0.586) (0.138) (0.710) (0.779) (0.444)
Literacy rate 1.901 0.719 -0.044 0.594 0.470 1.459 1.627 0.180 1.045 0.419 -0.352 -1.208(4.426) (2.892) (0.081) (1.119) (1.001) (3.054) (2.880) (0.330) (1.868) (0.797) (0.556) (1.661)
Pradhan's Village 0.146 0.166 0.204 0.195 0.137 0.317 0.184 0.181 0.144 -0.037 0.017 0.063(1.946) (3.442) (1.957) (2.036) (1.696) (3.465) (1.838) (1.858) (1.652) (0.355) (0.569) (2.162)
Fraction landless hhs -0.001 0.024 0.779 -0.526 0.249 -0.177 -0.100 0.202 0.100 -0.337 -0.154 -0.291(0.005) (0.131) (1.963) (1.426) (0.751) (0.542) (0.271) (0.524) (0.286) (0.903) (0.516) (0.922)
N 482 482 482 482 482 482 482 482 482 482 482 482Adj R-sq 0.579 0.343 0.145 0.199 0.267 0.339 0.113 0.181 0.271 0.095 0.429 0.399Notes: 1)t-statistics clustered at GP level in parenthesis2) Block fixed effects included in regression3) Days with medical practitioner variable from facilities questionnaire, all other variables from PRA questionaire4) All measures of GP activism are standardized across all villages, less the Overall measure, which is an average of standardized measures from PRA5) Significant coefficients in bold

Table 11.2 Effect of women's reservation: Interaction with ageDays with medical
practitionerOverall GP
activismGP activism in
waterGP activism in
educationGP activism in
healthGP activism in
roadsGP activism in
transportGP activism in
sanitationGP activism in
electricityGP activism in
irrigationMet higher Panchayat
Faced Problems
Reservation for Women 0.474 0.009 0.103 0.842 -0.345 0.143 -0.097 -0.255 0.222 -0.538 -0.893 -0.312(2.504) (0.086) (0.445) (5.712) (1.212) (0.651) (0.448) (1.229) (1.354) (2.172) (2.330) (1.147)
Pradhan Young 0.365 0.146 0.345 -0.059 0.147 0.458 -0.024 0.029 0.109 0.161 -0.195 0.454(2.662) (1.238) (1.461) (0.315) (0.813) (2.413) (0.092) (0.131) (0.469) (0.852) (0.642) (1.619)
Pradhan Prime 0.059 0.183 0.459 0.283 -0.148 0.325 0.006 0.114 0.229 0.198 -0.055 0.502(0.505) (2.097) (3.158) (2.080) (0.958) (2.650) (0.039) (0.712) (1.432) (1.210) (0.295) (2.875)
Women Res * Yound -1.172 0.043 -0.247 -0.358 0.012 -0.207 0.188 0.247 0.097 0.615 0.751 0.687(4.791) (0.293) (0.803) (1.309) (0.029) (0.716) (0.529) (0.806) (0.277) (1.954) (1.214) (1.389)
Women Res * Prime -0.507 -0.044 -0.225 -0.883 0.621 -0.309 -0.050 0.236 -0.337 0.594 0.770 0.051(2.418) (0.338) (0.833) (4.668) (1.875) (1.360) (0.222) (0.953) (1.641) (2.020) (1.744) (0.151)
N 482 482 482 482 482 482 482 482 482 482 482 482Adj R-sq 0.594 0.340 0.142 0.213 0.275 0.338 0.109 0.178 0.271 0.099 0.441 0.403
Notes: 1)t-statistics clustered at GP level in parenthesis2) Block fixed effects included in regression3) Days with medical practitioner variable from facilities questionnaire, all other variables from PRA questionaire4) All measures of GP activism are standardized across all villages, less the Overall measure, which is an average of standardized measures from PRA5) Variables included in regression but not reported: reservation for SCST, double reservation women/SCST, fraction SCST, pradhan education, pradhan political experience, pradhan landholding, pradhan wealthy, fraction upper caste land in village, fraction landless households in village, pradhan's village, literacy rate, gini coefficient6) Significant coefficients in bold

Table 11.3 Effect of women's reservation: Interaction with educationDays with medical
practitionerOverall GP
activismGP activism in
waterGP activism in
educationGP activism in
healthGP activism in
roadsGP activism in
transportGP activism in
sanitationGP activism in
electricityGP activism in
irrigationMet higher Panchayat
Faced Problems
Reservation for Women -0.031 0.015 0.139 -0.097 0.377 -0.221 -0.314 0.114 -0.253 0.371 0.352 -0.051(0.220) (0.106) (0.618) (0.531) (1.589) (1.102) (1.180) (0.403) (1.232) (0.859) (0.971) (0.137)
Pradhan 5-10 edu yrs 0.102 0.006 0.121 -0.067 0.101 -0.038 0.043 -0.100 -0.002 -0.013 0.470 -0.533(1.010) (0.057) (0.695) (0.401) (0.841) (0.231) (0.200) (0.469) (0.011) (0.083) (1.975) (2.066)
Pradhan 10-15 edu yrs 0.025 0.097 0.314 0.144 0.309 -0.099 -0.057 -0.070 0.241 -0.004 0.462 -0.576(0.226) (1.013) (1.638) (0.852) (2.069) (0.583) (0.286) (0.305) (1.349) (0.022) (2.003) (2.111)
Pradhan 15+ edu yrs -0.372 -0.140 0.220 0.120 -0.063 -0.312 -0.413 -0.640 0.217 -0.246 0.363 -0.558(1.521) (0.774) (0.785) (0.372) (0.188) (1.457) (1.679) (1.977) (0.804) (0.763) (1.497) (1.878)
Women res. * 5-10 edu yrs -0.043 -0.024 -0.266 0.569 -0.415 0.070 0.246 -0.287 0.472 -0.580 -1.010 -0.269(0.221) (0.144) (0.954) (2.040) (1.599) (0.266) (0.801) (0.875) (1.711) (1.238) (1.950) (0.582)
Women res. * 10-15 edu yrs -0.130 -0.112 -0.636 0.459 -0.810 0.362 0.425 -0.311 0.236 -0.625 -0.794 -0.078(0.478) (0.712) (2.395) (1.851) (2.216) (1.501) (1.380) (1.008) (0.845) (1.421) (1.561) (0.161)
Women res * 15+ edu yrs 0.689 0.262 1.040 -0.376 0.791 0.253 0.139 0.348 0.508 -0.605 -0.276 0.402(3.437) (1.156) (2.282) (1.217) (2.517) (0.791) (0.445) (0.963) (1.304) (1.153) (0.622) (0.892)
N 482 482 482 482 482 482 482 482 482 482 482 482Adj R-sq 0.581 0.342 0.161 0.203 0.286 0.338 0.109 0.180 0.270 0.096 0.445 0.398
Notes: 1)t-statistics clustered at GP level in parenthesis2) Block fixed effects included in regression3) Days with medical practitioner variable from facilities questionnaire, all other variables from PRA questionaire4) All measures of GP activism are standardized across all villages, less the Overall measure, which is an average of standardized measures from PRA5) Variables included in regression but not reported: reservation for SCST, double reservation women/SCST, fraction SCST, pradhan age, pradhan political experience, pradhan landholding, pradhan wealthy, fraction upper caste land in village, fraction landless households in village, pradhan's village, literacy rate, gini coefficient6) Significant coefficients in bold

Table 11.4 Effect of women's reservation: Interaction with political experienceDays with medical
practitionerOverall GP
activismGP activism in
waterGP activism in
educationGP activism in
healthGP activism in
roadsGP activism in
transportGP activism in
sanitationGP activism in
electricityGP activism in
irrigationMet higher Panchayat
Faced Problems
Reservation for Women -0.073 -0.148 -0.312 0.337 -0.043 -0.205 -0.268 -0.444 0.059 -0.310 -0.547 -0.296(0.637) (2.094) (1.890) (2.577) (0.352) (1.346) (1.933) (2.815) (0.535) (1.716) (2.153) (1.282)
Pradhan Political Exp 0.141 -0.016 -0.332 0.043 0.192 0.141 -0.018 -0.079 -0.004 -0.069 0.119 -0.492(1.352) (0.160) (1.510) (0.239) (1.329) (0.731) (0.118) (0.323) (0.028) (0.339) (0.495) (1.777)
Women res. * Political Exp 0.052 0.250 0.423 -0.180 0.148 0.221 0.314 0.683 -0.050 0.443 0.471 0.248(0.264) (2.279) (1.719) (0.860) (0.574) (1.147) (1.516) (2.877) (0.256) (1.583) (1.179) (0.704)
N 482 482 482 482 482 482 482 482 482 482 482 482Adj R-sq 0.578 0.347 0.148 0.198 0.266 0.339 0.113 0.192 0.269 0.098 0.434 0.399
Notes: 1)t-statistics clustered at GP level in parenthesis2) Block fixed effects included in regression3) Days with medical practitioner variable from facilities questionnaire, all other variables from PRA questionaire4) All measures of GP activism are standardized across all villages, less the Overall measure, which is an average of standardized measures from PRA5) Variables included in regression but not reported: reservation for SCST, double reservation women/SCST, fraction SCST, pradhan age, pradhan education, pradhan landholding, pradhan wealthy, fraction upper caste land in village, fraction landless households in village, pradhan's village, literacy rate, gini coefficient6) Significant coefficients in bold

Table 11.5 Effect of Women's Reservation: Interaction with Upper Caste Land ProportionDays with medical
practitionerOverall GP
activismGP activism in
waterGP activism in
educationGP activism in
healthGP activism in
roadsGP activism in
transportGP activism in
sanitationGP activism in
electricityGP activism in
irrigationMet higher Panchayat
Faced Problems
Reservation for Women -0.065 0.059 0.065 0.279 0.108 -0.078 -0.037 -0.002 0.192 -0.058 -0.227 -0.140(0.606) (0.816) (0.447) (1.997) (0.740) (0.552) (0.256) (0.016) (1.469) (0.310) (1.218) (0.780)
Upper Caste Land Prop. -0.375 0.047 0.166 -0.084 0.057 -0.071 0.274 0.029 0.154 -0.152 0.344 0.098(3.167) (0.485) (0.861) (0.519) (0.422) (0.446) (1.059) (0.168) (0.707) (0.628) (1.728) (0.514)
Women res. * Upper Prop. 0.088 -0.285 -0.596 -0.175 -0.286 -0.024 -0.239 -0.265 -0.669 -0.026 -0.250 -0.082(0.385) (1.947) (1.678) (0.487) (0.752) (0.064) (0.781) (0.832) (2.246) (0.085) (0.630) (0.223)
N 482 482 482 482 482 482 482 482 482 482 482 482Adj R-sq 0.578 0.344 0.147 0.197 0.266 0.338 0.111 0.180 0.274 0.093 0.429 0.397
Notes: 1)t-statistics clustered at GP level in parenthesis2) Block fixed effects included in regression3) Days with medical practitioner variable from facilities questionnaire, all other variables from PRA questionaire4) All measures of GP activism are standardized across all villages, less the Overall measure, which is an average of standardized measures from PRA5) Variables included in regression but not reported: reservation for SCST, double reservation women/SCST, fraction SCST, pradhan age, pradhan education, pradhan landholding, pradhan wealthy, pradhan political experience, fraction landless households in village, pradhan's village, literacy rate, gini coefficient6) Significant coefficients in bold

Table 12.1 Effect of women's reservation: State effectsDays with medical
practitionerOverall GP
activismGP activism in
waterGP activism in
educationGP activism in
healthGP activism in
roadsGP activism in
transportGP activism in
sanitationGP activism in
electricityGP activism in
irrigationMet higher Panchayat
Faced Problems
Andhra Pradesh -1.336 0.389 0.291 0.470 -0.120 1.081 0.398 0.382 0.187 0.427 -1.317 -0.431(6.351) (1.654) (0.780) (0.962) (0.429) (3.132) (1.116) (1.072) (0.690) (1.210) (4.350) (1.020)
Karnataka -1.249 0.117 0.424 0.147 -0.558 0.558 0.064 0.202 0.324 -0.222 -0.225 -0.856(6.493) (0.746) (1.740) (0.473) (3.876) (2.329) (0.409) (1.009) (1.491) (1.101) (1.069) (3.281)
Tamil Nadu -1.439 -0.054 -0.007 0.105 -0.195 -0.170 -0.015 -0.407 0.155 0.105 -0.477 -0.845(7.578) (0.305) (0.023) (0.292) (0.942) (0.643) (0.075) (1.512) (0.679) (0.366) (2.141) (2.384)
Reservation for SCST 0.059 0.019 0.040 -0.247 -0.086 -0.069 -0.022 0.171 0.457 -0.095 0.221 0.172(0.523) (0.194) (0.238) (1.483) (0.629) (0.466) (0.146) (0.856) (2.253) (0.579) (0.820) (0.684)
Fraction SCST -0.306 0.064 0.052 0.025 -0.127 0.040 0.119 0.189 0.110 0.103 -0.493 0.196(2.177) (0.523) (0.274) (0.111) (0.699) (0.237) (0.600) (1.206) (0.630) (0.344) (2.844) (0.872)
Reservation for Women -0.038 -0.065 -0.195 0.103 0.016 -0.062 -0.150 -0.118 -0.010 -0.102 -0.363 -0.098(0.308) (1.395) (1.829) (0.806) (0.117) (0.595) (1.590) (0.977) (0.090) (0.590) (1.612) (0.646)
Res. for SCST Women -0.026 -0.115 0.097 -0.313 -0.169 0.147 0.078 -0.381 -0.028 -0.349 -0.233 0.043(0.137) (0.952) (0.367) (1.091) (0.810) (0.869) (0.299) (1.160) (0.169) (2.156) (0.732) (0.144)
Pradhan Young 0.279 0.139 0.273 0.010 0.211 0.203 0.203 0.013 -0.065 0.268 0.273 0.771(2.383) (1.352) (1.774) (0.051) (1.669) (1.074) (0.886) (0.082) (0.400) (1.614) (1.014) (3.184)
Pradhan Prime 0.086 0.176 0.403 0.062 0.075 0.244 0.113 0.066 0.118 0.331 0.196 0.507(1.196) (2.383) (2.875) (0.410) (0.819) (2.037) (0.832) (0.522) (1.306) (2.212) (0.998) (2.969)
Pradhan 5-10 edu yrs 0.044 -0.009 0.010 -0.077 0.055 0.008 0.105 -0.197 0.151 -0.128 0.100 -0.684(0.533) (0.135) (0.080) (0.471) (0.620) (0.068) (0.601) (1.623) (1.106) (1.013) (0.486) (3.520)
Pradhan 10-15 edu yrs -0.151 0.102 0.154 0.211 0.172 0.059 0.054 -0.018 0.309 -0.123 0.100 -0.729(1.434) (1.268) (0.889) (1.184) (1.439) (0.406) (0.322) (0.145) (1.844) (1.127) (0.555) (3.324)
Pradhan 15+ edu yrs -0.173 -0.060 0.418 -0.149 0.127 -0.091 -0.316 -0.367 0.213 -0.312 0.337 -0.992(1.507) (0.381) (1.219) (0.377) (0.554) (0.424) (1.330) (1.260) (0.763) (1.427) (1.353) (3.038)
Pradhan wealthy 0.167 -0.064 -0.042 -0.299 -0.227 -0.010 -0.106 0.069 0.048 0.051 0.058 0.342(2.262) (0.888) (0.310) (2.708) (2.158) (0.104) (0.775) (0.444) (0.274) (0.487) (0.403) (1.755)
Pradhan Landholding -0.002 0.002 0.007 0.006 0.013 -0.004 -0.003 0.004 0.001 -0.004 -0.001 0.013(0.646) (0.398) (0.830) (0.445) (1.371) (0.646) (0.330) (0.325) (0.142) (0.388) (0.107) (1.675)
Pradhan Political Exp -0.015 0.091 -0.242 0.118 0.362 0.193 0.125 0.052 -0.039 0.161 0.024 -0.243(0.159) (0.892) (1.011) (0.651) (2.494) (1.270) (0.793) (0.171) (0.246) (0.682) (0.126) (0.824)
Upper caste land prop -0.453 0.087 0.048 0.053 0.063 0.122 0.244 0.086 0.125 -0.043 0.246 -0.011(3.726) (1.096) (0.301) (0.368) (0.493) (0.724) (1.051) (0.535) (0.656) (0.207) (1.207) (0.074)
Low Gini -0.167 -0.008 0.252 -0.114 0.133 -0.134 -0.090 0.032 -0.198 0.058 0.086 -0.105(2.437) (0.122) (1.891) (0.815) (1.272) (1.164) (0.583) (0.254) (1.524) (0.385) (1.140) (0.775)
High Gini 0.287 -0.061 -0.298 0.200 -0.307 -0.016 -0.087 -0.057 0.076 0.002 0.120 -0.033(2.186) (0.884) (1.462) (0.969) (2.462) (0.097) (0.470) (0.333) (0.412) (0.012) (0.809) (0.175)
Literacy rate 1.050 0.443 -0.055 0.120 0.096 1.527 0.872 -0.476 1.345 0.116 -0.285 -1.295(2.853) (1.822) (0.093) (0.188) (0.243) (3.600) (1.948) (1.035) (1.719) (0.260) (0.487) (1.791)
Pradhan's Village 0.191 0.169 0.206 0.138 0.160 0.292 0.223 0.201 0.122 0.006 0.036 0.038(2.213) (3.835) (2.057) (1.251) (1.895) (3.751) (1.914) (2.079) (1.724) (0.060) (1.078) (1.104)
Fraction landless hhs -0.189 0.298 1.161 -0.099 0.585 0.102 0.047 0.367 0.276 -0.058 -0.156 -0.416(0.804) (1.808) (3.293) (0.269) (1.699) (0.301) (0.108) (1.343) (0.704) (0.151) (0.466) (1.067)
N 464 464 464 464 464 464 464 464 464 464 464 464Adj R-sq 0.549 0.204 0.073 0.027 0.232 0.276 0.052 0.125 0.206 0.048 0.361 0.288Notes: 1)t-statistics clustered at block level in parenthesis2) Block pair fixed effects included in regression3) Days with medical practitioner variable from facilities questionnaire, all other variables from PRA questionaire4) All measures of GP activism are standardized across all villages, less the Overall measure, which is an average of standardized measures from PRA5) Significant coefficients in bold

Table 12.2 Effect of women's reservation: State InteractionsDays with medical
practitionerOverall GP
activismGP activism in
waterGP activism in
educationGP activism in
healthGP activism in
roadsGP activism in
transportGP activism in
sanitationGP activism in
electricityGP activism in
irrigationMet higher Panchayat
Faced Problems
Andhra Pradesh -1.324 0.442 0.260 0.559 -0.050 1.196 0.445 0.479 0.271 0.373 -1.462 -0.377(5.186) (1.805) (0.640) (1.120) (0.165) (3.619) (1.190) (1.291) (0.972) (1.055) (4.877) (0.871)
Karnataka -1.187 0.095 0.388 0.170 -0.577 0.592 0.037 0.173 0.393 -0.414 -0.375 -0.750(4.956) (0.544) (1.404) (0.541) (3.055) (2.412) (0.214) (0.730) (1.732) (2.039) (1.903) (2.745)
Tamil Nadu -1.349 -0.043 0.011 0.137 -0.197 -0.063 -0.005 -0.402 0.224 -0.050 -0.541 -0.754(5.283) (0.216) (0.034) (0.373) (0.744) (0.229) (0.024) (1.397) (0.885) (0.167) (2.510) (1.963)
Reservation for Women 0.130 -0.028 -0.195 0.208 0.043 0.178 -0.120 -0.068 0.169 -0.442 -0.595 0.110(0.376) (0.301) (0.798) (0.791) (0.137) (1.134) (0.752) (0.304) (0.854) (3.010) (2.406) (0.464)
Women res. * AP 0.293 -0.615 0.098 -0.701 -0.779 -0.827 -0.590 -1.083 -0.367 -0.673 0.494 0.140(0.765) (2.331) (0.183) (1.171) (1.835) (3.242) (2.130) (2.016) (1.240) (1.546) (1.544) (0.305)
Women res. * KA -0.284 0.185 0.256 -0.069 0.158 -0.028 0.211 0.240 -0.324 1.036 0.844 -0.550(0.701) (1.073) (0.778) (0.205) (0.309) (0.112) (0.737) (0.679) (1.079) (2.162) (1.559) (1.342)
Women res. * TN -0.342 -0.077 -0.200 -0.069 0.007 -0.439 -0.085 -0.036 -0.178 0.383 -0.069 -0.229(0.917) (0.637) (0.707) (0.222) (0.022) (2.221) (0.446) (0.143) (0.726) (1.892) (0.165) (0.580)
N 464 464 464 464 464 464 464 464 464 464 464 464Adj R-sq 0.552 0.215 0.070 0.024 0.234 0.280 0.050 0.132 0.203 0.072 0.377 0.290
Notes: 1)t-statistics clustered at block level in parenthesis2) Block pair fixed effects included in regression3) Days with medical practitioner variable from facilities questionnaire, all other variables from PRA questionaire4) All measures of GP activism are standardized across all villages, less the Overall measure, which is an average of standardized measures from PRA5) Variables included in regression but not reported: reservation for SCST, double reservation women/SCST, fraction SCST, pradhan age, pradhan education, pradhan landholding, pradhan wealthy, pradhan political experience, fraction upper caste land, fraction landless households in village, pradhan's village, literacy rate, gini coefficient6) Significant coefficients in bold