Together Creating Tomorrow - Al Ameen … · UBL Children Savings Plan Director Operations Office...
27
Together Creating Tomorrow Quarterly Report March 31, 2018 Together Creating Tomorrow
Transcript of Together Creating Tomorrow - Al Ameen … · UBL Children Savings Plan Director Operations Office...

TogetherCreatingTomorrow
Quarterly Report March 31, 2018
Together Creating Tomorrow

CORPORATE INFORMATION
Board of Directors
Azhar Hamid Chief Financial Officer Al- Ameen Islamic Financial Planning Fund - II
Chairman Umair Ahmed Launch Date: 21 February 2017
Yasir Qadri UBL Capital Protected Fund - III
Chief Executive Officer Company Secretary Launch Date: 26 January 2017
Fawaz Taj Siddiqui
Syed Furrukh Zaeem UBL Financial Planning Fund
Director Launch Date: 28 September 2017
Zia Ijaz Registered Office Conventional Investment Plans
Director 4th Floor, STSM Building, UBL Mahana Munafa Plan
Beaumont Road, Civil Lines,
Sharjeel Shahid Karachi, Pakistan. UBL Children Savings Plan
Director
Operations Office UBL Equity Builder Plan4th Floor, STSM Building,
Mirza Muhammad Sadeed Beaumont Road, Civil Lines, UBL Wealth Builder PlanHassan Barlas - Director Karachi, Pakistan.
UAN: (92-21) 111-825-262Naz Khan Fax: (92-21) 32214930 Islamic Investment Plans
Director Al-Ameen Mahana Munafa Plan
Date of incorporation of the Management
Company/ Pension Fund Manager Al-Ameen Children Savings Plan
Audit Committee Incorporated in Pakistan on
Naz Khan 3 April 2001 as a Public Limited Al-Ameen Equity Builder Plan
Chair Company under the Companies
Ordinance, 1984 Al-Ameen Wealth Builder Plan Zia Ijaz
Member Management Quality Rating Al-Ameen Hajj Savings Plan
AM1 by JCR-VIS Credit Rating Company
Sharjeel Shahid
Member Funds Under Management
UBL Liquidity Plus Fund
Mirza Muhammad Sadeed Launch Date: 21 June 2009
Hassan Barlas
Member UBL Government Securities Fund
Launch Date: 27 July 2011
UBL Money Market Fund Launch Date: 14 October 2010
Risk Management Committee
Mirza Muhammad Sadeed Barlas UBL Income Opportunity Fund
Chairman Launch Date: 29 March 2013
Syed Furrukh Zaeem
Member UBL Growth & Income Fund
(Formerly United Growth & Income Fund)
Yasir Qadri Launch Date: 2 March 2006Member
UBL Asset Allocation Fund
Azhar Hamid Launch Date: 20 August 2013
Member UBL Stock Advantage Fund
Sharjeel Shahid Launch Date: 4 August 2006
Member Al-Ameen Islamic Sovereign Fund
Launch Date: 07 November 2010
HR & Compensation Committee Al-Ameen Islamic Aggressive Income Fund
Azhar Hamid Launch Date: 20 October 2007
Chairman
Al-Ameen Islamic Cash Fund
Naz Khan Launch Date: 17 September 2012
Member
Al-Ameen Shariah Stock Fund
Syed Furrukh Zaeem Launch Date: 24 December 2006Member
Al-Ameen Islamic Asset Allocation FundZia Ijaz Launch Date: 10 December 2013
Member
Al- Ameen Islamic Financial Planning Fund
Yasir Qadri Launch Date: 23 June 2015
Member
UBL Retirement Savings Fund
Shariah Advisory Board Launch Date: 10 May 2010
Mufti Muhammad Hassaan Kaleem
Member Al-Ameen Islamic Retirement Savings Fund
Launch Date: 10 May 2010
Mufti Muhammad Najeeb Khan
Member Al-Ameen Islamic Dedidcated Equity Fund
Launch Date: 05 Jan 2016
Directors’ Review Report The Board of Directors of UBL Fund Managers Limited is pleased to present to you the report of “Al-Ameen Islamic Retirement Savings Fund (AIRSF) for the nine months period ended March 31, 2018.
Economy & Money Market Review – 9MFY18 Pakistan’s economy continued on its growth momentum during nine months of FY18 with encouraging prospects to record a GDP growth rate over 5% for FY18. The main highlights for this strong momentum were low inflation, strong growth in private sector credit offtake along with staggering growth in the manufacturing sector. However, rising industrial expansion and growing domestic demand triggered a surge in imports resulting in a high current account deficit. In a bid to counter macroeconomic concerns, GoP introduced policy action for discouraging imports via currency devaluation and higher tariffs on imported items. The ~10% PKR devaluation is expected to perform two folds; incentivizing export oriented sectors and discourage import trend. While the proposed regulatory duty was challenged in court, it is expected to come in effect soon. These measures along with further policy actions are expected to address ailing external account and aid the robust growth momentum over the medium term. Large Scale Manufacturing (LSM) Index continued its strong momentum posting a growth of 6.2% during 8MFY18. Growth was primarily driven by Electronics (+39%), Iron & Steel (+31%) and Automobile (+20%) sectors. The Private sector credit offtake also remained robust, rising by 16.9%YoY in Feb’18. Inflation for 9MFY18 averaged to 3.8%YoY against 4.0% in the same period last year. The average CPI on FYTD basis stands well within SBP’s full year inflation target of 6.0%. We expect this trend of benign inflation to continue for the up-coming month. However, impact of currency devaluation followed by food inflationary pressures during the month of Ramadan should push inflation upwards by year end. After a 20-month long monetary easing cycle, SBP increased discount rate by 25bps to 6.5% in its Jan’18 monetary policy. SBP took this pre-emptive measure citing concerns of overheating of the economy. However, in its Mar’18 MP meeting SBP decided to keep discount rate unchanged at 6.5% stating low inflation along with confidence in recent policy action to address CAD. We expect interest rate hike of 50-75bps in CY18 as the inflationary impact of PKR devaluation and high oil prices sets in. The current account position continued to deteriorate reaching a deficit of USD 10.8bn in 8MFY18. The widening deficit was mainly on account of high trade deficit (+23%). Despite the positive development on export side (+13%YoY) external account position continues to remain challenging for the authorities warranting additional policy measures. We expect the corrective currency devaluation measure to aid in strengthening of exports and discourage unnecessary import trends providing respite to overall external account position. At the end of 9MFY18 the country’s foreign reserves stood at USD 17.8bn at the end of Mar'18. Despite having raised USD 2.5bn from issue of Eurobond and Sukuk in the last quarter, the GoP was not able to maintain its foreign reserves. The GoP recorded a +15.5% growth in its provisional net-revenue-collection for 9MFY18 accumulating PKR 2.6trn. Recently, the GoP announced a tax amnesty scheme to encourage tax evaders to disclose their undeclared local and foreign assets and become part of tax net in a window of 3-months. This move is expected to bring in one-off revenue collection of USD 3-5bn. More importantly, it could lead to improvement in documentation of the economy. Integration of undocumented sector into mainstream economy will yield multiple benefits such as improvement in Government’s tax revenues, reduction in saving to investment gap and improve transmission of monetary and fiscal policies. Moreover, Government’s plan to mobilize external flows will play a pivotal role in preserving adequate level of foreign exchange reserves. During 9MFY18, yields on short and long term tenor witnessed changes in line with SBP’s interest rates hike of 25 bps. Yields on T-Bills for 3M, 6M and 12M tenor increased by 21bps, 35bps and 46bps respectively while yields on 3-year, 5-year and 10-year bonds increased by 113bps, 100bps and 36bps respectively. The Government in nine PIB auctions was only able to raise

PKR 52.4bn while it raised PKR 12.0trn from T-Bills. Until Jun’18, the government has planned to raise PKR 4.0trn through T-bills auctions and PKR 200bn through PIB auction. The economy is well set on its path to achieve robust growth of above 5% in this fiscal year. The timely advancements into CPEC related activities are also set to boost further foreign investments in the country. Concerns related to macroeconomic stability stands as a key risk to this growth momentum. However, renewed interest and corrective policy measures to address macroeconomic risks will bode positive results in the medium term. This resolve has also been endorsed by IMF. Stock Market Review – 9MFY18 After undergoing a round of bear-run during the first half of the fiscal year amid high uncertainty the market has recovered remarkably. The rally in the out-going quarter (+12.6%) brought a significant recovery of +20.2% from its low and aided the overall index to bring the FYTD loss down to 2.2%. The market’s rally was prompted by ease in political tensions, appointment of Finance Advisor for PM, essential policy action (~10% currency devaluation) to address external account position, smooth senate elections, announcement of tax amnesty scheme along with strong growth in the manufacturing sector. At the end of 9MFY18 foreign investors stood as net sellers of USD 124mn. The selling pressure was mainly absorbed by local institutions of Insurance Sector and Companies buying shares worth USD 104mn and USD 94mn respectively. Moreover, trading activity dropped by 46.4%YoY as average daily trade volume reached 81mn in 9MFY18 against 151mn SPLY. However, in light of the positive events, lost investor confidence was revived resulting in a healthy average daily trade volume of 87.3mn shares during the quarter and also turned foreign investors to net-buyers of USD 31.2mn. In recent developments, uncertainty kept global investors cautious on account of US Fed’s interest rates hike of 25bps along with imminent trade war. We believe escalated tensions on global front will further give rise to volatility in markets. International Oil prices increased to USD 70/barrels at the end of Mar’18, averaging to USD 60.2/barrels in 9MFY18. The high price was primarily due to tight compliance between OPEC and Non-OPEC members to cut production. We expect high oil prices to remain a key risk to the weakening current account situation and strong growth momentum. In the upcoming months, market will take direction from Budget FY19 and upcoming general elections. We expect political noise to affect short-term market performance. However, once elections are held, the elected party will have a fresh opportunity to address structural reform issues. We expect broad economic agenda to remain intact despite any changes at the political level. The liquidity created through recent relief in income taxes is expected to energize interest in stock market. We believe corrective measures and reforms on the macroeconomic front will uphold economy on a sustained growth path. Furthermore, increasing per capita income, ongoing infrastructure development along with timely execution of CPEC projects is expected to fuel demand in construction and allied sectors. In this regard, corporate earnings growth is also anticipated to remain strong over the next two years. Fund performance and operational review Al-Ameen Islamic Retirement Savings Fund The Fund comprises of three sub funds namely Equity sub-fund, Debt sub-fund and Money Market sub-fund. The Fund as a whole incurred a net loss after tax of PKR 132.712 million during the nine months period ended March 31, 2018 and fund size stood at PKR 2,501 million as at March 31, 2018.
Al-Ameen Islamic Retirement Savings Fund ESF DSF MMSF
Rupees in million
Gross Income/(loss) (PKR Mn) (130.143) 17.256 12.225
Net Profit/(loss) After Tax (PKR Mn) (150.195) 9.013 8.470
Fund Size as of March 31 '18 (PKR Mn) 1,556 571 374
NAV as of March 31 '18 (PKR) 679.07 161.84 156.54
FYTD Return (%) 26.94% 5.10% 4.56%

The table below illustrates the returns an investor would have earned depending on their portfolio allocations. With the rally witnessed in the equity markets during the year, it’s not surprising that the high-volatility portfolio has generated the highest return
Allocations ESF DSF MMSF
High Volatility 80% 20% 0%
Medium volatility 50% 40% 10%
Low volatility 25% 60% 15%
Lower volatility 0% 60% 40%
Al-Ameen Islamic Retirement Savings Fund
High Volatility
Medium volatility
Low volatility
Lower volatility
Since Inception % p.a. 12 Month Rolling
6.5%
13.5%
20.3%
28.5%
3.8%
14.8%
25.7%
38.8%
Future Outlook
We maintain a positive outlook on the local equity market in the short to medium-term. We believe remedial policy measures and reforms on the macroeconomic front will support economy on a sustained growth path. Furthermore, infrastructural development projects and timely execution of CPEC projects is expected to generate further interest in construction and allied sector. The local equity market currently trades at an earnings yield of ~10%, offering nearly ~400bps premium over T-bills. We believe fundamentals of the stock market are intact, growth in corporate earnings; revival of distressed units, ongoing expansion stories by different sectors and potential investments in new business opportunities should bode well for the equity market. Low yields on fixed income instruments and the positive outlook of the country’s economy make it all the more important for investors to allocate a portion of their portfolios to equity. Acknowledgements We would like to thank our valued unit holders for their confidence and trust in UBL Fund Managers Limited. In addition, we would like to acknowledge the Securities and Exchange Commission of Pakistan, State Bank of Pakistan, the Shariah Advisory Board and Central Depository Company Limited (Trustee) for their continued support, guidance and cooperation. The Board also likes to take this opportunity to express its appreciation to the employees for their dedication, commitment, enthusiasm and hard work. FOR & ON BEHALF OF THE BOARD Yasir Qadri CHIEF EXECUTIVE OFFICER Karachi, Dated: April 26, 2018

INVESTMENT OBJECTIVE
Pension Fund Manager UBL Fund Managers Limited
Central Depository Company of Pakistan Limited
99-B, Block-B, S.M.C.H.S., Main Shahra-e-Faisal,
Karachi. Tel: (9221) 111-111-500
United Bank Limited
(for detail of others, please visit our website:
www.ublfunds.com.pk)
Auditors Deloitte Yousuf Adil
Bankers Bank Al Baraka Limited
Bank Alfalah Limited
Bank Alhabib
BankIslami Pakistan Limited
Faysal Bank Limited- Islamic Banking
Habib Bank Limited
Habib Metropolitan Bank Limited- Islamic Banking
Muslim Commercial Bank
Meezan Bank Limited
National Bank of Pakistan
Soneri Bank Limited
United Bank Limited
Management Co. Rating AM1 (JCR‐VIS)
Distribution Company
AIRSFAl-Ameen Islamic Retirement Savings Fund
AIRSF is a Shariah‐compliant open‐end fund that aims to provide a secure source of
savings and regular income after retirement to the Participants. The Participants would
contribute to the Fund during their working life and would typically withdraw from the
Fund on or after retirement.
Trustee

AL-AMEEN ISLAMIC RETIREMENT SAVINGS FUND
CONDENSED INTERIM STATEMENT OF ASSETS AND LIABILITIES
As at March 31, 2018
Note
Equity Debt Money Market Equity Debt Money Market
Sub-Fund Sub-Fund Sub-Fund Sub-Fund Sub-Fund Sub-Fund
ASSETS
Bank balances 4 150,010 372,836 173,771 696,617 218,725 66,425 222,003 507,153
Term Deposit Musharka - 20,000 144,000 164,000 - - - -
Investments 5 1,415,362 173,772 49,995 1,639,129 1,483,018 406,130 50,995 1,940,143
Advance Tax 6 510 235 142 887 510 233 131 874
Dividend and other receivables 22,168 10,303 14,239 46,710 42,421 15,353 9,423 67,197
TOTAL ASSETS 1 1,588,050 577,146 382,147 2,547,343 1,744,674 488,141 282,552 2,515,367
LIABILITIES
Payable to UBL Fund Managers
Limited - Pension Fund Manager 2,511 1,153 596 4,260 3,250 1,047 430 4,727
Payable to Central Depository
Company of Pakistan - Trustee 174 67 44 285 188 56 30 274
Payable to the Securities and Exchange
Commission of Pakistan 366 137 79 582 477 144 75 696
Accrued expenses and other liabilities 7 28,823 5,073 7,040 40,936 24,520 4,570 2,279 31,369
TOTAL LIABILITIES 3 31,874 6,430 7,759 46,063 28,435 5,817 2,814 37,066
NET ASSETS 1,556,176 570,716 374,388 2,501,280 1,716,239 482,324 279,738 2,478,301
PARTICIPANTS' SUB-FUNDS
(AS PER STATEMENT ATTACHED) 1,556,176 570,716 374,388 2,501,280 1,716,239 482,324 279,738 2,478,301
CONTINGENCIES AND COMMITMENTS 8
NUMBER OF UNITS IN ISSUE 9 2,291,611 3,526,379 2,391,677 2,333,120 3,028,072 1,828,383
NET ASSET VALUE PER UNIT 679.07 161.84 156.54 735.60 159.28 153.00
The annexed notes from 1 to 15 form an integral part of this condensed interim financial information.
Chief Executive Officer Chief Financial Officer Director
SD SD SD
March 31, 2018
(Unaudited)
Total Total
June 30, 2017
(Audited)
------------------------------------------------------------------------- (Rupees in "000') -------------------------------------------------------------------------
For UBL Fund Managers Limited
(Pension Fund Manager)
------------------------------------------------------(Number of Units)---------------------------------------------------
---------------------------------------------------------(Rupees)------------------------------------------------------------

AL-AMEEN ISLAMIC RETIREMENT SAVINGS FUND
CONDENSED INTERIM INCOME STATEMENT (UNAUDITED)
For the nine months period ended March 31, 2018
Note
Equity Debt Money Market Total Equity Debt Money Market Total
Sub-Fund Sub-Fund Sub-Fund Sub-Fund Sub-Fund Sub-Fund
Income
Financial income 4,029 23,247 13,225 40,501 2,114 17,403 9,014 28,531
Capital (loss) / gain on sale of investments - net (73,160) (3,393) - (76,553) 175,378 (115) - 175,263
Dividend income 51,714 - - 51,714 32,143 - - 32,143
Other income 64 1 - 65 - - - -
(17,353) 19,855 13,225 15,727 209,635 17,288 9,014 235,937
Unrealised (loss) / gain on remeasurement of investments classified
as financial assets at fair value through profit or loss - net (112,790) (2,599) (1,000) (116,389) 197,367 1,867 280 199,514
(130,143) 17,256 12,225 (100,662) 407,002 19,155 9,294 435,451
Expenses
Remuneration to UBL Fund Managers - Pension Fund Manager 16,624 6,237 3,601 26,462 15,354 4,832 2,414 22,600
Sales tax on Pension Fund Manager's remuneration 2,161 811 468 3,440 1,996 628 314 2,938
Remuneration of Central Depository Company of Pakistan - Trustee 1,520 571 330 2,421 1,443 456 227 2,126
Annual fee of Securities and Exchange Commission of Pakistan 366 137 79 582 338 106 53 497
Auditors' remuneration 84 84 84 252 89 89 89 267
Securities transaction costs 665 77 7 749 4,684 9 - 4,693
Custody and settlement charges 574 6 - 580 1,188 4 - 1,192
Printing expense 7 7 7 21 - - - -
Bank and other charges 731 89 83 903 571 81 72 724
22,732 8,019 4,659 35,410 25,663 6,205 3,169 35,037
Net income for the period from operating activities (152,875) 9,237 7,566 (136,072) 381,339 12,950 6,125 400,414
Element of income / (loss) and capital gains / (losses) included
in the prices of units issued less those in units redeemed - net 2,680 (43) 1,074 3,711 14,794 (827) 1,640 15,607
Reversal / (Provision) for Workers' Welfare Fund - - - - 4,616 518 296 5,430
Provision for Sindh Workers' Welfare Fund 7.2 - (181) (170) (351) (7,859) (248) (158) (8,265)
Net income for the period before taxation (150,195) 9,013 8,470 (132,712) 392,890 12,393 7,903 413,186
Taxation 11 - - - - - - - -
Net income for the period after taxation (150,195) 9,013 8,470 (132,712) 392,890 12,393 7,903 413,186
The annexed notes from 1 to 15 form an integral part of this condensed interim financial information.
Chief Executive Officer Chief Financial Officer Director
SD SD SD
Nine months period ended
March 31, 2018
Nine months period ended
March 31, 2017 (audited)
--------------------------------------------------------------------------------- (Rupees in "000') ---------------------------------------------------------------------------------
For UBL Fund Managers Limited
(Pension Fund Manager)

AL-AMEEN ISLAMIC RETIREMENT SAVINGS FUND
CONDENSED INTERIM INCOME STATEMENT (UNAUDITED)
For the quarter ended March 31, 2018
Note
Equity Debt Money Market Total Equity Debt Money Market Total
Sub-Fund Sub-Fund Sub-Fund Sub-Fund Sub-Fund Sub-Fund
Income
Financial income 1,352 7,676 5,228 14,256 712 5,619 3,378 9,709
Capital (loss) / gain on sale of investments - net (9,159) (3,586) - (12,745) 72,352 (115) - 72,237
Dividend income 12,795 - - 12,795 7,657 - - 7,657
Other income 64 1 - 65
5,052 4,091 5,228 14,371 80,721 5,504 3,378 89,603
Unrealised gain / (loss) on remeasurement of investments
classified as financial assets at fair value through profit or loss 109,777 2,502 (360) 111,919 (2,670) (1,895) (550) (5,115)
114,829 6,593 4,868 126,290 78,051 3,609 2,828 84,488
Expenses
Remuneration to UBL Fund Managers - Pension Fund Manager 5,462 2,034 1,369 8,865 5,705 1,544 927 8,176
Sales tax on Pension Fund Manager's remuneration 710 265 178 1,153 742 201 121 1,064
Remuneration to Central Depository Company of Pakistan - Trustee 496 184 124 804 540 133 80 753
Annual fee of Securities and Exchange Commission of Pakistan 120 45 30 195 125 34 20 179
Auditors' remuneration 15 15 15 45 18 18 18 54
Securities transaction costs 142 6 - 148 1,779 5 - 1,784
Custody and settlement charges 140 3 - 143 433 2 - 435
Printing expense 1 1 1 3 - - - -
Bank and other charges 197 33 31 261 148 (11) 31 168
7,283 2,586 1,748 11,617 9,490 1,926 1,197 12,613
Net income for the quarter from operating activities 107,546 4,007 3,120 114,673 68,561 1,683 1,631 71,875
Element of (loss) / income and capital (losses) / gains included in
the prices of units issued less those in units redeemed - net (6,381) 186 236 (5,959) 18,165 (52) 1,034 19,147
Reversal / (Provision) for Workers' Welfare Fund - - - - 4,616 518 296 5,430
Provision for Sindh Workers' Welfare Fund 7.2 - (82) (66) (148) (7,859) (248) (158) (8,265)
Net income for the quarter before taxation 101,165 4,111 3,290 108,566 83,483 1,901 2,803 88,187
Taxation 11 - - - - - - - -
Net income for the quarter after taxation 101,165 4,111 3,290 108,566 83,483 1,901 2,803 88,187
The annexed notes from 1 to 15 form an integral part of this condensed interim financial information.
Chief Executive Officer Chief Financial Officer Director
SD SD SD
Quarter ended
March 31, 2018
Quarter ended
March 31, 2017
--------------------------------------------------------------------------------- (Rupees in "000') ---------------------------------------------------------------------------------
For UBL Fund Managers Limited
(Pension Fund Manager)
AL-AMEEN ISLAMIC RETIREMENT SAVINGS FUND
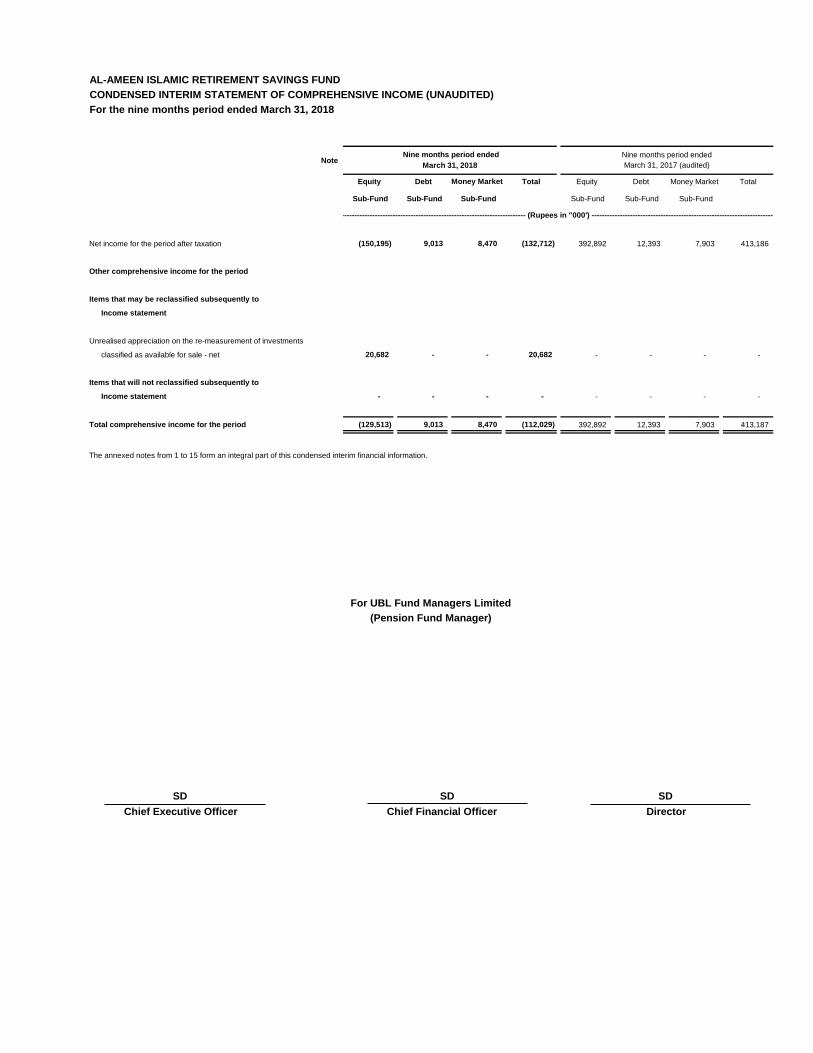
CONDENSED INTERIM STATEMENT OF COMPREHENSIVE INCOME (UNAUDITED)
For the nine months period ended March 31, 2018
Note
Equity Debt Money Market Total Equity Debt Money Market Total
Sub-Fund Sub-Fund Sub-Fund Sub-Fund Sub-Fund Sub-Fund
Net income for the period after taxation (150,195) 9,013 8,470 (132,712) 392,892 12,393 7,903 413,186
Other comprehensive income for the period
Items that may be reclassified subsequently to
Income statement
Unrealised appreciation on the re-measurement of investments
classified as available for sale - net 20,682 - - 20,682 - - - -
Items that will not reclassified subsequently to
Income statement - - - - - - - -
Total comprehensive income for the period (129,513) 9,013 8,470 (112,029) 392,892 12,393 7,903 413,187
The annexed notes from 1 to 15 form an integral part of this condensed interim financial information.
Chief Executive Officer Chief Financial Officer Director
Nine months period ended
March 31, 2017 (audited)
Nine months period ended
March 31, 2018
------------------------------------------------------------------------- (Rupees in "000') -------------------------------------------------------------------------
For UBL Fund Managers Limited
(Pension Fund Manager)
SD SD SD

AL-AMEEN ISLAMIC RETIREMENT SAVINGS FUND
CONDENSED INTERIM STATEMENT OF COMPREHENSIVE INCOME (UNAUDITED)
For the quarter ended March 31, 2018
Note
Equity Debt Money Market Total Equity Debt Money Market Total
Sub-Fund Sub-Fund Sub-Fund Sub-Fund Sub-Fund Sub-Fund
Net income for the quarter after taxation 101,165 4,111 3,290 108,566 83,483 1,901 2,803 88,187
Other comprehensive income for the quarter
Items that may be reclassified subsequently to
Income statement
Unrealised appreciation on the re-measurement of investments
classified as available for sale - net 27,012 - - 27,012 - - - -
Items that will not reclassified subsequently to
Income statement
Total comprehensive income for the quarter 128,177 4,111 3,290 135,578 83,483 1,901 2,803 88,187
The annexed notes from 1 to 15 form an integral part of this condensed interim financial information.
Chief Executive Officer Chief Financial Officer Director
SD SD SD
Quarter ended
March 31, 2018
Quarter ended
March 31, 2017
------------------------------------------------------------------------- (Rupees in "000') -------------------------------------------------------------------------
For UBL Fund Managers Limited
(Pension Fund Manager)
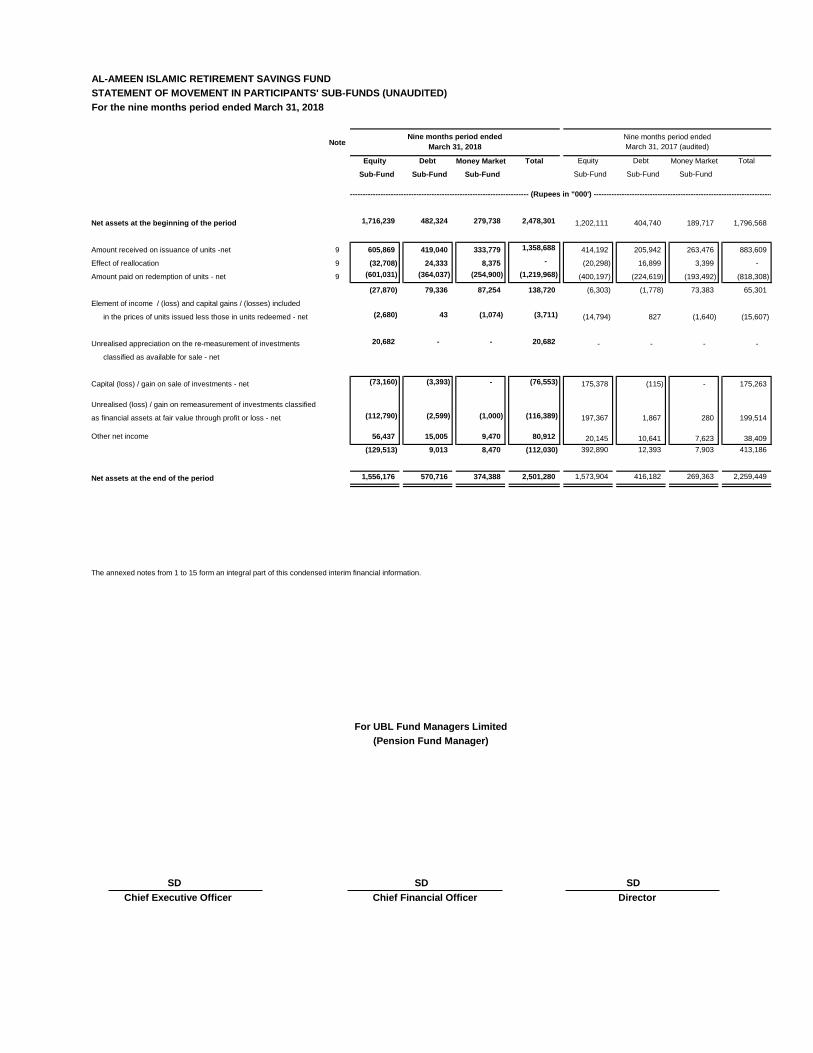
AL-AMEEN ISLAMIC RETIREMENT SAVINGS FUND
STATEMENT OF MOVEMENT IN PARTICIPANTS' SUB-FUNDS (UNAUDITED)
For the nine months period ended March 31, 2018
Note
Equity Debt Money Market Total Equity Debt Money Market Total
Sub-Fund Sub-Fund Sub-Fund Sub-Fund Sub-Fund Sub-Fund
Net assets at the beginning of the period 1,716,239 482,324 279,738 2,478,301 1,202,111 404,740 189,717 1,796,568
Amount received on issuance of units -net 9 605,869 419,040 333,779 1,358,688 414,192 205,942 263,476 883,609
Effect of reallocation 9 (32,708) 24,333 8,375 - (20,298) 16,899 3,399 -
Amount paid on redemption of units - net 9 (601,031) (364,037) (254,900) (1,219,968) (400,197) (224,619) (193,492) (818,308)
(27,870) 79,336 87,254 138,720 (6,303) (1,778) 73,383 65,301
Element of income / (loss) and capital gains / (losses) included
in the prices of units issued less those in units redeemed - net (2,680) 43 (1,074) (3,711) (14,794) 827 (1,640) (15,607)
Unrealised appreciation on the re-measurement of investments 20,682 - - 20,682 - - - -
classified as available for sale - net
Capital (loss) / gain on sale of investments - net (73,160) (3,393) - (76,553) 175,378 (115) - 175,263
Unrealised (loss) / gain on remeasurement of investments classified
as financial assets at fair value through profit or loss - net (112,790) (2,599) (1,000) (116,389) 197,367 1,867 280 199,514
Other net income 56,437 15,005 9,470 80,912 20,145 10,641 7,623 38,409
(129,513) 9,013 8,470 (112,030) 392,890 12,393 7,903 413,186
Net assets at the end of the period 1,556,176 570,716 374,388 2,501,280 1,573,904 416,182 269,363 2,259,449
570,716 374,388 221,354,950
The annexed notes from 1 to 15 form an integral part of this condensed interim financial information.
Chief Executive Officer Chief Financial Officer Director
Nine months period ended
March 31, 2018
Nine months period ended
March 31, 2017 (audited)
------------------------------------------------------------------------- (Rupees in "000') -------------------------------------------------------------------------
For UBL Fund Managers Limited
(Pension Fund Manager)
SD SD SD

AL-AMEEN ISLAMIC RETIREMENT SAVINGS FUND
STATEMENT OF CASH FLOWS (UNAUDITED)
For the nine months period ended March 31, 2018
Equity Debt Money Market Total Equity Debt Money Market Total
Sub-Fund Sub-Fund Sub-Fund Sub-Fund Sub-Fund Sub-Fund
CASH FLOWS FROM OPERATING ACTIVITIES
Net income for the period before taxation (150,195) 9,013 8,470 (132,712) 392,890 12,393 7,903 413,186
Adjustments:
Financial income (4,093) (23,248) (13,225) (40,566) (2,114) (17,403) (9,014) (28,531)
Dividend income (51,714) - - (51,714) (32,143) - - (32,143)
Capital (loss) / gain on sale of investments - net 73,160 3,393 - 76,553 (175,378) 115 - (175,263)
Unrealised (loss) / gain on remeasurement of investments classified
as financial assets at fair value through profit or loss - net 112,790 2,599 1,000 116,389 (197,367) (1,867) (280) (199,514)
Element of income / (loss) and capital gains / (losses) included
in the prices of units issued less those in units redeemed - net (2,680) 43 (1,074) (3,711) (14,794) 827 (1,640) (15,607)
(Reversal) / provision for Workers' Welfare Fund - - - - (4,616) (518) (296) (5,430)
Provision for Sindh Workers' Welfare Fund - 181 170 351 7,859 248 158 8,265
(22,732) (8,019) (4,659) (35,410) (25,663) (6,205) (3,169) (35,037)
(Increase) / decrease in assets
Deposits and other receivables 25,246 6,345 (1,094) 30,497 15,521 9,019 3,555 28,095
Investments - net (97,612) 226,366 - 128,754 17,696 (35,535) 8,000 (9,839)
Term Deposit Musharka - (20,000) (144,000) (164,000) - (25,000) (20,000) (45,000)
(72,366) 212,711 (145,094) (4,749) 33,217 (51,516) (8,445) (26,744)
Increase / (decrease) in liabilities
Payable to UBL Fund Managers Limited - Pension Fund Manager (739) 106 166 (467) 1,540 230 157 1,927
Payable to - Trustee (14) 11 14 11 46 1 9 56
Payable to the Securities and Exchange Commission of Pakistan (111) (7) 4 (114) 50 - (3) 47
Accrued expenses and other liabilities 4,303 322 4,591 9,216 (3,789) 799 303 (2,687)
3,439 432 4,775 8,646 (2,153) 1,030 466 (657)
Financial income received during the period 4,138 21,951 9,492 35,581 1,778 16,067 10,080 27,925
Dividend income received during the period 46,676 - - 46,676 30,589 - - 30,589
Net cash (used in) / generated from operating activities (40,845) 227,075 (135,486) 50,744 37,768 (40,624) (1,068) (3,924)
CASH FLOWS FROM FINANCING ACTIVITIES
Net cash received on issuance of units 605,869 443,373 342,154 1,391,396 414,192 205,942 263,476 883,610
Net cash paid on redemption of units (633,739) (364,037) (254,900) (1,252,676) (420,494) (207,720) (190,093) (818,307)
Net cash (used in) / generated from financial activities (27,870) 79,336 87,254 138,720 (6,302) (1,778) 73,383 65,303
Net increase in cash and cash equivalents (68,715) 306,411 (48,232) 189,464 31,466 (42,402) 72,315 61,379
Cash and cash equivalents at beginning of the period 218,725 66,425 222,003 507,153 107,053 71,423 47,512 225,988
Term Deposit Musharka - 20,000 144,000 164,000 - 105,000 100,000 205,000
Cash and cash equivalents at end of the period 150,010 392,836 317,771 860,617 138,519 134,021 219,827 492,367
The annexed notes from 1 to 15 form an integral part of this condensed interim financial information.
Chief Executive Officer Chief Financial Officer Director
SD SD SD
For UBL Fund Managers Limited
(Pension Fund Manager)
Nine months period ended
March 31, 2018
Nine months period ended
March 31, 2017 (audited)
--------------------------------------------------------------------------------- (Rupees in "000') ---------------------------------------------------------------------------------

AL-AMEEN ISLAMIC RETIREMENT SAVINGS FUND
NOTES TO THE CONDENSED INTERIM FINANCIAL INFORMATION (UN-AUDITED)
1. LEGAL STATUS AND NATURE OF BUSINESS
-
-
-
Al-Ameen Islamic Retirement Savings Fund ("the Fund") has been established under the Voluntary Pension System
Rules, 2005 (the VPS Rules) and has been approved as a pension fund by the Securities and Exchange Commission of
Pakistan (SECP) on January 29, 2010. It has been constituted under a Trust Deed, dated November 17, 2009, between
UBL Fund Managers Limited as the Pension Fund Manager, a company incorporated under the Companies Ordinance,
1984 and the MCB Financial Services Limited as the Trustee. The trusteeship of the Fund was transferred to Central
Depository Company Of Pakistan Limited (CDC) (the Trustee) effective from March 31, 2014 through a supplemental
trust deed dated February 21, 2014. The title to the assets of the Fund is held in the name of the Trustee.
The Fund is a pension fund and offers units for public subscription on a continuous basis. The units are non-transferable
except in the circumstances mentioned in the VPS Rules and can be redeemed by surrendering to the Fund. As per the
offering document the Fund cannot distribute any income from the Fund whether in cash or otherwise.
The Fund has been formed to provide a secure source of savings and regular income after retirement to the participants.
The participants would contribute to the Fund during their working life and would typically withdraw from the Fund on or
after retirement age. The Fund invests in in a Shariah compliant diversified portfolio of securities under the Trust Deed.
All the conducts and acts of the Fund are based on Shariah. The Pension Fund Manager has appointed Shariah
Advisory Council to ensure that the activities of the Fund are in compliance with the principles of Shariah.
The Fund consists of three sub-funds namely, Al-Ameen Islamic Retirement Savings Fund Equity Sub-Fund ("Equity Sub-
Fund"), Al-Ameen Islamic Retirement Savings Fund Debt Sub-Fund ("Debt Sub-Fund") and Al-Ameen Islamic
Retirement Savings Fund Money Market Sub-Fund ("Money Market Sub-Fund") (collectively the "Sub-Funds"). The main
features of the investment policy for each of the Sub-Funds are as follows:
The Equity Sub-Fund shall invest primarily in listed equity securities with a minimum investment of 90% of its net
asset value in listed shares. The investment in a single company is restricted to lower of 10% of Net Asset Value
(NAV) or the paid-up capital of the investee company. The investment in a single stock exchange sector is restricted
to the higher of 30% of the NAV or the index weight, subject to a maximum of 35% of the NAV. The remaining
assets of the Equity Sub-Fund shall be invested in any government security having less than one year time to
maturity, or in a scheduled commercial bank having credit rating of 'A'.
The Debt Sub-Fund shall invest primarily in tradable debt securities with weighted average duration of the
investment portfolio of the Debt Sub-Fund not exceeding five years. At least twenty five percent (25%) of the assets
in the Debt Sub-Fund shall be invested in securities issued by the Federal Government and upto twenty five (25%)
of the Fund may be deposited with banks having not less than "AA +" rating. Composition of the remaining portion of
the investments shall be as defined in the offering document.
The Money Market Sub-Fund shall invest in short term debt instruments with time to maturity not exceeding six
months, and in case of Shariah compliant Government securities, up to three years. The Fund can make investment
in Shariah compliant securities issued by the Federal Government and the commercial banks having A+ rating.
There are no restrictions placed by the VPS rules on such investments. The Fund can also make investment in
securities issued by the provincial government, city government and government or a corporate entity (having credit
rating of 'A' or higher) up to 10%, 5% and 5% of net assets of the Money Market Sub-Fund respectively.
As prescribed under the VPS rules, the Fund offers five types of allocation schemes to the contributors of the Fund
namely High Volatility, Medium Volatility, Low Volatility, Lower Volatility and Life Cycle Allocation. The contributors have
the option to suggest a minimum percentage of allocation to the above allocation schemes (subject to the minimum
percentages prescribed in the offering document). Based on the minimum allocation, the Funds are allocated to the
above stated Sub-Funds. The allocation to the Sub-Funds has to be done at the date of opening of contributor's pension
account and on an anniversary date thereafter. The contribution amount may be paid by the contributor on a periodic
basis such as annual, semi annual, quarterly or monthly basis.
The registered office of the Pension Fund Manager is situated at 4th Floor, STSM Building, Beaumont Road, Civil Lines,
Karachi, (Previously it was situated at 8th floor, State life building No 1, I.I. Chundrigar Road, Karachi, Pakistan).
JCR - VIS Credit Rating Company has upgraded management quality rating from AM2++ (stable outlook) to AM1 to the
management company as at December 29, 2017.

2. BASIS OF PREPARATION
2.1 Statement of compliance
2.2
2.3
2.4
2.5 Functional and presentation currency
3.
3.1
3.2
3.3
3.4
3.5
This condensed interim financial information is being submitted to the participants as required under Regulation 7(f) of
the VPS Rules.
This condensed interim financial information has been prepared in accordance with the approved accounting standards
as applicable in Pakistan for interim financial reporting. The approved accounting standards comprise of such
International Financial Reporting Standards (IFRSs) issued by the International Accounting Standards Board as are
notified under the Companies Act , 2017, the requirements of the Trust Deed, the VPS Rules and the directives issued
by the SECP. Wherever the requirements of the Trust Deed, the VPS Rules or the directives issued by the SECP differ
with the requirements of the IFRSs, the requirements of the Trust Deed, the VPS Rules or the directives issued by the
SECP prevail.
The disclosures made in this condensed interim financial information have, however, been limited based on the
requirements of International Accounting Standard 34: 'Interim Financial Reporting'. This condensed interim financial
information does not include all the information and disclosures required in a full set of financial statements and should
be read in conjunction with the annual published audited financial statements of the Fund for the year ended June 30,
2017.
The financial risk management objectives and policies are consistent with those disclosed in the annual published
audited financial statements of the Fund for the year ended June 30, 2017.
Certain amendments to approved accounting standards have been published and are mandatory for the Fund's
accounting period beginning on or after July 01, 2018. None of these amendments are expected to have a significant
effect on this condensed interim financial information except for IFRS 9: Financial Instruments, which will replace IAS 39:
Financial Instruments: Recognition and Measurement of Financial assets and Financial liabilities.
With respect to the classification and measurement, the number of categories of financial assets under IFRS 9 has been
reduced; all recognized financial assets that are currently within in the scope of IAS 39 will be subsequently measured at
either amortized cost or fair value under IFRS 9. Specifically:
A debt instrument that (i) is held within a business model whose objective is to collect the contractual cash flows and
(ii) has contractual cash flows that are solely payments of principal and interest on the principal amount outstanding
must be measured at amortized cost (net of any write down for impairment), unless the asset is designated at fair
value through profit or loss (FVTPL) under the fair value option.
This condensed interim financial information has been prepared under the historical cost convention, except that certain
financial assets are stated at fair value.
Items included in the condensed interim financial information are measured using the currency of the primary economic
environment in which the Fund operates. This condensed interim financial information is presented in Pakistani Rupees
which is the Fund's functional and presentation currency.
SIGNIFICANT ACCOUNTING AND RISK MANAGEMENT POLICIES, ACCOUNTING ESTIMATES, JUDGMENT AND
CHANGES THEREIN
The accounting policies applied for the preparation of this condensed interim financial information are the same as those
applied in the preparation of the annual published audited financial statements of the Fund for the year ended June 30,
2017.
The preparation of this condensed interim financial information in conformity with the approved accounting standards
requires management to make estimates, assumptions and use judgments that affect the application of accounting
policies and reported amounts of assets, liabilities, income and expenses. Estimates, assumptions and judgments are
continually evaluated and are based on historical experience and other factors, including reasonable expectations of
future events. Revisions to accounting estimates are recognised prospectively commencing from the period of revision.
The significant estimates, judgments and assumptions made by management in applying the accounting policies and the
key sources of estimation uncertainty are the same as those applied to the annual published audited financial statements
as at and for the year ended June 30, 2017.
These accounts have been prepared in accordance with
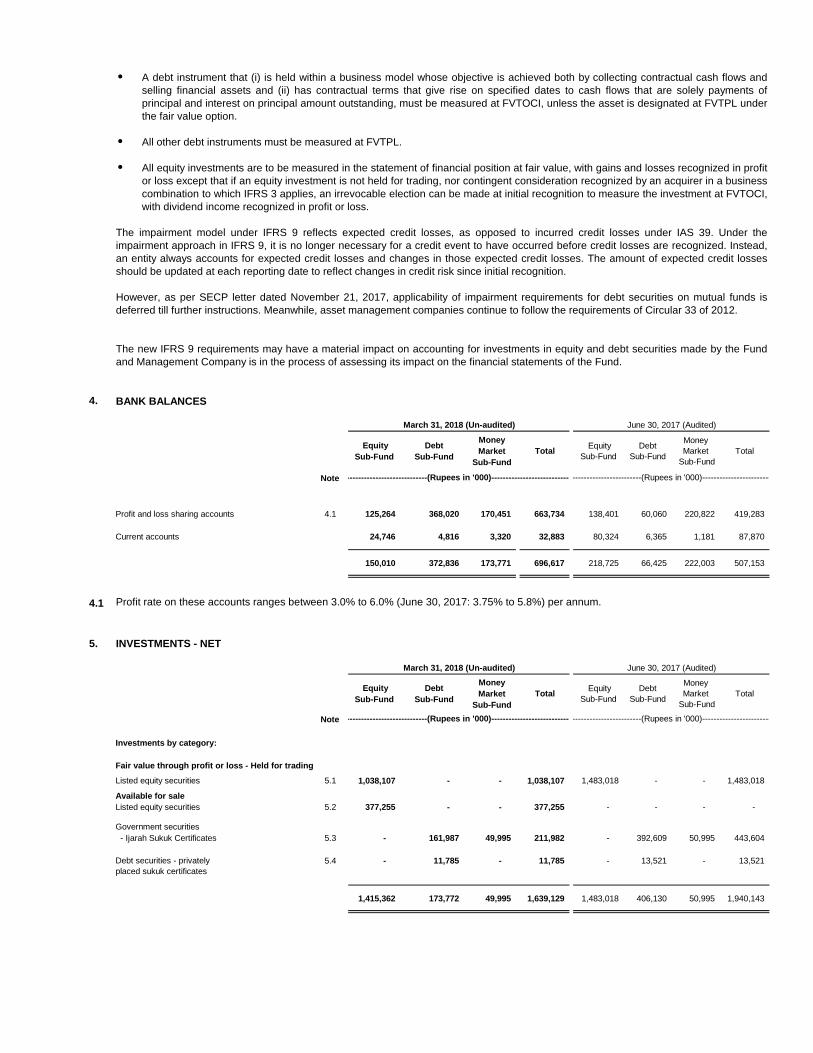
4. BANK BALANCES
Equity
Sub-Fund
Debt
Sub-Fund
Money
Market
Sub-Fund
Total Equity
Sub-Fund
Debt
Sub-Fund
Money
Market
Sub-Fund
Total
Note
Profit and loss sharing accounts 4.1 125,264 368,020 170,451 663,734 138,401 60,060 220,822 419,283
Current accounts 24,746 4,816 3,320 32,883 80,324 6,365 1,181 87,870
150,010 372,836 173,771 696,617 218,725 66,425 222,003 507,153
4.1
5. INVESTMENTS - NET
Equity
Sub-Fund
Debt
Sub-Fund
Money
Market
Sub-Fund
Total Equity
Sub-Fund
Debt
Sub-Fund
Money
Market
Sub-Fund
Total
Note
Investments by category:
Listed equity securities 5.1 1,038,107 - - 1,038,107 1,483,018 - - 1,483,018
Listed equity securities 5.2 377,255 - - 377,255 - - - -
Government securities
- Ijarah Sukuk Certificates 5.3 - 161,987 49,995 211,982 - 392,609 50,995 443,604
5.4 - 11,785 - 11,785 - 13,521 - 13,521
1,415,362 173,772 49,995 1,639,129 1,483,018 406,130 50,995 1,940,143
March 31, 2018 (Un-audited) June 30, 2017 (Audited)
A debt instrument that (i) is held within a business model whose objective is achieved both by collecting contractual cash flows and
selling financial assets and (ii) has contractual terms that give rise on specified dates to cash flows that are solely payments of
principal and interest on principal amount outstanding, must be measured at FVTOCI, unless the asset is designated at FVTPL under
the fair value option.
All other debt instruments must be measured at FVTPL.
All equity investments are to be measured in the statement of financial position at fair value, with gains and losses recognized in profit
or loss except that if an equity investment is not held for trading, nor contingent consideration recognized by an acquirer in a business
combination to which IFRS 3 applies, an irrevocable election can be made at initial recognition to measure the investment at FVTOCI,
with dividend income recognized in profit or loss.
The impairment model under IFRS 9 reflects expected credit losses, as opposed to incurred credit losses under IAS 39. Under the
impairment approach in IFRS 9, it is no longer necessary for a credit event to have occurred before credit losses are recognized. Instead,
an entity always accounts for expected credit losses and changes in those expected credit losses. The amount of expected credit losses
should be updated at each reporting date to reflect changes in credit risk since initial recognition.
However, as per SECP letter dated November 21, 2017, applicability of impairment requirements for debt securities on mutual funds is
deferred till further instructions. Meanwhile, asset management companies continue to follow the requirements of Circular 33 of 2012.
The new IFRS 9 requirements may have a material impact on accounting for investments in equity and debt securities made by the Fund
and Management Company is in the process of assessing its impact on the financial statements of the Fund.
March 31, 2018 (Un-audited) June 30, 2017 (Audited)
----------------------------------------------------(Rupees in '000)--------------------------------------------------------------------------------------------------------(Rupees in '000)----------------------------------------------------
Profit rate on these accounts ranges between 3.0% to 6.0% (June 30, 2017: 3.75% to 5.8%) per annum.
----------------------------------------------------(Rupees in '000)--------------------------------------------------------------------------------------------------------(Rupees in '000)----------------------------------------------------
Fair value through profit or loss - Held for trading
Debt securities - privately
placed sukuk certificates
Available for sale

5.1 Equity securities - Held-for-trading
(Ordinary Shares of Rs. 10 each unless indicated otherwise)
AUTOMOBILE ASSEMBLER
HCAR Honda Atlas Cars (Pakistan) Limited 42,600 - - 42,600 36,964 20,334 (16,630) 1.31 1.44 0.03
PSMC Pak Suzuki Motor Company Limited 44,200 - 37,200 7,000 5,463 3,344 (2,119) 0.21 0.24 0.01
MTL Millat Tractors Limited 15,000 - - 15,000 20,617 19,235 (1,381) 1.24 1.36 0.03
GHNI Ghandhara Industries Limited 30,400 - 30,400 - - 0.00 0.00 0.00
63,043 42,913 (20,130) 2.76 3.04 0.07- -
CEMENT-
CHCC Cherat Cement Company Limited 250,000 - 2,500 247,500 44,248 31,754 (12,494) 2.04 2.24 0.14
LUCK Lucky Cement Limited 124,800 - 34,850 89,950 75,222 62,031 (13,190) 3.99 4.38 0.03
DGKC D.G. Khan Cement Company Limited 5.1.1 270,700 - 197,800 72,900 15,539 11,891 (3,649) 0.76 0.84 0.02
PIOC Pioneer Cement Limited 376,900 - 40,500 336,400 43,732 23,561 (20,171) 1.51 1.66 0.15
FCCL Fauji Cement Company Limited 642,500 - 349,500 293,000 12,022 8,570 (3,452) 0.55 0.61 0.02
KOHC Kohat Cement Company Limited 117,000 - 117,000 24,348 18,777 (5,571) 1.21 1.33 0.08
215,111 156,585 (58,526) 10.06 11.06 0.44-
FERTILIZER
ENGRO Engro Corporation Limited 262,000 28,000 84,400 205,600 66,857 63,664 (3,193) 4.09 4.50 0.04
EFERT Engro Fertilizers Limited 846,000 210,000 322,000 734,000 40,455 50,712 10,257 3.26 3.58 0.00
107,313 114,376 7,064 7.35 8.08 0.04-
POWER GENERATION & DISTRIBUTION-
HUBC Hub Power Company Limited 690,800 82,000 63,000 709,800 82,863 71,335 (11,528) 4.58 5.04 0.06
KEL K-Electric Limited (Ordinary Shares Of Rs 3.5 Each) 1,500,000 - 100,000 1,400,000 9,660 9,814 154 0.63 0.69 0.01
92,523 81,149 (11,374) 5.21 5.73 0.07-
OIL & GAS EXPLORATION COMPANIES-
OGDC Oil and Gas Development Company Limited 377,700 63,000 14,100 426,600 60,289 74,263 13,973 4.77 5.25 0.01
PPL Pakistan Petroleum Limited 368,400 30,000 76,200 322,200 48,300 68,577 20,277 4.41 4.85 0.02
POL Pakistan Oilfields Limited 43,200 - 19,300 23,900 10,950 15,548 4,599 1.00 1.10 0.01
MARI Mari Petroleum Company Limited 48,050 5,000 1,000 52,050 81,838 77,063 (4,775) 4.95 5.44 0.05
201,376 235,451 34,075 15.13 16.64 0.09-
OIL & GAS MARKETING COMPANIES-
PSO Pakistan State Oil Company Limited 5.1.2 103,950 18,490 94,200 28,240 9,116 9,079 (37) 0.58 0.64 0.01
APL Attock Petroleum Limited 29,000 - 9,350 19,650 12,309 11,290 (1,019) 0.73 0.80 0.02
21,425 20,369 (1,056) 1.31 1.44 0.03-
PHARMACEUTICALS-
SEARL The Searle Company Limited 5.1.2 59,910 3,422 42,800 20,532 8,760 7,219 (1,541) 0.46 0.51 0.01
HINOON Highnoon Laboratories Limited 5.1.2 28,392 - 3,500 24,892 15,589 11,638 (3,951) 0.75 0.82 0.10
24,349 18,858 (5,492) 1.21 1.33 0.11-
TEXTILE COMPOSITE- -
NML Nishat Mills Limited 452,200 - 150,500 301,700 47,874 47,937 63 3.08 3.39 0.09
47,874 47,937 63 3.08 3.39 0.09-
PAPER & BOARD
CEPB Century Paper & Board Mills Limited 171,500 121,100 - 292,600 27,553 20,734 (6,820) 1.33 1.46 0.20
PKGS Packages Limited 85,450 - 68,600 16,850 11,721 9,918 (1,802) 0.64 0.70 0.02
- 39,274 30,652 (8,622) 1.97 2.16 0.22-
ENGINEERING-
ISL International Steels 233,500 25,000 60,000 198,500 25,335 23,008 (2,327) 1.48 1.63 0.00
MUGHAL Mughal Iron And Steel Industries Limited 182,000 - 182,000 - - - - 0.00 0.00 0.00
ASTL Amreli Steels Limited 103,500 - 15,000 88,500 10,881 8,145 (2,736) 0.52 0.58 0.00
ITTEFAQ Ittefaq Iron Industries Limited 1,112,000 150,000 100,000 1,162,000 34,927 25,994 (8,933) 1.67 1.84 0.89
71,143 57,147 (13,996) 3.67 4.05 0.89
GLASS & CERAMICS-
TGL Tariq Glass Industries Limited 531,000 - 150,000 381,000 42,200 41,091 (1,109) 2.64 2.90 0.52
42,200 41,091 (1,109) 2.64 2.90 0.52
CHEMICAL-
SITC Sitara Chemicals Industries 62,800 - - 62,800 27,922 21,352 (6,570) 1.37 1.51 0.29
ICI ICI Pakistan Limited 40,800 - - 40,800 44,658 34,736 (9,922) 2.23 2.45 0.04
- 72,580 56,088 (16,492) 3.60 3.96 0.33
AUTOMOBILE PARTS & ACCESSORIES-
THALL Thal Limited (Ordinary Shares of Rs 5 each) 89,500 5,400 14,750 80,150 48,258 41,329 (6,928) 2.66 2.92 0.10
48,258 41,329 (6,928) 2.66 2.92 0.10
CABLE & ELECTRICAL GOODS
PAEL Pak Elektron Limited 267,500 82,000 349,500 - - - - 0.00 0.00 0.00
- - - 0.00 0.00 0.00
FOOD & PERSONAL CARE PRODUCTS-
ASC Al-Shaheer Corporation Limited 340,500 30,000 - 370,500 14,857 11,345 (3,513) 0.73 0.80 0.26
SHEZ Shezan International Limited 35,300 - - 35,300 16,768 19,344 2,577 1.24 1.37 0.44
31,625 30,689 (936) 1.97 2.17 0.70
MISCELLANEOUS - -
SPEL Synthetic Products Ltd 484,500 - - 484,500 36,556 26,648 (9,908) 1.71 1.88 0.57
36,556 26,648 (9,908) 1.71 1.88 0.57
TECHNOLOGY & COMMUNICATION-
AVN Avanceon Limited 5.1.2 35,938 - - 35,938 1,628 1,824 196 0.12 0.13 0.03
1,628 1,824 196 0.12 0.13 0.03-
COMMERICAL BANKS-
MEBL Meezan Bank Limited 414,500 25,000 - 439,500 34,622 35,002 380 2.25 2.47 0.04
- 34,622 35,002 380 2.25 2.47 0.04-
Total Value as at Mar 31,2018 1,150,898 1,038,107 (112,790)
Total Value as at June 30 2017 1,372,119 1,483,018 110,899
Name of Investee Company
----------------------(Number of shares)--------------------- -------------------- (Rupees '000) ----------------------------------------------------------------------- '(%) ---------------------------------------------
As at
July 1,
2017
Purchased /
bonus received
during the
period
Sold
during the
period
As at
March 31,
2018
Total
carrying value
as at
March 31, 2018
Total
market value
as at
March 31,
2018
Appreciation /
(Diminution)
as at
March 31, 2018
Market
value of
investment as a
percentage of net
assets
Market
value of
investment as a
percentage of total
investment
Investment
as a percentage
of investees'
paid up
capital
Note
5.1.1
5.1.2
5.2 Listed equity securities - at fair value through profit or loss - available for sale
(Ordinary Shares of Rs. 10 each unless indicated otherwise)
AUTOMOBILE ASSEMBLER
HCAR Honda Atlas Cars (Pakistan) Limited - 17,500 - 17,500 9,423 8,353 (1,070) 0.54 0.59 0.01
MTL Millat Tractors Limited - 2,000 - 2,000 2,563 2,565 2 0.16 0.18 0.00
11,986 10,918 (1,068) 0.70 0.77 0.01
CEMENT
KOHC Kohat Cement Company Limited - 213,300 - 213,300 32,083 34,233 2,150 2.20 2.42 0.14
PIOC Pioneer Cement Limited - 8,900 - 8,900 726 623 (103) 0.04 0.04 0.00
LUCK Lucky Cement Company Limited - 1,500 - 1,500 821 1,034 213 0.07 0.07 0.00
CHCC Cherat Cement Company Limited - 39,500 - 39,500 4,890 5,068 178 0.33 0.36 0.02
FCCL Fauji Cement Co. Limited - 25,000 - 25,000 775 731 (44) 0.05 0.05 0.00
DGKC D.G.Khan Cement Co. Limited - 6,300 - 6,300 929 1,028 99 0.07 0.07 0.00
40,224 42,717 2,493 2.76 3.01 0.16
FERTILIZER
EFERT Engro Fertilizer Limited - 143,000 143,000 9,224 9,880 656 0.63 0.70 0.01
ENGRO Engro Corporation - 120,000 120,000 36,471 37,158 687 2.39 2.63 0.02
45,695 47,038 1,343 3.02 3.33 0.03
POWER GENERATION & DISTRIBUTION
HUBC Hub Power Company Limited - 195,500 - 195,500 19,709 19,648 (61) 1.26 1.39 0.02
KEL K-Electric Limited (Ordinary Shares Of Rs 3.5 Each) - 1,000,000 - 1,000,000 6,313 7,010 697 0.45 0.50 0.00
26,022 26,658 636 1.71 1.89 0.02
OIL & GAS EXPLORATION COMPANIES
POL Pak Oilfields Limited - 74,200 17,000 57,200 32,220 37,212 4,992 2.39 2.63 0.02
PPL Pak Petroleum Limited - 60,000 - 60,000 11,792 12,770 978 0.82 0.90 0.00
MARI Mari Petroleum Company Limited - 3,100 - 3,100 4,403 6,093 1,690 0.39 0.43 0.00
OGDC Oil & Gas Development Co. Limited - 35,000 - 35,000 5,340 4,590 (750) 0.29 0.32 0.00
53,755 60,665 6,910 3.89 4.28 0.02
OIL & GAS MARKETING COMPANIES
PSO Pakistan State Oil Company Limited - 94,200 - 94,200 28,519 30,284 1,765 1.95 2.14 0.03
28,519 30,284 1,765 1.95 2.14 0.03
TEXTILE COMPOSITE
NML Nishat Mills Limited - 46,000 - 46,000 6,897 7,309 412 0.47 0.52 0.01
KTML Kohinoor Textile Mills Limited - 175,000 - 175,000 10,349 12,311 1,962 0.79 0.87 0.06
17,246 19,620 2,374 1.26 1.39 0.07
TECHNOLOGY & COMMUNICATION
SYS System Limited - 205,500 - 205,500 17,960 19,855 1,895 1.28 1.40 0.18
17,960 19,855 1,895 1.28 1.40 0.18
ENGINEERING
ITTEFAQ Ittefaq Iron Industries Limited - 56,500 - 56,500 1,298 1,264 (34) 0.08 0.09 0.04
ASTL Amreli Steels Limited - 96,000 - 96,000 8,921 8,835 (86) 0.57 0.62 0.03
ISL International Steels - 60,000 - 60,000 7,301 6,955 (346) 0.45 0.49 0.01
17,520 17,053 (467) 1.10 1.20 0.08
CHEMICAL
SITC Sitara Chemicals Industries - 23,000 - 23,000 7,288 7,820 532 0.50 0.55 0.11
EPCL Engro Polymer & Chemicals Limited - 992,500 210,000 782,500 26,870 27,896 1,026 1.79 1.97 0.12
34,158 35,716 1,558 2.29 2.52 0.23
AUTOMOBILE PARTS & ACCESSORIES
GTYR General Tyre & Rubber Co. Of Pakistan Ltd. - 105,000 - 105,000 20,228 20,125 (103) 1.29 1.42 0.18
20,228 20,125 (103) 1.29 1.42 0.18
FOOD AND PERSONAL CARE
SHEZ Shezan International Limited - 32,100 - 32,100 14,173 17,591 3,418 1.13 1.24 0.40
ASC Al-Shaheer Corporation Limited - 202,000 - 202,000 5,725 6,185 460 0.40 0.44 0.14
19,898 23,775 3,877 1.53 1.68 0.54
LEATHER & TANNERIES
SRVI Service Industries Limited - 16,640 - 16,640 14,969 13,986 (983) 0.90 0.99 0.14
14,969 13,986 (983) 0.90 0.99 0.14
REFINERY
NRL National Refinery Limited - 15,900 - 15,900 7,074 6,743 (331) 0.43 0.48 0.02
7,074 6,743 (331) 0.43 0.48 0.02
COMMERCIAL BANKS
MEBL Meezan Bank Limited - 26,370 - 26,370 1,319 2,100 781 0.13 0.15 0.00
1,319 2,100 781 0.13 0.15 0.00
Total Value as at March 31, 2018 356,573 377,255 20,682
Total Value As At June 30 2017 - - -
Market
value of
investment as a
percentage of net
assets
Market
value of
investment as a
percentage of total
investment
Investment as a
percentage
of investees' paid up
capital
Note
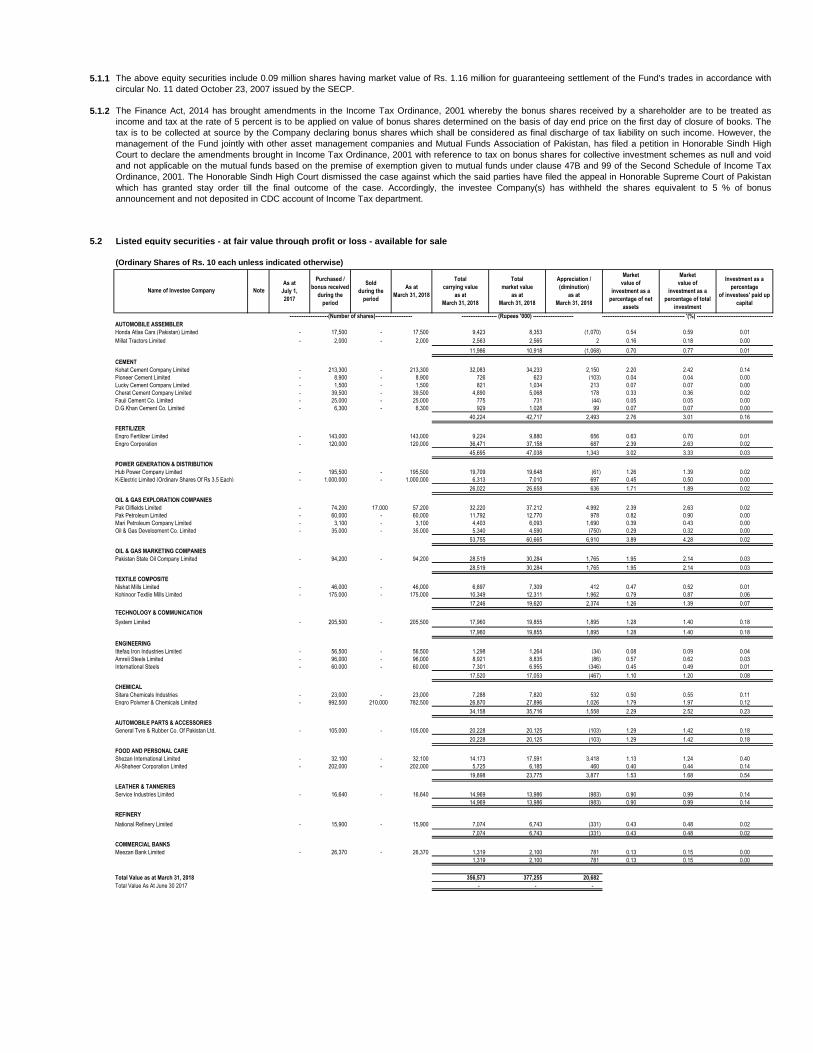
The above equity securities include 0.09 million shares having market value of Rs. 1.16 million for guaranteeing settlement of the Fund's trades in accordance with
circular No. 11 dated October 23, 2007 issued by the SECP.
----------------------(Number of shares)--------------------- -------------------- (Rupees '000) ----------------------- ------------------------------------------------ '(%) ---------------------------------------------
The Finance Act, 2014 has brought amendments in the Income Tax Ordinance, 2001 whereby the bonus shares received by a shareholder are to be treated as
income and tax at the rate of 5 percent is to be applied on value of bonus shares determined on the basis of day end price on the first day of closure of books. The
tax is to be collected at source by the Company declaring bonus shares which shall be considered as final discharge of tax liability on such income. However, the
management of the Fund jointly with other asset management companies and Mutual Funds Association of Pakistan, has filed a petition in Honorable Sindh High
Court to declare the amendments brought in Income Tax Ordinance, 2001 with reference to tax on bonus shares for collective investment schemes as null and void
and not applicable on the mutual funds based on the premise of exemption given to mutual funds under clause 47B and 99 of the Second Schedule of Income Tax
Ordinance, 2001. The Honorable Sindh High Court dismissed the case against which the said parties have filed the appeal in Honorable Supreme Court of Pakistan
which has granted stay order till the final outcome of the case. Accordingly, the investee Company(s) has withheld the shares equivalent to 5 % of bonus
announcement and not deposited in CDC account of Income Tax department.
Name of Investee Company
As at
July 1,
2017
Purchased /
bonus received
during the
period
Sold
during the
period
As at
March 31, 2018
Total
carrying value
as at
March 31, 2018
Total
market value
as at
March 31, 2018
Appreciation /
(diminution)
as at
March 31, 2018

5.3 Government securities - Ijarah Sukuk Certificates At fair value through profit and loss
At fair value through profit and loss
Note
As at
July 1,
2017
Purchased
during the
period
Sold /
matured
during the
period
As at
March 31,
2018
Cost
as at
March 31,
2018
Market
value
as at
March 31,
2018
Unrealized
gain
as at
March 31,
2018
Market
value as a
percentage of
Total Investment
of the
sub fund
Market
value as a
percentage
of net assets
of the
Sub-Fund
Government securities -
held by Debt Sub-Fund
Ijarah Sukuk XVI 5.3.1 900 720 - 1,620 164,313 161,987 (2,326) 93.22 28.38
Total as at March 31, 2018 164,313 161,987 (2,326) 93.22 28.38
Total as at June 30, 2017 388,661 392,609 3,948
Government securities -
held by Money Market Sub-Fund
Ijarah Sukuk XVI 5.3.1 500 - - 500 50,995 49,995 (1,000) 100.00 13.35
Total as at March 31, 2018 50,995 49,995 (1,000) 100.00 13.35
Total as at June 30, 2017 50,000 50,395 395
5.3.1
5.4 Debt securities - Privately placed sukuk certificates - at fair value through profit and loss - held for trading
The details of investment in Sukuk certificates of Rs 5,000 each unless indicated otherwise are as follows:
Held by Debt Sub-Fund
5.4.1 1,500 - - 1,500 4,522 4,470 (52) 0.78 2.57
Fatima Fertilizer 5.4.1 1,800 - - 1,800 7,536 7,315 (221) 1.28 4.21
Dawood Hercules 5.4.1 - 2,400 2,400 - - - - 0.00 0.00
Total as at March 31, 2018 12,058 11,785 (273) 2.06 6.78
Total As at June 30, 2017 13,388 13,521
5.4.1 These investment carry a coupon rate of 7.17% to 7.26% (June 30, 2017: 7.06% to 7.25%).
6. ADVANCE INCOME TAX
Particulars
------------------%-----------------
Particulars Note
As at
July 1,
2017
Purchased
during the
period
Sold/
matured
during the
period
As at
March 31,
2018
Cost
as at
March 31,
2018
------------Number of certificates-------- -----------------(Rs in "000')-----------------
These carry profit rates from 5.51% to 6.1% (June 30, 2017: 5.24% to 6.1%) per annum, receivable semi-annually in arrears,
maturing by March 2019.
Wapda
The income of the Fund is exempt under clause 99 of Part I of the Second Schedule of the Income Tax Ordinance, 2001 (ITO
2001). Further, the fund is exempt under clause 47(B) of Part IV of Second Schedule of ITO 2001 from withholding tax under
section 150, 150A, 151 and 233 of ITO 2001. The Federal Board of Revenue (FBR) , through a circular “C.No.1 (43) DG
(WHT)/ 2008-Vol.II- 66417-R” date May 12, 2015, made it mandatory to obtain exemption certificates under section 159(1) of
the ITO 2001 from Commissioner Inland Revenue (CIR). During the financial year ended June 30, 2016, prior to receiving tax
exemption certificate(s) from CIR various withholding agents had deducted advance tax under section 150, 150A and 151 of
ITO 2001. The Management Company has filed refund application and is confident that the same shall be refunded.
Market
value
as at
March 31,
2018
Unrealized
gain
as at
March 31,
2018
Percentage in relation to
Market value as a
percentage of net
assets of the sub fund
Market
value as a
percentage of
Total Investment
of the
sub fund
------------Number of certificates-------- --------- '(%) ------------------ (Rs in 000) ---------
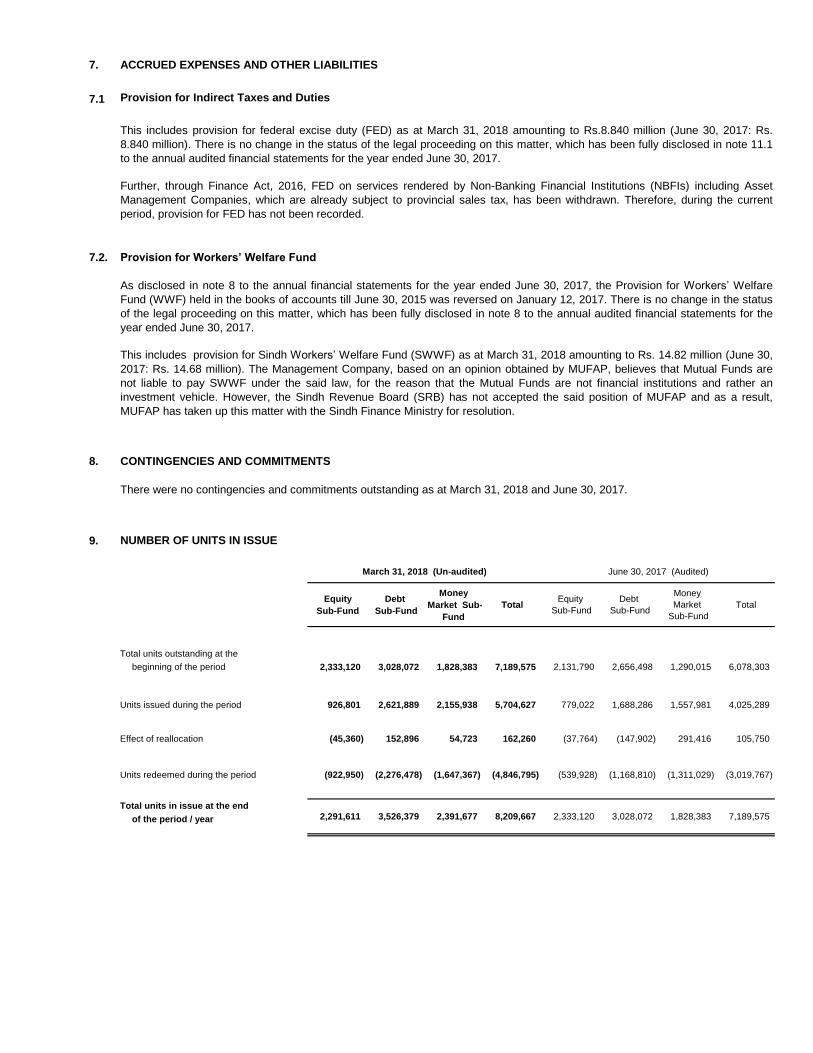
7. ACCRUED EXPENSES AND OTHER LIABILITIES
7.1 Provision for Indirect Taxes and Duties
7.2. Provision for Workers’ Welfare Fund
8. CONTINGENCIES AND COMMITMENTS
9. NUMBER OF UNITS IN ISSUE
Equity
Sub-Fund
Debt
Sub-Fund
Money
Market Sub-
Fund
TotalEquity
Sub-Fund
Debt
Sub-Fund
Money
Market
Sub-Fund
Total
Total units outstanding at the
beginning of the period 2,333,120 3,028,072 1,828,383 7,189,575 2,131,790 2,656,498 1,290,015 6,078,303
Units issued during the period 926,801 2,621,889 2,155,938 5,704,627 779,022 1,688,286 1,557,981 4,025,289
Effect of reallocation (45,360) 152,896 54,723 162,260 (37,764) (147,902) 291,416 105,750
Units redeemed during the period (922,950) (2,276,478) (1,647,367) (4,846,795) (539,928) (1,168,810) (1,311,029) (3,019,767)
Total units in issue at the end
of the period / year
March 31, 2018 (Un-audited) June 30, 2017 (Audited)
This includes provision for Sindh Workers’ Welfare Fund (SWWF) as at March 31, 2018 amounting to Rs. 14.82 million (June 30,
2017: Rs. 14.68 million). The Management Company, based on an opinion obtained by MUFAP, believes that Mutual Funds are
not liable to pay SWWF under the said law, for the reason that the Mutual Funds are not financial institutions and rather an
investment vehicle. However, the Sindh Revenue Board (SRB) has not accepted the said position of MUFAP and as a result,
MUFAP has taken up this matter with the Sindh Finance Ministry for resolution.
Further, through Finance Act, 2016, FED on services rendered by Non-Banking Financial Institutions (NBFIs) including Asset
Management Companies, which are already subject to provincial sales tax, has been withdrawn. Therefore, during the current
period, provision for FED has not been recorded.
As disclosed in note 8 to the annual financial statements for the year ended June 30, 2017, the Provision for Workers’ Welfare
Fund (WWF) held in the books of accounts till June 30, 2015 was reversed on January 12, 2017. There is no change in the status
of the legal proceeding on this matter, which has been fully disclosed in note 8 to the annual audited financial statements for the
year ended June 30, 2017.
This includes provision for federal excise duty (FED) as at March 31, 2018 amounting to Rs.8.840 million (June 30, 2017: Rs.
8.840 million). There is no change in the status of the legal proceeding on this matter, which has been fully disclosed in note 11.1
to the annual audited financial statements for the year ended June 30, 2017.
There were no contingencies and commitments outstanding as at March 31, 2018 and June 30, 2017.
2,291,611 3,526,379 7,189,575 3,028,072 1,828,383 2,391,677 8,209,667 2,333,120
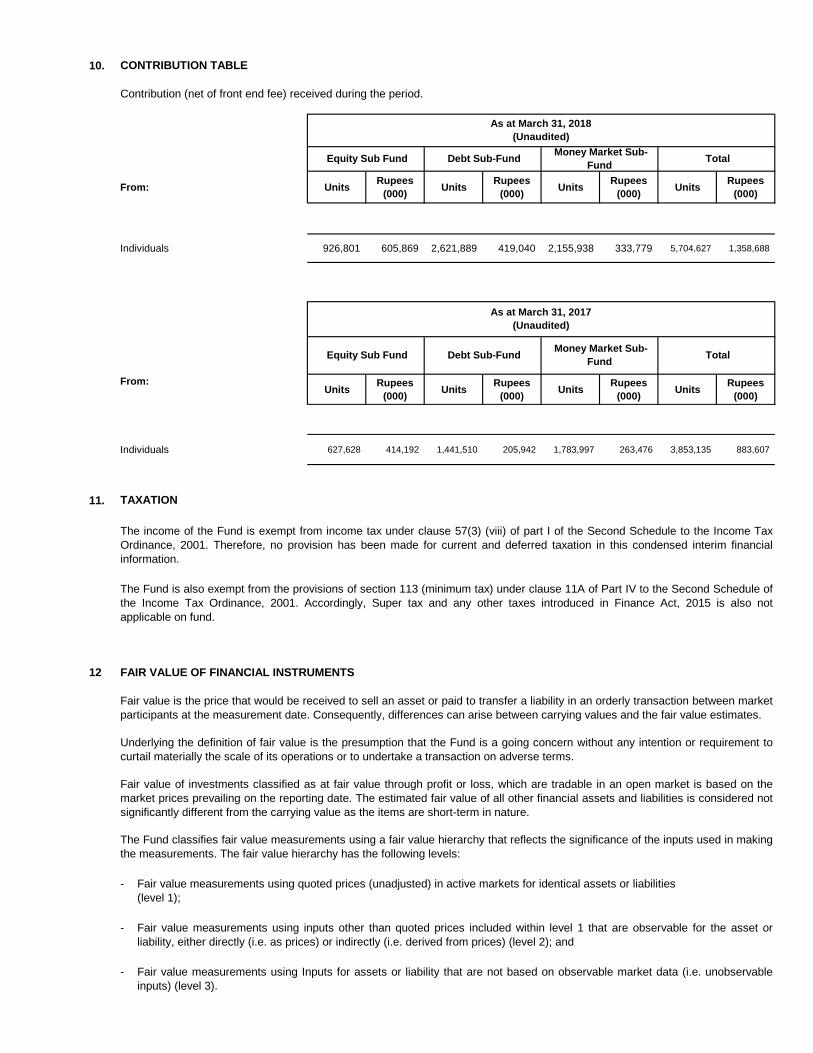
10. CONTRIBUTION TABLE
Contribution (net of front end fee) received during the period.
From: UnitsRupees
(000)Units
Rupees
(000)Units
Rupees
(000)Units
Rupees
(000)
Individuals 926,801 605,869 2,621,889 419,040 2,155,938 333,779 5,704,627 1,358,688
From:Units
Rupees
(000)Units
Rupees
(000)Units
Rupees
(000)Units
Rupees
(000)
Individuals 627,628 414,192 1,441,510 205,942 1,783,997 263,476 3,853,135 883,607
11. TAXATION
12 FAIR VALUE OF FINANCIAL INSTRUMENTS
-
-
-
Total
As at March 31, 2017
(Unaudited)
As at March 31, 2018
(Unaudited)
Equity Sub Fund Debt Sub-Fund
Equity Sub Fund Debt Sub-Fund Money Market Sub-
Fund Total
Money Market Sub-
Fund
The income of the Fund is exempt from income tax under clause 57(3) (viii) of part I of the Second Schedule to the Income Tax
Ordinance, 2001. Therefore, no provision has been made for current and deferred taxation in this condensed interim financial
information.
The Fund is also exempt from the provisions of section 113 (minimum tax) under clause 11A of Part IV to the Second Schedule of
the Income Tax Ordinance, 2001. Accordingly, Super tax and any other taxes introduced in Finance Act, 2015 is also not
applicable on fund.
Fair value is the price that would be received to sell an asset or paid to transfer a liability in an orderly transaction between market
participants at the measurement date. Consequently, differences can arise between carrying values and the fair value estimates.
Underlying the definition of fair value is the presumption that the Fund is a going concern without any intention or requirement to
curtail materially the scale of its operations or to undertake a transaction on adverse terms.
Fair value of investments classified as at fair value through profit or loss, which are tradable in an open market is based on the
market prices prevailing on the reporting date. The estimated fair value of all other financial assets and liabilities is considered not
significantly different from the carrying value as the items are short-term in nature.
The Fund classifies fair value measurements using a fair value hierarchy that reflects the significance of the inputs used in making
the measurements. The fair value hierarchy has the following levels:
Fair value measurements using quoted prices (unadjusted) in active markets for identical assets or liabilities
(level 1);
Fair value measurements using inputs other than quoted prices included within level 1 that are observable for the asset or
liability, either directly (i.e. as prices) or indirectly (i.e. derived from prices) (level 2); and
Fair value measurements using Inputs for assets or liability that are not based on observable market data (i.e. unobservable
inputs) (level 3).

Level 1 Level 2 Level 3 Total
Financial assets measured at fair value
Equity securities 1,038,107 - - 1,038,107
1,038,107 - - 1,038,107
Level 1 Level 2 Level 3 Total
Financial assets measured at fair value
Equity securities 1,483,018 - - 1,483,018
1,483,018 - - 1,483,018
Level 1 Level 2 Level 3 Total
Financial assets measured at fair value
Government securities - Ijarah Sukuk Certificates - 161,987 - 161,987
Debt securities - Sukuk certificates - 11,785 - 11,785
- 11,785 - 11,785
Level 1 Level 2 Level 3 Total
Financial assets measured at fair value
Debt securities - Sukuk Certificates - 406,130 - 406,130
- 406,130 - 406,130
Level 1 Level 2 Level 3 Total
Financial assets measured at fair value
Debt securities - Sukuk Certificates - 49,995 - 49,995
- 49,995 - 49,995
Level 1 Level 2 Level 3 Total
Financial assets measured at fair value
Debt securities - Sukuk Certificates 50,995 - - 50,995
50,995 - - 50,995
12.1
12.2 There were no transfers between various levels of fair value hierarchy during the period.
June 30, 2017
31-Mar-18
Fair Value
Equity Sub-Fund ----------------------------------------------------------------------- (Rupees in '000) -----------------------------------------------------------------
June 30, 2017
Fair Value
----------------------------------------------------------------------- (Rupees in '000) -----------------------------------------------------------------
31-Mar-18
Fair Value
Debt Sub-Fund ----------------------------------------------------------------------- (Rupees in '000) -----------------------------------------------------------------
June 30, 2017
Fair Value
----------------------------------------------------------------------- (Rupees in '000) -----------------------------------------------------------------
The Fund has not disclosed the fair values for these financial assets and financial liabilities, as these are either short term
in nature or reprice periodically. Therefore, their carrying amounts are reasonable approximation of fair value.
Fair Value
----------------------------------------------------------------------- (Rupees in '000) -----------------------------------------------------------------
31-Mar-18
Fair Value
Money Market Sub-Fund ----------------------------------------------------------------------- (Rupees in '000) -----------------------------------------------------------------

13. TRANSACTIONS WITH CONNECTED PERSONS / RELATED PARTIES
13.1
13.2
13.3
13.4
Equity Sub Fund
Transactions during the period
Profit on PLS accounts - 2,158 - - - -
Bank charges - 37 - - - -
Units issued - - - - 8,106 -
Units redeemed - - - - 4,391 -
Remuneration including sales tax 18,785 - 1,520 - - -
CDS expense - - 51 - - -
Balances held
Units held - - - - 24 230
Value of Units held - - - - 16,298 156,346
Bank balances - 76,268 - - - -
Deposits - - 100 - - -
Remuneration payable 2,164 - 174 - - -
Sales load and conversion charges payable 347 493 - - - -
Profit receivable - 309 - - - -
Equity Sub Fund
Transactions during the period
Profit on PLS accounts - 2,107 - - - - Bank charges - 16 174 - - - Units issued - - - - 6,141 - Units redeemed - 181,341 - - 527 - Remuneration including sales tax 15,354 - 1,443 - - -
Balances held
- - - - 9 -
Units held - - - - 6,620 -
Bank balances - 138,931 - - - -
Deposits - - 100 - - -
Remuneration payable 2,364 - 188 - - -
Sales load payable 886 256 - - - -
Profit receivable - 819 - - - -
------------------------------------------------------- (Rupees in '000) -------------------------------------------------------------------
Connected persons / related parties comprise of United Bank Limited (holding Company of Pension Fund Manager), UBL
Fund Managers Limited (Pension Fund Manager), Al - Ameen Financial Services (Private) Limited (subsidiary of management
Company), collective investment schemes managed by the Pension Fund Manager, directors and officers of the Pension
Fund Manager, entities under common management or directorships, and Central Depository Company of Pakistan Limited
(Trustee).
Remuneration of the Pension Fund Manager and trustee is determined in accordance with the provisions of VPS Rules, and
the Trust Deed.
Other transactions with the related parties / connected persons are carried out at agreed / commercial terms.
Details of transaction with related parties / connected persons carried out during the period, and balances with them at the
period end are as follows:
Particulars
Pension
Fund
Manager
Associated
companies
and others *
& **
Trustee
Funds under
Common
Management
Directors
and Key
Executives***
other
connected
persons
----------------------------------------------- Nine months period ended March 31, 2018 -----------------------------------------------------------
------------------------------------------------------- (Rupees in '000) -------------------------------------------------------------------
------------------------------------------ As at March 31, 2018 --------------------------------------------------------
----------------------------------------------------- (Units in '000) -----------------------------------------------------------------
Units held
ParticularsPension Fund
Manager
Associated
Companies
and others*&**
Trustee
other
connected
persons
----------------------------------------------- Nine months period ended March 31, 2017 -----------------------------------------------------------
------------------------------------------------------- (Rupees in '000) -------------------------------------------------------------------
------------------------------------------ As at June 30, 2017 --------------------------------------------------------
----------------------------------------------------- (Units in '000) ------------------------------------------------------------
Funds under
Common
Management
Directors and
Key
Executives***
------------------------------------------------------- (Rupees in '000) -------------------------------------------------------------------

Debt Sub Fund
Transactions during the period
Profit on PLS accounts - 214 - - - -
Bank charges - 43 - - - -
Units issued - - - - 2,968 -
Units redeemed - - - - 287 -
Remuneration including sales tax 7,048 - 571 - - -
CDS expense - - 6 - - -
Balances held
Units held - - - - 52 -
Units held - - - - 8,430 -
Bank balances - 63,161 - - - -
Deposits - - 100 - - -
Remuneration payable 810 - 67 - - -
Sales load and conversion charges payable 343 164 - - - -
Profit receivable - 214 - - - -
Debt Sub Fund
Transactions during the period
Profit on savings accounts - 968 - - - -
Bank and other charges - 23 4 - - -
Units issued - - - - 3,845 -
Units redeemed - 46,095 - - 1,882 -
Remuneration for period 4,832 - 456 - - -
Balances held
- - - - 34 -
Units held - - - - 5,416 -
Bank balances - 830 - - - -
Deposits 694 56 - - -
Remuneration payable 353 99 - - - -
Sales load and conversion charges payable - 289 - - - -
Profit receivable - - 100 - - -
Particulars
Pension
Fund
Manager
Associated
Companies
and
others*&**
Trustee
Funds under
Common
Management
Directors
and Key
Executives***
other
connected
persons
ParticularsPension Fund
Manager
Associated
Companies
and others*&**
Trustee
Funds under
Common
Management
------------------------------------------------------- (Units in '000) --------------------------------------------------------------
----------------------------------------------- Nine months period ended March 31, 2018 -----------------------------------------------------------
------------------------------------------------------- (Rupees in '000) -------------------------------------------------------------------
------------------------------------------ As at March 31, 2018 --------------------------------------------------------
---------------------------------------------- (Units in '000) -------------------------------------------------------------
------------------------------------------------------- (Rupees in '000) -------------------------------------------------------------------
Directors and
Key
Executives***
other
connected
persons
----------------------------------------------- Nine months period ended March 31, 2017 -----------------------------------------------------------
----------------------------------------------------- (Rupees in '000) ----------------------------------------------------------
------------------------------------------ As at June 30, 2017 --------------------------------------------------------
Units held
--------------------------------------------------- (Rupees in '000) ----------------------------------------------------------

Money Market Sub Fund
Transactions during the period
Profit on savings accounts - 1,849 - - - -
Bank and other charges - 39 - - - -
Units issued - - - - 2,120 -
Units redeemed - - - - 550 -
Remuneration (inclusive of SST) 4,069 - 330 - - -
Balances held
Units held - - - - 23 -
Units held - - - - 3,526 -
Bank balances - 37,238 - - - -
Deposits - - - - - -
Remuneration payable 533 - 44 - - -
Sales load and conversion charges payable 63 15 - - - -
Profit receivable - 164 - - - -
Money Market Sub Fund
Transactions during the period
Profit on savings accounts - 1,303 - - - -
Bank and other charges - 29 - - - -
Units issued - - - - 707 41,212
Units redeemed - 44,502 - - 345 -
Remuneration (inclusive of SST) 2,414 - 227 - - -
Balances held
- - - - 12 273
Units held - - - - 1,836 41,769
Bank balances - 52,946 - - - -
Deposits - - 100 - - -
Remuneration payable 376 - 30 - - -
Sales load and other payable 54 10 - - - -
Profit receivable - 409 - - - -
Particulars
Pension
Fund
Manager
Associated
Companies
and
others*&**
Trustee
Funds under
Common
Management
Directors
and Key
Executives***
other
connected
persons
----------------------------------------------- Nine months period ended March 31, 2018 -----------------------------------------------------------
-------------------------------------------------------- (Rupees in '000) -------------------------------------------------------------
------------------------------------------ As at March 31, 2018 --------------------------------------------------------
----------------------------------------------------- (Units in '000) -------------------------------------------------------
---------------------------------------------------------- (Rupees in '000) ------------------------------------------------------------
other
connected
persons
----------------------------------------------- Nine months period ended March 31, 2017 -----------------------------------------------------------
------------------------------------------ As at June 30, 2017 --------------------------------------------------------
Units held
----------------------------------------------------------- (Rupees in '000) ------------------------------------------------------------
* This represents parent (including the related subsidiaries of the parent) of the Management Company, associated
companies / undertakings of the Management Company, its parents and the related subsidiaries.
** These include transactions and balances in relation to the entities where common directorship exists as at half year end.
However, it does not include the transactions and balances whereby the common director resigned from the Board of the
Management Company during the period.
----------------------------------------------------------- (Units in '000) -------------------------------------------------------------
ParticularsPension Fund
Manager
Associated
Companies
and others*&**
Trustee
Funds under
Common
Management
Directors and
Key
Executives***
*** These include transactions and balances in relation to those directors and key executives that exist as at half year end.
However, it does not include the transactions and balances whereby the director and key executive has resigned from the
Management Company during the period.

14. DATE OF AUTHORISATION FOR ISSUE
15. GENERAL
For UBL Fund Managers Limited
(Pension Fund Manager)
Chief Executive Officer Chief Financial Officer Director
This condensed interim financial information were authorised for issue by the Board of Directors of the Pension Fund Manager
on April 26, 2018.
Figures have been rounded off to the nearest thousand rupees.
SD SD SD