Todd Hale SVP, Consumer & Shopper Insights August 5, 2014 STATE OF THE INDUSTRY.
62
Todd Hale SVP, Consumer & Shopper Insights August 5, 2014 STATE OF THE INDUSTRY
-
Upload
shyann-keatts -
Category
Documents
-
view
213 -
download
0
Transcript of Todd Hale SVP, Consumer & Shopper Insights August 5, 2014 STATE OF THE INDUSTRY.

Todd HaleSVP, Consumer & Shopper InsightsAugust 5, 2014
STATE OF THE INDUSTRY

Copy
right
©20
14 T
he N
iels
en C
ompa
ny. C
onfid
entia
l and
pro
prie
tary
.
2
TABLE OF CONTENTS
• Retail Landscape & Performance• What’s Selling• Retail Hot Buttons• Closing Thoughts
22

RETAIL LANDSCAPE & PERFORMANCE

Copy
right
©20
14 T
he N
iels
en C
ompa
ny. C
onfid
entia
l and
pro
prie
tary
.
4
IS FLAT THE BEST WE CAN EXPECT?
Source: Nielsen Strategic Planner; Total U.S. All Outlets Combined (plus Convenience), All Departments, All Brands (UPC), % Change, 52 week periods vs. year ago
2009 2010 2011 2012 2013 52 w/e 06/07/2014
$698,622,107,361
$713,847,575,906
$740,149,846,801
$759,794,372,855
$771,160,987,149
$776,894,706,455
244,590,449,475
248,138,265,939
250,002,998,385
249,980,015,395
250,912,427,784
251,476,953,652
Dollar Sales Unit Volume
Billi
ons
All Departments
Dollar Trend +2 +4 +3 +1 +1
Unit Trend +1 +1 -0 +0 +0
Average U Price Trend +1 +3 +3 +1 +1
Any Promo U Trend +2 -0 -2 +0 +1
Shouldn’t an economic recovery be delivering more growth?
5Copy
right
©20
14 T
he N
iels
en C
ompa
ny. C
onfid
entia
l and
pro
prie
tary
.
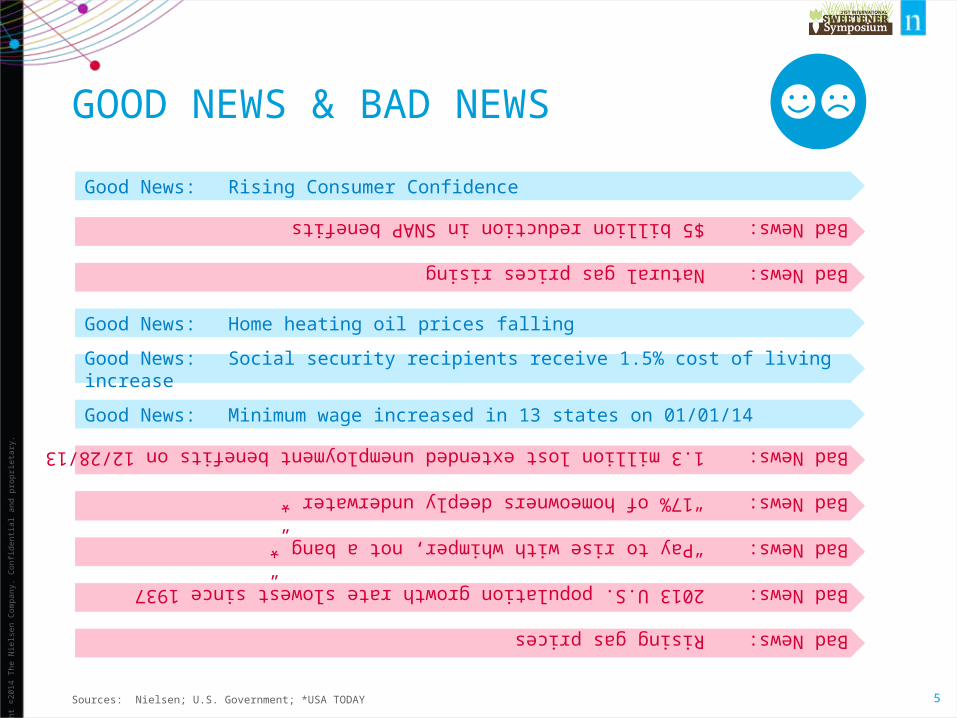
Good News: Rising Consumer Confidence
Bad News: $5 billion reduction in SNAP benefits
GOOD NEWS & BAD NEWS
Sources: Nielsen; U.S. Government; *USA TODAY
Bad News: Natural gas prices rising
Good News: Home heating oil prices falling
Good News: Social security recipients receive 1.5% cost of living increase
Good News: Minimum wage increased in 13 states on 01/01/14
Bad News: “17% of homeowners deeply underwater”*
Bad News: “Pay to rise with whimper, not a bang”*
Bad News: 2013 U.S. population growth rate slowest since 1937
Bad News: Rising gas prices
Bad News: 1.3 million lost extended unemployment benefits on 12/28/13
Copy
right
©20
14 T
he N
iels
en C
ompa
ny. C
onfid
entia
l and
pro
prie
tary
.
6
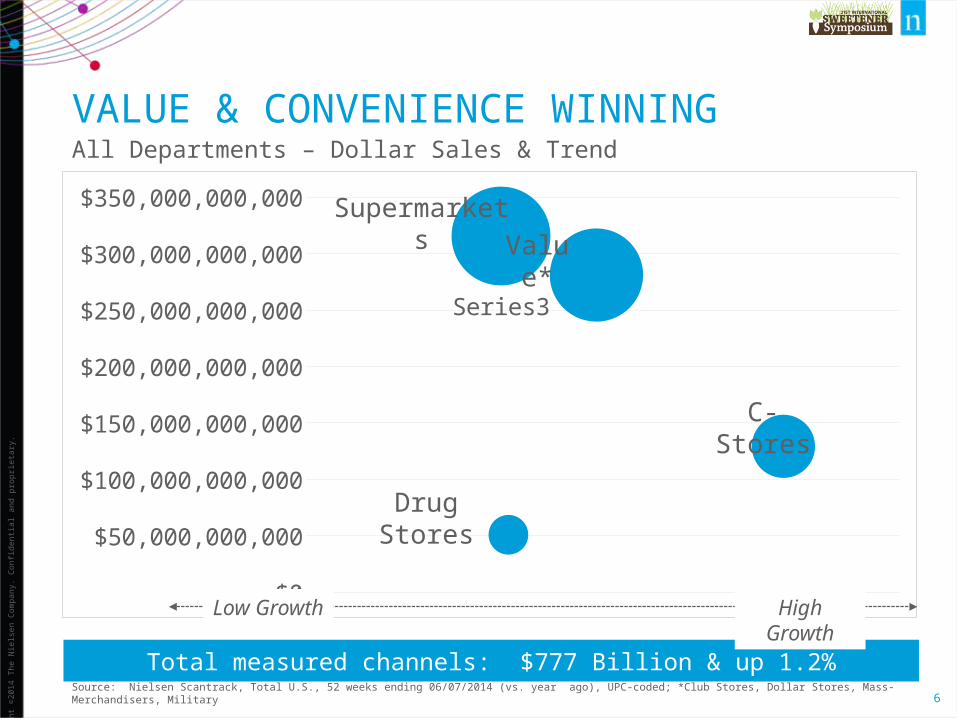
VALUE & CONVENIENCE WINNING
Source: Nielsen Scantrack, Total U.S., 52 weeks ending 06/07/2014 (vs. year ago), UPC-coded; *Club Stores, Dollar Stores, Mass-Merchandisers, Military
$0
$50,000,000,000
$100,000,000,000
$150,000,000,000
$200,000,000,000
$250,000,000,000
$300,000,000,000
$350,000,000,000
Series3
Total measured channels: $777 Billion & up 1.2%
All Departments – Dollar Sales & Trend
Supermarkets
C-Stores
Drug Stores
Value*
Low Growth High Growth

Copy
right
©20
14 T
he N
iels
en C
ompa
ny. C
onfid
entia
l and
pro
prie
tary
.
7
VALUE & CONVENIENCE DRIVE STORE EXPANSION
Source: Nielsen TDLinx
Convenience
Drug
Supermarkets $2MM+
Dollar Stores
Mass Merch
Supercenters
Warehouse Clubs
151,282
41,378
33,445
25,486
4,071
4,014
1,2862013
Expansion from all formats but Mass Merchandisers in 2013 vs. previous year
U.S. Store Counts
69% + of growth from niche formats
Value & Convenience
vs. 2005

RETAIL 2018 – WHAT’S IN STORE?
Copy
right
©20
14 T
he N
iels
en C
ompa
ny. C
onfid
entia
l and
pro
prie
tary
.
9
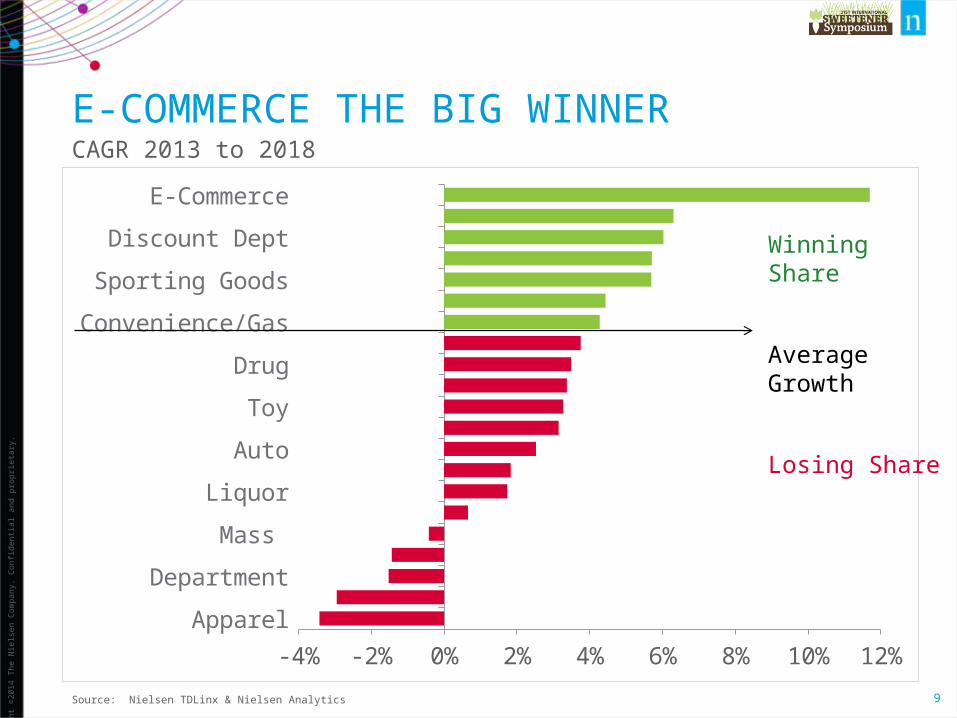
Apparel
Department
Mass
Liquor
Auto
Toy
Drug
Convenience/Gas
Sporting Goods
Discount Dept
E-Commerce
-4% -2% 0% 2% 4% 6% 8% 10% 12%
E-COMMERCE THE BIG WINNERCAGR 2013 to 2018
Source: Nielsen TDLinx & Nielsen Analytics
Winning Share
Average Growth
Losing Share

Copy
right
©20
14 T
he N
iels
en C
ompa
ny. C
onfid
entia
l and
pro
prie
tary
.
10
0
20,000
40,000
60,000
-10010203040
Retail E-Commerce Sales% of Total Retail SalesRetail E-Commerce Sales % Change vs. Year Ago
Percent
E-COMMERCE COMING TO CPG, BUT @ WHAT SPEED
Source: U.S. Census Bureau; company reports & websites
E-Commerce steadily growing sales
Amazon
$13.4
Walmart
$7.5
Kroger
$1.6
Amazon sales growth very impressiveGlobal annual sales growth versus prior year (in billions)
Step on the gas! Who can get there faster?AmazonFresh expanded from Seattle to Los Angeles & San Francisco

WHAT’S SELLING?

Copy
right
©20
14 T
he N
iels
en C
ompa
ny. C
onfid
entia
l and
pro
prie
tary
.
12
DEMAND SHIFTS BEHIND WINNERS & LOSERS
Source: Nielsen Strategic Planner, Total U.S. – All Outlets Combined (plus Convenience, 52 weeks ending 06/07/2014 (vs. 4-years ago), UPC-coded, 120 major category groupings
-$3,000,000,000
-$2,000,000,000
-$1,000,000,000
$0
$1,000,000,000
$2,000,000,000
$3,000,000,000
$4,000,000,000
$5,000,000,000
$6,000,000,000
Sugar & Sugar Substitutes off $64.2 million in annual sales
Overall gains were $72 billion versus four years ago; 23 categories with decreases; 97 categories with increases
Absolute Dollar Loss/Gain versus four years ago
Top 10 with decreases vs. 4-years ago
1. Computer/Electronic Prods 2. Magazines Selected Title 3. Film & Cameras 4. Gum 5. Cereal 6. Detergents 7. Disposable Diapers8. Office/School Supplies 9. Vegetables-Canned10. Puddings/Desserts-Dairy
Top 10 with increases vs. 4-years ago
1. Snacks2. Fresh Produce3. Candy4. Coffee5. Vitamins6. Packaged Meat7. Beer8. Tobacco & Accessories9. Cheese10. Wine

Copy
right
©20
14 T
he N
iels
en C
ompa
ny. C
onfid
entia
l and
pro
prie
tary
.
13
INFLATION & DEMAND DRIVING GROWTH
Source: Nielsen Strategic Planner, Total U.S. – All Outlets Combined (plus Convenience), 52 weeks ending 06/07/2014 (vs. year ago), UPC-coded
Fresh MeatFresh Produce
Packaged MeatAlcoholic Bevs
DeliDairyHBA
Dry GroceryNon-Food Grocery
Frozen FoodsGeneral MerchTotal All Depts
156
44
32
11
00
-41
All Outlets Combined (plus Convenience) – Dollar Trend
Center Store departments struggle

Copy
right
©20
14 T
he N
iels
en C
ompa
ny. C
onfid
entia
l and
pro
prie
tary
.
14
CONSUMERS SHIFTING SPEND OR BUYING LESS
Source: Nielsen Strategic Planner, Total U.S. – All Outlets Combined (plus Convenience), 52 weeks ending 06/07/2014 (vs. year ago), UPC-coded
Fresh MeatFresh ProduceAlcoholic Bevs
DeliDry Grocery
Packaged MeatDairy
Non-Food GroceryHBA
Frozen FoodsGeneral MerchTotal All Depts
114
31
10
-1-1-1
-1-3
0
All Outlets Combined (plus Convenience) – Unit Trend
Shouldn’t an economic recovery be delivering more unit growth?
Copy
right
©20
14 T
he N
iels
en C
ompa
ny. C
onfid
entia
l and
pro
prie
tary
.
15
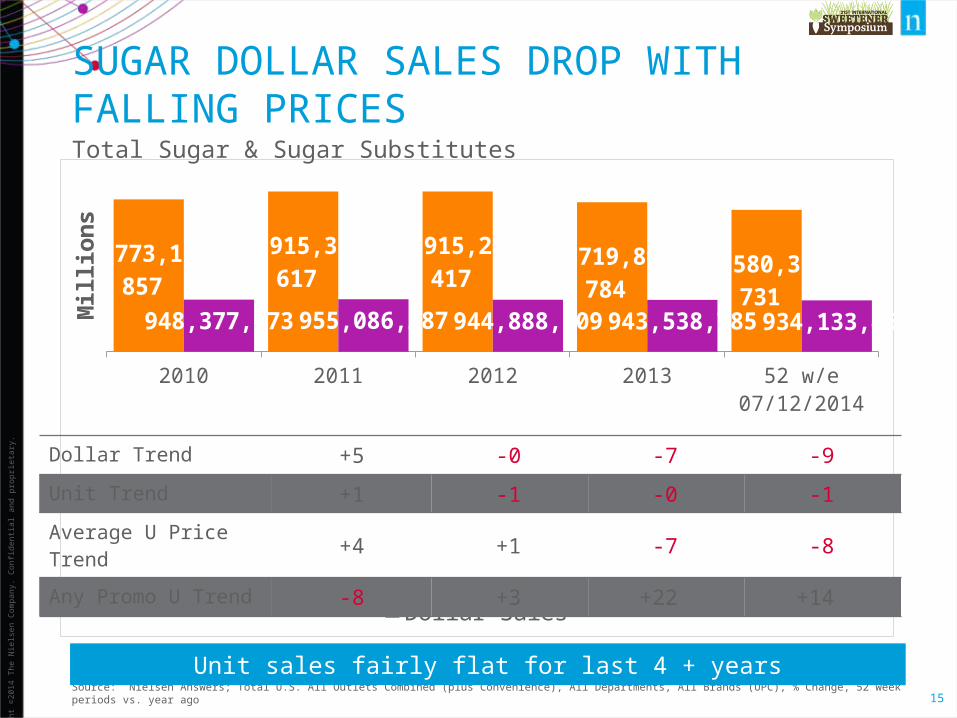
SUGAR DOLLAR SALES DROP WITH FALLING PRICES
Source: Nielsen Answers; Total U.S. All Outlets Combined (plus Convenience), All Departments, All Brands (UPC), % Change, 52 week periods vs. year ago
2010 2011 2012 2013 52 w/e 07/12/2014
$2,773,110,857 $2,915,333,617 $2,915,202,417 $2,719,807,784 $2,580,392,731
948,377,873 955,086,287 944,888,709 943,538,785 934,133,469
Dollar Sales Unit Volume
Mill
ions
Total Sugar & Sugar Substitutes
Dollar Trend +5 -0 -7 -9
Unit Trend +1 -1 -0 -1
Average U Price Trend +4 +1 -7 -8
Any Promo U Trend -8 +3 +22 +14
Unit sales fairly flat for last 4 + years

16Copy
right
©20
14 T
he N
iels
en C
ompa
ny. C
onfid
entia
l and
pro
prie
tary
.
KEY SUGAR INGREDIENT CATEGORIES GENERATE A LOT OF RETAIL REVENUEDollar sales (billions) in Sugar categories
* Includes HFCS sweetened & sugar sweetenedSource: Nielsen Strategic Planner; Total U.S. All Outlets Combined (plus Convenience), All Brands (UPC), 52 weeks ending 7/5/2014
Sugar/Sugar Substitutes
Ice Cream & Frozen Novelties
Candy, exluding Dietetic
Juices/Drinks-SS/Ref/Frz
Carbonated Beverages, Regular*
Baked Goods/Cookies/Baking Mixes
$2,584,854,548
$9,957,907,140
$20,257,789,869
$21,242,047,703
$23,323,526,607
$33,783,352,165 + 2
% Change YAGO
- 9
+ 2
- 1
+ 3
NC
Sales up or flat in these categories

17Copy
right
©20
14 T
he N
iels
en C
ompa
ny. C
onfid
entia
l and
pro
prie
tary
.
RETAIL HOT BUTTONS
Price & Value
Winning with Non-Edibles
Food Fight
Health & Wellness
Private Brands
Connecting with Shoppers That Matter
Sustainability
Right-Sized Box
Digital Shopping
Experiential Retailing

FOOD FIGHT

Copy
right
©20
14 T
he N
iels
en C
ompa
ny. C
onfid
entia
l and
pro
prie
tary
.
19
CONSUMERS FLOCK TO FRESH
Source: Nielsen Perishables Group FreshFacts , Total U.S. – Fresh Coverage Area (grocery + WM, Sam’s Club and Target); 52 weeks ending 5/31/2014 (vs. year ago)
Deli Pre-
pared Foods
Vegetables Fresh Seafood
Fruits Fresh Meat Deli Cheese Bakery Deli Meat-4%
-2%
0%
2%
4%
6%
8%
10%
Dollar Trend Volume Trend Price Change
Dollar growth for all & volume gains in most; higher prices part of the mix too

Copy
right
©20
14 T
he N
iels
en C
ompa
ny. C
onfid
entia
l and
pro
prie
tary
.
20
DELI PREPARED FOODS GROWING
Sources: *Nielsen Perishables Group FreshFacts , Total U.S. – Fresh Coverage Area (grocery + WM, Sam’s Club and Target); 52 weeks ending 5/31/2014 (vs. year ago); **Nielsen Scantrack, Total U.S. – All Outlets Combined, plus Convenience, 52 weeks ending 6/7/2014 (vs. year ago), UPC only; ***NPD Group
Deli SoupsPizza
Deli DessertsDeli Appetizers
Deli EntreesDeli Salads
Deli Breakfast FoodsDeli Platters
Deli SandwichesSushi
Deli Prepared ChickenDeli Snacks
Deli SidesDeli Dips/ Spreads/ Toppings
1%2%3%3%3%3%3%3%
4%6%
9%9%
14%17%
Volume Trend*
Growth continues as shoppers choose meals & meal components over ingredients
Total Store ** Unit Growth:
+0.2%
Prepared food purchases from supermarkets, drug stores & other retail outlets willGROW 10% BY 2022***

21Copy
right
©20
14 T
he N
iels
en C
ompa
ny. C
onfid
entia
l and
pro
prie
tary
.
BAKERY DEPARTMENT CAPTURING GROWTH IN CATEGORIES WHERE SUGAR IS KEY INGREDIENTGrowth continues as shoppers choose meals & meal components over ingredients
Sources: *Nielsen Perishables Group FreshFacts , Total U.S. – Fresh Coverage Area (grocery + WM, Sam’s Club and Target); 52 weeks ending 5/31/2014 (vs. year ago); **Nielsen Scantrack, Total U.S. – All Outlets Combined, plus Convenience, 52 weeks ending 6/7/2014 (vs. year ago), UPC only; ***NPD Group
Brownies & Dessert BarsCinnamon & Sweet Rolls
MuffinsPies
BagelsSweet Goods
CookiesCakes
DonutsBreads
Rolls
1%1%
5%5%
6%7%
8%12%
15%19%
20%
Volume Trend*
Total Store ** Unit Growth:
+0.2%

22Copy
right
©20
14 T
he N
iels
en C
ompa
ny. C
onfid
entia
l and
pro
prie
tary
.
• Daily dinner deals• “Grab & Go” foods• New garden cooler,
which keeps fruits and vegetables fresher, longer
• Expanded gluten-free section• $1 Deals• New Food Lion-brand beef in
sealed-fresh packaging
FOOD LION DEBUTS NEW STORE FORMAT
Sources: Food Lion, Supermarket News & Salisbury Post (photos)

23Copy
right
©20
14 T
he N
iels
en C
ompa
ny. C
onfid
entia
l and
pro
prie
tary
.
SEE HOW YOUR TARGET'S BEEN REFRESHED1,261 Target stores w/expanded food
Source: Target

24Copy
right
©20
14 T
he N
iels
en C
ompa
ny. C
onfid
entia
l and
pro
prie
tary
.
INTEGRATED CAMPAIGN TO REVIVE ESTABLISHED CATEGORIES
Source: Cans Get You Cooking
“Cans get you cooking, a multi-year, fully-integrated campaign”

25Copy
right
©20
14 T
he N
iels
en C
ompa
ny. C
onfid
entia
l and
pro
prie
tary
.
Source: http://cargocollective.com/samcrews/Coke-Walmart-Goes-Well-With
“new displays, menu boards & signage in 3000+ Walmart’s gave Coke a level of branding never seen before”
FISH WHERE THE FISH ARE!Secondary location with multi-media support

26Copy
right
©20
14 T
he N
iels
en C
ompa
ny. C
onfid
entia
l and
pro
prie
tary
.
Source: http://vmsd.com/content/mega-foods-eau-claire-wis; Photography: Mark A. Steele Photography, Columbus, Ohio; Note: capex = capital expenditures
SHAKING UP THE AISLEIs it time to convert trade spend to capex spend?

27Copy
right
©20
14 T
he N
iels
en C
ompa
ny. C
onfid
entia
l and
pro
prie
tary
.
LONG-TERM FOOD-AWAY-FROM-HOME SHARE AT HIGHEST POINT EVERShare of total U.S. food expenditures:
Source: Calculated by the Economic Research Service, USDA, from various data sets from the U.S. Census Bureau and the Bureau of Labor Statistics.
19901992
19941996
19982000
20022004
20062008
20102012
42%
44%
46%
48%
50%
52%
54%
56%
58%
Food-at-home Food-away-from-home
Food expenditures based on actual sales
50.5%
49.5%

28Copy
right
©20
14 T
he N
iels
en C
ompa
ny. C
onfid
entia
l and
pro
prie
tary
.
PERFORMANCE INDEX ABOVE 100 FOR THE 15TH CONSECUTIVE MONTH; HIGHEST IN OVER 2 YEARS
Source: http://www.restaurant.org//Downloads/PDFs/News-Research/index/RPIMay2014

PRIVATE BRANDS

Copy
right
©20
14 T
he N
iels
en C
ompa
ny. C
onfid
entia
l and
pro
prie
tary
.
30
Dollar Sales Trend
Private Brand +5% +8% +2% +2% +2%
Branded +1% +3% +2% +1% +1%
JUST OUTPACING BRAND GROWTH SINCE 2012
Source: Nielsen Strategic Planner, Total U.S. – All Outlets Combined (xAOC), Total All Departments, UPC-coded
2009 2010 2011 2012 2013 52 w/e 6/7/14
16.2%
16.7%
17.3% 17.3%17.5% 17.5%
Private Brand $ Share
All Departments

Copy
right
©20
14 T
he N
iels
en C
ompa
ny. C
onfid
entia
l and
pro
prie
tary
.
31
WHERE ARE THE GROWTH OPPORTUNITIES?
Source: Nielsen Strategic Planner, Total U.S. – All Outlets Combined (xAOC), 52 weeks ending 06/07/2014 (vs. year ago), UPC-coded, 116 major category groupings
0%
10%
20%
30%
40%
50%
60%
Are they bigger in low or high share categories? What other considerations?
Private Brands: Dollar Share
EdiblesNon-Edibles
Top 10
1. Milk 2. Eggs-Fresh 3. Sugar/Sugar Substitutes 4. Wrapping Materials Bags5. Dessert/Fruit/Tops-Froz6. Unprep Meat/Seafood-Frz7. Fruit-Canned8. Pain Remedies9. Cheese10. First Aid17.5%
Average $ Share
Bottom 10
1. Computer/Electronic Prods 2. Beer3. Deodorant 4. Tobacco & Accessories5. Gum6. Canning/Freezing Supplies7. Wine8. Liquor 9. Hair Care10. Insecticides Repellants

Copy
right
©20
14 T
he N
iels
en C
ompa
ny. C
onfid
entia
l and
pro
prie
tary
.
32
SUPERMARKETS DOMINATE BEST OF BREED
Source: Nielsen Homescan, 52 weeks ending 12/28/2013, UPC-coded items
Stater Bros
Safeway-Corp
Dollar General
Hannaford
Costco
Kroger Grocery-Corp
H-E-B
Wegmans
Save-A-Lot
Aldi
0% 10% 20% 30% 40% 50% 60% 70% 80% 90%
Limited assortment/extreme discount formats lead the way
Store Brands $ Share of Total Store
SupermarketsClubMass w/SupersDollarDrug
Average24%20%18%18%18%

33Copy
right
©20
14 T
he N
iels
en C
ompa
ny. C
onfid
entia
l and
pro
prie
tary
.
“PRIVATE-LABEL FOODS OFTEN MEET OR BEAT THE BIG BRANDS”
Source: NBC News & Consumer Reports
Consumer ReportsAugust 2013
Our expert tasters judged 33 of 57 store-brand foods as good as or better than the national brand.In categories such as ice cream, trail mix, mozzarella, mixed vegetables, and more, we found at least one store brand from the national grocers Costco, Kmart, Sam's Club, Target, Trader Joe's, Walmart, and Whole Foods that was equal in quality to the big name.

34Copy
right
©20
14 T
he N
iels
en C
ompa
ny. C
onfid
entia
l and
pro
prie
tary
.
KROGER SIMPLE TRUTH EXPECTED TO HIT $1 BILLION; H-E-B INTRODUCES AFFORDABLE ORGANIC OPTIONS
Source: Todd Hale (in-store photo); Kroger, http://www.simpletruth.com/; H-E-B
• Beef• Teas• Salads• Carrots• Café Ole• Oatmeal & Cereals
H-E-B- shelf tag
Kroger’s eye catching in-store merchandising; its own website & array of social media

35Copy
right
©20
14 T
he N
iels
en C
ompa
ny. C
onfid
entia
l and
pro
prie
tary
.
WALMART & WILD OATS TO DRIVE DOWN ORGANIC FOOD PRICES
Source: Walmart
Nearly 100 organic products – no price premium

36Copy
right
©20
14 T
he N
iels
en C
ompa
ny. C
onfid
entia
l and
pro
prie
tary
.
BACK TO THE FUTURE
Source: Facebook (Walmart-Lebanon); My Private Brand
Walmart testing Extreme Value Brand

37Copy
right
©20
14 T
he N
iels
en C
ompa
ny. C
onfid
entia
l and
pro
prie
tary
.
FRESHDIRECT LAUNCHED TWO PRIVATE BRANDS
Source: mypbrand.com
Mypbrands.comDec. 2, 2013
Cloud 9 is about high quality, effective products in the household and cleaning categories that our customers can count on to get the job right.
JUST FreshDirect will include food products with a focus on simple, short ingredient statements, wholesome ingredients and transparency when it comes to what’s in each product. One of the key elements to our JUST FreshDirect brand is that we have a list of prohibited ingredients.
We have plans to launch over 150 new private brand products in 2014… We also have more brands in the works so expect more exciting news over the next year.

CONNECTING WITH SHOPPERS THAT MATTER

39Copy
right
©20
14 T
he N
iels
en C
ompa
ny. C
onfid
entia
l and
pro
prie
tary
.
ALL GROUPS HAVE LOST SINCE 2000But Blacks & Hispanics have suffered the most
Source: USA TODAY (story by Tim Mullaney; graphics by Frank Pampa & Anne R. Carey – 9/18/2013))
% Change vs. 2000:Non-Hispanic White: -6.3%Asian: -7.7%Hispanic: -11.8%Black: -15.8%

40Copy
right
©20
14 T
he N
iels
en C
ompa
ny. C
onfid
entia
l and
pro
prie
tary
.
DIVERSITY IN SUGAR BUYING & IN CATEGORIES WHERE SUGAR IS KEY INGREDIENT
Source: Nielsen Homescan, Total U.S. 52 weeks ending 12/28/2013, UPC-coded products; Note: Categories include sugar-free products
WHITE NON-HISPANIC
AFRICAN AMERICAN ASIAN HISPANIC
(any race)
CANDY 94 67 70 72
JAMS/JELLIES/ SPREADS 28 20 24 24
SUGAR/SUGAR SUBSTITUTES 22 25 16 22
BREAD & BAKED GOODS 116 90 87 109
CEREAL 73 63 65 80
COOKIES/ICE CREAM CONES 43 39 40 43
CARBONATED BEVERAGES 126 80 82 97
JUICES-DRINKS-SHELF STABLE 54 72 50 73
JUICES-DRINKS-REFRIGERATED 34 44 43 44
ICE CREAM 39 30 28 31
Annual $ Per Household Among Category Buyers
Watch Out: a number of categories with low buying rates among multicultural

41Copy
right
©20
14 T
he N
iels
en C
ompa
ny. C
onfid
entia
l and
pro
prie
tary
.
BY 2020, MILLENNIALS WILL OUTNUMBER BOOMERS BY TEN MILLION U.S. Population Projections - 2020
Source: U.S. Census Bureau (2012 National Population Projections)
Population (millions)
01,000,0002,000,0003,000,000
Males(165 million)
06
121824303642485460667278849096
0 1,000,000 2,000,000 3,000,000
Females(169 million)
Millennials
Gen X
Boomers37 million
25 million
40 million
34 million
24 million
41 million
Age
Copy
right
©20
14 T
he N
iels
en C
ompa
ny. C
onfid
entia
l and
pro
prie
tary
.
42
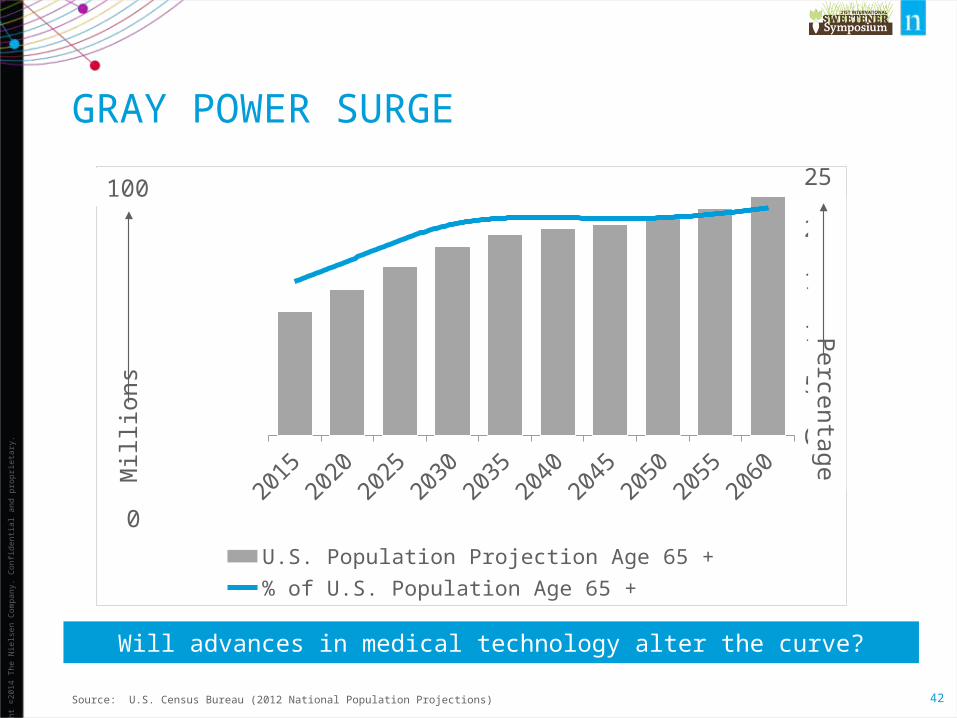
GRAY POWER SURGE
Source: U.S. Census Bureau (2012 National Population Projections)
2015 2020 2025 2030 2035 2040 2045 2050 2055 20600
10,000,00020,000,00030,000,00040,000,00050,000,00060,000,00070,000,00080,000,00090,000,000
100,000,000
0
5
10
15
20
25
U.S. Population Projection Age 65 + % of U.S. Population Age 65 +
Will advances in medical technology alter the curve?
Percentage M
illio
ns
100
0

Copy
right
©20
14 T
he N
iels
en C
ompa
ny. C
onfid
entia
l and
pro
prie
tary
.
43
OLDER MORE TRIPS; YOUNGER BIGGER BASKETS
Source: Nielsen Homescan, Total U.S. 52 weeks ending 12/28/2013, excludes gas only or Rx only trips; *UPC-coded products
Total Retail Channels
Greatest Gen
Boomers
Gen X
Millennials
164
153
129
104
Shopping Trips per Household
Millennials more deal prone
Greatest Gen
Boomers
Gen X
Millennials
$37
$46
$54
$54
Basket Ring $ per Trip
Greatest Gen
Boomers
Gen X
Millennials
$6,110
$7,086
$7,007
$5,655
Basket Ring $ Per Household
Greatest Gen
Boomers
Gen X
Millennials
27%
25%
26%
29%
% Dollars on Deal*

44Copy
right
©20
14 T
he N
iels
en C
ompa
ny. C
onfid
entia
l and
pro
prie
tary
.
MILLENNIALS LESS ENGAGED IN SUGAR & IN KEY SUGAR INGREDIENT CATEGORIES
Source: Nielsen Homescan, Total U.S. 52 weeks ending 12/28/2013, UPC-coded products; Note: Categories include sugar-free products
GREATEST GENERATION BOOMERS GENERATION X MILLENNIALS
CANDY 85 97 89 69
JAMS/JELLIES/ SPREADS 26 26 27 25
SUGAR/SUGAR SUBSTITUTES 23 24 22 18
BREAD & BAKED GOODS 112 118 117 93
CEREAL 61 67 84 81
COOKIES/ICE CREAM CONES 44 44 43 37
CARBONATED BEVERAGES 91 125 123 101
JUICES-DRINKS-SHELF STABLE 47 55 69 62
JUICES-DRINKS-REFRIGERATED 38 38 38 34
ICE CREAM 42 40 35 27
Annual $ Per Household Among Category Buyers

45Copy
right
©20
14 T
he N
iels
en C
ompa
ny. C
onfid
entia
l and
pro
prie
tary
.
TARGET TRIES TO WIN HEARTS & CLICKS OF MILLENNIALS & COLLEGE STUDENTSReplacing in-store registry kiosks with iPads; replacing scanning guns with the iPod Touch
Source: Target
Target overhauling their wedding & baby registry business, integrated shopping lists with live store maps, and testing same-day delivery for some online orders; and
introduces first ever college registry

46Copy
right
©20
14 T
he N
iels
en C
ompa
ny. C
onfid
entia
l and
pro
prie
tary
.
HEALTH & BEAUTY CARE SENIOR FOCUS
Sources: MultiAd Kwikee & company websites

47Copy
right
©20
14 T
he N
iels
en C
ompa
ny. C
onfid
entia
l and
pro
prie
tary
.
SMALLER PORTION SIZES, BUT WHAT ELSE?
Source: MultiAd Kwikee
48Copy
right
©20
14 T
he N
iels
en C
ompa
ny. C
onfid
entia
l and
pro
prie
tary
.
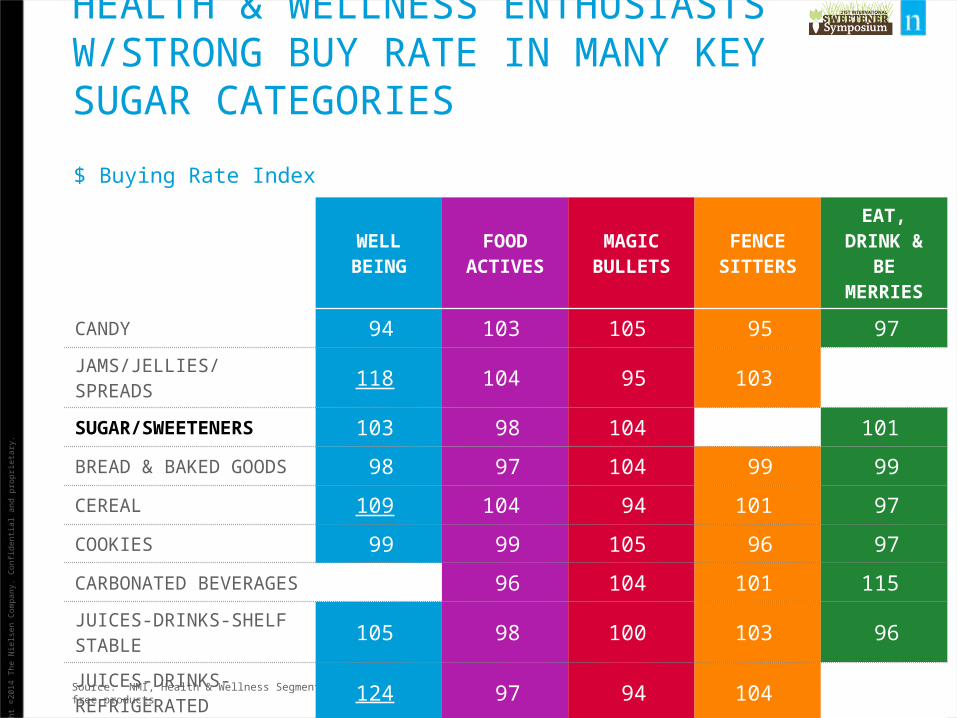
HEALTH & WELLNESS ENTHUSIASTS W/STRONG BUY RATE IN MANY KEY SUGAR CATEGORIES
Source: NMI, Health & Wellness Segmentation, Total U.S. – 52 weeks ending 12/28/2013, UPC-coded; Note: Categories include sugar-free products
WELL BEING FOOD ACTIVES
MAGIC BULLETS
FENCE SITTERS
EAT, DRINK & BE MERRIES
CANDY 94 103 105 95 97
JAMS/JELLIES/ SPREADS 118 104 95 103 87
SUGAR/SWEETENERS 103 98 104 89 101
BREAD & BAKED GOODS 98 97 104 99 99
CEREAL 109 104 94 101 97
COOKIES 99 99 105 96 97
CARBONATED BEVERAGES 76 96 104 101 115
JUICES-DRINKS-SHELF STABLE 105 98 100 103 96
JUICES-DRINKS-REFRIGERATED 124 97 94 104 88
ICE CREAM 103 103 103 88 96
$ Buying Rate Index

DIGITAL SHOPPING
50Copy
right
©20
14 T
he N
iels
en C
ompa
ny. C
onfid
entia
l and
pro
prie
tary
.
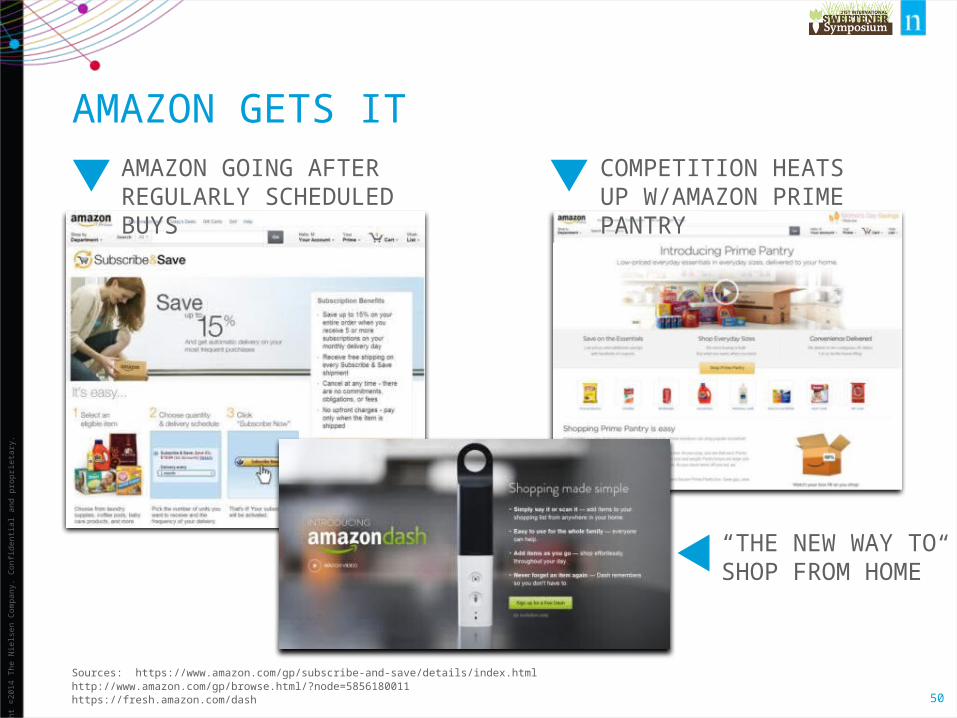
AMAZON GETS IT
Sources: https://www.amazon.com/gp/subscribe-and-save/details/index.htmlhttp://www.amazon.com/gp/browse.html/?node=5856180011https://fresh.amazon.com/dash
AMAZON GOING AFTER REGULARLY SCHEDULED BUYS
COMPETITION HEATS UP W/AMAZON PRIME PANTRY
“THE NEW WAY TO SHOP FROM HOME”

51Copy
right
©20
14 T
he N
iels
en C
ompa
ny. C
onfid
entia
l and
pro
prie
tary
.
“TARGET EXPANDS SUBSCRIPTION SERVICE TENFOLD”
Source: Target
nearly 1,600 items… Everything from beauty products and pet supplies to home office supplies, are now available for regular delivery… free subscription program allows people to schedule shipments in four, six, eight, 10 and 12-week installments.
Associated PressApr. 17, 2014

52Copy
right
©20
14 T
he N
iels
en C
ompa
ny. C
onfid
entia
l and
pro
prie
tary
.
ONLINE GROCERY SALES TO DOUBLE IN FIVE KEY EUROPEAN MARKETS BY 2016
Source: Reuters
Britain, France, Germany, Switzerland and the Netherlands
Joanne Denney-Finch, chief executive, IGDReuters (Berlin), Oct. 23, 2013
Online retailing in food and consumer goods is growing at a phenomenal rate across Europe. Technology is empowering people, fundamentally changing the way they buy groceries

53Copy
right
©20
14 T
he N
iels
en C
ompa
ny. C
onfid
entia
l and
pro
prie
tary
.
HIGH INTEREST IN CLICK & COLLECT
Source: Nielsen Global Consumer Confidence Survey About Aging, Q3 2013 (fielded 8/14/2013 – 9/6/2013)
GLOBAL AVERAGE NORTH AMERICA
Order online for home delivery
37%54%
20%64%
Order online pick-up inside of store
17%65%
17%68%
Order online pick-up via drive-thru
16%66%
12%68%
Order online pick-up curbside
13%64%
11%69%
ALREADY USING DEFINITELY/SOMEWHAT WILLING

54Copy
right
©20
14 T
he N
iels
en C
ompa
ny. C
onfid
entia
l and
pro
prie
tary
.
TRADITIONAL RETAILERS MAKING AN IMPACT ONLINE
“Ahold has a company-wide target to triple its online food sales by 2016”
Sources: Ahold; Peapod; Crain’s Chicago Business; Chicago Tribune; Harris Teeter
HARRIS TEETER DEBUTS ANNUAL SUBSCRIPTION$99.95 for the entire year, no limit to number of orders placed; curbside pick up
PEAPOD EXPANDS NUMBER OF PICK UP LOCATIONS

55Copy
right
©20
14 T
he N
iels
en C
ompa
ny. C
onfid
entia
l and
pro
prie
tary
.
WALMART INVESTING IN DRIVE THROUGH GROCERY PICK UP
Sources: The City Wire & ASDA
“The 15,000 square-foot facility will house 10,000 fresh and dry grocery products – from cereal, chips and bread to fresh produce, meat and milk”
The as-yet unnamed and unbuilt internet pick-up outlet will carry some 10,000 SKUs and be staffed by logistics employees at Walmart. They will assemble orders made online and deliver to cars in as many as 30 drive-up lanes. The concept is based on a similar offering at Walmart’s United Kingdom banner, Asda, said Judith McKenna, chief development officer at Walmart and a former Asda exec.
The City WireMay 7, 2014

56Copy
right
©20
14 T
he N
iels
en C
ompa
ny. C
onfid
entia
l and
pro
prie
tary
.
MERCHANDISING WIDE VARIETY OF CATEGORIES
Source: Company websites
Have you noticed Walgreens online ad includes more pages
than their print edition?

57Copy
right
©20
14 T
he N
iels
en C
ompa
ny. C
onfid
entia
l and
pro
prie
tary
.
WALMART TEXTING RECEIPTS TO BRING LOYALTY CARD CAPABILITIES TO THEIR OFFERING
Source: Milwaukee Journal Sentinel & NFC World(photo)
Milwaukee Journal SentinelApr. 23, 2014
Walmart plans to analyze the large amounts of data it collects through e-receipts and use it as a marketing tool. It enables Walmart to track what its customers buy, where and when and send personalized email offers to shoppers who want it.A Walmart executive said the retailer could send coupons to customers for their favorite brands or shopping lists of items they may want to buy during their next visit. Customers will be identified through their phone number.

CLOSING THOUGHTS

CHASING THE CUSTOMER … NOT THE COMPETITION!
RONALD LUNDE

WHAT WOULD YOU DO IF YOU WEREN’T AFRAID?
SPENCER JOHNSON


62Copy
right
©20
14 T
he N
iels
en C
ompa
ny. C
onfid
entia
l and
pro
prie
tary
.
STAY CONNECTED
http://www.nielsen.com
LinkedIn @[email protected]