TODAY Questions from Wednesday’s lecture CLIMATE MODELS EMISSION SCENARIOS.
30
TODAY Questions from Wednesday’s lecture CLIMATE MODELS EMISSION SCENARIOS
-
Upload
hugo-morgan -
Category
Documents
-
view
213 -
download
0
Transcript of TODAY Questions from Wednesday’s lecture CLIMATE MODELS EMISSION SCENARIOS.

TODAY
Questions from Wednesday’s lecture
CLIMATE MODELS
EMISSION SCENARIOS

THE CO/VOC + NOx O3-FORMATION THEORY
• VOCs (Volatile Organic Compounds):• Sources:
– biogenic (natural: e.g., trees)
– anthropogenic (human activities: e.g., combustion
» stationary (power plants)
» mobile (automobiles)
• CO (carbon monoxide):• Sources:
– primarily anthropogenic combustion » stationary (power plants)
» mobile (automobiles)

The CO/VOC + NOx O3-Formation Theory, cont’d:
• NOx (NO + NO2):• Sources:
– natural: lightning, biomass burning, soil microbial processes
» INSIGNIFICANT with respect to pollution-levels of ozone
– anthropogenic (human activities: e.g., combustion » stationary (power plants)
» mobile (automobiles)
Primary pollutants are emitted at the earth’s surface (e.g., VOCs and NOx)
Secondary pollutants are formed in the atmosphere from photochemistry involving primary pollutants (e.g., O3)

The CO/VOC + NOx O3-Formation Theory, cont’d:
O3 + h O2 + O(1D)
O(1D) + M O(3P) + M
O(3P) + O2 + M O3 + M
M = N2 or O2
O3 + NO NO2 + O2
NO2 + h NO + O(3P)
BUT!! When CO and VOCs are oxidized, HO2 and RO2 (highly reactive “radicals”) are formed and can ALSO react with NO :
HO2 + NO NO2 + OH
RO2 + NO NO2 + OR
NO2 + h NO + O(3P)
O(3P) + O2 + M O3 + M
So, ozone is formed when carbon monoxide and reactive hydrocarbons (VOCs) are oxidized in the presence of NO.

• Glacier
– A mass of land ice flowing downhill (by internal deformation and sliding at the base) and constrained by the surrounding topography. A glacier is maintained by accumulation of snow at high altitudes, balanced by melting at low altitudes or discharge into the sea.
• Ice sheet
– A mass of land ice which is sufficiently deep to cover most of the underlying bedrock topography, so that its shape is mainly determined by its internal dynamics (the flow of the ice as it deforms internally and slides at its base).
– There are only two large ice sheets in the modern world, on Greenland and Antarctica.
• Ice shelf
– A floating ice sheet of considerable thickness attached to a coast (usually of great horizontal extent with a level or gently undulating surface); often a seaward extension of ice sheets.
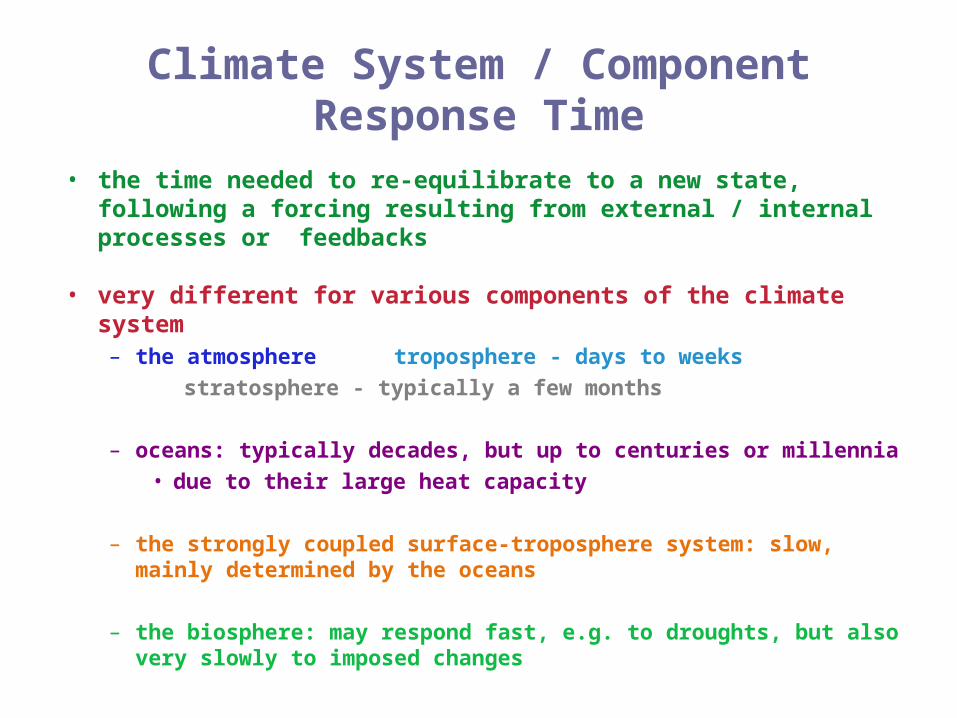
Climate System / Component Response Time
• the time needed to re-equilibrate to a new state, following a forcing resulting from external / internal processes or feedbacks
• very different for various components of the climate system– the atmosphere troposphere - days to weeks
stratosphere - typically a few months
– oceans: typically decades, but up to centuries or millennia
• due to their large heat capacity
– the strongly coupled surface-troposphere system: slow, mainly determined by the oceans
– the biosphere: may respond fast, e.g. to droughts, but also very slowly to imposed changes

CLIMATE MODELS

Hi all
All
Climate Change Impacts on the United States, NAST, 2000.

Climate Models: How are they built and how are they applied?
• major components of the climate system must be represented in sub-models (atmosphere, ocean, land surface, cryosphere and biosphere), along with the processes that go on within and between them
• general circulation models (GCMs) – e.g. Atmosphere GCMs and Ocean GCMs
– equations that describe the large-scale evolution of momentum, heat and moisture are solved in both cases
– Model resolution: • Atmosphere GCM: ~ 250 km in the horizontal and ~ km in the vertical above
the boundary layer
• ocean GCM: ~ 125 - 250 km in the horizontal and ~ 200 to 400 m in the vertical
• many physical processes (e.g., related to clouds or ocean convection) take place on much smaller spatial scales than the model grid and therefore cannot be modeled and resolved explicitly
» their average effects are approximately included in a simple way by taking advantage of physically based relationships with the larger-scale variables. This technique is known as parameterization.

Climate Models, continued
• Quantitative projections of future climate change require– models that simulate all the important processes governing the future
evolution of the climate• atmosphere, land, ocean and sea ice
• developed separately and then gradually integrated
– considerable computing power to run comprehensive AOGCMs
• Simpler models (e.g., coarser resolution and simplified dynamics and physical processes) are widely used – to explore different scenarios of emissions of greenhouse gases
– to assess the effects of assumptions or approximations in model parameters
• Together, simple, intermediate, and comprehensive models form a “hierarchy of climate models”, all of which are necessary to explore choices made in parameterizations and assess the robustness of climate changes.
Climate Change 2001: The Scientific Basis; IPCC 2001

Different components are first developed separately and later coupled into comprehensive climate models.
Climate Change 2001: The Scientific Basis; IPCC 2001

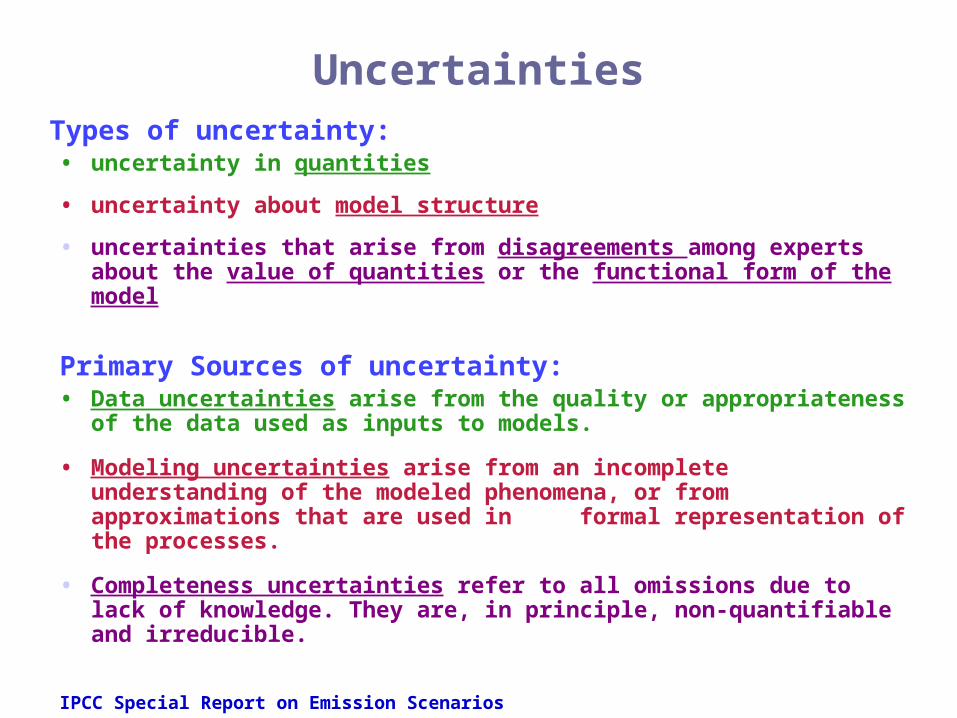
Uncertainties
Types of uncertainty: • uncertainty in quantities
• uncertainty about model structure
• uncertainties that arise from disagreements among experts about the value of quantities or the functional form of the model
Primary Sources of uncertainty:• Data uncertainties arise from the quality or appropriateness of the
data used as inputs to models.
• Modeling uncertainties arise from an incomplete understanding of the modeled phenomena, or from approximations that are used in formal representation of the processes.
• Completeness uncertainties refer to all omissions due to lack of knowledge. They are, in principle, non-quantifiable and irreducible.
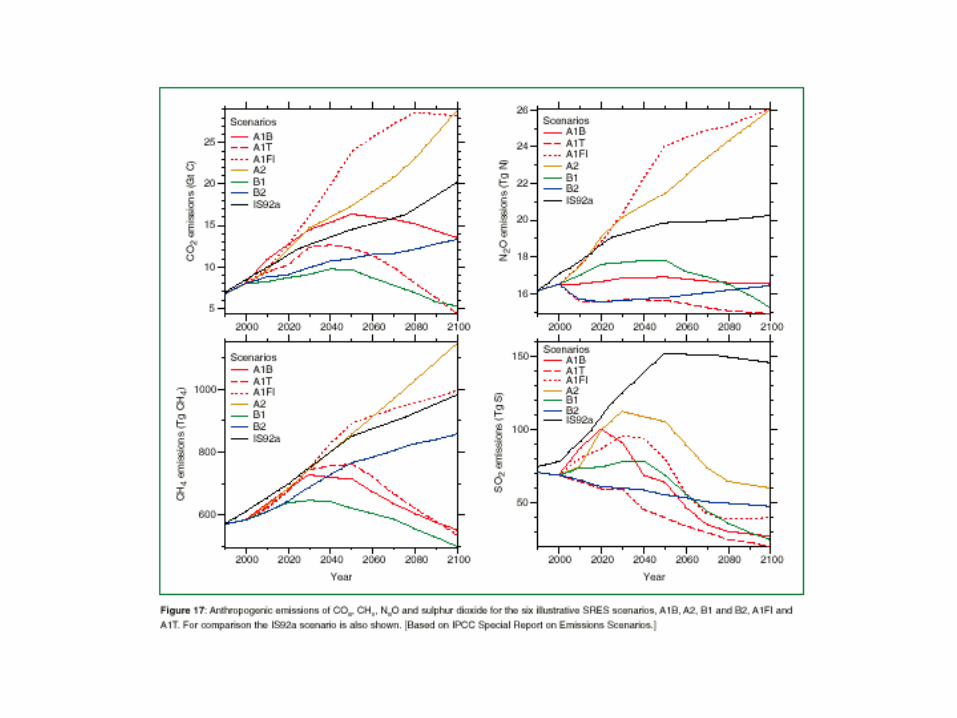
IPCC Special Report on Emission Scenarios

Assessment of the credibility of GCM projections of climate change indicates that the processes and feedbacks requiring sustained research include:
• cloud-radiation-water vapor interactions
• ocean circulation and overturning
• aerosol forcing
• decadal to centennial variability
• land-surface processes
• short-term variability affecting the frequency and intensity of extreme and high impact events (e.g., monsoons, hurricanes, storm systems)
• interactions between chemistry and climate change and improved representations of atmospheric chemical interactions within climate models
Global Environmental Change:Research Pathways for the Next Decade; NRC 1999

e.g., current level of understanding

EMISSION SCENARIOS

Primary Driving Forces of GHG Emissions
• Demographic Change
• Social and Economic Development
• Rate and Direction of Technological Change
IPCC Special Report on Emissions Scenarios

What are scenarios? Why use them?
• neither predictions nor forecasts
• alternative images of how the future might unfold
• an appropriate tool with which to analyze how driving forces may influence future emission outcomes and to assess the associated uncertainties
• IPCC Special Report on Emission Scenarios

Scenario Nomenclature
• Storyline: coherent narrative that describes a demographic, social, economic, technological, environmental, and policy future
• All interpretations and quantifications of one storyline together are called a scenario family.
• Each scenario family includes a storyline and a number of alternative interpretations and quantifications of each storyline to explore variations of global and regional developments and their implications for GHG and sulfur emissions.
• Storylines were formulated in a process that identified driving forces, key uncertainties, possible scenario families, and their logic.
IPCC Special Report on Emissions Scenarios
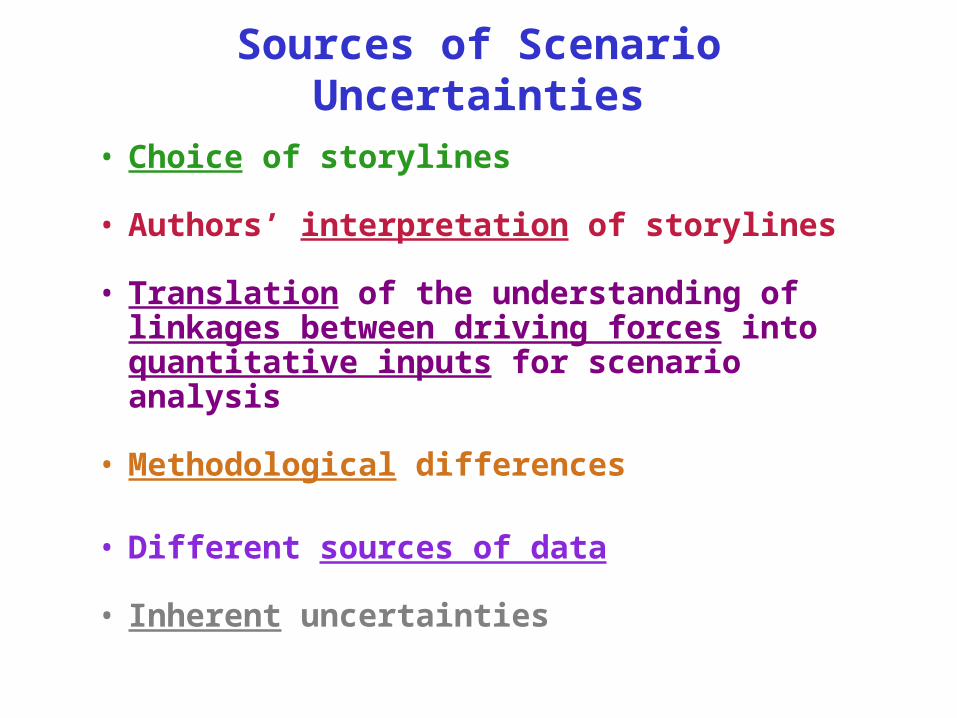
Sources of Scenario Uncertainties
• Choice of storylines
• Authors’ interpretation of storylines
• Translation of the understanding of linkages between driving forces into quantitative inputs for scenario analysis
• Methodological differences
• Different sources of data
• Inherent uncertainties
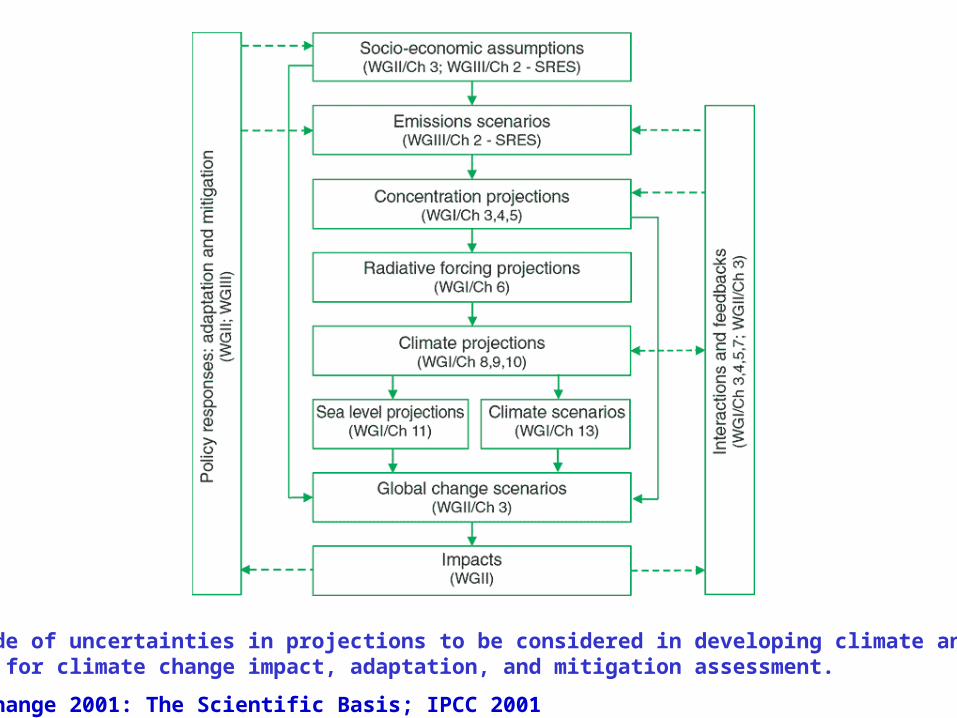
The cascade of uncertainties in projections to be considered in developing climate and related scenarios for climate change impact, adaptation, and mitigation assessment.
Climate Change 2001: The Scientific Basis; IPCC 2001

A1 Storyline and Scenario Family
A world with:• very rapid economic growth• low population growth• rapid introduction of new and more efficient technologies
Major Underlying Themes: convergence among regions capacity building increased cultural and social interactions substantial reduction in regional differences in per capita income
Alternative directions of technological change A1FI - high coal and high oil and gas A1B - balanced (even distribution among options) A1T - predominantly non-fossil fuel
IPCC Special Report on Emissions Scenarios

A2 Storyline and Scenario Family
A highly heterogeneous world with: high population growth (due to slow convergence of fertility
patterns across regions) regionally-oriented economic development per capita economic growth more fragmented/slower technological change more fragmented/slower
Major underlying themes: self reliance preservation of local identities
IPCC Special Report on Emissions Scenarios

B1 Storyline and Scenario Family
A convergent world with:• rapid changes in economic structures toward a service and
information economy• low population growth (same as A1)• reductions in material intensity
introduction of clean and resource-efficient technologies
Major Underlying Themes: global solutions to economic, social, and environmental
sustainability (without additional climate initiatives improved equity
IPCC Special Report on Emissions Scenarios

B2 Storyline and Scenario Family
A world with:• intermediate levels of economic development
• moderate population growth
• reductions in material intensity
• less rapid and more diverse technological change
Major Underlying Themes: local solutions to economic, social, and environmental
sustainability (without additional climate initiatives social equity (with local/regional focus) environmental protection (with local/regional focus)
IPCC Special Report on Emissions Scenarios

Qualitative directions of SRES scenarios for different indicators.
Climate Change 2001 Mitigation Technical Summary

The SRES scenarios and their implications for atmospheric
composition, climate, and sea level
Date
GlobalPopulation(billions)a
GlobalGDP
(1012 US$/yr)b
Per CapitaIncomeRatioc
Ground-Level O3
(ppbv)dCO2
(ppmv)e
GlobalTemperatureChange (°C)f
GlobalSe -a LevelRise (c )m g
1990 5.3 21 16.1 --- 354 0 02000 6.1 – 6.2 5 – 28 12.3 – 14.2 40 367 0.2 22050 8.4 – 11.3 59 – 187 2.4 – 8.2 ~60 463 – 623 0.8 – 2.6 5 – 322100 7.0 – 15.1 197 - 550 1.4 – 6.3 >70 478 - 1099 1.4 – 5.8 9 - 88
Technica l Summ aryClimat e Change 2001: Impacts, Adaptation, and Vulnerability; I 2001PCC

Working Group I Summary for Policy Makers; IPCC 2001

NEXT
CLIMATE CHANGE (3/25) IMPACTS / MITIGATION
CASE STUDIES (3/27)CHINA / USA