TOC Replenishment
49
© Washington State University-2009 1 Fundamental Exam Review Applications: Replenishment Segment The Theory of Constraints [email protected] http://www.cea.wsu.edu/engr mgt/ James R. Holt, Ph.D., PE Professor Engineering & Technology Management
-
Upload
anuj-mittal -
Category
Documents
-
view
151 -
download
7
Transcript of TOC Replenishment
© Washington State University-2009 1
Fundamental Exam Review
Applications: Replenishment Segment
The Theory of Constraints
[email protected]://www.cea.wsu.edu/engrmgt/
James R. Holt, Ph.D., PEProfessor
Engineering & Technology Management
© Washington State University-2009 2
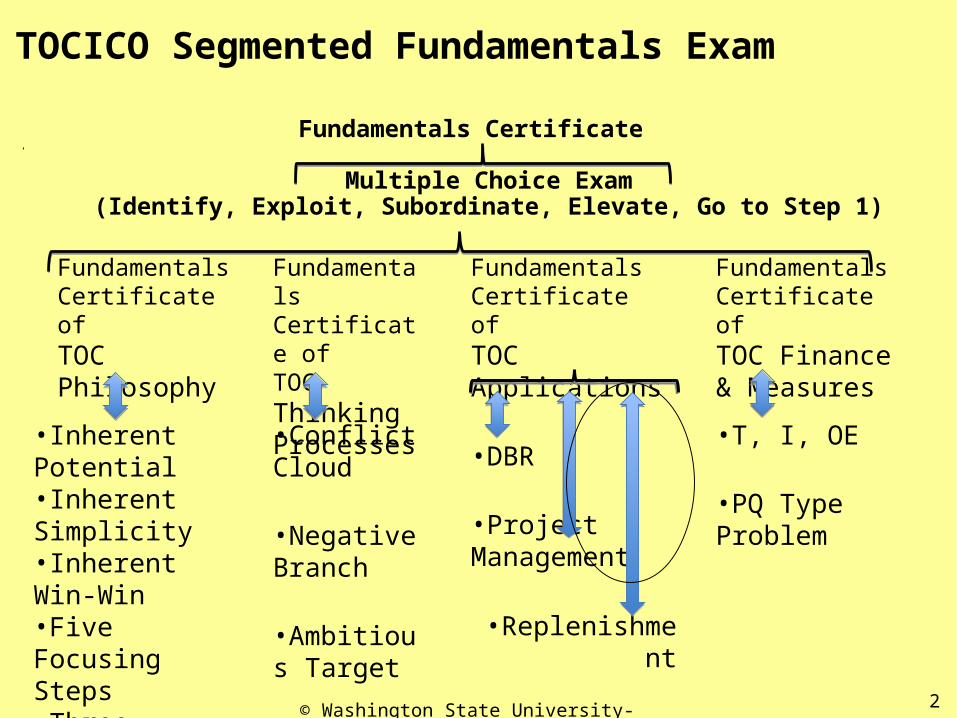
TOCICO Segmented Fundamentals Exam
Fundamentals Certificate
Multiple Choice Exam(Identify, Exploit, Subordinate, Elevate, Go to Step 1)
Fundamentals Certificate of TOC Philosophy
Fundamentals Certificate of TOC Thinking Processes
FundamentalsCertificate of TOC Applications
Fundamentals Certificate of TOC Finance & Measures
•Inherent Potential•Inherent Simplicity•Inherent Win-Win•Five Focusing Steps•Three Questions
•Conflict Cloud
•Negative Branch
•Ambitious Target
•DBR•T, I, OE
•PQ Type Problem•Project
Management
•Replenishment
© Washington State University-2004 3
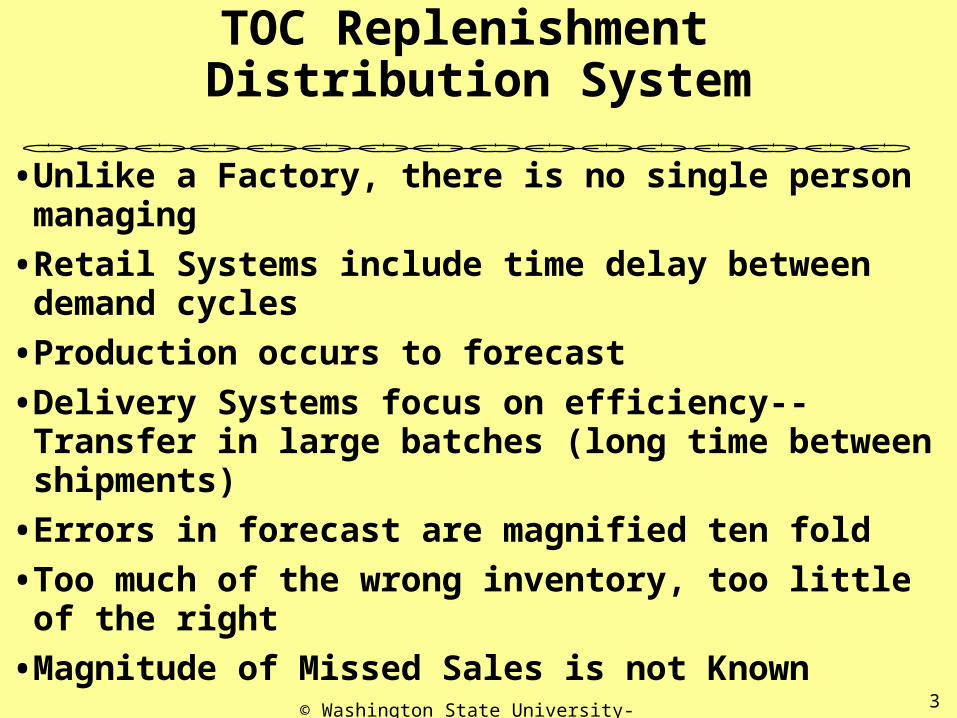
TOC Replenishment Distribution System
• Unlike a Factory, there is no single person managing
• Retail Systems include time delay between demand cycles
• Production occurs to forecast
• Delivery Systems focus on efficiency--Transfer in large batches (long time between shipments)
• Errors in forecast are magnified ten fold
• Too much of the wrong inventory, too little of the right
• Magnitude of Missed Sales is not Known
© Washington State University-2004 4
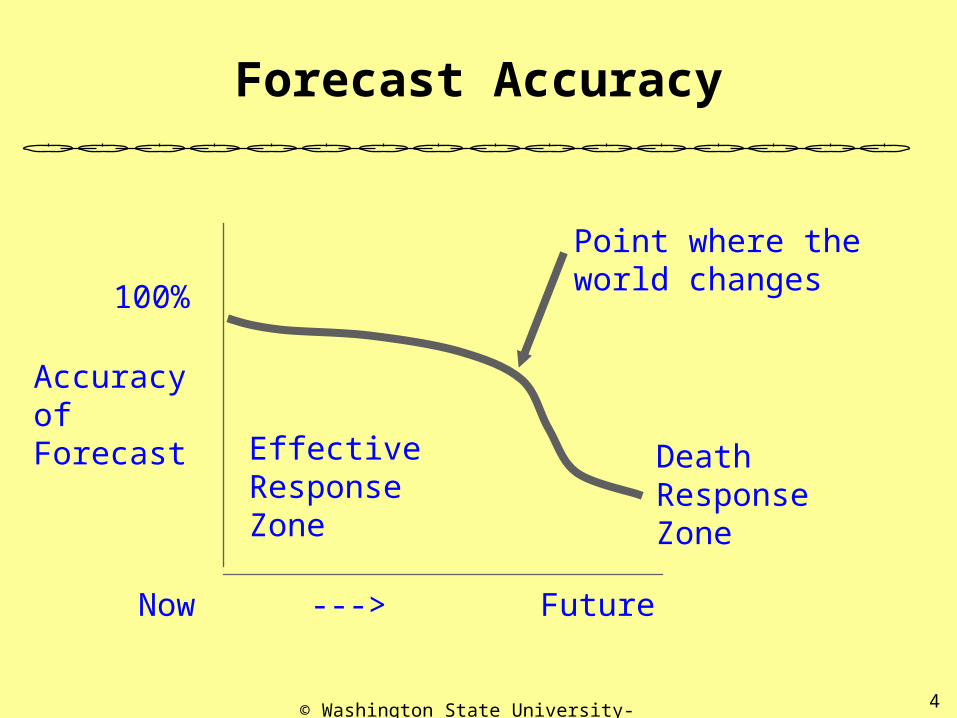
Forecast Accuracy
Now ---> Future
Accuracy of Forecast
100%
Point where the world changes
Effective Response Zone
Death Response Zone
© Washington State University-2004 5
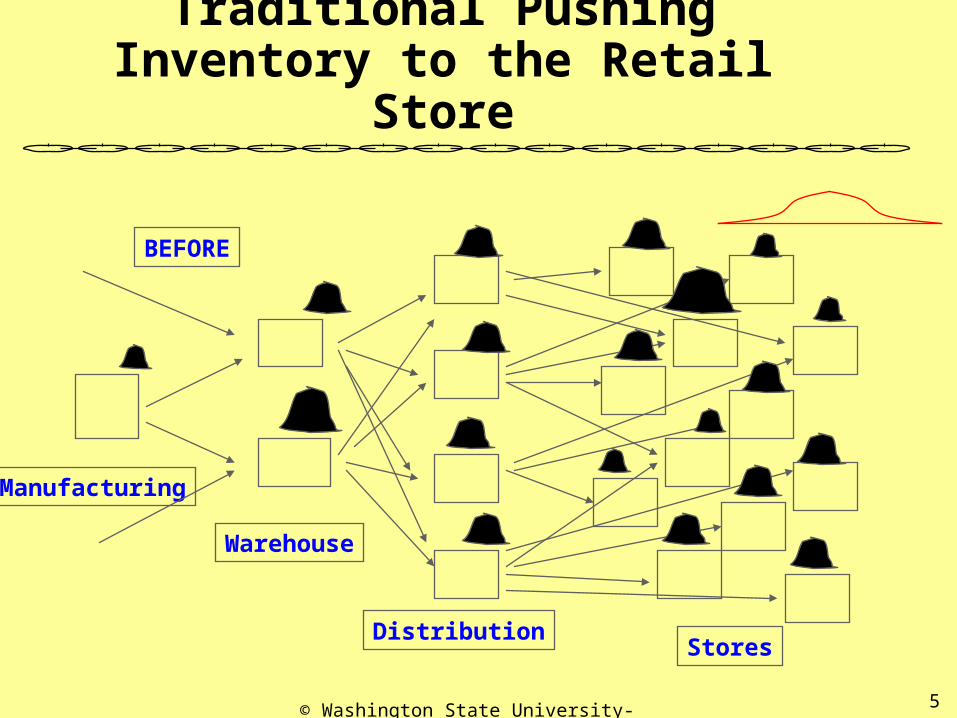
Traditional Pushing Inventory to the Retail Store
Manufacturing
Warehouse
DistributionStores
BEFORE
© Washington State University-2004 6
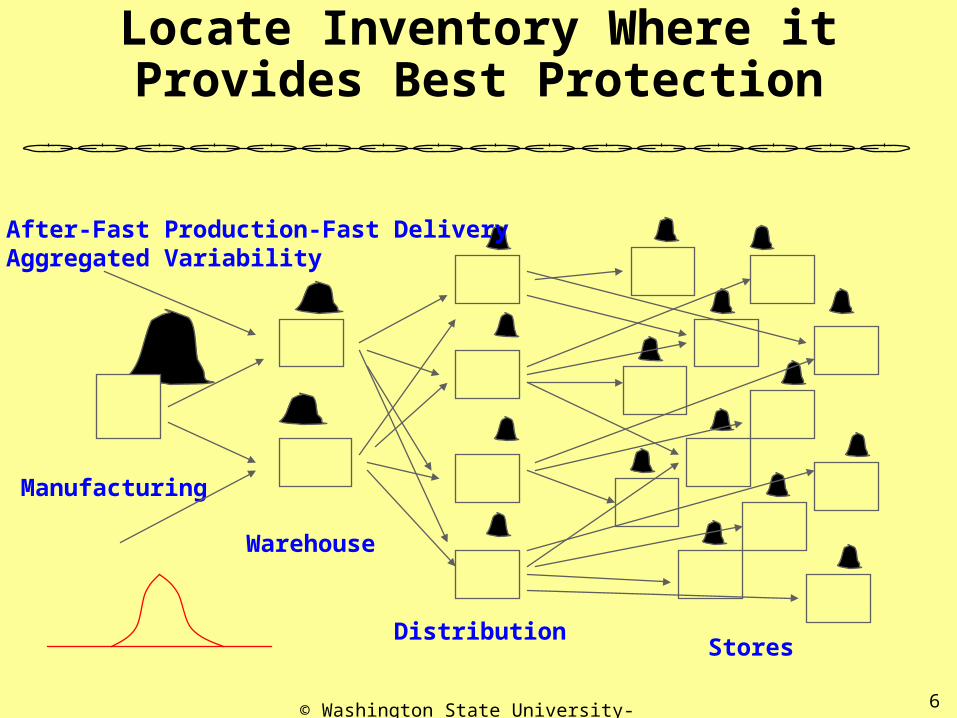
Locate Inventory Where it Provides Best Protection
After-Fast Production-Fast DeliveryAggregated Variability
Manufacturing
Warehouse
DistributionStores
© Washington State University-2004 7
Supply Chain Processes
• Supply Chain is made up of many independent links (Businesses or Business Units)
• Individual links do not provide a completed product
• There is significant interface problems Timing, Quality, Price, Value
• Links are in competition with each other / Leverage each other
© Washington State University-2004 8
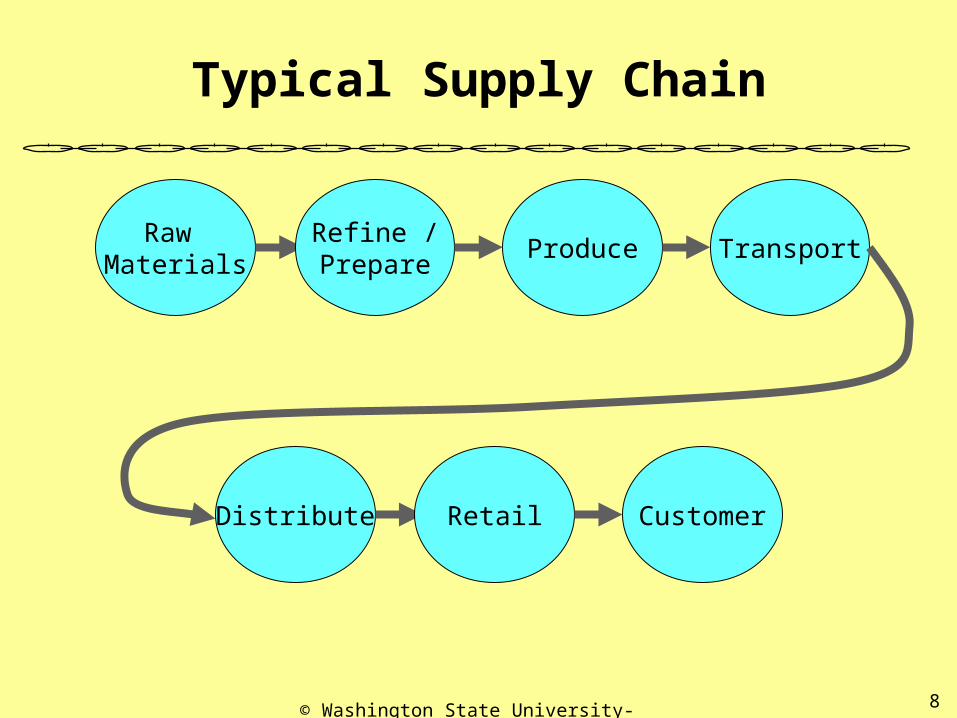
Typical Supply Chain
Raw Materials
Refine /Prepare
Produce Transport
Distribute Retail Customer
© Washington State University-2004 9
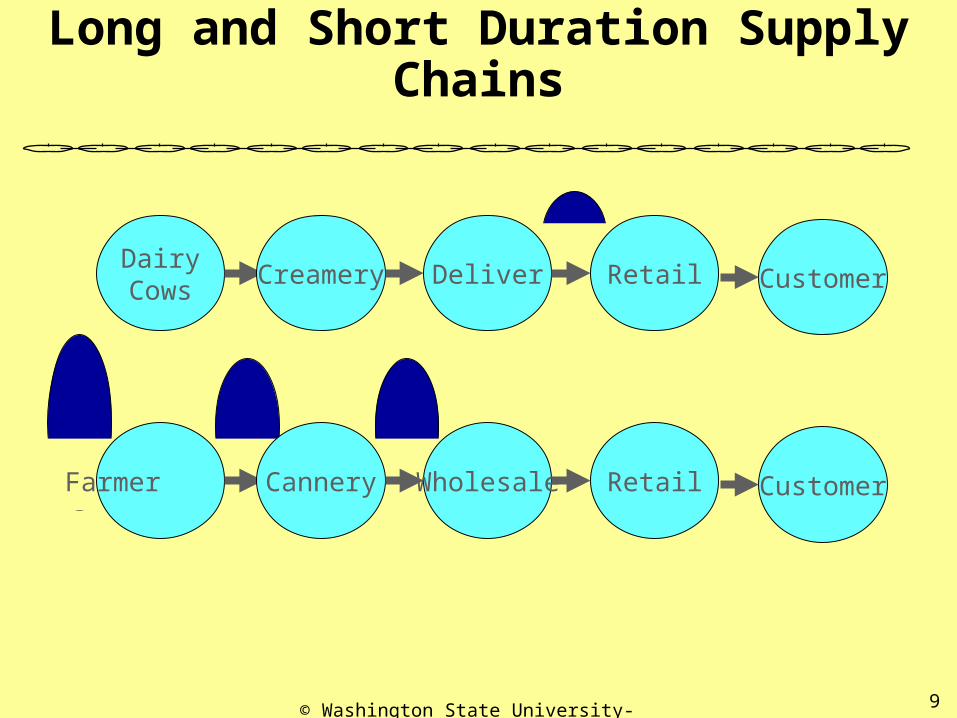
Long and Short Duration Supply Chains
DairyCows
Creamery Deliver Retail Customer
Farmer Cannery Wholesale Retail Customer
© Washington State University-2004 10
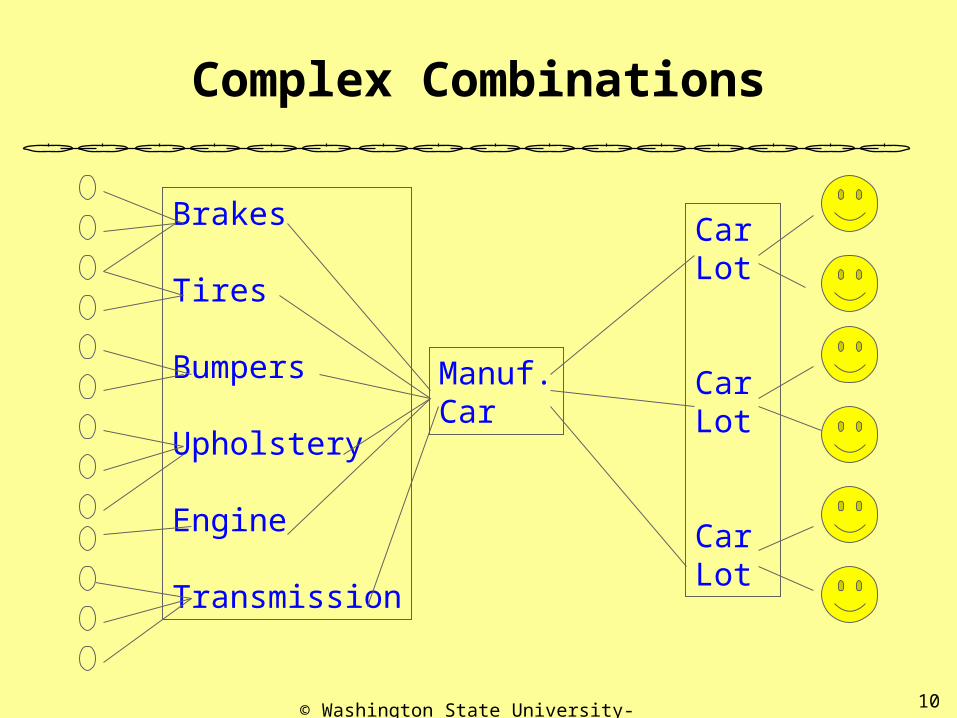
Complex Combinations
Brakes
Tires
Bumpers
Upholstery
Engine
Transmission
Manuf.Car
Car Lot
Car Lot
Car Lot
© Washington State University-2004 11
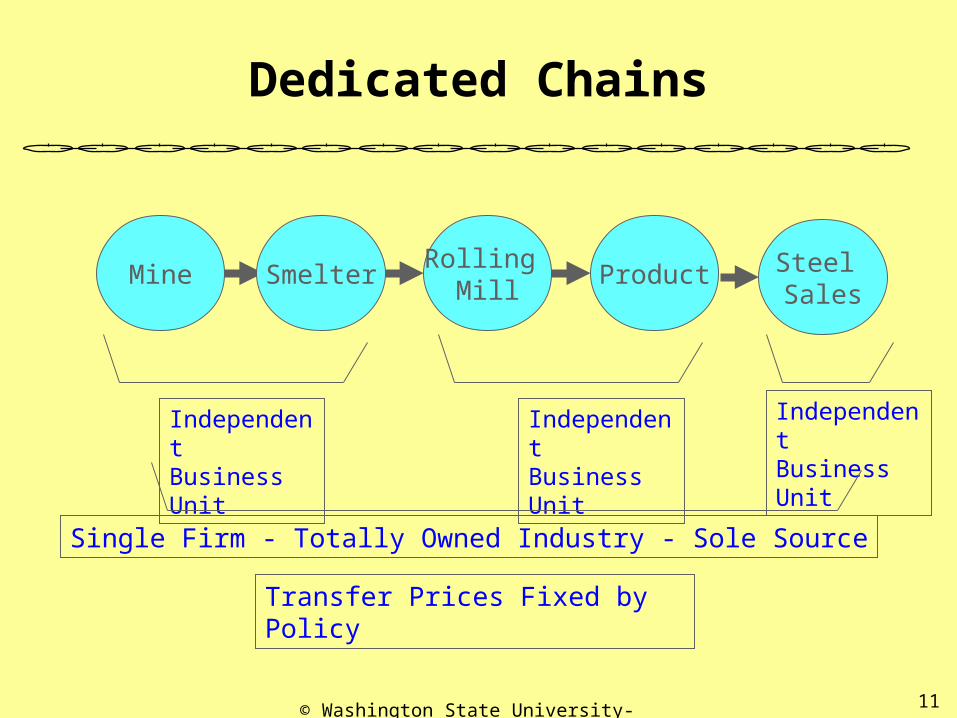
Dedicated Chains
Mine SmelterRolling
MillProduct Steel
Sales
IndependentBusiness Unit
IndependentBusiness Unit
IndependentBusiness Unit
Single Firm - Totally Owned Industry - Sole Source
Transfer Prices Fixed by Policy
© Washington State University-2004 12
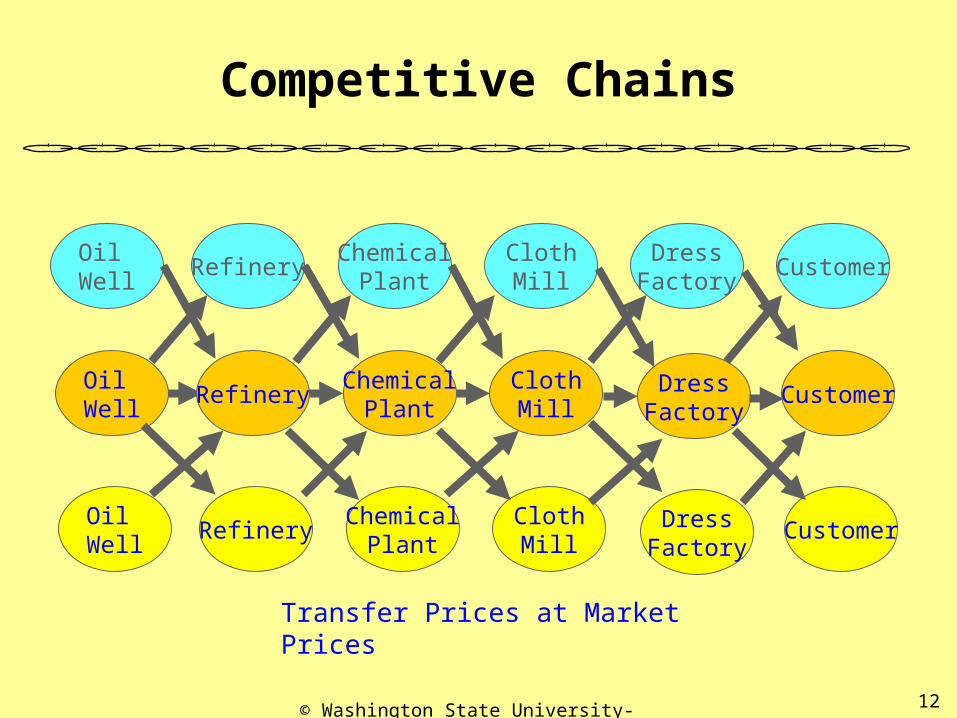
Competitive Chains
Oil Well
RefineryChemical
PlantClothMill
DressFactory
Customer
ClothMill
ClothMill
ChemicalPlant
ChemicalPlant
Oil Well
RefineryDress
FactoryCustomer
Oil Well
Refinery DressFactory
Customer
Transfer Prices at Market Prices
© Washington State University-2009 13
Supply Chain Issues
• In the future, competition will no longer be between competitors, it will be between competitive supply chains.
• Successful supply chains must respond quickly to the changing tastes of the final customer.
• The stumbling bock to FAST is the Information System
• Current Business to Business software offers near instant transfer of data
• But, is data what we need?

© Washington State University-2009 14
TOC Supply Chain Measures
• TOC Supply Chain Model Example: Dairy Farmers Cooperative
• The farmers own the Coop• Individuals own the cows• Individuals sell milk to the Coop• The Coop runs the Creamery• The Coop sells the milk, cheese, ice cream to the
customers• The Coop keeps 5% profit• The other profit goes to the farmers• Everyone has some ownership in the success of the
chain.
© Washington State University-2009 15
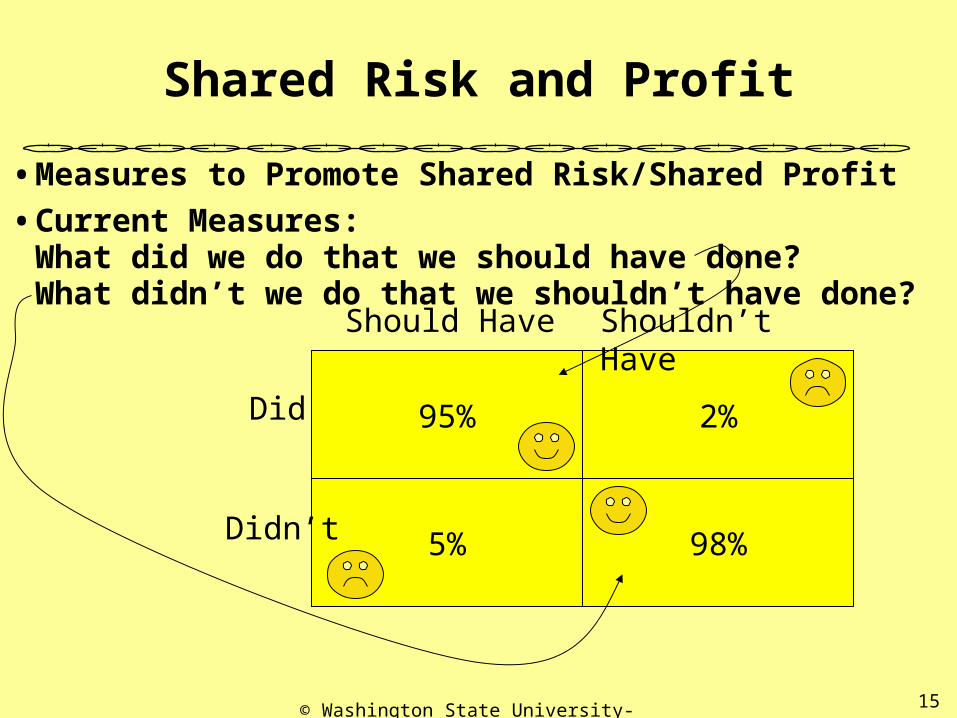
Shared Risk and Profit
• Measures to Promote Shared Risk/Shared Profit
• Current Measures:What did we do that we should have done?What didn’t we do that we shouldn’t have done?
95% 2%
5% 98%
Should Have Shouldn’t Have
Did
Didn’t
© Washington State University-2009 16
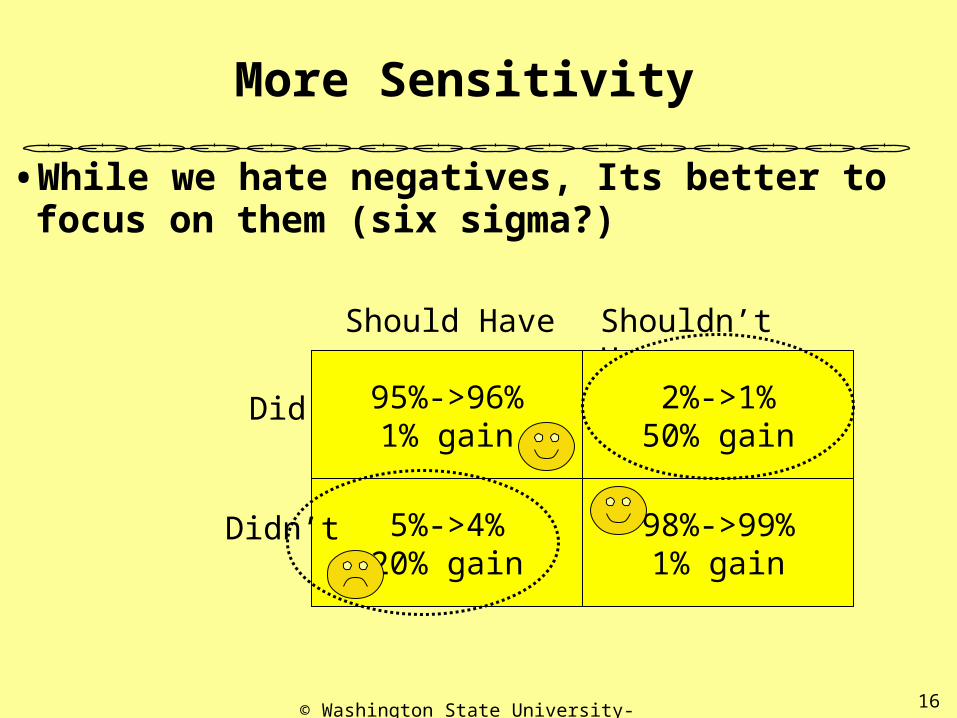
More Sensitivity
• While we hate negatives, Its better to focus on them (six sigma?)
95%->96%1% gain
5%->4%20% gain
98%->99%1% gain
Should Have Shouldn’t Have
Did
Didn’t
2%->1%50% gain
© Washington State University-2009 17
What don’t we do ?
• What Don’t We Do that we should? Deliver on time!
(Quality problems are really delivery problems)
• What Do we Do that we shouldn’t have done? Sloppy, in-effective, poor use of resources Cost over runs
© Washington State University-2009 18
Missed Delivery
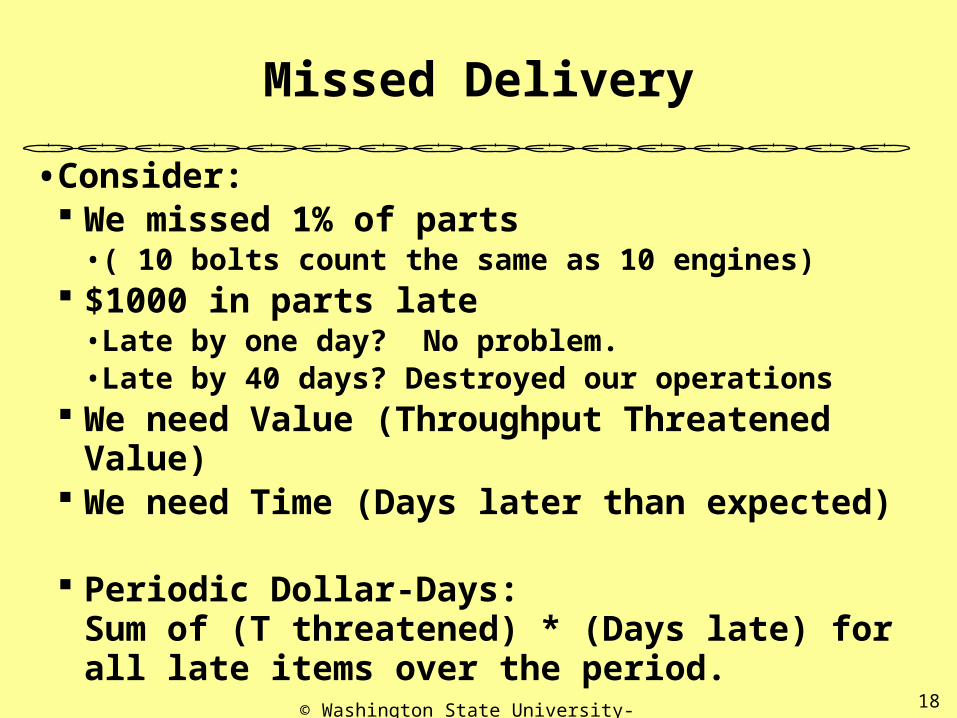
• Consider: We missed 1% of parts
• ( 10 bolts count the same as 10 engines) $1000 in parts late
• Late by one day? No problem.• Late by 40 days? Destroyed our operations
We need Value (Throughput Threatened Value) We need Time (Days later than expected)
Periodic Dollar-Days:Sum of (T threatened) * (Days late) for all late items over the period.
© Washington State University-2009 19
Use of Throughput Dollar-Days
• Have multiple Vendors for each purchased part.
• Give Best Vendor (fewest dollar days) 60% of orders
• Gives next best Vendor 35%
• Share last 5% between poor vendors.
© Washington State University-2009 20
But, We are supposed to Share!
• We can easily rate our vendors on Throughput Dollar days.
• We can rate the bolt vendor the same as the engine vendor. Either can jeopardize the loss of T.
• But, If we ask the vendor to wait for our payment until the project is sold at the final sale, how long should they wait?
• Longer is worse. (Bolt vs. Engine?)
• But what about volume? If you take more of my product is that worse or better? High volumes are high investment / risk for the vendor.
© Washington State University-2009 21
Inventory Dollar Days
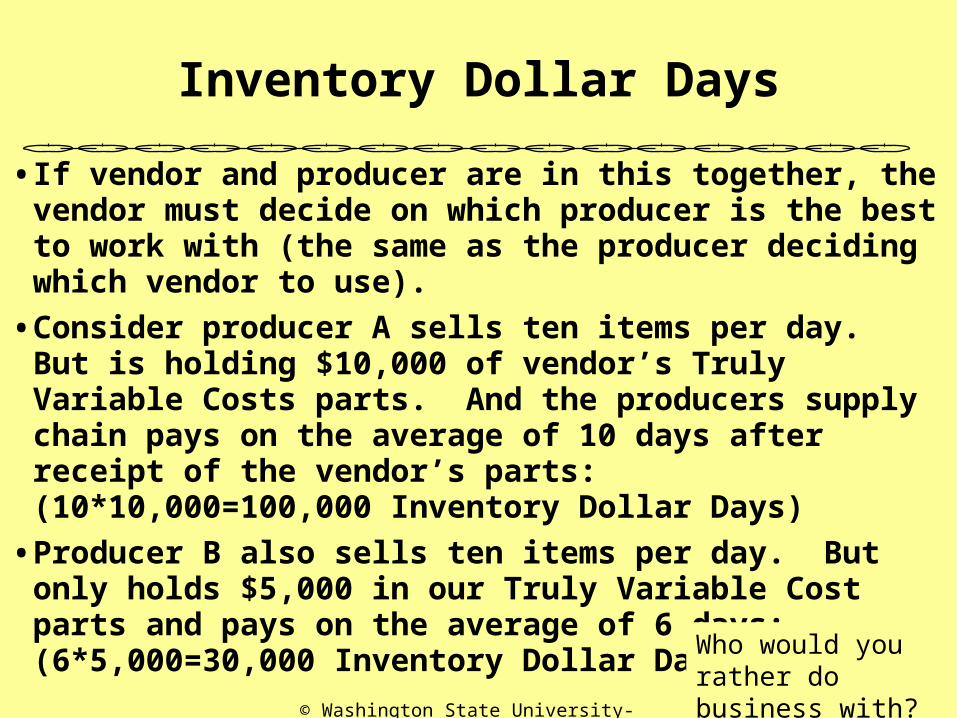
• If vendor and producer are in this together, the vendor must decide on which producer is the best to work with (the same as the producer deciding which vendor to use).
• Consider producer A sells ten items per day. But is holding $10,000 of vendor’s Truly Variable Costs parts. And the producers supply chain pays on the average of 10 days after receipt of the vendor’s parts: (10*10,000=100,000 Inventory Dollar Days)
• Producer B also sells ten items per day. But only holds $5,000 in our Truly Variable Cost parts and pays on the average of 6 days: (6*5,000=30,000 Inventory Dollar Days)
Who would you rather do business with?
© Washington State University-2009 22
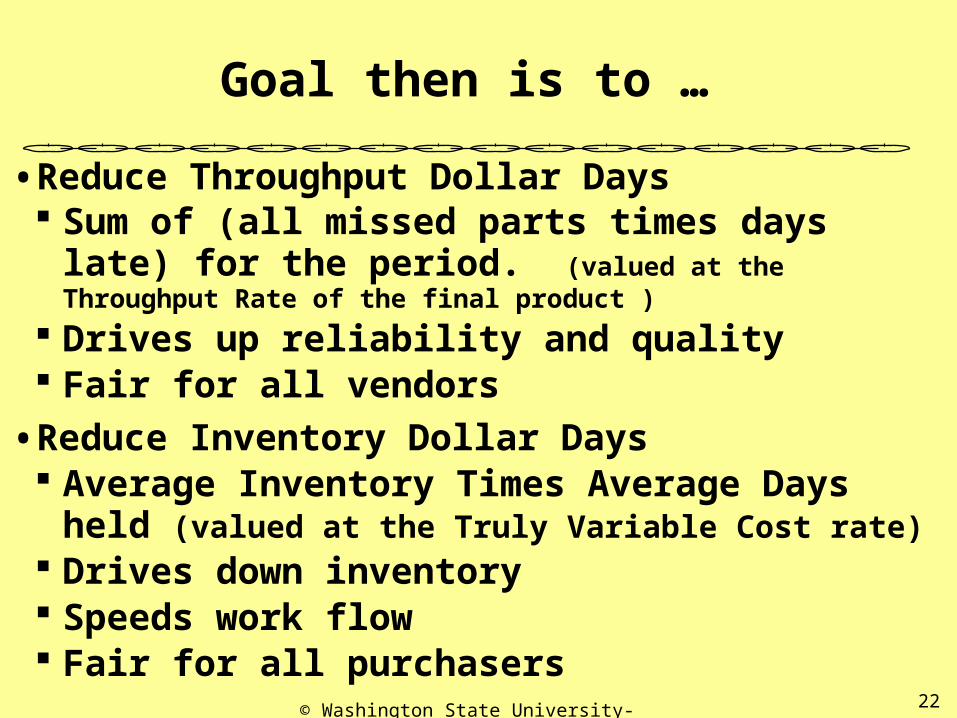
Goal then is to …
• Reduce Throughput Dollar Days Sum of (all missed parts times days late) for the
period. (valued at the Throughput Rate of the final product )
Drives up reliability and quality Fair for all vendors
• Reduce Inventory Dollar Days Average Inventory Times Average Days held
(valued at the Truly Variable Cost rate) Drives down inventory Speeds work flow Fair for all purchasers
© Washington State University-2009 23
Trust is only gained when
• We can trust each other and PROVE IT!
IDDTDD
© Washington State University-2009 24
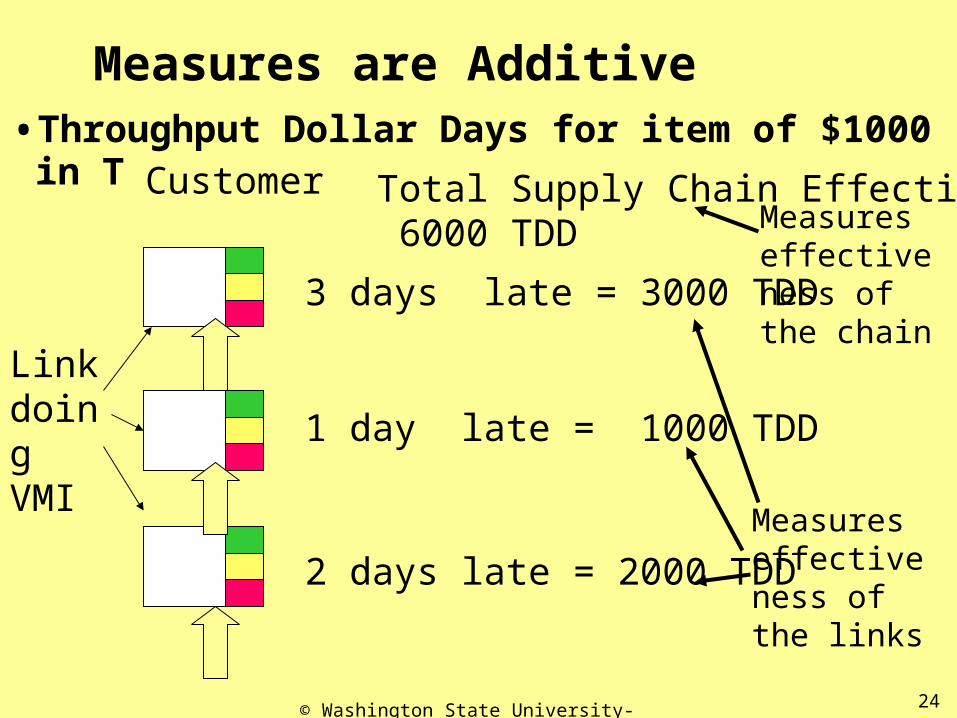
Measures are Additive• Throughput Dollar Days for item of $1000 in T
2 days late = 2000 TDD
1 day late = 1000 TDD
3 days late = 3000 TDD
Total Supply Chain Effectiveness 6000 TDD
Customer
Link doing VMI
Measures effectiveness of the links
Measures effectiveness of the chain
© Washington State University-2009 25
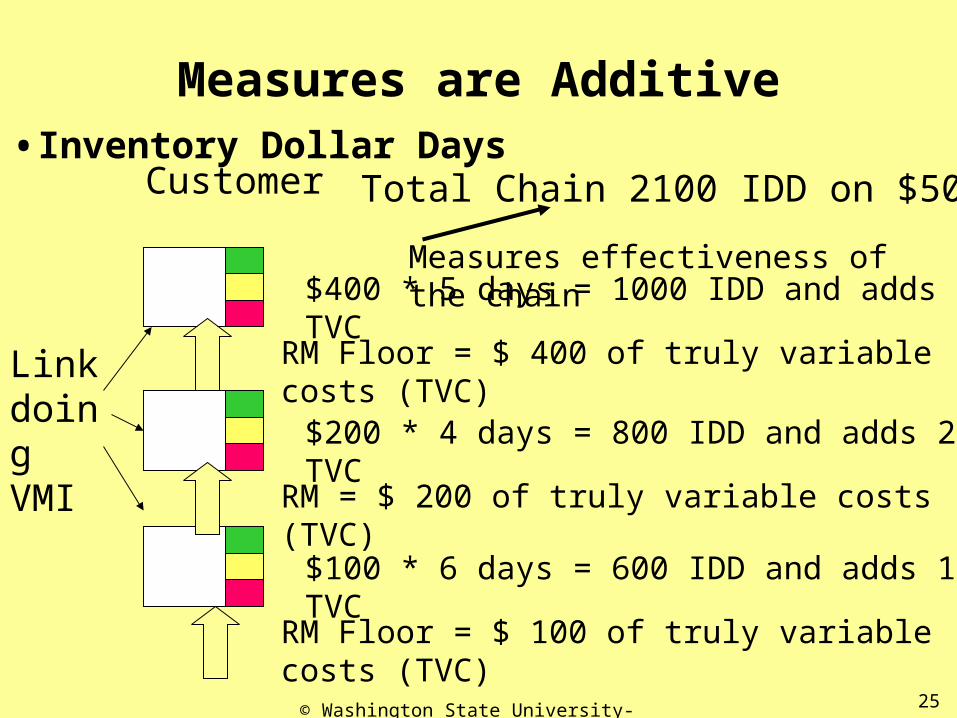
Measures are Additive• Inventory Dollar Days
$100 * 6 days = 600 IDD and adds 100 TVC
Total Chain 2100 IDD on $500 TVCCustomer
Link doing VMI
RM Floor = $ 100 of truly variable costs (TVC)
$200 * 4 days = 800 IDD and adds 200 TVC
$400 * 5 days = 1000 IDD and adds 100 TVCMeasures effectiveness of the chain
RM = $ 200 of truly variable costs (TVC)
RM Floor = $ 400 of truly variable costs (TVC)
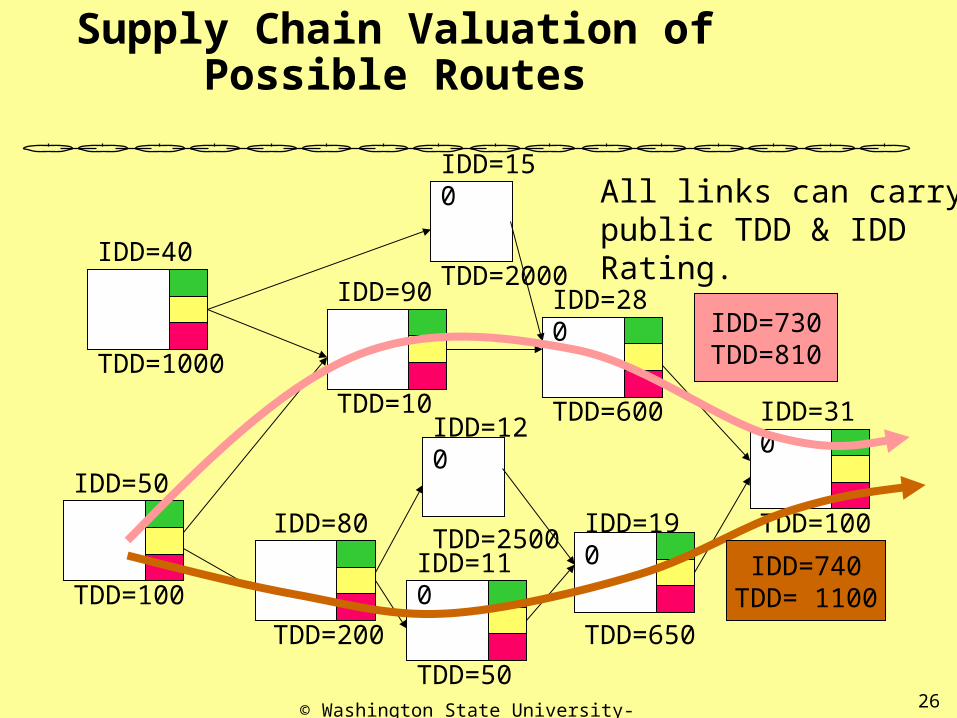
© Washington State University-2009 26
Supply Chain Valuation of Possible Routes
IDD=40
TDD=1000
IDD=50
TDD=100
IDD=150
TDD=2000IDD=90
TDD=10
IDD=280
TDD=600
IDD=80
TDD=200
IDD=120
TDD=2500IDD=190
TDD=650
IDD=110
TDD=50
IDD=310
TDD=100
All links can carry public TDD & IDD Rating.
IDD=740TDD= 1100
IDD=730TDD=810
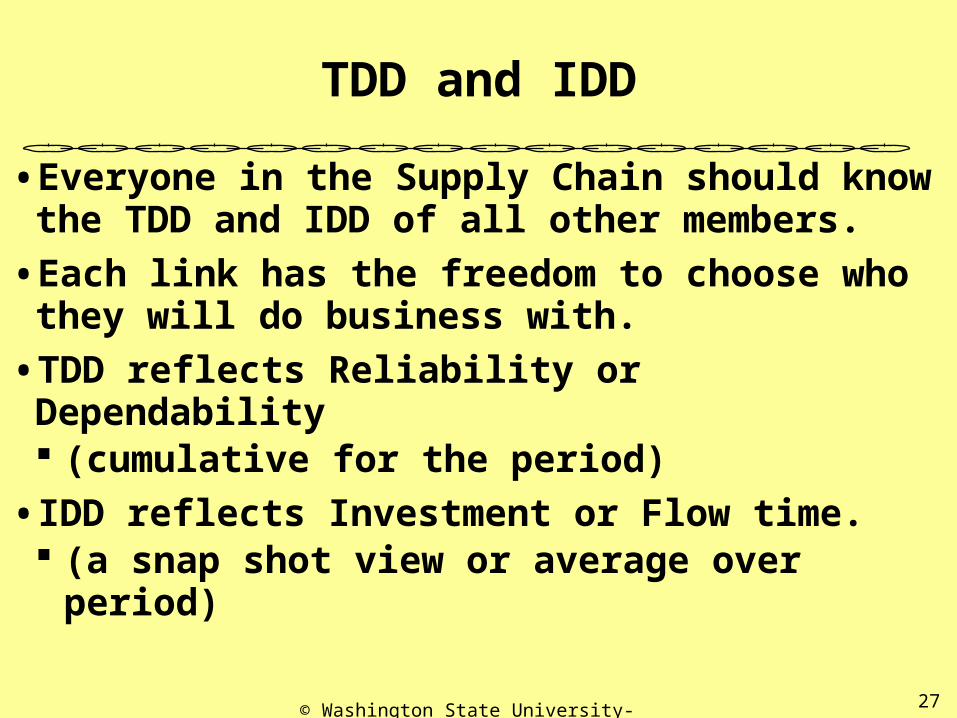
© Washington State University-2009 27
TDD and IDD
• Everyone in the Supply Chain should know the TDD and IDD of all other members.
• Each link has the freedom to choose who they will do business with.
• TDD reflects Reliability or Dependability (cumulative for the period)
• IDD reflects Investment or Flow time. (a snap shot view or average over period)
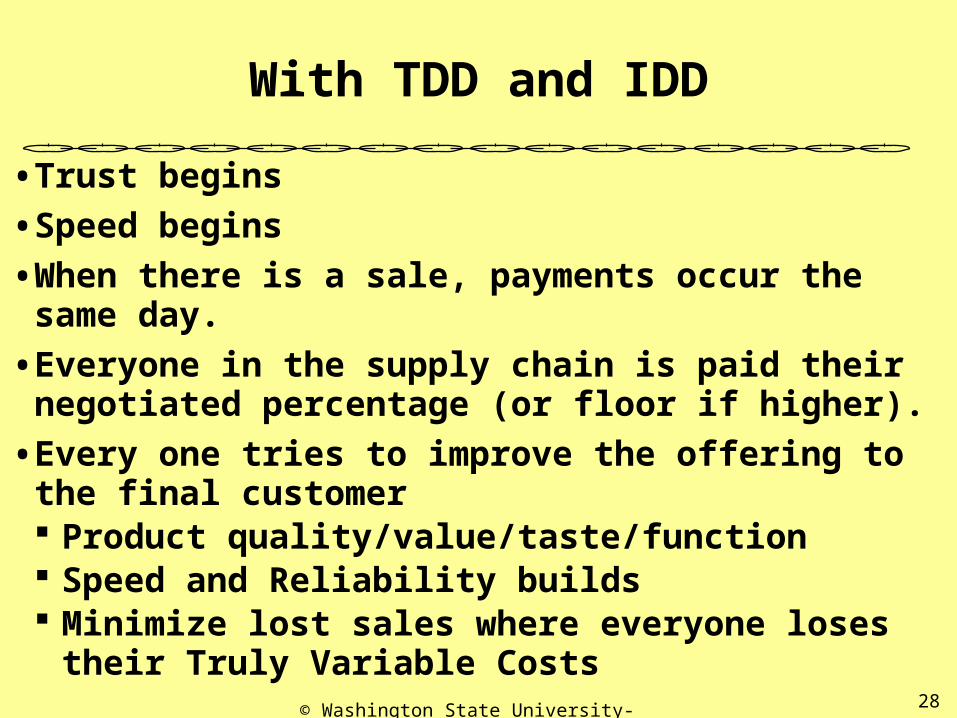
© Washington State University-2009 28
With TDD and IDD
• Trust begins
• Speed begins
• When there is a sale, payments occur the same day.
• Everyone in the supply chain is paid their negotiated percentage (or floor if higher).
• Every one tries to improve the offering to the final customer Product quality/value/taste/function Speed and Reliability builds Minimize lost sales where everyone loses their
Truly Variable Costs
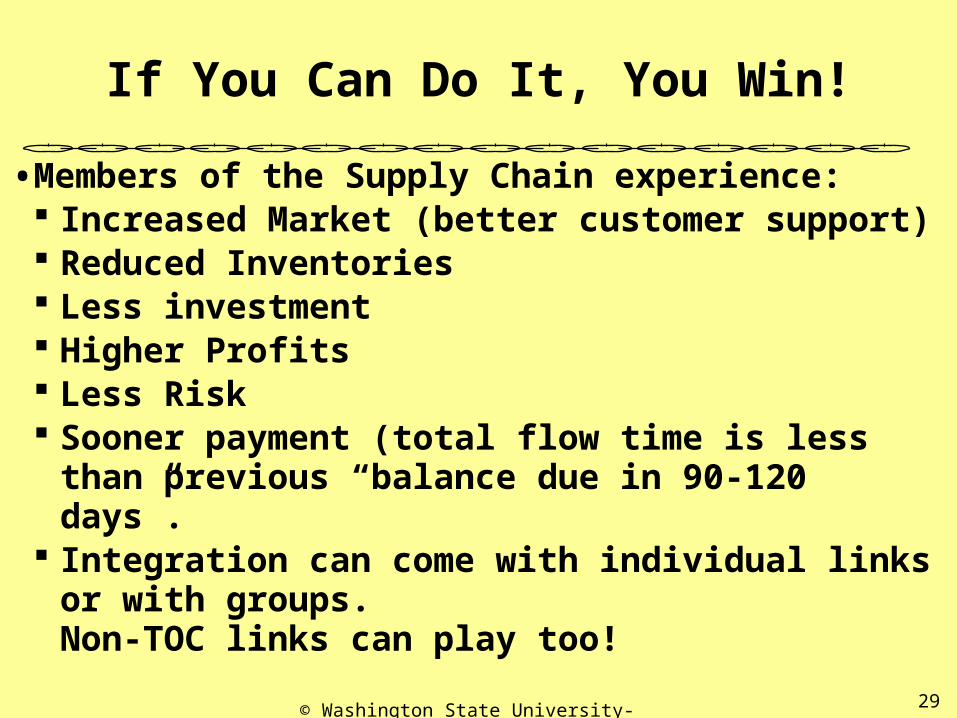
© Washington State University-2009 29
If You Can Do It, You Win!
• Members of the Supply Chain experience: Increased Market (better customer support) Reduced Inventories Less investment Higher Profits Less Risk Sooner payment (total flow time is less than
previous “balance due in 90-120 days”. Integration can come with individual links or with
groups. Non-TOC links can play too!
© Washington State University-2004 30
Simple Measures Drive Behavior
• These two measures drive the behavior we want in the Distribution (and production) line:TDD Says, “Don’t miss a delivery (avoid failure).
And, if you do, fix it fast!”IDD Says, “Don’t let Inventory sit around idle in
places where it does no good. Quickly move it to where it protects TDD and then reduce it both in quantity and in time held.”
• TDD and IDD become a Drill Sargent Mentality: MOVE IT! MOVE IT! MOVE IT!
© Washington State University-2004 31
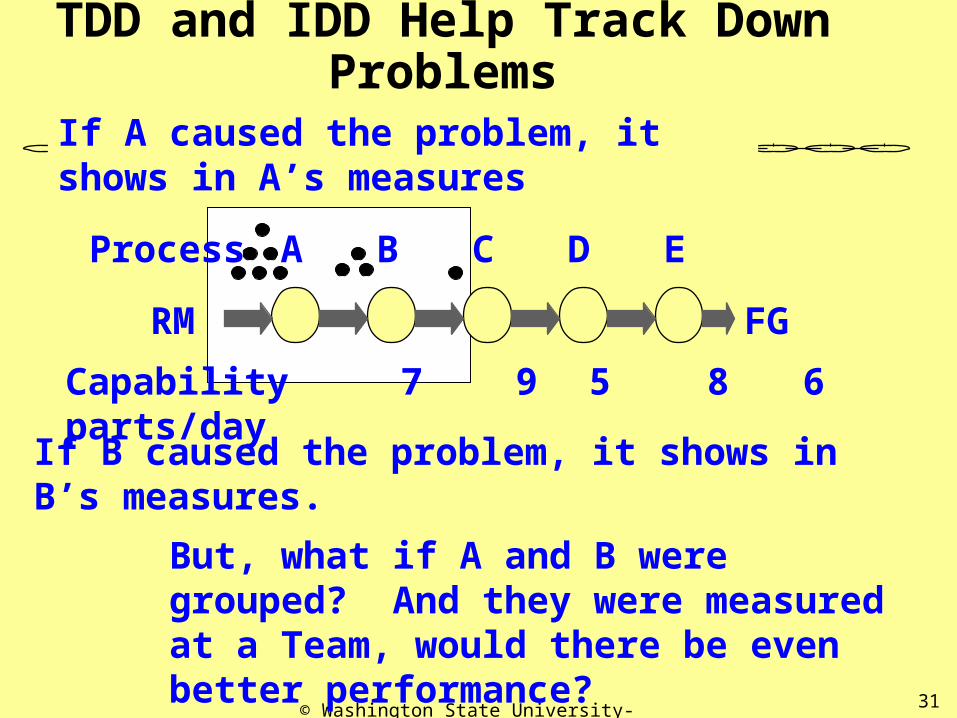
But, what if A and B were grouped? And they were measured at a Team, would there be even better performance?
TDD and IDD Help Track Down Problems
Process A B C D E
RM FG
Capability 7 9 5 8 6 parts/day
If A caused the problem, it shows in A’s measures
If B caused the problem, it shows in B’s measures.
© Washington State University-2004 32
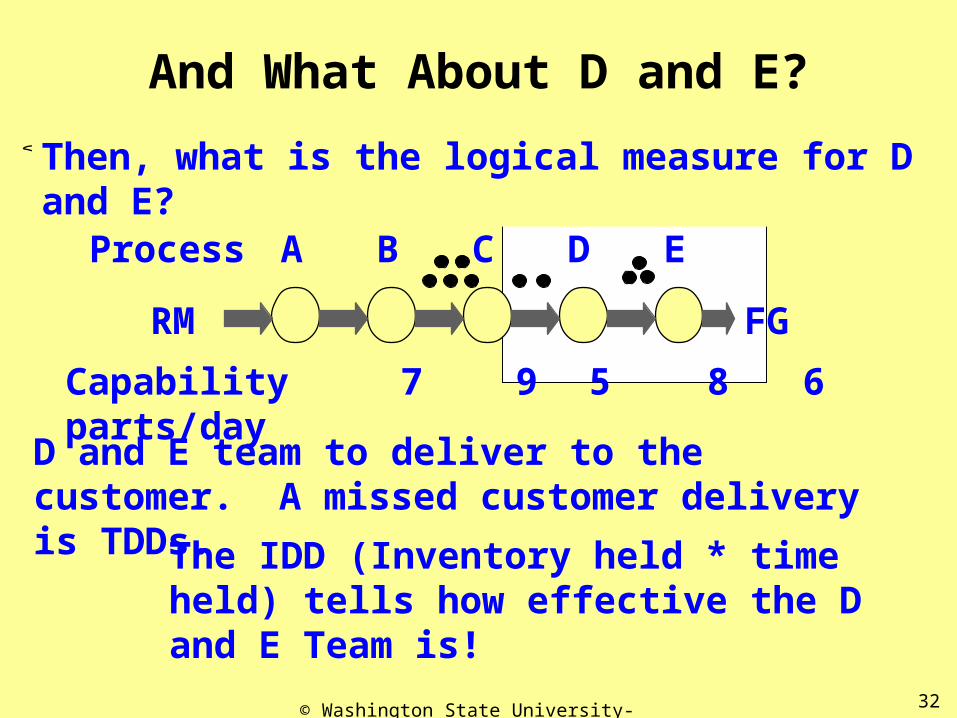
D and E team to deliver to the customer. A missed customer delivery is TDDs.
The IDD (Inventory held * time held) tells how effective the D and E Team is!
And What About D and E?
Process A B C D E
RM FG
Capability 7 9 5 8 6 parts/day
Then, what is the logical measure for D and E?
© Washington State University-2004 33
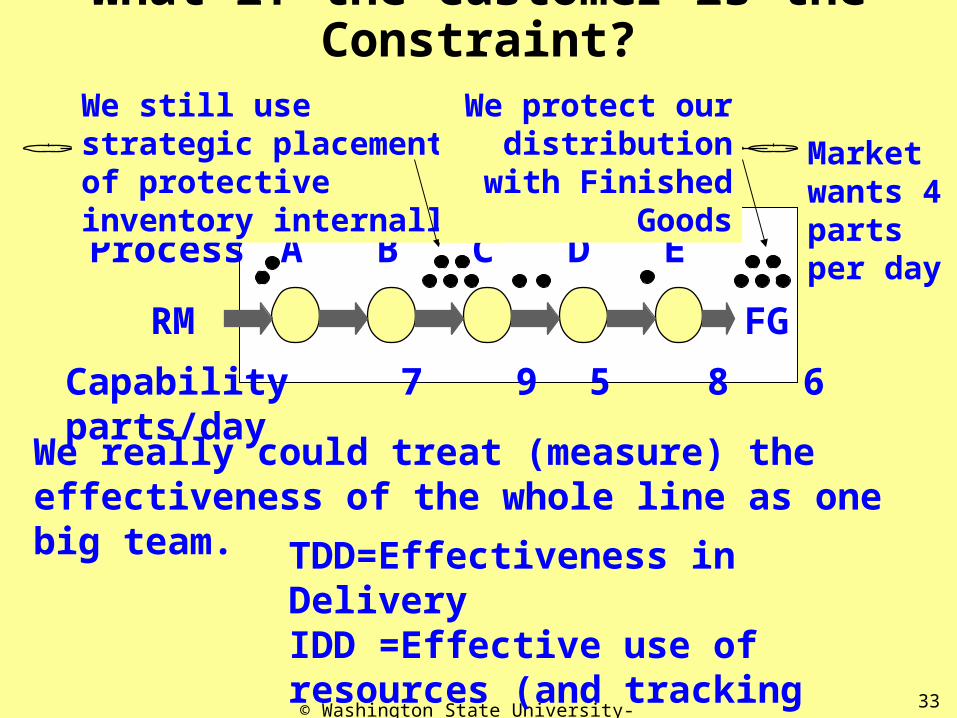
We really could treat (measure) the effectiveness of the whole line as one big team.
TDD=Effectiveness in DeliveryIDD =Effective use of resources (and tracking improvements)
What if the Customer is the Constraint?
Process A B C D E
RM FG
Capability 7 9 5 8 6 parts/day
Market wants 4 parts per day
We still use strategic placement of protective inventory internally
We protect our distribution with Finished Goods
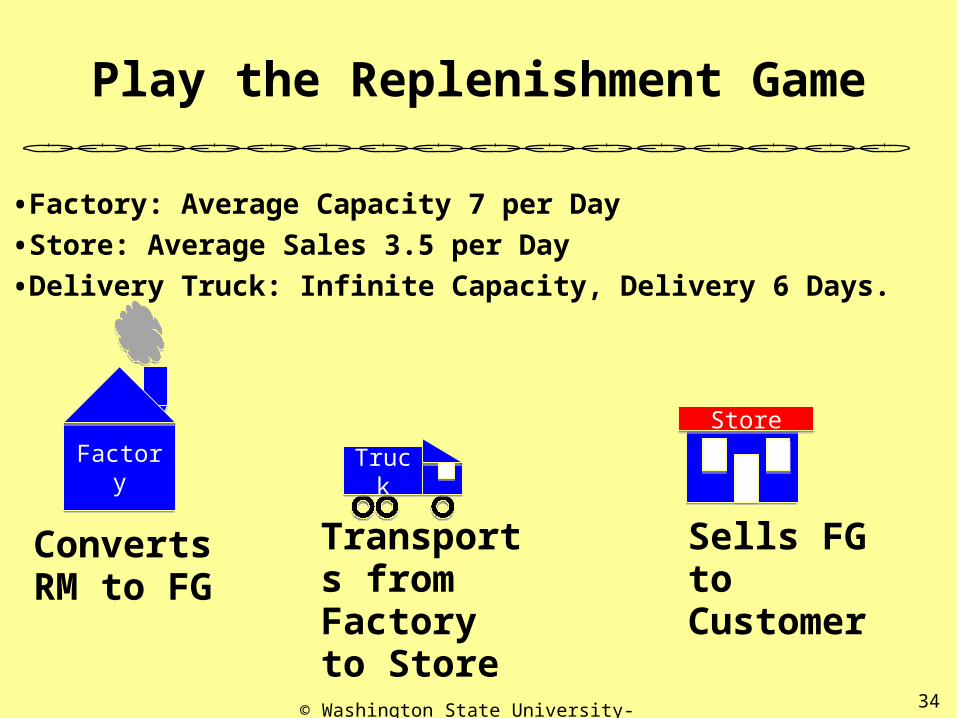
Play the Replenishment Game
• Factory: Average Capacity 7 per Day
• Store: Average Sales 3.5 per Day
• Delivery Truck: Infinite Capacity, Delivery 6 Days.
© Washington State University-2009 34
FactoryFactory
StoreStore
TruckTruck
Converts RM to FG
Transports from Factory to Store
Sells FG to Customer
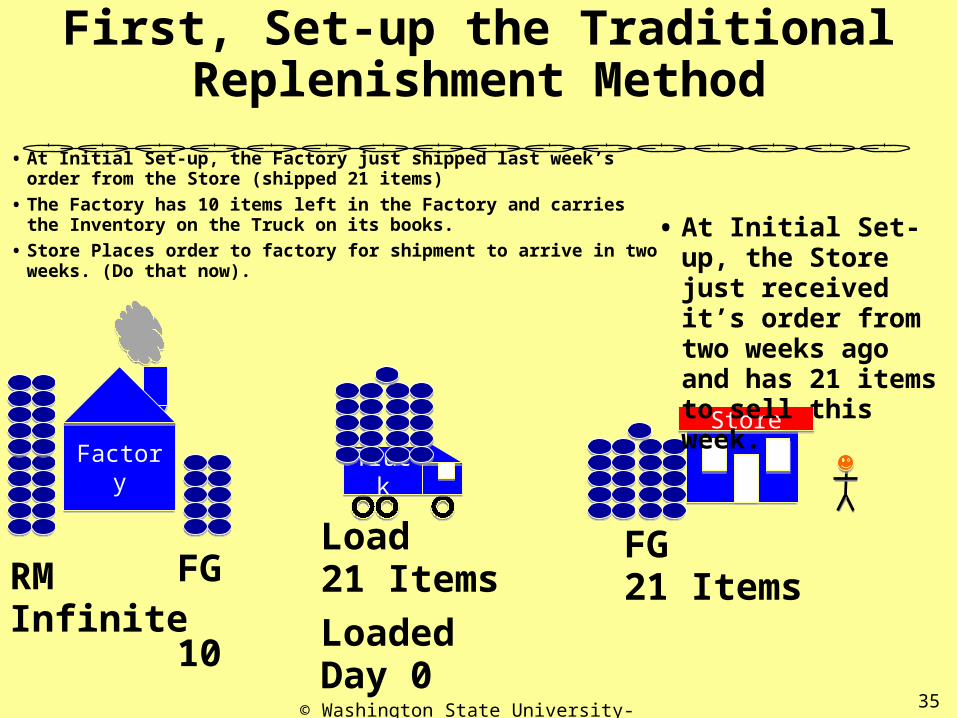
First, Set-up the Traditional Replenishment Method
• At Initial Set-up, the Factory just shipped last week’s order from the Store (shipped 21 items)
• The Factory has 10 items left in the Factory and carries the Inventory on the Truck on its books.
• Store Places order to factory for shipment to arrive in two weeks. (Do that now).
© Washington State University-2009 35
FactoryFactory
StoreStore
TruckTruck
RM Infinite
Load21 Items
Loaded Day 0
FG21 ItemsFG
10
• At Initial Set-up, the Store just received it’s order from two weeks ago and has 21 items to sell this week.
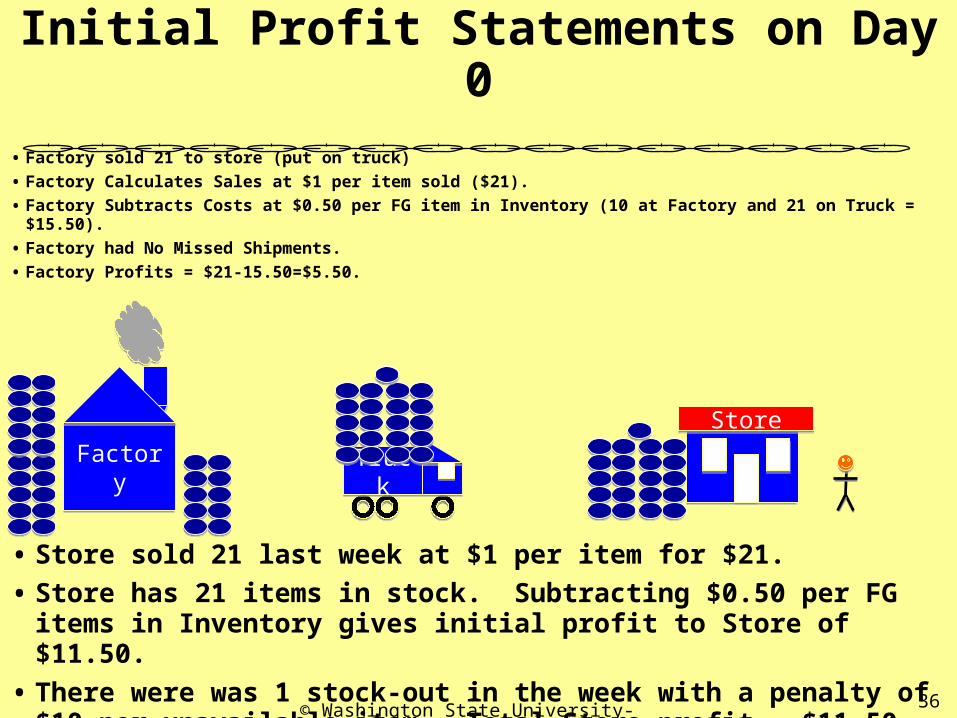
Initial Profit Statements on Day 0
• Factory sold 21 to store (put on truck)
• Factory Calculates Sales at $1 per item sold ($21).
• Factory Subtracts Costs at $0.50 per FG item in Inventory (10 at Factory and 21 on Truck = $15.50).
• Factory had No Missed Shipments.
• Factory Profits = $21-15.50=$5.50.
© Washington State University-2009 36
FactoryFactory
StoreStore
TruckTruck
• Store sold 21 last week at $1 per item for $21.
• Store has 21 items in stock. Subtracting $0.50 per FG items in Inventory gives initial profit to Store of $11.50.
• There were was 1 stock-out in the week with a penalty of $10 per unavailable item. Total Store profit = $11.50-10=$1.50.
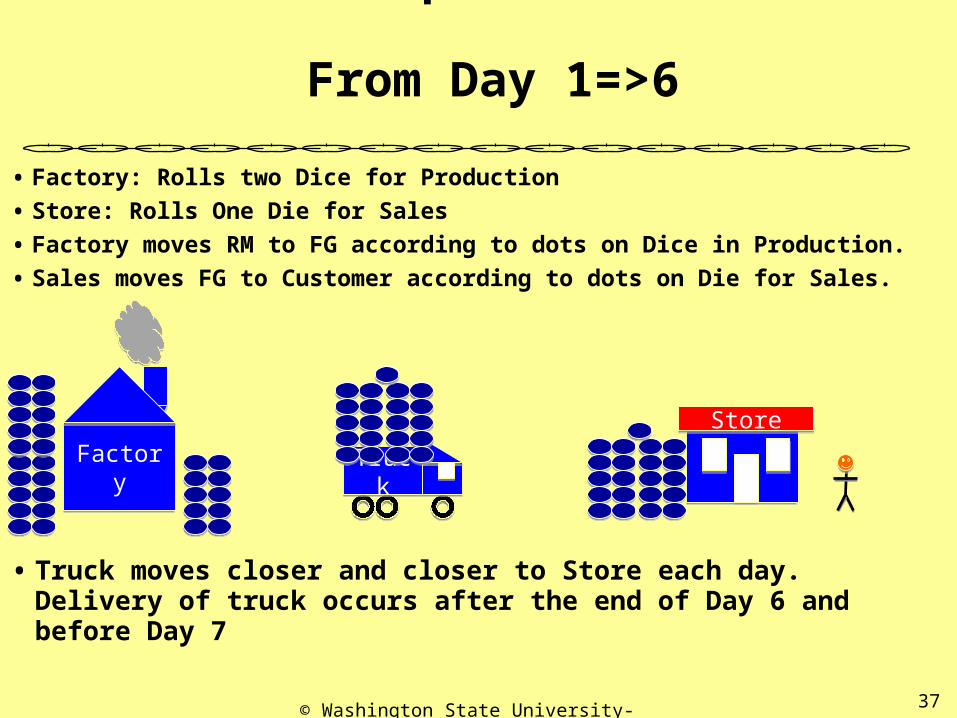
Traditional Replenishment Method From Day 1=>6
• Factory: Rolls two Dice for Production
• Store: Rolls One Die for Sales
• Factory moves RM to FG according to dots on Dice in Production.
• Sales moves FG to Customer according to dots on Die for Sales.
© Washington State University-2009 37
FactoryFactory
StoreStore
TruckTruck
• Truck moves closer and closer to Store each day. Delivery of truck occurs after the end of Day 6 and before Day 7
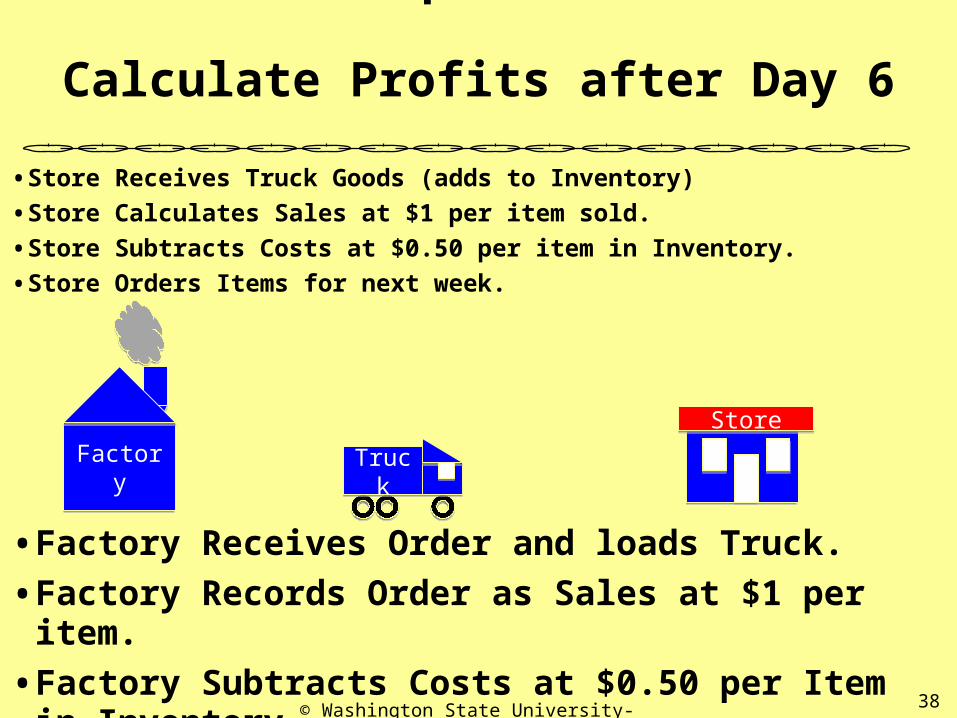
Traditional Replenishment Method Calculate Profits after Day 6
• Store Receives Truck Goods (adds to Inventory)
• Store Calculates Sales at $1 per item sold.
• Store Subtracts Costs at $0.50 per item in Inventory.
• Store Orders Items for next week.
© Washington State University-2009 38
FactoryFactory
StoreStore
TruckTruck
• Factory Receives Order and loads Truck.
• Factory Records Order as Sales at $1 per item.
• Factory Subtracts Costs at $0.50 per Item in Inventory.
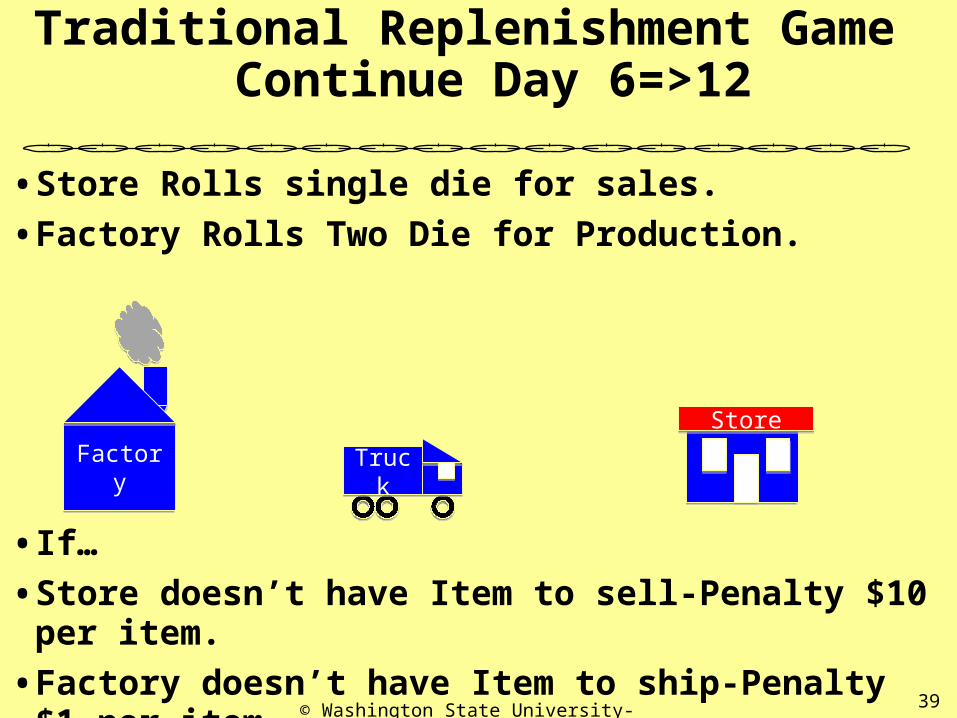
Traditional Replenishment Game Continue Day 6=>12
• Store Rolls single die for sales.
• Factory Rolls Two Die for Production.
© Washington State University-2009 39
FactoryFactory
StoreStore
TruckTruck
• If…
• Store doesn’t have Item to sell-Penalty $10 per item.
• Factory doesn’t have Item to ship-Penalty $1 per item.
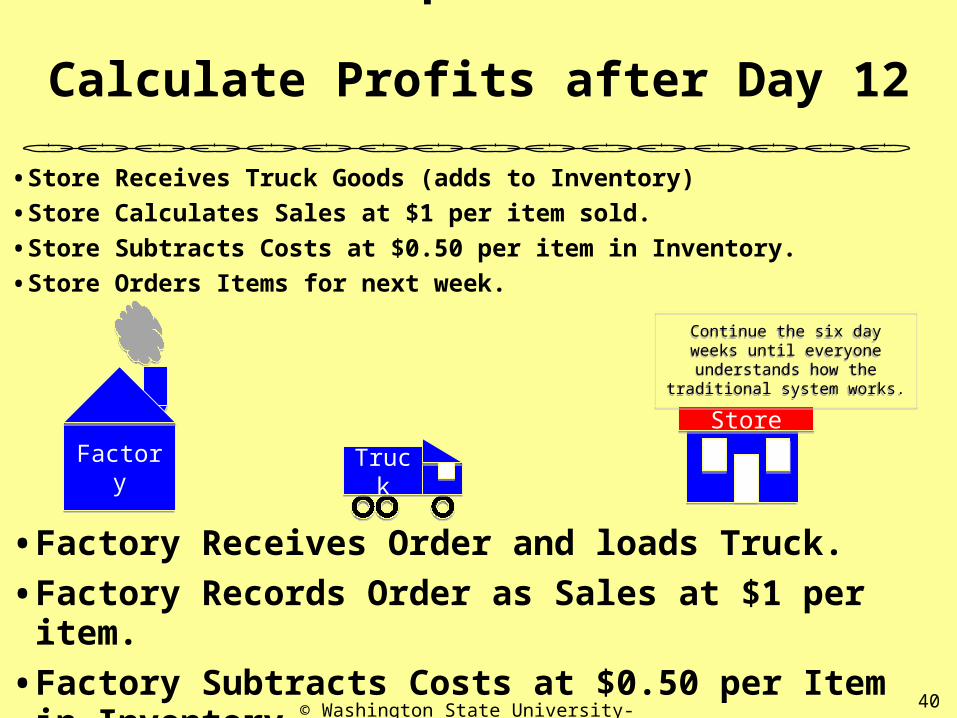
Traditional Replenishment Method Calculate Profits after Day 12
• Store Receives Truck Goods (adds to Inventory)
• Store Calculates Sales at $1 per item sold.
• Store Subtracts Costs at $0.50 per item in Inventory.
• Store Orders Items for next week.
© Washington State University-2009 40
FactoryFactory
StoreStore
TruckTruck
• Factory Receives Order and loads Truck.
• Factory Records Order as Sales at $1 per item.
• Factory Subtracts Costs at $0.50 per Item in Inventory.
Continue the six day weeks until everyone understands how the
traditional system works.
Continue the six day weeks until everyone understands how the
traditional system works.
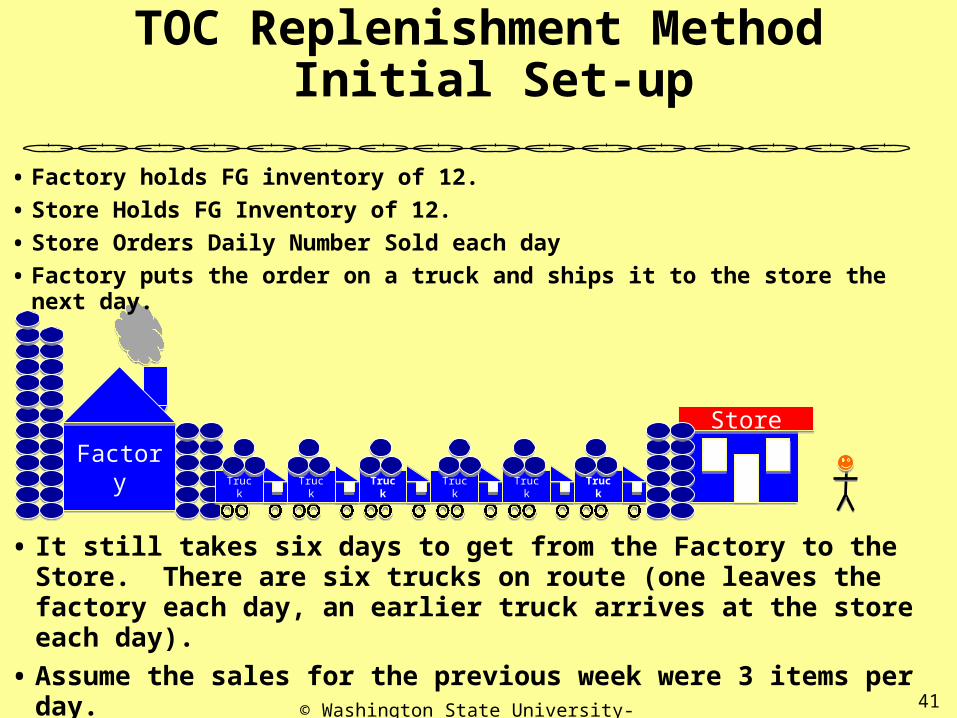
TOC Replenishment Method Initial Set-up
• Factory holds FG inventory of 12.
• Store Holds FG Inventory of 12.
• Store Orders Daily Number Sold each day
• Factory puts the order on a truck and ships it to the store the next day.
© Washington State University-2009 41
FactoryFactory
StoreStore
TruckTruck TruckTruck TruckTruck TruckTruck TruckTruck TruckTruck
• It still takes six days to get from the Factory to the Store. There are six trucks on route (one leaves the factory each day, an earlier truck arrives at the store each day).
• Assume the sales for the previous week were 3 items per day.
• Each truck on its way this week has three times in it.
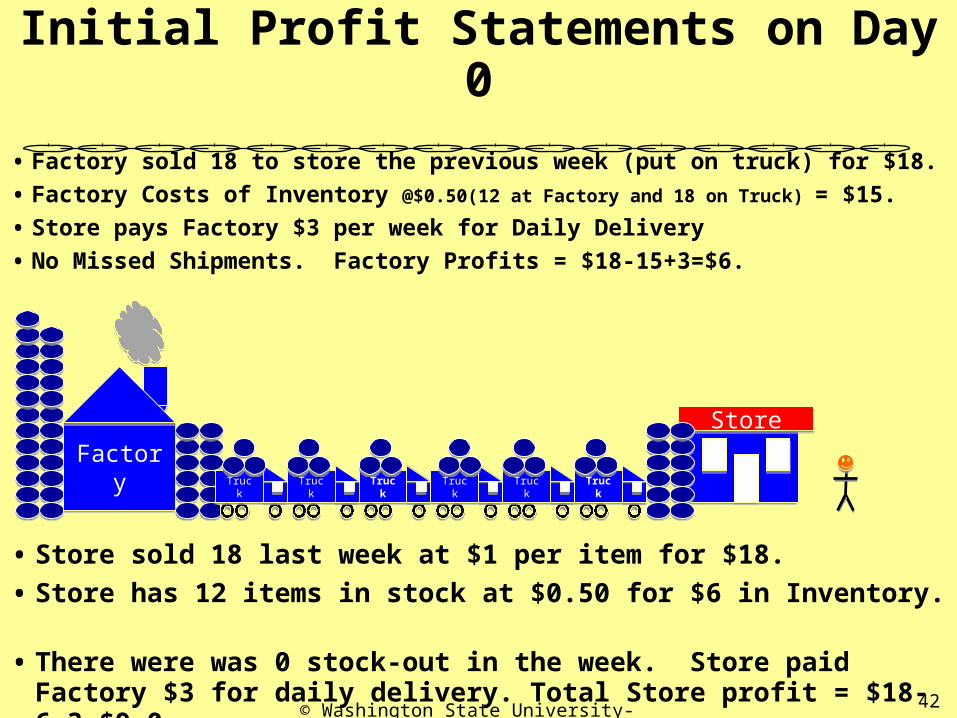
TOC MethodInitial Profit Statements on Day 0
• Factory sold 18 to store the previous week (put on truck) for $18.
• Factory Costs of Inventory @$0.50(12 at Factory and 18 on Truck) = $15.
• Store pays Factory $3 per week for Daily Delivery
• No Missed Shipments. Factory Profits = $18-15+3=$6.
© Washington State University-2009 42
• Store sold 18 last week at $1 per item for $18.
• Store has 12 items in stock at $0.50 for $6 in Inventory.
• There were was 0 stock-out in the week. Store paid Factory $3 for daily delivery. Total Store profit = $18-6-3=$9.0.
FactoryFactory
StoreStore
TruckTruck TruckTruck TruckTruck TruckTruck TruckTruck TruckTruck
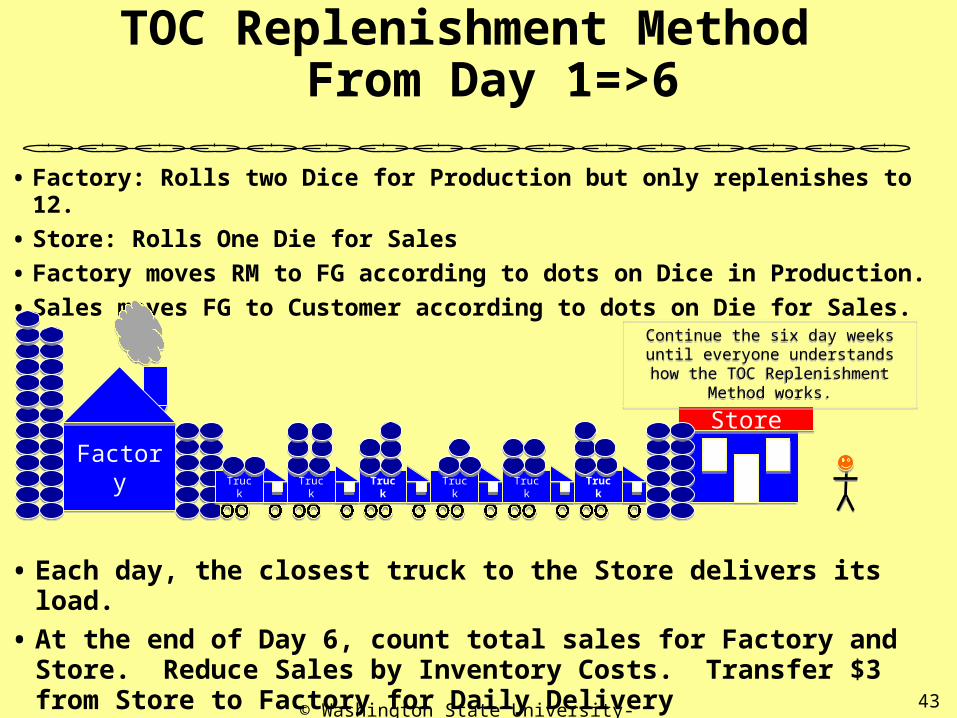
TOC Replenishment Method From Day 1=>6
• Factory: Rolls two Dice for Production but only replenishes to 12.
• Store: Rolls One Die for Sales
• Factory moves RM to FG according to dots on Dice in Production.
• Sales moves FG to Customer according to dots on Die for Sales.
© Washington State University-2009 43
• Each day, the closest truck to the Store delivers its load.
• At the end of Day 6, count total sales for Factory and Store. Reduce Sales by Inventory Costs. Transfer $3 from Store to Factory for Daily Delivery
FactoryFactory
StoreStore
TruckTruck TruckTruck TruckTruck TruckTruck TruckTruck TruckTruck
Continue the six day weeks until everyone understands how the TOC
Replenishment Method works.
Continue the six day weeks until everyone understands how the TOC
Replenishment Method works.
Replenishment S&T
• Consumer Goods S&T• http://www.vancouver.wsu.edu/fac/holt/em534/S&TConsumerGoodsLevel4-1.pd
f
© Washington State University-2009 44
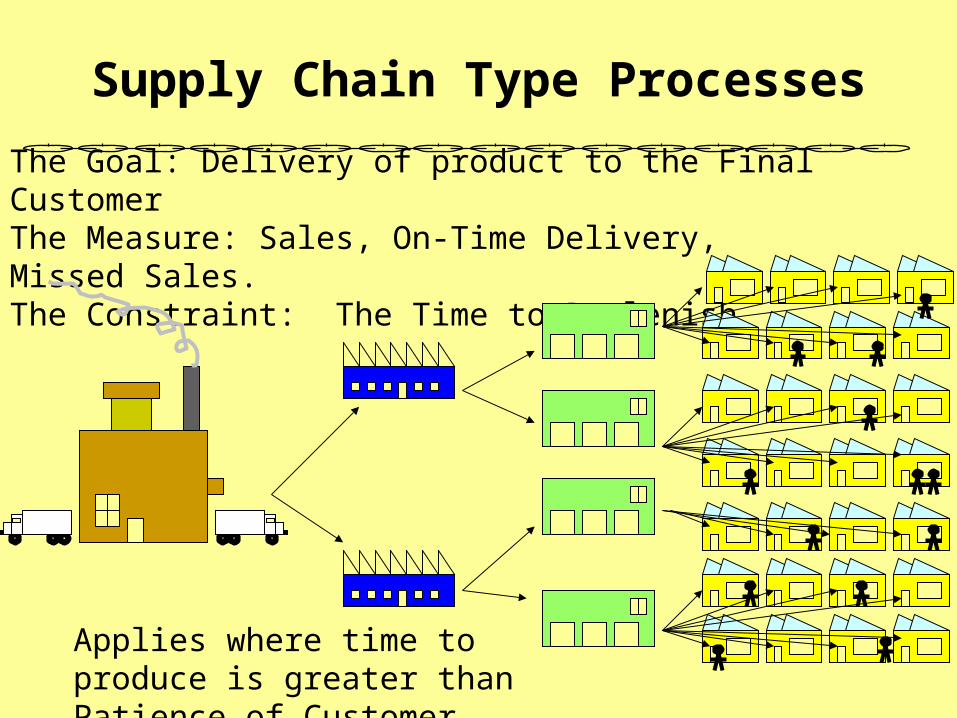
Supply Chain Type Processes
The Goal: Delivery of product to the Final CustomerThe Measure: Sales, On-Time Delivery, Missed Sales. The Constraint: The Time to Replenish
Applies where time to produce is greater than Patience of Customer
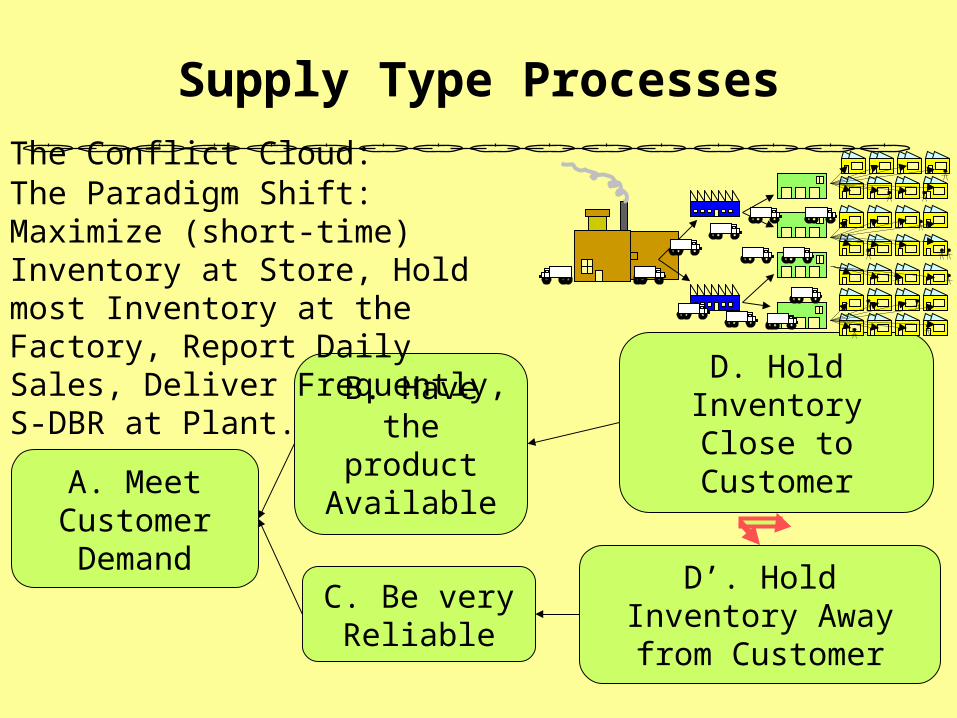
Supply Type Processes
A. Meet Customer Demand
B. Have the product
Available
D. Hold Inventory Close to Customer
C. Be very Reliable
D’. Hold Inventory Away from Customer
The Conflict Cloud:The Paradigm Shift: Maximize (short-time) Inventory at Store, Hold most Inventory at the Factory, Report Daily Sales, Deliver Frequently, S-DBR at Plant.
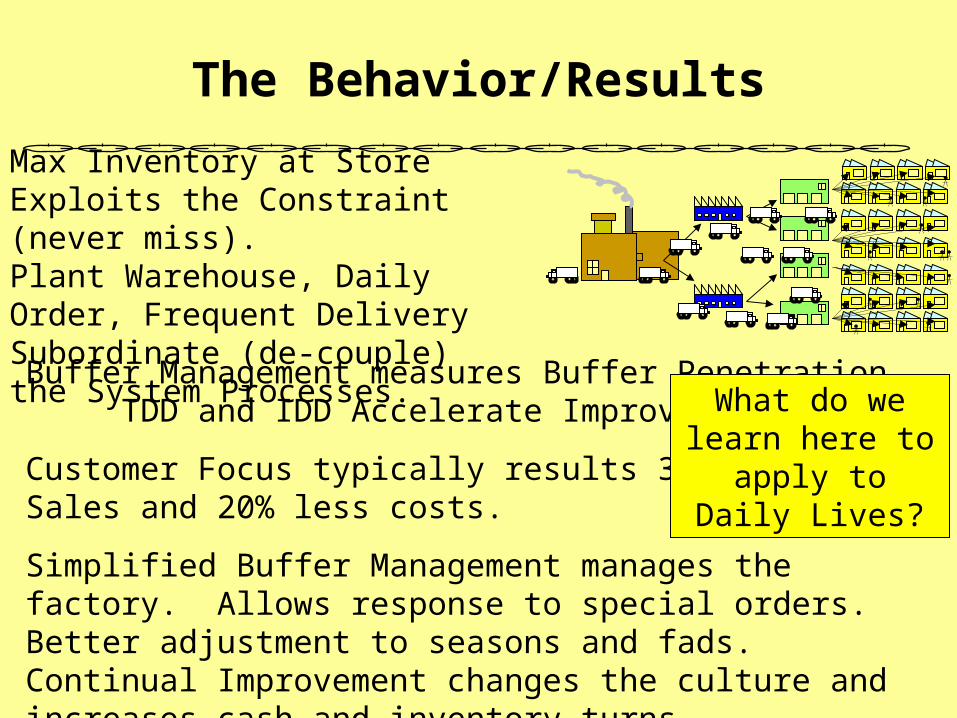
The Behavior/Results
Max Inventory at Store Exploits the Constraint (never miss).Plant Warehouse, Daily Order, Frequent Delivery Subordinate (de-couple) the System Processes.
Buffer Management measures Buffer Penetration TDD and IDD Accelerate Improvement.
Customer Focus typically results 30% moreSales and 20% less costs.
Simplified Buffer Management manages the factory. Allows response to special orders. Better adjustment to seasons and fads. Continual Improvement changes the culture and increases cash and inventory turns.
What do we learn here to apply to
Daily Lives?
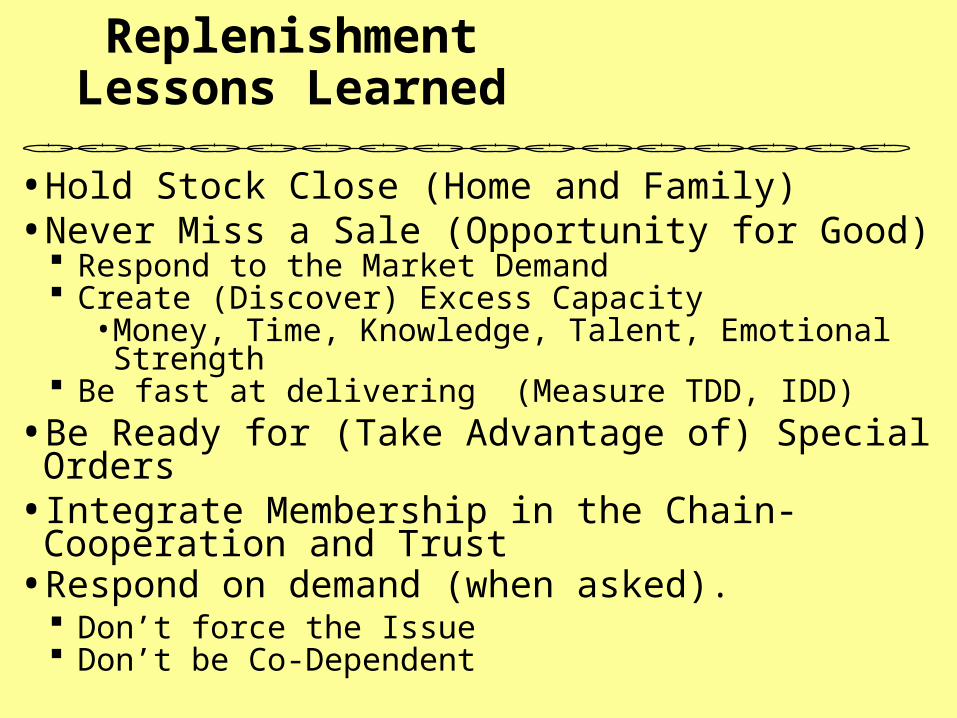
Replenishment Lessons Learned
• Hold Stock Close (Home and Family)• Never Miss a Sale (Opportunity for Good)
Respond to the Market Demand Create (Discover) Excess Capacity
• Money, Time, Knowledge, Talent, Emotional Strength Be fast at delivering (Measure TDD, IDD)
• Be Ready for (Take Advantage of) Special Orders• Integrate Membership in the Chain-Cooperation and
Trust • Respond on demand (when asked).
Don’t force the Issue Don’t be Co-Dependent
© Washington State University-2009 49
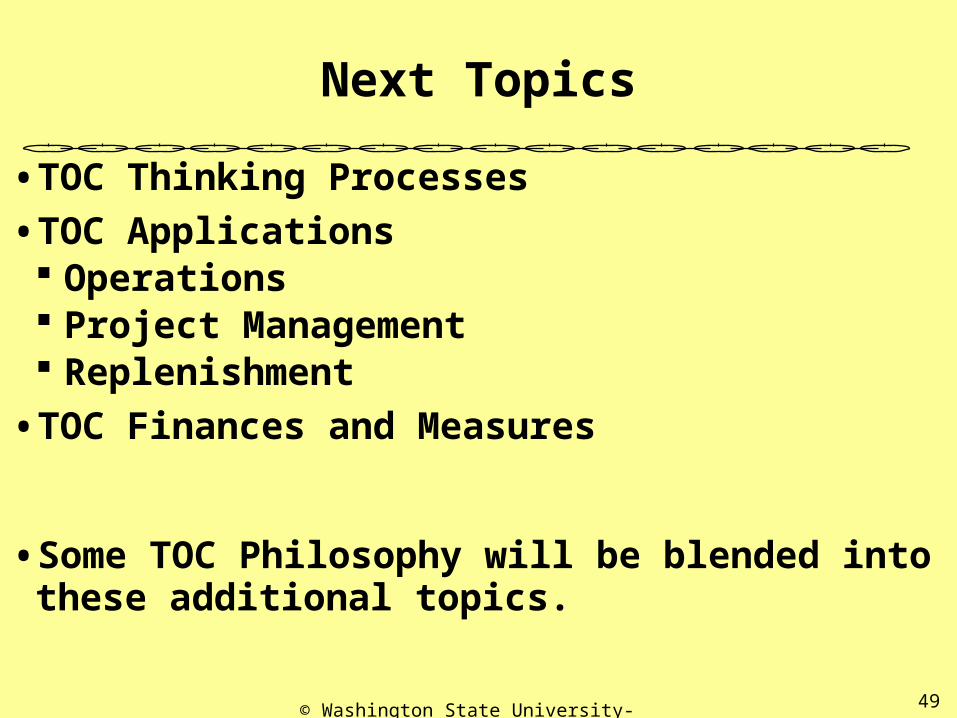
Next Topics
• TOC Thinking Processes
• TOC Applications Operations Project Management Replenishment
• TOC Finances and Measures
• Some TOC Philosophy will be blended into these additional topics.