Tobin's Ratio And Industrial Organization: Further Results
15
EG & E WORKING PAPERS TOBIN'S RTIO A INDUSTRIAL ORGNIZATION: FTHR RESULTS Carl R. Schwin WORING PAPER NO. 104 December 1983 FC Bureau of Economic working papers are preliminary materials circulate to simulate discussion and critical comment A data cotine in them are in the public domain. This include information obtaine by the Commision which has bome part of public reord. The analy and conclusons s forth are those of the authors and do not neesarily refet the view of othe mebes of the Bureu of Economics, other Commission staf, or the Commission itsef. Upon reuet, single copie of the paper will be provide. Reference in publications to FC Bureu of Economics working papers by FC eonomists (othe than acknowlegement by a writer that lie lia acces to such unpublishe materiax) should be cleare with the author to protet the tentative character of thee papers. BUAU OF ECONOMCS FDERA TRADE COMSSION WASHGTON, DC 20580
Transcript of Tobin's Ratio And Industrial Organization: Further Results

EG amp EA
WORKING
PAPERS
TOBINS RATIO AND INDUSTRIAL
ORGANIZATION FURTHER RESULTS
Carl R Schwinn
WORKING PAPER NO 104
December 1983
FfC Bureau of Economics working papers are preliminary materials circulated to stimulate discussion and critical comment AU data contained in them are in the public domain This includes information obtained by the Commission which has become part of public record The analyses and conclusions set forth are those of the authors and do not necessarily reflect the views of other members of the Bureau of Economics other Commission staff or the Commission itself Upon request single copies of the paper will be provided References in publications to FTC Bureau of Economics working papers by FTC economists (other than acknowledgement by a writer that lie lias access to such unpublished materia ) should be cleared with the author to protect the tentative character of these papers
BUREAU OF ECONOMICS FEDERAL TRADE COMMISSION
WASHINGTON DC 20580
Tobins g Ratio and Industrial
Organization Further Results
THIRD DRAFT
Carl R Schwinn
Bates College
I would like to thank John Hilke and David Ravens craft for helpful comments on an earlier draft The-views ex pres sed here are those of the author and not neces s arily those of the staff of the Federal Trade Commis s ion or any of its members
I Introduction
II Analysis
A recent article by Lindenberg and Ross (1981) analyzed the use of
Tobins q as a measure of the upper bound of monopoly rents earned by
firmsl Tobins q is defined to be the ratio of a firms market value
to the replacement cost of the firms assets Lindenberg and Ross CLR)
provide statistical evidence that suggests the value of Tobins q is
positively and significantly related to the firms monopoly power as
measured by an estimate of the Lerner index In contrast Tobins q
was positively but insignificantl y related to a weighted average of
the 4-firm concentration ratios for the industries in which the firm
competes They stress however that middottheir bullresults are subject to the
usual caveats concerning data availability and quality and
improvements in these are s would greatly aid future research nz
The evidence reported here suggests that the 4-firm concentration
ratio when measured more accurately gains in statistical
significance More importantly measures of intangible capit l and
market share are significant determinants of Tobin bull s q butmiddot a measure
of risk is not significantly related to q
LR were constrained in their analysis by the inadequacies of the
available data In particular the method used by LR to assign an
average industry concentration ratio to each firm is likely to result
in significant measurement error In their words
page 1
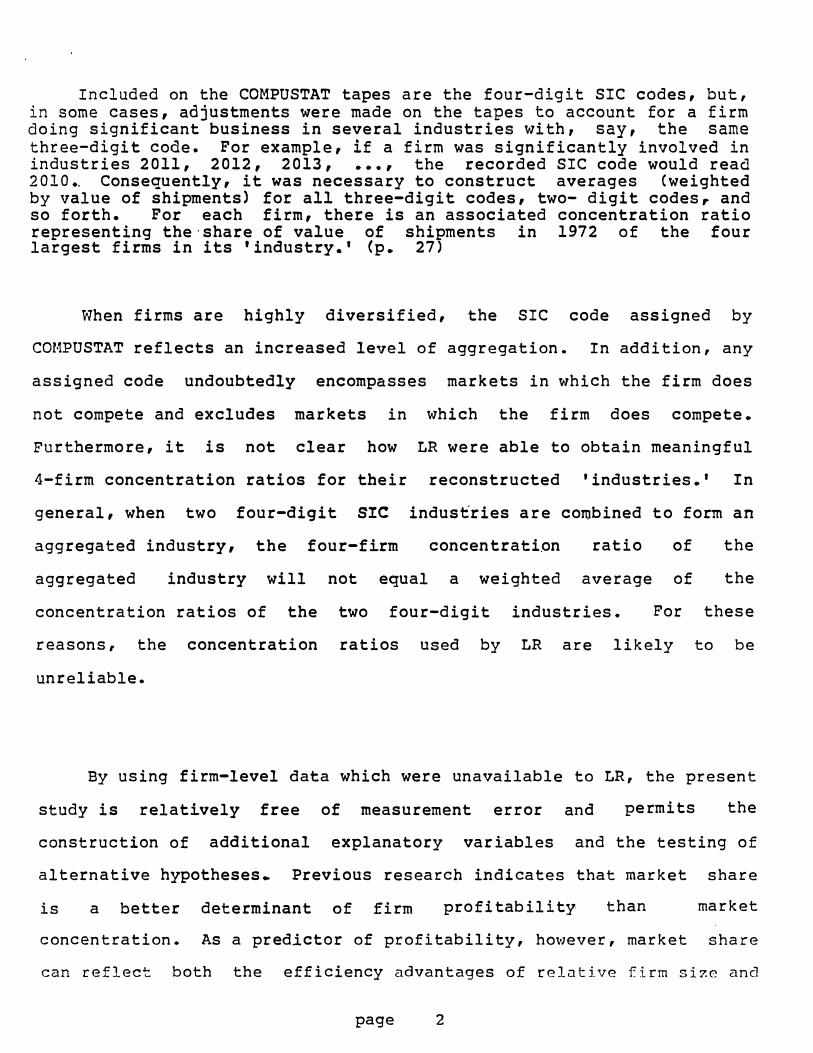
Included on the COMPUSTAT tapes are the four-digit SIC codes but in s ome cases ad justments were made on the tapes to account for a firm doing significant business in several industries with say the same thr ee-digit code For example if a firm was significantly involved in industries 2011 2012 2013 bull bull bull the recorded SIC code would read 2010 Consequently it was necessary to construct averages ltweighted by value of shipments) for all three-digit codes two- digit codesr and so forth For each firm there is an associated concentration ratio representing themiddotshare of value of shipments in 1972 of the four largest firms in its industry Cp 27)
When firms are highly diversified the SIC code assigned by
COHPUSTAT reflects an increased level of aggreg ation In addition any
assigned code undoubtedly encompasses markets in which the firm does
not compete and excludes markets in which the firm does compete
Furthermore it is not clear how LR were able to obtain meaningful
4-firm concentration ratios for their reconstructed industries In
general when two four-digit SIC industries are combined to form an
aggregated industry the four-firm concen tration ratio of the
aggregated industry will not equal a weighted average of the
concentration ratios of the two four-digit industries For these
reasons the concentration ratios used by LR are likely to be
unreliable
By using firm-level data which were unavailable to LR the present
study is relatively free of measurement error and permits the
construction of additional explanatory variables and the testing of
alternative hypotheses Previous research indicates that market share
is a better determinant of firm prof i tability than market
concentration As a predictor of profitability however market share
can reflect both the efficiency advantages of relative firm size and
page 2
industry
firm-specific
the price-increasing ability of larger firms Monte Carlo estimates by
Ravenscraft (1981) suggest that when explaining firm profitability in
the presence of scale economies both concentration and market share
variables are required to capture the price-increasing effects
of concentration and the cost-reducing benefits of relative firm size
respectively While Ravenscraft modeled only the cost-reducing effects
of market share a positive relationship between profit and market
share could be viewed as a result of a price-increasing
effect rather than a cost-reducing effect of market sharel The market
share variable does not by itself dist nguish between these two
interpretations but rather captures a firm-specific advantage
associated with market share
If a positive profit-market share relationship is the result of a
firm-specific price-increasing effect it is still uncertain whether
the higher firm prices reflect some monop6ly power associated with
market share or some product quality and differentiation advantage
which is correlated with market share In that we include variables
measuring advertising and research and development intensity the
market share variable may be more indicative of a firm-specific price
effect resulting from monopoly power or a relative cost advantage
enjoyed by firms with larger middotmarket share
Since increased middotprofi ability will be reflected in an increased
value of q as higher profits are capitalized into greater market
value it should be possible to use concentration and market share
variables to distinguish betwee n collusion and firm-specific effects of
market share when expl aining Tobins q Accordingly a weighted
page 3
average of the firms market shares will be added to a measure of
market concentration to capture any firm specific effects
A variable not considered by LR is a measure of risk It is
expected that for any given level of profitability investors will
value the earningsstream less highly as the level of r sk increases
Hence a measure of risk will be added to the regression with the
expectation that it will be negatively correlated with Tobins q
LR note that their estimates of q did not account for stocks of
intangible capital which result from ex penditures on advertising and
research and development This means that replacement costs may be
biased downward and the value of q may be biased upward There is
some question however concerning the extent to which the effects of
advertising are long-lived ereby creating intangible capital
Clarke (1976) presents evidence which suggests that the effects of most
advertising are exhausted within a year To the extent that Clarke is
c rrect the significance of an advertising variable would not be due
to a correlation between
Accordingly measures
will be added
intangible capital
differentiation and
the presence of advertising and an upwardly
biased measure of q of advertisingand research
and development activity to the equation in part to
adjust for elements of to control for diff erences
in product quality and to reflect enhanced control
over price
I t should be noted that the estimate of Lerner s index used by LR
[ (sales-operating expenses) salesl may be viewed more properly as an
estimate of the gross sales margin than of the price-cost margin As
page 4
III pata and Variable pescriptions
middot a s a middot
- J
such the Lerner index measures actual performance regardless of
whether such performance is a consequence of market power or greater
efficiencies Accordingly Lerners index should be expected to
outperform measures of market structure and firm market share
Most of the data used in the present research are drawn from the
1972 Corporate Patterns Report (CPR) of the Federal Trade Commission
the 1973 Survey of Manufacturers the concentration ratios published in
the 1972 Census of Manufacturers as adjusted by Weiss and Pascoe
(1982) the COMPOSTAT data base and the CRSP data base The 1972 CPR
sample consists of 1239 of the largest manufacturing firms Because
some of the 246 firms in middotthe LR sample were non-manufacturing firms
only 200 firmsmiddot could be matched with the CPR sample
In the CPR sample the value of shipments for each firm is
provideuro0 according to 5-digit product classes Following Weiss and
Pascoe the 5-digit product classes were either retained as meaningful
economic markets or aggregated to the 4-digit industry level In some
cases two or more 4-digit industries were combined to reflect the
inter-industry competition According to these market definitions the
adjusted CPR data were used to compute the proportion (a ) of firm is
total value of shipments Csi) in market -j That is
Smiddot = 2 Smiddotmiddot = sc middot = 1 where s middot is the value of amp J bull J J jt J shipments of firm i in market j and n is number of markets servedthe
by firm i
By using the total value of shipments CSgt of all firms in market
page 5
HERF--
j as provided in the 1973 Survey of Manufacturers2 it is possible to
compute each firms market share m = SmiddotmiddotIS- A weighted average of a 1
fir m s market shares can be calculated as ftj a mCj = MKTSHRi bull J
By using the valuesmiddot of for each firm it is possible toa
calculate weighted averages of various market-wide statistics In
addition to adjusting the 1972 concentration ratios to reflect more
meaningful product mar et definitions Weiss middotand Pascoe adjmiddotusted the
4-firm concentration ratios to reflect imports ex ports and regional
markets created by transportation costs By using their adjusted
4-firm concentration ratio cr4wgt a weighted average can
for each firm c
a r-
(cr4wgt = CR4Wl
A Herfindahl measure of market concentration Cherfj gt was
calculated f or each market using the CPR data
m bull = herfjz J where qj is the number of CPR firms in market j Since the CPR sample
be -calculat ed
does not contain all firms the value of herf is biased downward The
weighted average of the Herfindahl indexes for the markets in which a
firm participates is Z a- herpound = )bull -J
Two variables have been computed to measure the importance of
bull
in the firmsadvertising and research and development market Csgt Th e
value of the firms adver tising variable CAD) was computed as a
weighted average of IRS industry advertising-sales ratios where the
page 6
Science Indicators
weights were the fraction
patent variable (RD)
of a firms sales in each industry The
was compu ted in the same way using data from
(NSF)]_ Both these variables should be viewed as
prox ies the accuracy of which depends on the stability of the industry
averages over time and tbe uniformity of
within
advertising and research and
development activ ity across firms each industry
A measure of rfsk BETA72- is calculated according to the capital
asset pricing model using monthly security returns over the period of
1968-1972 The data are drawn from the CRSP data file It was also
possible to obtain an average risk measure ABETAl over the 1960-1977
period (For regressions using the BETA72 ABETA AD and RD variables
insuff icient data required that the sample be reduced to
observationsgt And finally following LR the Lerner index of monopoly
power LER72 i is approximated by the ratio of (sales-operating
expenses)sales for 1972
The ex planatory variables described above were used to explain
Tobins q as of 1972 TOBIN72 Although the CPR data armiddote for 197
the fact that market structure var iables change slowly over time
suggests that the average of the q ratio over the period of 1960-77
TOBINQA may also exhibit a systematic relation with the explanatory
variables When explaining TOBINQA i the average of Lerners index
from 1960 to 1977 AVELER4 was used in place of LER72 L
155
page 7
IV The Empirical Results
The weighted average of the adjusted 4-firm conce ntration ratios
CR4W appears to be significant determinant of the average value of q
ove r the 1960-77 period TOBINOA See Table 1 However the improved
measurement of concentration does not produce statistically signipoundicant
re sults in ex plaining TOBIN72 the value of q in a single year The
est imated value of the Berfindah1 measure of concentration although
biased does provide a notable statistical improvement over the 4-firm
measure of concentration Further improvements are obtained by market
share and the estimated Lerner index
The Herfindahl measure of concentration is comb ined with market
share to distinguish between the collusion and market share effects
Equ ations 5 and 10 in Table 1 fail to reveal any ev idence of collusion
The sign ficance of the market share variable could be due to relative
efficiency or firm-specific attributes associated with market share
which permit firms to increase profits
page 8
TABLE 1
Dependent Varia ble TOBINQA
Reg Estimated Variable Coefficient t-ratio R-squared
1 INTERCEPT a 82 3 a6 CR4W 1S7 289 a4
2 INTERCEPT l la 8 77 HERF 4 79 4 62 la
3 INTERCEPT 114 1lal MKTSHR 4 22 S69 14
4 INTERCEPT 013 a 77 AVELER 9 62 9 42 31
5 INTERCEPT 113 9 12 MKTSHR 392 3bull 17 HERF aSl a a3 14
Dependent Variable TOBIN72
6 INTERCEPT 1 13 3 1S CR4W a 92 1 29 al
7 INTERCEPT 1 2 7 747 HERF 3 a2 21S a2
8 INTERCEPT 12 S 8 77 1KTSHR 3 13 3a9 as
9 INTERCEPT a 37 1 8S LER72 829 6 49 18
la INTERCEPT 1 29 766 MKTSHR 3 78 223 HERF 1 1a a 48 as
2 aa observations
One factor w hich may be related and which may giyeto market share
differentiationf_irms greater control over price is and product quality
arising from advertising and research arid development The inclusion
of advertising and research and development variables should not only
page 9
TABLE 2
he lp compensate for the measurement problems noted by LR in their
est imates of q but help determine whether MKTSHRs significance
reflects a potential correlation between market share and prod uct
cha racteristics
Dependent
INTERCEPT AVELER MKTSHR ABET A R-Sq Cbs
007 842 254 36 200 ( 0 28) (812) (376)
-001 670 1 bull68 017middot 017 45 155 (-005) (7 29) (2 77) (563) (141)
005 665 167 0 7 o18 -o 01 45 155 (025) (717) (2 74) 547) (145) (-050)
Dependent Variable TOBIN72
INTERCEPT LER72 MKTSHR RD BETA72 R-Sq Cbs
029 771 163 19 200 (140) (5 85) (168)
013 590 072 021 021 28 155 (062) (500) (081) (485) (094)
061 510 071 020 020 -043 29 155 (068) (401) (081) (435) (114) C-161)
t-values in 0
Variable TOBINQA
AD RD
page 10
V Conclusion
Because the Ler ner index cap tures actual per forman ce and
mar ket share re flect s only the potential for superior per forman ce
MKTSER should be insignificant when included along with the Lerner
index CAVELER or LER72) It is clear from Table 2 however that
MKTSHR is significant in explaining TOBINQA although it does lose
significance in the TOBIN72 equation MKTSHR retains its significance
in the TOBINQA equation when AD and RD are added suggesting the MKTSHR
is not reflecting product characteristics The measure of risk has the
anticipated sign but is insignificant
The empirical results-reported here reflect more accurate measures
of market structure than available to LR the use o market share and
risk variables and adjustments to account for intangible c ap ital and
p roduct characteristics The evidence indicates that while the
estimates of Lerners index remain the strongest determinant of Tobins
q market share continues to play a significant role in explaining the
average value of q even after the advertising resear ch and
develop ment and risk have been made Whether market share reflects
relative efficiencyr firm-specifid market power or only reflects
misspecification and remaining measurement error remains to be
determined
page 11
Footnotes
ll The paper by Lindenberg and Ross is the most rigorous analysis of Tobins q in the context of industrial organization resear ch
21 Lindenberg and Ross C981) p 30
11 Ravenscraft (1981) p 7
if Lindenberg and Ross (1981) p 17
The FTC CPR does not include 64 firms which reported value of s hipments by S-digit product classes but had a total value of s hipments below SO million Those 64 firms are included in the data base used in this study
51
The 1973 Survey of Manufactureres contains corrections to the total value of shipments published in the 1972 Census of Manufacturers
11 The variables for advertising and research and development were supplied by Dennis c Mueller
i The values of q for 1972 were kindly supplied by Stephen Ross The average values of q over the 1960-77 period were published in Lindenberg and Ross (1981)
i The LR results which are comparable to equation iS are q = 1 46 + 27 CCR4) with a t-ratio for concentration (CR4) of 0 63 and anR-squared of 0 01
page 12
Bibliography
page 13
Clarke Darral Econometric Measurement of the Duration of Advertising Effect on Sales (1976) Journal of Marketing Research
Lindenberg E B and Ross Stephen A Tobins q Ratio and Industrial Organization (1981) Journal of Business (January) 1-32
Ravenscraft David Collusion vs Superiority A Monte Carlo Analysis Manuscript Federal Trade Commission 1981
Weiss Leonard and Pascoe George Adjusted Concentration Ratios in Manufacturing--1972 Federal Trade Commission Working Paper (1982)

Tobins g Ratio and Industrial
Organization Further Results
THIRD DRAFT
Carl R Schwinn
Bates College
I would like to thank John Hilke and David Ravens craft for helpful comments on an earlier draft The-views ex pres sed here are those of the author and not neces s arily those of the staff of the Federal Trade Commis s ion or any of its members
I Introduction
II Analysis
A recent article by Lindenberg and Ross (1981) analyzed the use of
Tobins q as a measure of the upper bound of monopoly rents earned by
firmsl Tobins q is defined to be the ratio of a firms market value
to the replacement cost of the firms assets Lindenberg and Ross CLR)
provide statistical evidence that suggests the value of Tobins q is
positively and significantly related to the firms monopoly power as
measured by an estimate of the Lerner index In contrast Tobins q
was positively but insignificantl y related to a weighted average of
the 4-firm concentration ratios for the industries in which the firm
competes They stress however that middottheir bullresults are subject to the
usual caveats concerning data availability and quality and
improvements in these are s would greatly aid future research nz
The evidence reported here suggests that the 4-firm concentration
ratio when measured more accurately gains in statistical
significance More importantly measures of intangible capit l and
market share are significant determinants of Tobin bull s q butmiddot a measure
of risk is not significantly related to q
LR were constrained in their analysis by the inadequacies of the
available data In particular the method used by LR to assign an
average industry concentration ratio to each firm is likely to result
in significant measurement error In their words
page 1
Included on the COMPUSTAT tapes are the four-digit SIC codes but in s ome cases ad justments were made on the tapes to account for a firm doing significant business in several industries with say the same thr ee-digit code For example if a firm was significantly involved in industries 2011 2012 2013 bull bull bull the recorded SIC code would read 2010 Consequently it was necessary to construct averages ltweighted by value of shipments) for all three-digit codes two- digit codesr and so forth For each firm there is an associated concentration ratio representing themiddotshare of value of shipments in 1972 of the four largest firms in its industry Cp 27)
When firms are highly diversified the SIC code assigned by
COHPUSTAT reflects an increased level of aggreg ation In addition any
assigned code undoubtedly encompasses markets in which the firm does
not compete and excludes markets in which the firm does compete
Furthermore it is not clear how LR were able to obtain meaningful
4-firm concentration ratios for their reconstructed industries In
general when two four-digit SIC industries are combined to form an
aggregated industry the four-firm concen tration ratio of the
aggregated industry will not equal a weighted average of the
concentration ratios of the two four-digit industries For these
reasons the concentration ratios used by LR are likely to be
unreliable
By using firm-level data which were unavailable to LR the present
study is relatively free of measurement error and permits the
construction of additional explanatory variables and the testing of
alternative hypotheses Previous research indicates that market share
is a better determinant of firm prof i tability than market
concentration As a predictor of profitability however market share
can reflect both the efficiency advantages of relative firm size and
page 2
industry
firm-specific
the price-increasing ability of larger firms Monte Carlo estimates by
Ravenscraft (1981) suggest that when explaining firm profitability in
the presence of scale economies both concentration and market share
variables are required to capture the price-increasing effects
of concentration and the cost-reducing benefits of relative firm size
respectively While Ravenscraft modeled only the cost-reducing effects
of market share a positive relationship between profit and market
share could be viewed as a result of a price-increasing
effect rather than a cost-reducing effect of market sharel The market
share variable does not by itself dist nguish between these two
interpretations but rather captures a firm-specific advantage
associated with market share
If a positive profit-market share relationship is the result of a
firm-specific price-increasing effect it is still uncertain whether
the higher firm prices reflect some monop6ly power associated with
market share or some product quality and differentiation advantage
which is correlated with market share In that we include variables
measuring advertising and research and development intensity the
market share variable may be more indicative of a firm-specific price
effect resulting from monopoly power or a relative cost advantage
enjoyed by firms with larger middotmarket share
Since increased middotprofi ability will be reflected in an increased
value of q as higher profits are capitalized into greater market
value it should be possible to use concentration and market share
variables to distinguish betwee n collusion and firm-specific effects of
market share when expl aining Tobins q Accordingly a weighted
page 3
average of the firms market shares will be added to a measure of
market concentration to capture any firm specific effects
A variable not considered by LR is a measure of risk It is
expected that for any given level of profitability investors will
value the earningsstream less highly as the level of r sk increases
Hence a measure of risk will be added to the regression with the
expectation that it will be negatively correlated with Tobins q
LR note that their estimates of q did not account for stocks of
intangible capital which result from ex penditures on advertising and
research and development This means that replacement costs may be
biased downward and the value of q may be biased upward There is
some question however concerning the extent to which the effects of
advertising are long-lived ereby creating intangible capital
Clarke (1976) presents evidence which suggests that the effects of most
advertising are exhausted within a year To the extent that Clarke is
c rrect the significance of an advertising variable would not be due
to a correlation between
Accordingly measures
will be added
intangible capital
differentiation and
the presence of advertising and an upwardly
biased measure of q of advertisingand research
and development activity to the equation in part to
adjust for elements of to control for diff erences
in product quality and to reflect enhanced control
over price
I t should be noted that the estimate of Lerner s index used by LR
[ (sales-operating expenses) salesl may be viewed more properly as an
estimate of the gross sales margin than of the price-cost margin As
page 4
III pata and Variable pescriptions
middot a s a middot
- J
such the Lerner index measures actual performance regardless of
whether such performance is a consequence of market power or greater
efficiencies Accordingly Lerners index should be expected to
outperform measures of market structure and firm market share
Most of the data used in the present research are drawn from the
1972 Corporate Patterns Report (CPR) of the Federal Trade Commission
the 1973 Survey of Manufacturers the concentration ratios published in
the 1972 Census of Manufacturers as adjusted by Weiss and Pascoe
(1982) the COMPOSTAT data base and the CRSP data base The 1972 CPR
sample consists of 1239 of the largest manufacturing firms Because
some of the 246 firms in middotthe LR sample were non-manufacturing firms
only 200 firmsmiddot could be matched with the CPR sample
In the CPR sample the value of shipments for each firm is
provideuro0 according to 5-digit product classes Following Weiss and
Pascoe the 5-digit product classes were either retained as meaningful
economic markets or aggregated to the 4-digit industry level In some
cases two or more 4-digit industries were combined to reflect the
inter-industry competition According to these market definitions the
adjusted CPR data were used to compute the proportion (a ) of firm is
total value of shipments Csi) in market -j That is
Smiddot = 2 Smiddotmiddot = sc middot = 1 where s middot is the value of amp J bull J J jt J shipments of firm i in market j and n is number of markets servedthe
by firm i
By using the total value of shipments CSgt of all firms in market
page 5
HERF--
j as provided in the 1973 Survey of Manufacturers2 it is possible to
compute each firms market share m = SmiddotmiddotIS- A weighted average of a 1
fir m s market shares can be calculated as ftj a mCj = MKTSHRi bull J
By using the valuesmiddot of for each firm it is possible toa
calculate weighted averages of various market-wide statistics In
addition to adjusting the 1972 concentration ratios to reflect more
meaningful product mar et definitions Weiss middotand Pascoe adjmiddotusted the
4-firm concentration ratios to reflect imports ex ports and regional
markets created by transportation costs By using their adjusted
4-firm concentration ratio cr4wgt a weighted average can
for each firm c
a r-
(cr4wgt = CR4Wl
A Herfindahl measure of market concentration Cherfj gt was
calculated f or each market using the CPR data
m bull = herfjz J where qj is the number of CPR firms in market j Since the CPR sample
be -calculat ed
does not contain all firms the value of herf is biased downward The
weighted average of the Herfindahl indexes for the markets in which a
firm participates is Z a- herpound = )bull -J
Two variables have been computed to measure the importance of
bull
in the firmsadvertising and research and development market Csgt Th e
value of the firms adver tising variable CAD) was computed as a
weighted average of IRS industry advertising-sales ratios where the
page 6
Science Indicators
weights were the fraction
patent variable (RD)
of a firms sales in each industry The
was compu ted in the same way using data from
(NSF)]_ Both these variables should be viewed as
prox ies the accuracy of which depends on the stability of the industry
averages over time and tbe uniformity of
within
advertising and research and
development activ ity across firms each industry
A measure of rfsk BETA72- is calculated according to the capital
asset pricing model using monthly security returns over the period of
1968-1972 The data are drawn from the CRSP data file It was also
possible to obtain an average risk measure ABETAl over the 1960-1977
period (For regressions using the BETA72 ABETA AD and RD variables
insuff icient data required that the sample be reduced to
observationsgt And finally following LR the Lerner index of monopoly
power LER72 i is approximated by the ratio of (sales-operating
expenses)sales for 1972
The ex planatory variables described above were used to explain
Tobins q as of 1972 TOBIN72 Although the CPR data armiddote for 197
the fact that market structure var iables change slowly over time
suggests that the average of the q ratio over the period of 1960-77
TOBINQA may also exhibit a systematic relation with the explanatory
variables When explaining TOBINQA i the average of Lerners index
from 1960 to 1977 AVELER4 was used in place of LER72 L
155
page 7
IV The Empirical Results
The weighted average of the adjusted 4-firm conce ntration ratios
CR4W appears to be significant determinant of the average value of q
ove r the 1960-77 period TOBINOA See Table 1 However the improved
measurement of concentration does not produce statistically signipoundicant
re sults in ex plaining TOBIN72 the value of q in a single year The
est imated value of the Berfindah1 measure of concentration although
biased does provide a notable statistical improvement over the 4-firm
measure of concentration Further improvements are obtained by market
share and the estimated Lerner index
The Herfindahl measure of concentration is comb ined with market
share to distinguish between the collusion and market share effects
Equ ations 5 and 10 in Table 1 fail to reveal any ev idence of collusion
The sign ficance of the market share variable could be due to relative
efficiency or firm-specific attributes associated with market share
which permit firms to increase profits
page 8
TABLE 1
Dependent Varia ble TOBINQA
Reg Estimated Variable Coefficient t-ratio R-squared
1 INTERCEPT a 82 3 a6 CR4W 1S7 289 a4
2 INTERCEPT l la 8 77 HERF 4 79 4 62 la
3 INTERCEPT 114 1lal MKTSHR 4 22 S69 14
4 INTERCEPT 013 a 77 AVELER 9 62 9 42 31
5 INTERCEPT 113 9 12 MKTSHR 392 3bull 17 HERF aSl a a3 14
Dependent Variable TOBIN72
6 INTERCEPT 1 13 3 1S CR4W a 92 1 29 al
7 INTERCEPT 1 2 7 747 HERF 3 a2 21S a2
8 INTERCEPT 12 S 8 77 1KTSHR 3 13 3a9 as
9 INTERCEPT a 37 1 8S LER72 829 6 49 18
la INTERCEPT 1 29 766 MKTSHR 3 78 223 HERF 1 1a a 48 as
2 aa observations
One factor w hich may be related and which may giyeto market share
differentiationf_irms greater control over price is and product quality
arising from advertising and research arid development The inclusion
of advertising and research and development variables should not only
page 9
TABLE 2
he lp compensate for the measurement problems noted by LR in their
est imates of q but help determine whether MKTSHRs significance
reflects a potential correlation between market share and prod uct
cha racteristics
Dependent
INTERCEPT AVELER MKTSHR ABET A R-Sq Cbs
007 842 254 36 200 ( 0 28) (812) (376)
-001 670 1 bull68 017middot 017 45 155 (-005) (7 29) (2 77) (563) (141)
005 665 167 0 7 o18 -o 01 45 155 (025) (717) (2 74) 547) (145) (-050)
Dependent Variable TOBIN72
INTERCEPT LER72 MKTSHR RD BETA72 R-Sq Cbs
029 771 163 19 200 (140) (5 85) (168)
013 590 072 021 021 28 155 (062) (500) (081) (485) (094)
061 510 071 020 020 -043 29 155 (068) (401) (081) (435) (114) C-161)
t-values in 0
Variable TOBINQA
AD RD
page 10
V Conclusion
Because the Ler ner index cap tures actual per forman ce and
mar ket share re flect s only the potential for superior per forman ce
MKTSER should be insignificant when included along with the Lerner
index CAVELER or LER72) It is clear from Table 2 however that
MKTSHR is significant in explaining TOBINQA although it does lose
significance in the TOBIN72 equation MKTSHR retains its significance
in the TOBINQA equation when AD and RD are added suggesting the MKTSHR
is not reflecting product characteristics The measure of risk has the
anticipated sign but is insignificant
The empirical results-reported here reflect more accurate measures
of market structure than available to LR the use o market share and
risk variables and adjustments to account for intangible c ap ital and
p roduct characteristics The evidence indicates that while the
estimates of Lerners index remain the strongest determinant of Tobins
q market share continues to play a significant role in explaining the
average value of q even after the advertising resear ch and
develop ment and risk have been made Whether market share reflects
relative efficiencyr firm-specifid market power or only reflects
misspecification and remaining measurement error remains to be
determined
page 11
Footnotes
ll The paper by Lindenberg and Ross is the most rigorous analysis of Tobins q in the context of industrial organization resear ch
21 Lindenberg and Ross C981) p 30
11 Ravenscraft (1981) p 7
if Lindenberg and Ross (1981) p 17
The FTC CPR does not include 64 firms which reported value of s hipments by S-digit product classes but had a total value of s hipments below SO million Those 64 firms are included in the data base used in this study
51
The 1973 Survey of Manufactureres contains corrections to the total value of shipments published in the 1972 Census of Manufacturers
11 The variables for advertising and research and development were supplied by Dennis c Mueller
i The values of q for 1972 were kindly supplied by Stephen Ross The average values of q over the 1960-77 period were published in Lindenberg and Ross (1981)
i The LR results which are comparable to equation iS are q = 1 46 + 27 CCR4) with a t-ratio for concentration (CR4) of 0 63 and anR-squared of 0 01
page 12
Bibliography
page 13
Clarke Darral Econometric Measurement of the Duration of Advertising Effect on Sales (1976) Journal of Marketing Research
Lindenberg E B and Ross Stephen A Tobins q Ratio and Industrial Organization (1981) Journal of Business (January) 1-32
Ravenscraft David Collusion vs Superiority A Monte Carlo Analysis Manuscript Federal Trade Commission 1981
Weiss Leonard and Pascoe George Adjusted Concentration Ratios in Manufacturing--1972 Federal Trade Commission Working Paper (1982)
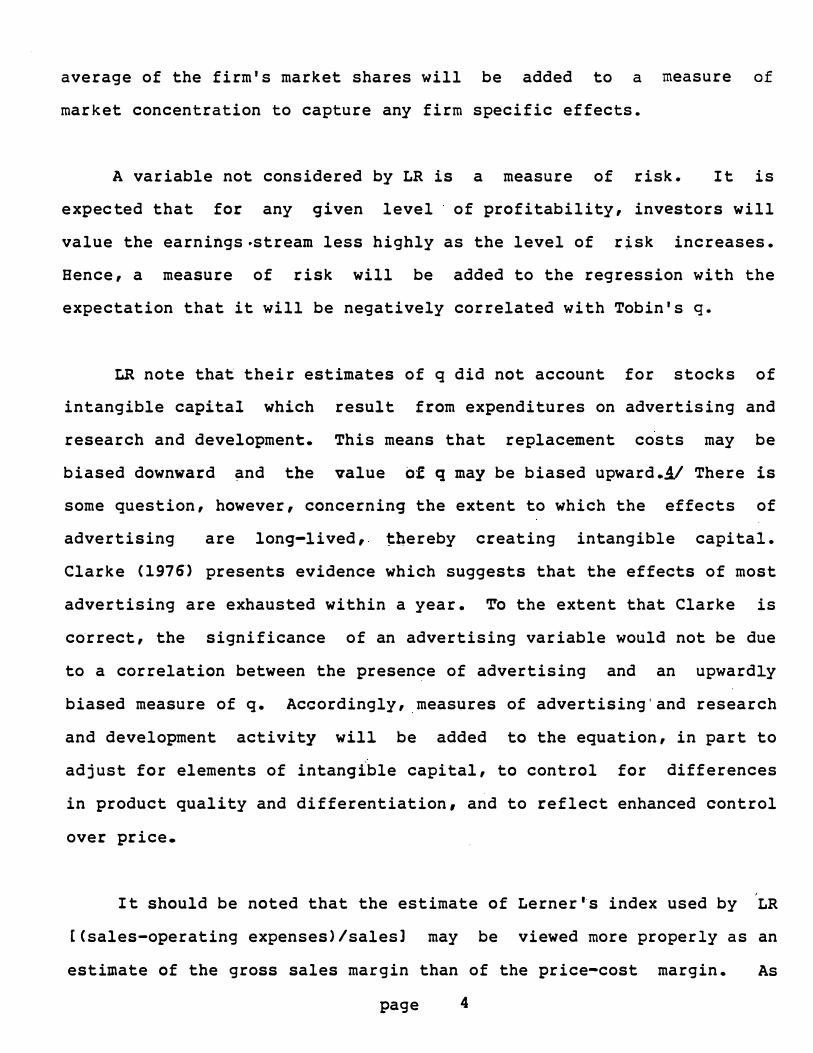
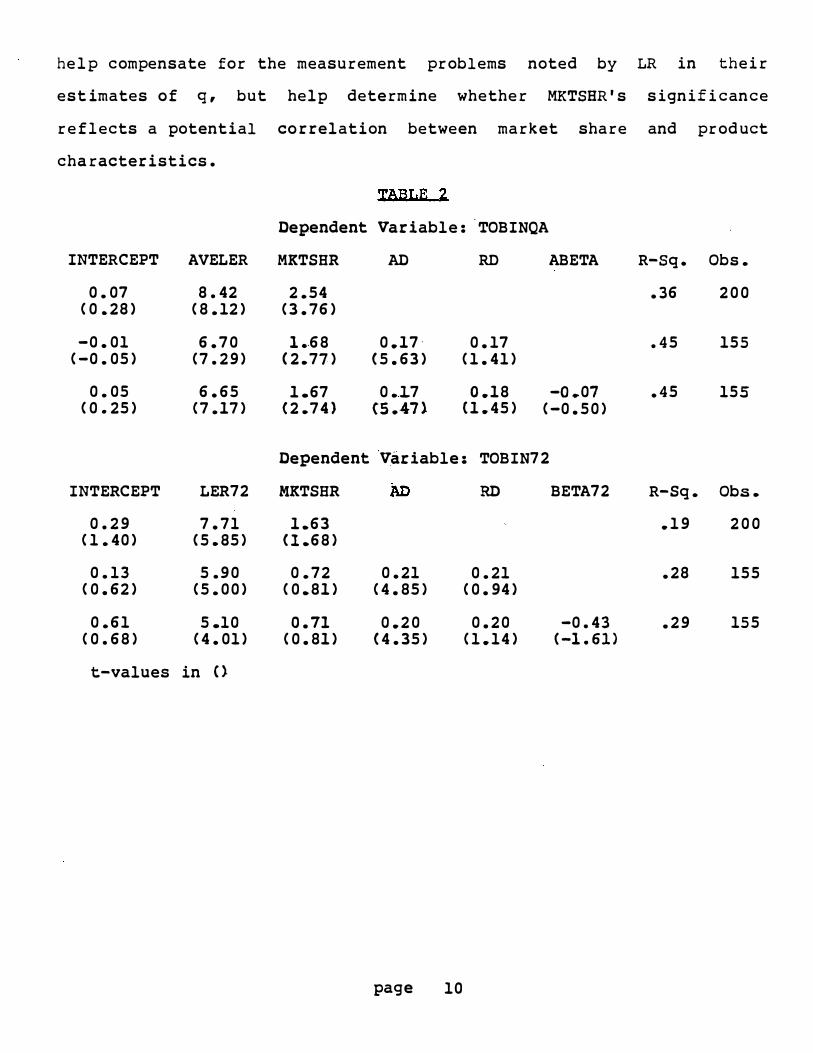
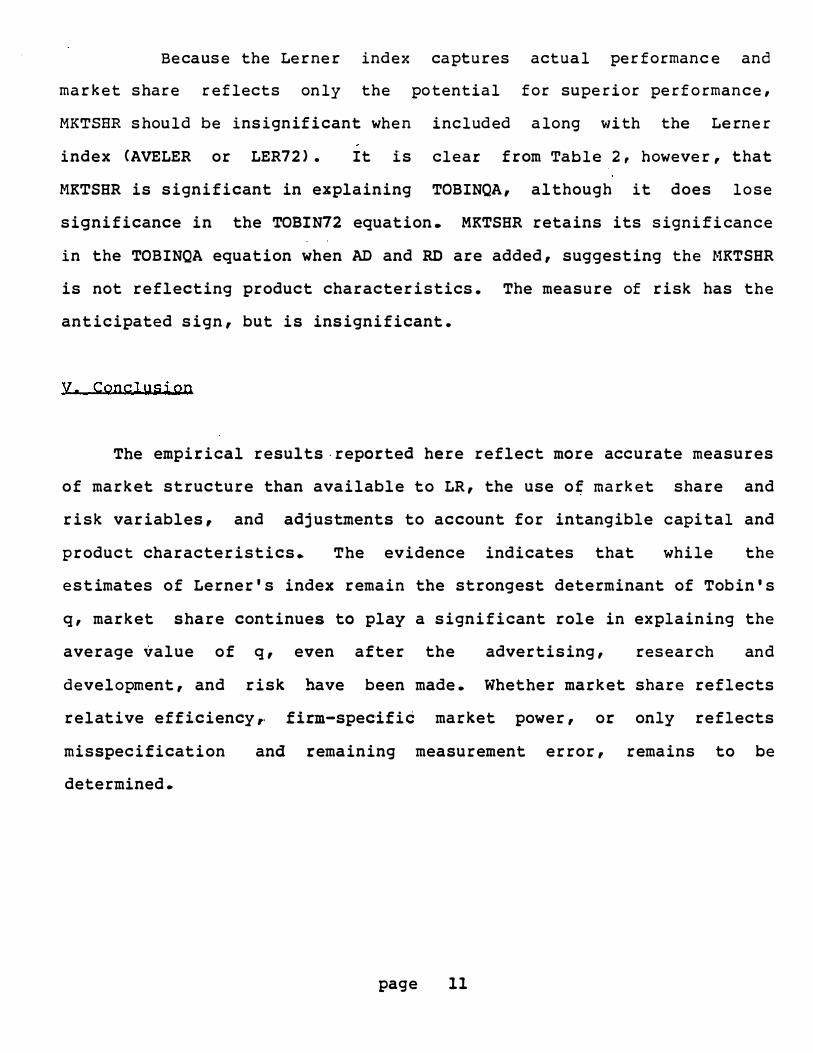