A Post-Keynesian Theory for Tobin’s q in a Stock-Flow Consistent Framework

Munich Personal RePEc Archive
Tobin’s Q and its Determinants: A study
on Huawei Technologies Co., Ltd
Yik Fen, Yvonne P’ng
Universiti Utara Malaysia
14 May 2019
Online at https://mpra.ub.uni-muenchen.de/93894/
MPRA Paper No. 93894, posted 15 May 2019 13:40 UTC
Tobin’s Q and its Determinants: A study on Huawei Technologies Co., Ltd.
Yvonne P`ng Yik Fen
Univesiti Utara Malaysia
Abstract
Tobin’s Q can be affected by both the internal and external factors. Tobin’s Q is a
company’s performances indicator, so it is important for an organization to manage its
effectively. This study aims to investigate the impact of Tobin’s Q in relation with firm-
specific factors and macroeconomics factors towards the performance of the selected
company which is Huawei Technologies Co., Ltd. Multiple regression analysis of financial
ratios of the company is conducted for the year from 2011 to 2015. The findings and
analysis indicate that firm-specific factor (Return on equity, ROE) have a greater influence
on Tobin’s Q of the company as compared to macroeconomic factors. This study is also
suggested that the company should improve the ROE, the company is advised to increase
its debt with a suitable amount. By having the cash flows in, the company can purchase
new assets to generate profit. Even through the macroeconomics factors have a little impact
in Tobin’s Q, the company still requires in sustaining its growth along the economy
conditions by somehow.
Keywords: Tobin’s Q, Firm-Specific Factors, Macroeconomics Factors, Return on Equity.
1
1.0 Introduction
1.1 Introduction
Chapter 1 consists of an overview of Huawei Technologies Co., Ltd. This
chapter details in discussing the research objectives and research questions.
1.2 Overview of Huawei Technologies Co., Ltd.
Huawei Technologies Co., Ltd is a telecommunications and electronics
company based in Shenzhen in the south of China. It is also the world’s largest telecoms
equipment firm and overtakes Apple to become the world’s No.2 smartphone seller
behind Samsung (Kate Lyons, 2018). Huawei is a leading global provider of
information and communications technology (ICT) infrastructure and smart devices.
With integrated solutions across four key domains which are telecom networks,
information technology, smart devices, and cloud services. This company brings digital
for a fully connected and intelligent world to every person, home and organization
(“Corporate Introduction”, 2018).
Huawei have sustained long-term growth through continuous improvement on
their corporate governance structure, organizations, processes, and appraisal systems.
The Shareholders’ Meeting is the company’s authoritative body. Shareholders making
decisions on major issues such as the company's capital increase, profit distribution,
and selection of the members of the Board of Directors (BOD) or Supervisory Board
(“Corporate Governance”, 2018).
The board structure of Huawei is Two-Tier (Dual) board which is having the
BOD (Management Board) and Supervisory Board. BOD is the highest body
responsible for corporate strategy, operations management, and customer satisfaction.
The BOD and its Executive Committee will be led by rotating chairmen. During their
terms, the rotating chairmen will serve as the foremost leader of the company. The key
responsibilities of the Supervisory Board include overseeing the responsibility
fulfillment of BOD members and senior management, monitoring the company’s
operational and financial status and supervising internal control and legal compliance
(“Corporate Governance”, 2018).

2
Furthermore, Huawei has four existing committees which are Human
Resources Committee, Strategy and Development Committee, Finance Committee and
Audit Committee. Klynveld Peat Marwick Goerdeler (KPMG) has been Huawei's
independent auditor since 2000 (“Corporate Governance”, 2018).
The Code of Conduct for Partners of Huawei ("Code of Conduct") is used to
promote and ensure the absolute integrity of Huawei’s business dealings with its
Partners. Clear compliance standards and ethical principles are established and be
obeyed by all Partners. This Code of Conduct applies to all Huawei Solution Partners
and Enterprise BG’s Partners (collectively referred to as “Partners”) and including their
employees, temporary workers, agents, subcontractors, and similar individuals or
entities. All Partners are expected to be familiar with and comply with applicable laws
and regulations and demonstrate high standards of business ethics (“Code of Conduct
for Partners”, 2019).
But unfortunately, in Reuters 2013, a Hong Kong-based firm which was
Skycom Tech Co Ltd that attempted to sell embargoed Hewlett-Packard computer
equipment to Iran’s largest mobile-phone operator has much closer ties to China’s
Huawei Technologies. This is due to Cathy Meng, Huawei’s chief financial officer and
the daughter of company founder Ren Zhengfei, served on the board of Hong Kong-
based Skycom Tech Co Ltd between February 2008 and April 2009. Despite of U.S
trade sanctions, Skycom’s office in Tehran offered to sell at least 1.3 million euros
worth of HP gear to Mobile Telecommunication Co of Iran in late 2010 (Steve
Stecklow, 2013). This issue has violated the business ethic principle because Skycom
has abided the U.S export law. The sanctions on Iran are designed to deter it from
developing nuclear weapons even through Iran has stated that its nuclear program is
aimed purely at producing domestic energy. Afterwards, Ms. Meng and a Hong Kong
accountancy and secretarial firm in Skycom did not responded to a request on comment.
Huawei was criticized for not answering about its Iranian operations and for failing to
provide evidence to support its claims that it complies with all international sanctions
or U.S. export laws by the U.S House Intelligence Committee (Steve Stecklow, 2013).
Transparency can be well practiced by disclosing the annual report publicly.

3
Besides that, the former head of the U.S. Central Intelligence Agency, Michael
Hayden is awarded of hard evidence that Huawei Technologies Co Ltd has spied for
the Chinese government by sharing intimate and extensive knowledge of the foreign
telecommunications systems with the Chinese state. In 1987, Huawei was founded by
former People’s Liberation Army officer Ren Zheng Fei, has repeatedly denied being
linked to the Chinese government or military or receiving financial support from either
(Jane Wardell, 2013). Transparency should be improved so the outsiders are able to
make a meaningful analysis of a company and its actions taken. This principle of
corporate governance is also enabling to keep the company away from
misunderstandings. Huawei Global Cyber Security Officer, John Suffolk had
commented that all Hayden’s comments are unsubstantiated and challenged him and
other critics to present proven evidence publicly. The principle of accountability has
not been practiced welly. The decision and action that John Suffolk take on behalf of a
company is in an aggressive way and not accountable to the Board. The scandal
happened should be solved through negotiations with information that showed that this
world No.2 telecom equipment maker is reliable and trustable. Sustainability is also be
violated by which the scandals happened decline the way of Huawei becomes the
world’s biggest telecoms company (Jane Wardell, 2013).
The reputation of Huawei has been ruined because it is not trustable to foreign
countries anymore especially the Britain, United State and Australia. The U.S. House
of Representatives’ Intelligence Committee urged American firms to stop doing
business with Huawei and ZTE Corp. in October 2012. The American firms were
warned that China could use equipment made by the companies to spy on certain
communications and threaten vital systems through computerized links. The Australian
government has barred Huawei from involvement in the building of its A$37.4 billion
($34.25 billion) National Broadband Network (Jane Wardell, 2013). The scandal is
even keeping on its effect until the year 2019. In 2018, the governments of the US, New
Zealand and Australia have moved to block the use of Huawei’s equipment in the
rollout of future 5G networks, citing national security. On 1 December 2018, Canada
arrested Huawei’s global chief financial officer, Meng Wanzhou on suspicion of
violating U.S sanctions against Iran. US authorities have been investigating Huawei
4
since at least 2016. Huawei is suspected for allegedly shipping US-origin products to
Iran and other countries in violation of US export and sanctions laws (Kate Lyons,
2018).
1.3 Research Objectives
This study aims to investigate the impact of Tobin’s Q in relation with determinants
towards the selected company’s performances. The objectives of the study are:
1. To investigate the impact of Tobin’s Q in relation with firm-specific factors
towards the selected company’s performances.
2. To investigate the impact of Tobin’s Q in relation with macroeconomics factors
towards the selected company’s performances.
3. To investigate the impact of Tobin’s Q in relation with firm-specific factors and
macroeconomics factors towards the selected company’s performances.
1.4 Research Questions
The research questions are:
1. Is there any impact of Tobin’s Q in relation with firm-specific factors towards
the selected company’s performances?
2. Is there any impact of Tobin’s Q in relation with macroeconomics factors towards
the selected company’s performances?
3. Is there any impact of Tobin’s Q in relation with firm-specific factors and
macroeconomics factors towards the selected company’s performances?

5
2.0 Literature Review
2.1 Introduction
This chapter is regarding the review of some previous literature which is related
to this study on corporate governance index in relation with its determinants towards
the company’s performance. Besides that, the impact of Tobin’s Q ratio and corporate
governance index towards the performance of the company has also be reviewed.
2.2 Corporate Governance and Scandals
Several key governance characteristics which including the independence of
boards and audit committees and the extent of outside auditors provide non-audit
services are essentially unrelated to the probability of a company restating earnings.
The probability of restatement is significantly lower in companies whose boards or
audit committees include an independent financial expert compared to companies
whose CEO belongs to the founding family (Agrawal, & Chadha, 2005). The scandals
are seen to be driven more by the avoidance of risks. It is not obvious whether this will
help to increase accountability (Kolk, 2007). Restating CEOs, CFOs and top
management face have a 14%, 10% and 9% greater probability of being replaced
respectively during years (-1; +1) than those at control firms, where 0 is the year of
restatement announcement. Auditor turnover is higher in restating firms. (Agrawal, &
Cooper, 2017). The transparency of the company to market forces is a common factor
determining the success of a corporate governance structure. The corporate governance
and business ethics issues exist throughout the world. For example, the Asian financial
crisis of 1997–1999, Enron, Andersen and WorldCom in the United States and Ahold
and Parmalat in Europe (Millar, Eldomiaty, Choi, & Hilton, 2005). Transparency and
accountability cannot be enforced through rules, regulations, laws, concepts, structures,
processes, best practices, and even the technology. This can only come about when
individuals of integrity are trying to ‘do the right thing,’ not just what is expedient or
even necessarily what is permissible (Borgia, 2005).

6
2.3 Corporate Governance and Bankruptcy
37.5 percent in survivor firms and 53.8 percent in bankrupt firms had practiced
the dual structure. 44.9 percent directors of survivor firms were affiliated compared to
the bankrupt firms which is 59.5 percent (Daily, & Dalton, 1994). Moulton and Thomas
(1993) estimated that fewer than 10 percent of all firms that involved in bankruptcy
could be described as successful in the post-bankruptcy period. The changing in
governance structures in that crucial period might affect post-bankruptcy firm survival.
The reason for the large number of professionals working with organizations in various
stages of financial distress is to prevent the company faced with the bankruptcy issues.
Board size declines as firms become distressed (Altman, & Hotchkiss, 1993). The
company with smaller and more independent boards and with larger ownership stakes
of executive directors are more effective at avoiding bankruptcy (Fich, & Slezak, 2007).
Gillan and Martin (2003) provide evidence that the effective governance structures for
each firm is different.
2.4 Corporate Governance and Performances
Stock ownership of board members, and CEO-Chair separation is significantly
positively correlated with better contemporaneous and subsequent operating
performance. Also, interestingly, contemporaneous and subsequent operating
performance is negatively correlated with the board independent. Hence, if the board
independence is established to improve performance, then such efforts are misguided
(Bhagat, & Bolton, 2008). ROE determines the company financial performance, and
this is one of the factors that can be seen by prospective investors to determine their
share investment. For a company, it is a great requirement in maintaining and
improving financial performance so that the share will get interest of any investors
(Rosikah et al., 2018). The predicted component of compensation based from the board
and ownership structure has a statistically significant negative relation with operating
and stock return performance of the firm (Core, Holthausen, & Larcker, 1999).
Yermack (1996) also provides evidence that firm value and performance is a decreasing
function of board size. Lambert et al. (1993) find that when CEOs have appointed a
greater proportion of the board, they receive higher pay.
7
2.5 Tobin’s Q
James Tobin had hypothesized that the combined market value of all the
companies on the stock market should be equal to their replacement costs. An
undervalued company, one with a low Q (between 0 and 1), would be attractive to
corporate raiders or potential purchasers, as they may want to purchase the firm instead
of creating a similar company. The interest in the company would likely to be increased
which would then cause increase its stock price, which would, in turn, increase its
Tobin's Q. As for overvalued companies, those with a high Q (greater than 1), they may
see increased competition. A high Q implies that a firm is earning a rate higher than its
replacement cost. This caused individuals or other companies to create similar types of
businesses to capture some of the profits. The existing firm's market shares would be
reduced then lower its market price and cause its Tobin's Q to fall (Hayes, 2019).
2.6 Corporate Governance and Tobin’s Q
Uchida (2006) stated that the ROA has positive and significant impact on
Tobin's Q whereas the Imam and Irwansyah (2002) found that the ROA had no
significant effect on stock return. At least in Russia, governance predicts firm value by
using a firm fixed effects framework. The OLS result and fixed effects results have a
big difference (Black, Love, & Rachinsky, 2006). Doidge et al., (2004b) stated that the
share price can be predicted by the governance. The profitability did not affect by the
CEO tenure at low level, but CEO's who remain too long time in the position (more
than 15 years) reduce corporate performance (John, & Senbet, 1998).
2.7 Corporate Governance and Macroeconomics
GDP per capita is used to indicate the economic performance and useful in
cross-country comparisons of average living standards and economic wellbeing but it
is having also some known weaknesses. In addition, exchange rate fluctuations can
distort the cross-country comparisons based on the U.S. dollar and often don’t reflect
the purchasing power in the countries being compared (FocusEconomics, n.d.). The
share of the labor force that is jobless, expressed as a percentage is called the
unemployment rate. It acts as a lagging indicator which means that it generally rises or
8
falls in the wake of changing economic conditions. The unemployment rate can be
conditions such as growing at a healthy rate and having plenty of jobs, the rate can be
expected to fall (Kagan, 2019). Exchange rate means the value of 1 currency is
determined for purpose of conversion to other country’s currency. Exchange rates can
be separated into 2 parts which it is either fixed or floating. Fixed exchange rates are
decided by central banks of a country whereas floating exchange rates are decided by
the mechanism of market demand and supply (The Economic Times, n.d.). Worse
economic prospects result in more expropriation by managers in countries with weak
corporate governance and thus a larger fall in prices of assets (Johnson, Broone, Breach,
& Friedman, 2000). Greenspan (1998) explained the loss of confidence can trigger
rapid and disruptive changes in the pattern of finance which reflected on exchange rates
and asset prices. The loss of confidence can be quickly spread to other countries
because the investors worried about it.

9
3.0 Methodology
3.1 Introduction
Research methodology is a systematic way to solve a problem. It is a science of
studying how research is to be carried out. Rajasekar, S, Philominathan, P, and
Chinnathambi, V (2006) describe research methodology as the procedures of
researchers to conduct a series of activities for describing, explaining and predicting
phenomena. The purpose of this research is to understand the impact of corporate
governance index with determinants towards the selected company’s performances.
The method that is used to collect and analyze data is IBM Statistical Package for the
Social Sciences (SPSS) Statistics version 25.
3.2 Statistical Technique
This study focuses on the analysis on the pre-scandal, the year that the scandal
happened and the post-scandal of the selected company. The company that has been
selected is Huawei Technologies Co., Ltd. The data used to conduct this research are
extracted from annual reports of the company from year 2011 to 2015. Income
statement and balance sheet in the annual report which contain the financial
information is used to evaluate the company’s performance by computing corporate
governance index, return on assets (ROA), return on equity (ROE), Tobin’s Q and
Altman Z. For the macroeconomics factors, the data of Gross Domestic Product (GDP)
per capita (USD), unemployment rate and exchange rate are also collected to analyze
the economic condition from year 2011 to 2015.
The main technique that used to complete this research is Ordinary Least-
Square (OLS) regression or more commonly known as linear regression. A researcher
uses the Least-Squares method to seek for a line of best fit that explains the potential
relationship between an independent variable and a dependent variable. OLS chooses
the parameters of a linear function of a set of explanatory variables by minimizing the
sum of the squares of the differences between the observed dependent variable in the
given dataset and those predicted by the linear function. The relationships are modelled
using linear predictor functions whose unknown model parameters are estimated from
10
the data. Therefore, OLS is easier and more sensible to be used for estimating
regression as compared to other alternative techniques (Kenton, 2019).
3.3 Data Analysis
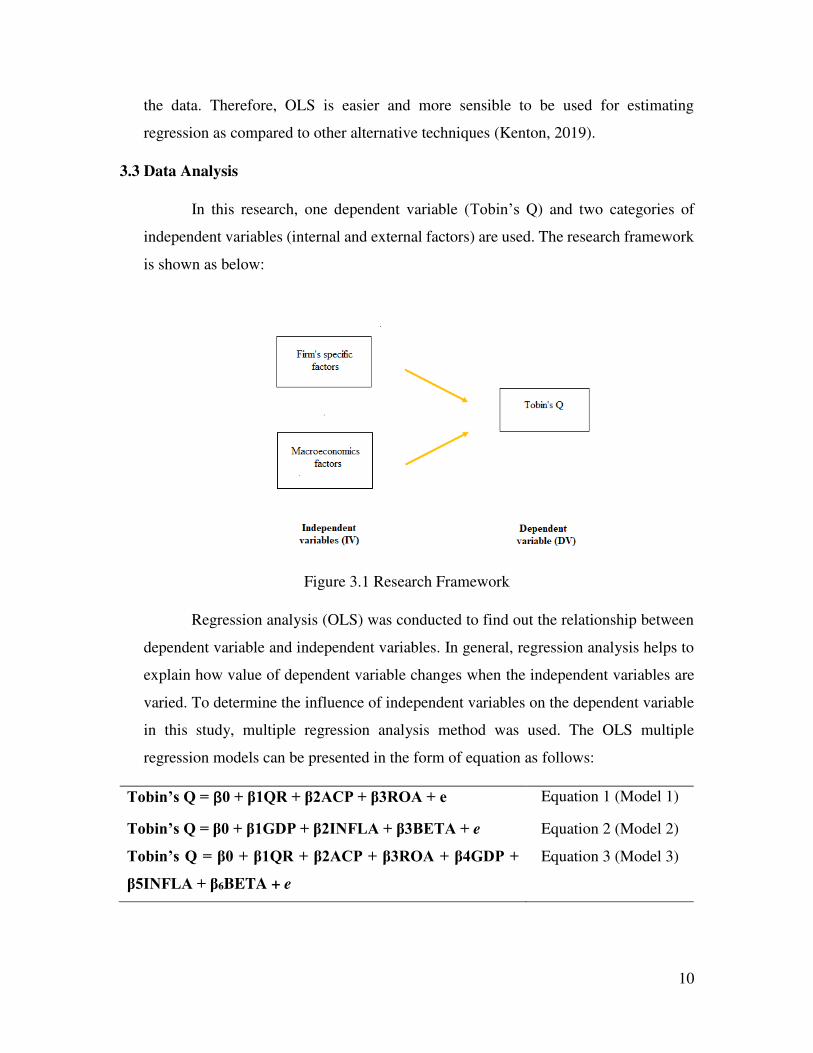
In this research, one dependent variable (Tobin’s Q) and two categories of
independent variables (internal and external factors) are used. The research framework
is shown as below:
Figure 3.1 Research Framework
Regression analysis (OLS) was conducted to find out the relationship between
dependent variable and independent variables. In general, regression analysis helps to
explain how value of dependent variable changes when the independent variables are
varied. To determine the influence of independent variables on the dependent variable
in this study, multiple regression analysis method was used. The OLS multiple
regression models can be presented in the form of equation as follows:
Tobin’s Q = β0 + β1QR + β2ACP + β3ROA + e Equation 1 (Model 1)
Tobin’s Q = β0 + β1GDP + β2INFLA + β3BETA + e Equation 2 (Model 2)
Tobin’s Q = β0 + β1QR + β2ACP + β3ROA + β4GDP + β5INFLA + β6BETA + e
Equation 3 (Model 3)
11
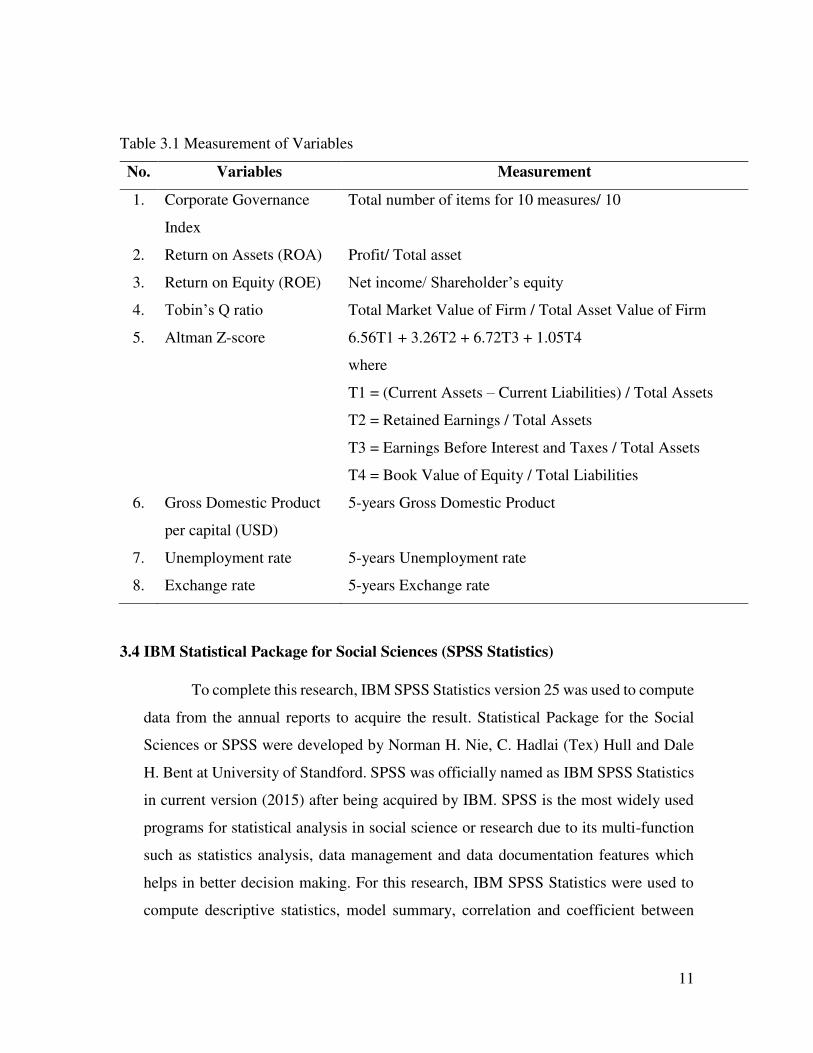
Table 3.1 Measurement of Variables
No. Variables Measurement
1. Corporate Governance
Index
Total number of items for 10 measures/ 10
2. Return on Assets (ROA) Profit/ Total asset
3. Return on Equity (ROE) Net income/ Shareholder’s equity
4. Tobin’s Q ratio Total Market Value of Firm / Total Asset Value of Firm
5. Altman Z-score
6.56T1 + 3.26T2 + 6.72T3 + 1.05T4
where
T1 = (Current Assets – Current Liabilities) / Total Assets
T2 = Retained Earnings / Total Assets
T3 = Earnings Before Interest and Taxes / Total Assets
T4 = Book Value of Equity / Total Liabilities
6. Gross Domestic Product
per capital (USD)
5-years Gross Domestic Product
7. Unemployment rate 5-years Unemployment rate
8. Exchange rate 5-years Exchange rate
3.4 IBM Statistical Package for Social Sciences (SPSS Statistics)
To complete this research, IBM SPSS Statistics version 25 was used to compute
data from the annual reports to acquire the result. Statistical Package for the Social
Sciences or SPSS were developed by Norman H. Nie, C. Hadlai (Tex) Hull and Dale
H. Bent at University of Standford. SPSS was officially named as IBM SPSS Statistics
in current version (2015) after being acquired by IBM. SPSS is the most widely used
programs for statistical analysis in social science or research due to its multi-function
such as statistics analysis, data management and data documentation features which
helps in better decision making. For this research, IBM SPSS Statistics were used to
compute descriptive statistics, model summary, correlation and coefficient between

12
independent variables and dependent variable based on quantitative data extracted from
annual reports and official websites.

13
4.0 Analysis and Finding
4.1 Introduction
Financial statement analysis process has been carried out to review and evaluate
the financial data and performances extracted from the annual reports of the company.
In this research, various ratios including the corporate governance index of the selected
company are conducted across the five-year period (2011-2015) respectively.
4.2 Corporate Governance Index
Figure 4.1 Huawei’s Corporate Governance Index
A corporate governance index combines a series of measure that known to be
good indicators of good corporate governance by quantifying the data for each measure.
Based on the measure, a score is then assigned and then combined to create an index
(Auckland Centre for Financial Research, n.d.). Corporate governance index is
indicated by calculating the average of the 10 measures for the 5 years (2011-2015) of
the Huawei. The 10 measures are included the board structure index (independence
elements), committee elements, board procedure index, audit committee procedure
elements, disclosure index, non-financial disclosure elements, disclosure reliability
elements, ownership structure index, shareholder rights index and related party index.
From Figure 4.1 above, Huawei’s corporate governance index is 0.5237 (2011),
then decreases to 0.5189 (2012) and 0.5149 (2013). In the year 2014, the index has an
increase of 0.0088 to 0.5237 and then decreases to 0.5182 in the next year (2015).
Huawei has the highest corporate governance index which is 0.5237 in the year 2011
0.52370.5189
0.5149
0.52370.5182
0.5100
0.5200
0.5300
2011 2012 2013 2014 2015
Corp
ora
te g
over
nan
ce
index
Year
Huawei's Corporate Governance Index
Corporate governance index
14
and 2014. This indicates that Huawei has good corporate governance in the year 2011
and 2014. In the year 2013, the year that scandals happened, Huawei experiences the
lowest corporate governance index which is 0.5149 and indicates poor corporate
governance.
4.3 Return on Assets (ROA)
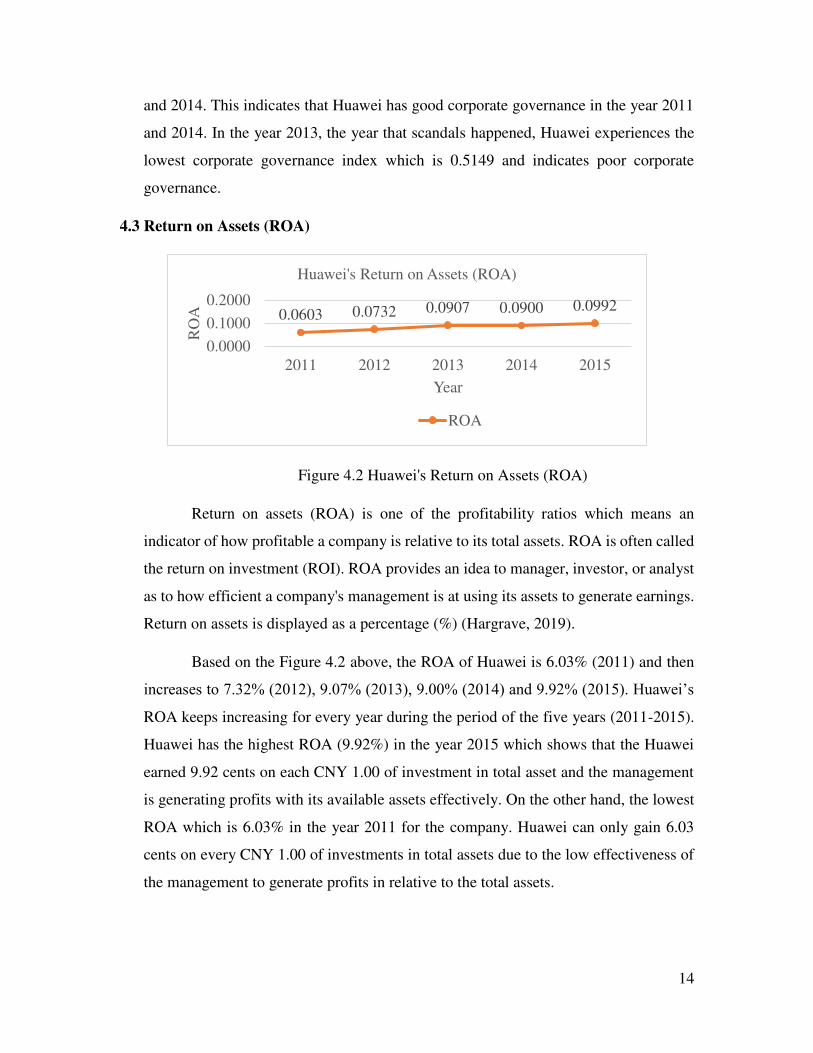
Figure 4.2 Huawei's Return on Assets (ROA)
Return on assets (ROA) is one of the profitability ratios which means an
indicator of how profitable a company is relative to its total assets. ROA is often called
the return on investment (ROI). ROA provides an idea to manager, investor, or analyst
as to how efficient a company's management is at using its assets to generate earnings.
Return on assets is displayed as a percentage (%) (Hargrave, 2019).
Based on the Figure 4.2 above, the ROA of Huawei is 6.03% (2011) and then
increases to 7.32% (2012), 9.07% (2013), 9.00% (2014) and 9.92% (2015). Huawei’s
ROA keeps increasing for every year during the period of the five years (2011-2015).
Huawei has the highest ROA (9.92%) in the year 2015 which shows that the Huawei
earned 9.92 cents on each CNY 1.00 of investment in total asset and the management
is generating profits with its available assets effectively. On the other hand, the lowest
ROA which is 6.03% in the year 2011 for the company. Huawei can only gain 6.03
cents on every CNY 1.00 of investments in total assets due to the low effectiveness of
the management to generate profits in relative to the total assets.
0.0603 0.0732 0.0907 0.0900 0.0992
0.0000
0.1000
0.2000
2011 2012 2013 2014 2015
RO
A
Year
Huawei's Return on Assets (ROA)
ROA

15
4.4 Return on Equity (ROE)
Figure 4.3 Huawei's Return on Equity (ROE)
Return on equity (ROE) is one of the important measures besides ROA for
evaluating how effectively a company’s management team is doing its job of managing
the capital entrusted to it. It is the bottom line measure for the shareholders. If that
company takes on financial leverage, its ROE would rise above its ROA. By taking on
debt, a company increases its assets thanks to the cash that has borrowed and come in
the company. Since shareholder equity equals assets minus total debt, a company
decreases its equity by increasing debt (Furhmann, 2019).
Based on the Figure 4.3 above, the ROE of Huawei is 17.57% (2011) and then
increases to 20.49% (2012), 24.36% (2013), 27.69% (2014) and 32.60% (2015).
Huawei’s ROE has an increasement from year to year during the period of the five
years (2011-2015). Huawei has the highest ROE which is 32.60% in the year 2015
which shows that the Huawei earned 32.60 cents on each CNY 1.00 of common stock
equity and the management is generating profits with its available assets effectively.
During the year 2015, ROE is higher than the ROA (9.92%) because the Huawei has
increasing its debt from CNY 209788 million (2014) to CNY 253086 million (2015).
The lowest ROE which is 17.57% in the year 2011 for the company. Huawei can only
gain 17.57 cents on every CNY 1.00 of common stock equity due to the low
effectiveness of the management to generate profits in relative to the total assets.
0.1757 0.2049 0.2436 0.2769 0.3260
0.0000
0.2000
0.4000
2011 2012 2013 2014 2015
RO
E
Year
Huawei's Return on Equity (ROE)
ROE

16
4.5 Tobin’s Q
Figure 4.4 Huawei's Tobin's Q
The Tobin's Q is a ratio popularized by James Tobin of Yale University, Nobel
laureate in economics. The market value of a company divided by its assets'
replacement cost is defined as Tobin’s Q (Hayes, 2019). From Figure 4.4 above,
Huawei’s Tobin’s Q is 0.00021 (2011), then increases to 0.00023 (2012) and keeps
constant until the year 2014. In the year 2015, the index has increasing to 0.00028.
During the 5 years, the highest value of Tobin’s Q is 0.00028 in the year 2015. Huawei
experiences the lowest value of Tobin’s Q which is 0.00021 in the year 2011. Huawei
gets low Q constantly for 5 years and this determines that Huawei is an undervalued
company whereby it has earning rate lower than its replacement cost.
4.6 Altman Z
Figure 4.5 Huawei's Altman Z
0.00021 0.00023 0.00023 0.00023 0.00028
0.00000
0.00020
0.00040
2011 2012 2013 2014 2015
Tobin
's Q
rat
io
Year
Huawei's Tobin's Q
Tobin's Q
4.23 4.36 4.81 3.96 3.93
0.00
5.00
10.00
2011 2012 2013 2014 2015
Alt
man
Z-S
core
Year
Huawei's Altman Z
Altman Z
17
The Altman Z is the output of a credit-strength test that gauges a publicly traded
manufacturing company's likelihood of bankruptcy. The Altman Z is based on five
financial ratios that can calculate from data found on a company's annual 10-K report.
It uses profitability, leverage, liquidity, solvency and activity to predict whether a
company has high probability of being insolvent (Kenton, 2019). The grading scale of
Altman Z within 0 – 1.8 indicates the company will declare bankruptcy in the future,
1.8 – 3 indicates the company is likely to declare bankruptcy and 3+ indicates the
company is will not declare bankruptcy (My Accounting Course, n.d.).
From Figure 4.5 above, Huawei’s Altman Z is 4.23 (2011), then decreases to
4.36 (2012) and 4.81 (2013). In the year 2014, the index is then decreasing to 3.96 and
3.93 in the next year (2015). Huawei has the highest Altman Z which is 4.81 in the year
2013 where this indicates that the company is still in the ‘safe zone’ even in the year
that scandals happened. In the year 2015, Huawei experiences the lowest Altman Z
which is 3.93 but this indicates the company is will not declare bankruptcy.
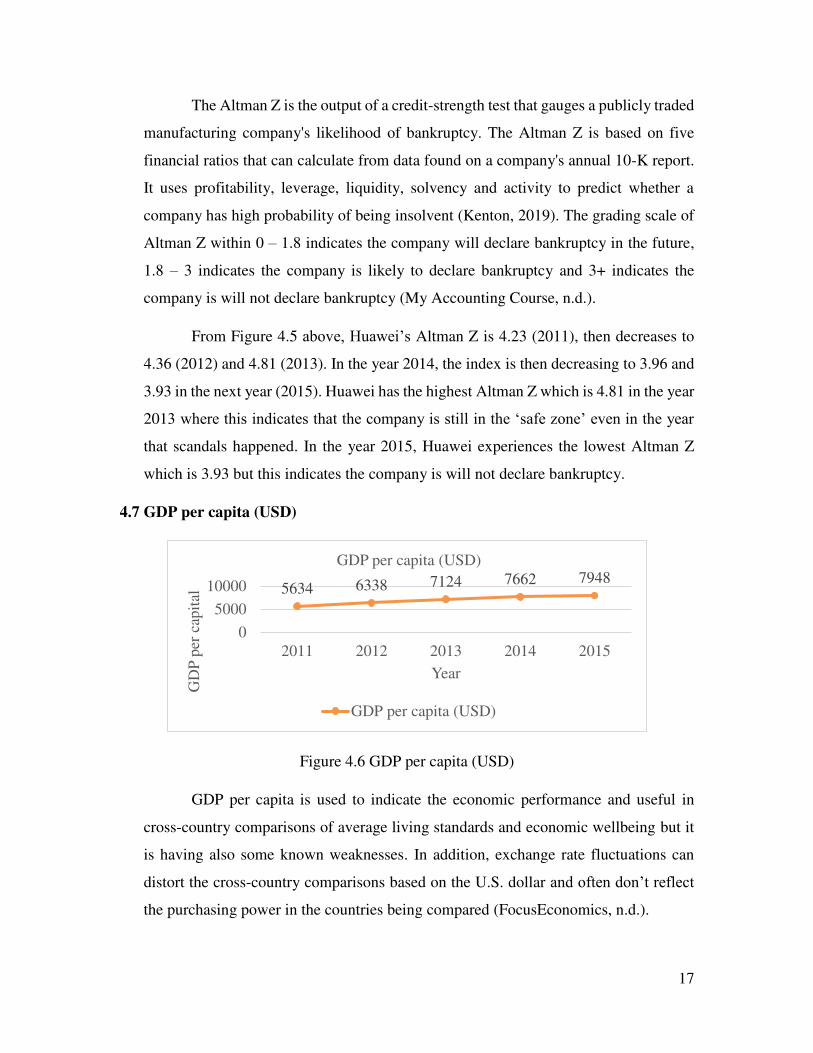
4.7 GDP per capita (USD)
Figure 4.6 GDP per capita (USD)
GDP per capita is used to indicate the economic performance and useful in
cross-country comparisons of average living standards and economic wellbeing but it
is having also some known weaknesses. In addition, exchange rate fluctuations can
distort the cross-country comparisons based on the U.S. dollar and often don’t reflect
the purchasing power in the countries being compared (FocusEconomics, n.d.).
5634 6338 7124 7662 7948
0
5000
10000
2011 2012 2013 2014 2015
GD
P p
er c
apit
al
Year
GDP per capita (USD)
GDP per capita (USD)
18
The highest GDP per capita (USD) is 7948 for the year 2015 which indicates
that the living standard in China is the highest compared to the past 4 years. However,
for the year 2011, the GDP per capita (USD) is the lowest and shows that the lowest
living standard in China among these 5 years. In year 2011, GDP per capita (USD) is
5634 and then its keeps increasing to 6338 (2012), 7124 (2013), 7662 (2014) and 7948
(2015). This shows that the improvement of the quality of living in China is constantly.
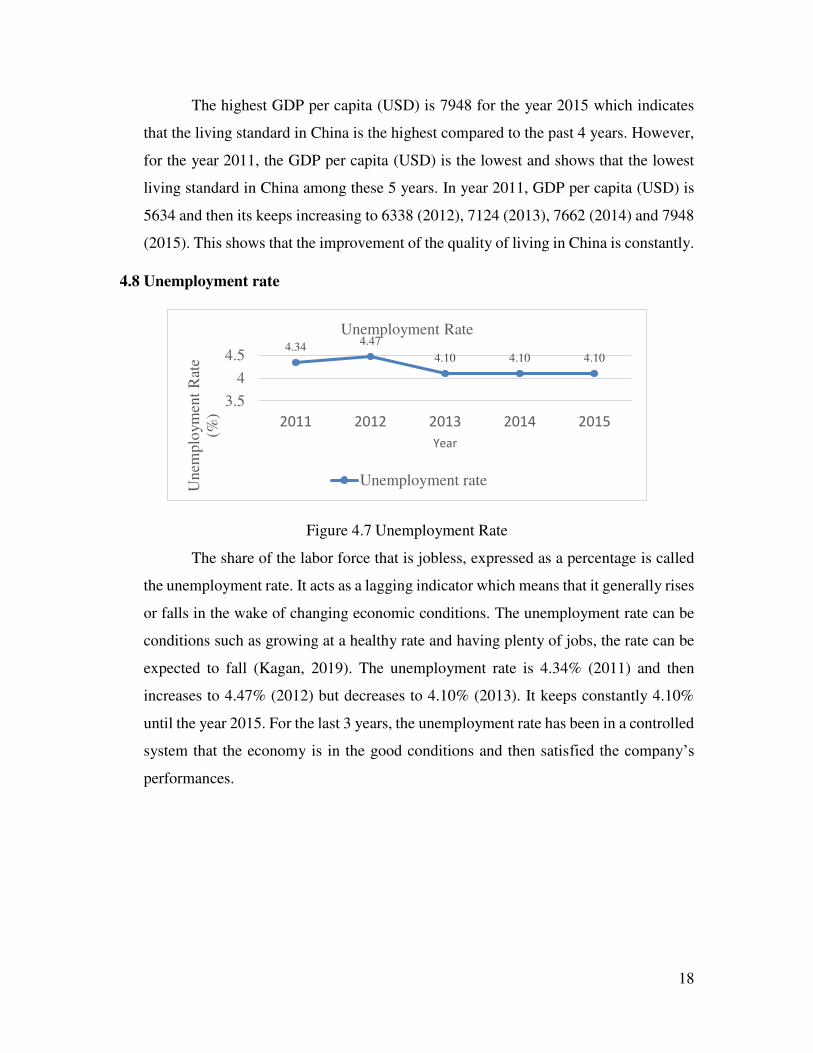
4.8 Unemployment rate
Figure 4.7 Unemployment Rate
The share of the labor force that is jobless, expressed as a percentage is called
the unemployment rate. It acts as a lagging indicator which means that it generally rises
or falls in the wake of changing economic conditions. The unemployment rate can be
conditions such as growing at a healthy rate and having plenty of jobs, the rate can be
expected to fall (Kagan, 2019). The unemployment rate is 4.34% (2011) and then
increases to 4.47% (2012) but decreases to 4.10% (2013). It keeps constantly 4.10%
until the year 2015. For the last 3 years, the unemployment rate has been in a controlled
system that the economy is in the good conditions and then satisfied the company’s
performances.
4.344.47
4.10 4.10 4.10
3.5
4
4.5
2011 2012 2013 2014 2015
Unem
plo
ymen
t R
ate
(%)
Year
Unemployment Rate
Unemployment rate

19
4.9 Exchange Rate
Figure 4.8 Exchange rate
Exchange rate means the value of 1 currency is determined for purpose of
conversion to other country’s currency. Exchange rates can be separated into 2 parts
which it is either fixed or floating. Fixed exchange rates are decided by central banks
of a country whereas floating exchange rates are decided by the mechanism of market
demand and supply (The Economic Times, n.d.). The highest exchange rate is 6.49%
in the year 2015 which means that 1 USD is equal to 6.49 CNY for that year. On the
other hand, the lowest exchange rate is 6.05% in the year 2013 that shows that 6.05
CNY only is equal to 1 USD.
6.46 6.316.05 6.21
6.49
5.56
6.57
2011 2012 2013 2014 2015
Ex
chan
ge
Rat
e (%
)
Year
Exchange rate
Exchange rate
20
4.10 Descriptive Statistics
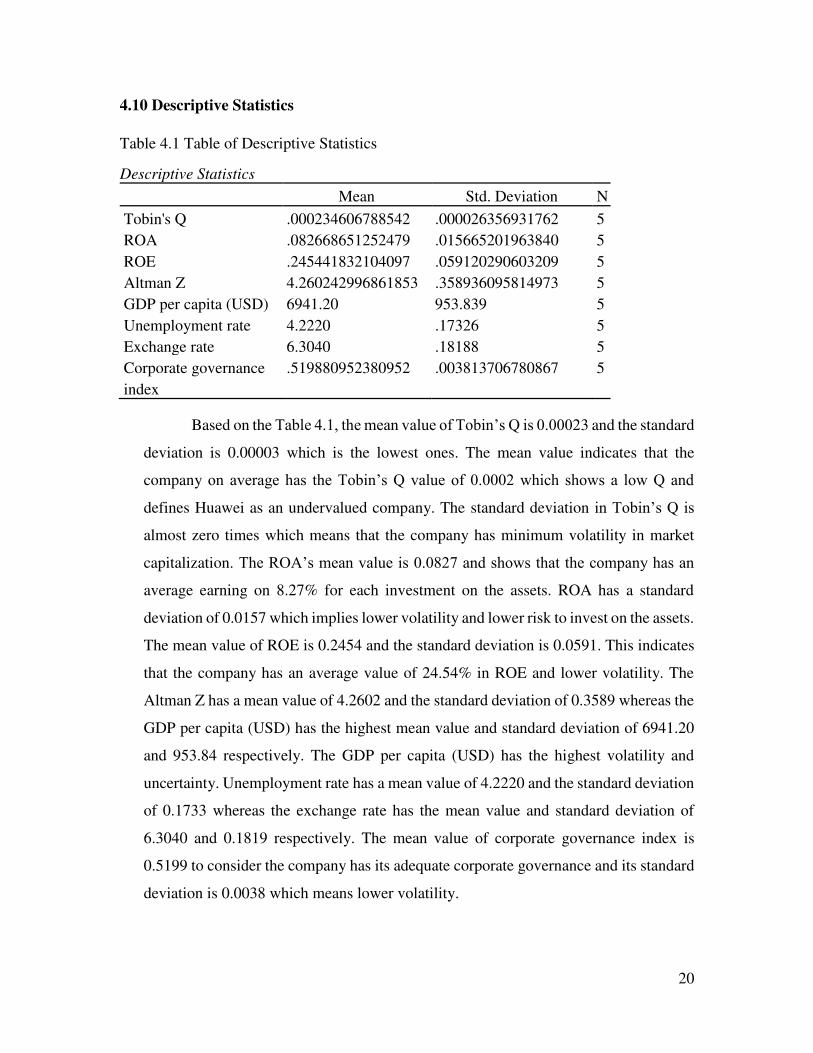
Table 4.1 Table of Descriptive Statistics
Descriptive Statistics
Mean Std. Deviation N
Tobin's Q .000234606788542 .000026356931762 5
ROA .082668651252479 .015665201963840 5
ROE .245441832104097 .059120290603209 5
Altman Z 4.260242996861853 .358936095814973 5
GDP per capita (USD) 6941.20 953.839 5
Unemployment rate 4.2220 .17326 5
Exchange rate 6.3040 .18188 5
Corporate governance
index
.519880952380952 .003813706780867 5
Based on the Table 4.1, the mean value of Tobin’s Q is 0.00023 and the standard
deviation is 0.00003 which is the lowest ones. The mean value indicates that the
company on average has the Tobin’s Q value of 0.0002 which shows a low Q and
defines Huawei as an undervalued company. The standard deviation in Tobin’s Q is
almost zero times which means that the company has minimum volatility in market
capitalization. The ROA’s mean value is 0.0827 and shows that the company has an
average earning on 8.27% for each investment on the assets. ROA has a standard
deviation of 0.0157 which implies lower volatility and lower risk to invest on the assets.
The mean value of ROE is 0.2454 and the standard deviation is 0.0591. This indicates
that the company has an average value of 24.54% in ROE and lower volatility. The
Altman Z has a mean value of 4.2602 and the standard deviation of 0.3589 whereas the
GDP per capita (USD) has the highest mean value and standard deviation of 6941.20
and 953.84 respectively. The GDP per capita (USD) has the highest volatility and
uncertainty. Unemployment rate has a mean value of 4.2220 and the standard deviation
of 0.1733 whereas the exchange rate has the mean value and standard deviation of
6.3040 and 0.1819 respectively. The mean value of corporate governance index is
0.5199 to consider the company has its adequate corporate governance and its standard
deviation is 0.0038 which means lower volatility.
21
4.11 Correlation
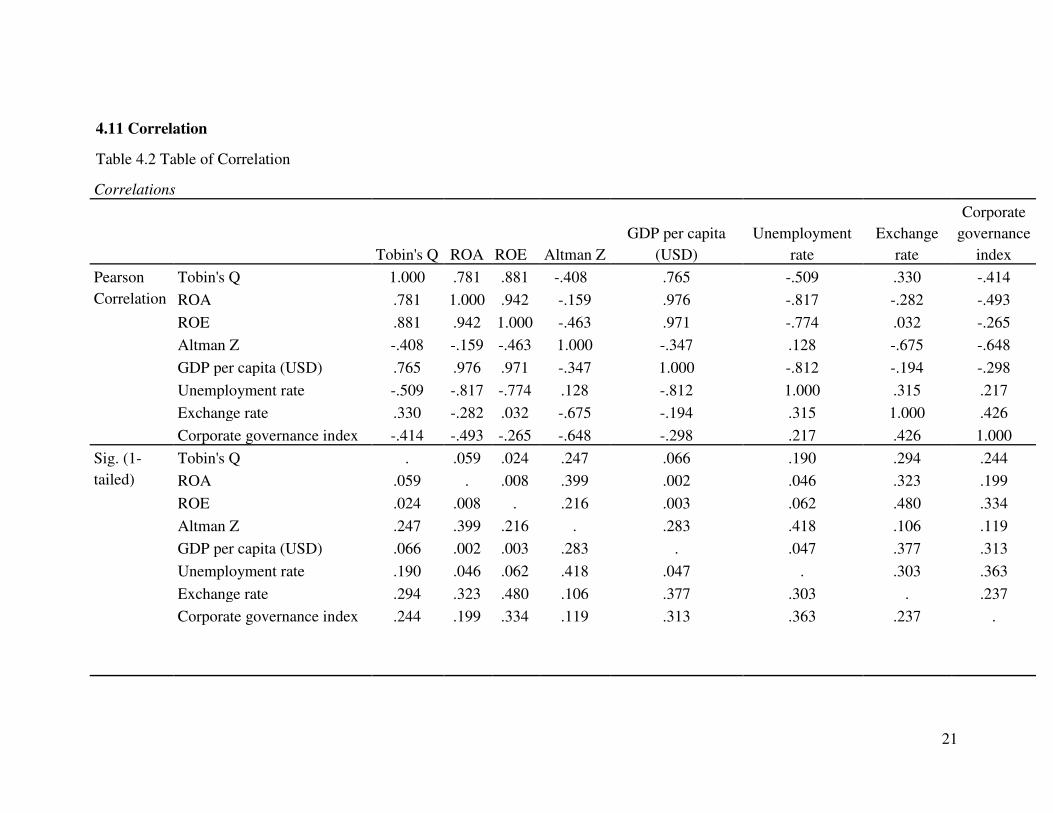
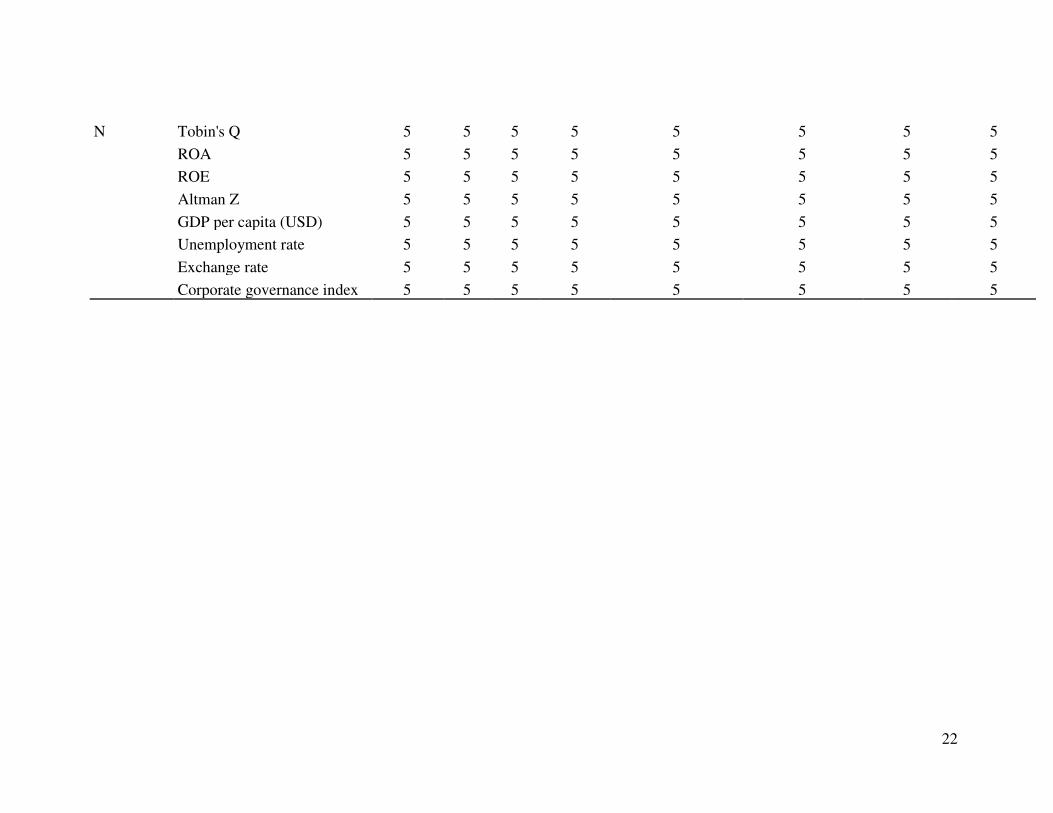
Table 4.2 Table of Correlation
Correlations
Tobin's Q ROA ROE Altman Z
GDP per capita
(USD)
Unemployment
rate
Exchange
rate
Corporate
governance
index
Pearson
Correlation
Tobin's Q 1.000 .781 .881 -.408 .765 -.509 .330 -.414
ROA .781 1.000 .942 -.159 .976 -.817 -.282 -.493
ROE .881 .942 1.000 -.463 .971 -.774 .032 -.265
Altman Z -.408 -.159 -.463 1.000 -.347 .128 -.675 -.648
GDP per capita (USD) .765 .976 .971 -.347 1.000 -.812 -.194 -.298
Unemployment rate -.509 -.817 -.774 .128 -.812 1.000 .315 .217
Exchange rate .330 -.282 .032 -.675 -.194 .315 1.000 .426
Corporate governance index -.414 -.493 -.265 -.648 -.298 .217 .426 1.000
Sig. (1-
tailed)
Tobin's Q . .059 .024 .247 .066 .190 .294 .244
ROA .059 . .008 .399 .002 .046 .323 .199
ROE .024 .008 . .216 .003 .062 .480 .334
Altman Z .247 .399 .216 . .283 .418 .106 .119
GDP per capita (USD) .066 .002 .003 .283 . .047 .377 .313
Unemployment rate .190 .046 .062 .418 .047 . .303 .363
Exchange rate .294 .323 .480 .106 .377 .303 . .237
Corporate governance index .244 .199 .334 .119 .313 .363 .237 .
22
N Tobin's Q 5 5 5 5 5 5 5 5
ROA 5 5 5 5 5 5 5 5
ROE 5 5 5 5 5 5 5 5
Altman Z 5 5 5 5 5 5 5 5
GDP per capita (USD) 5 5 5 5 5 5 5 5
Unemployment rate 5 5 5 5 5 5 5 5
Exchange rate 5 5 5 5 5 5 5 5
Corporate governance index 5 5 5 5 5 5 5 5
23
Pearson correlation is used to determine the relationship between dependent
variable (Tobin’s Q) and independent variables (firm-specific variables and macro-
economic variables). The table 4.3 below is used as benchmark to determine the
relationship between the dependent variables and independent variables.
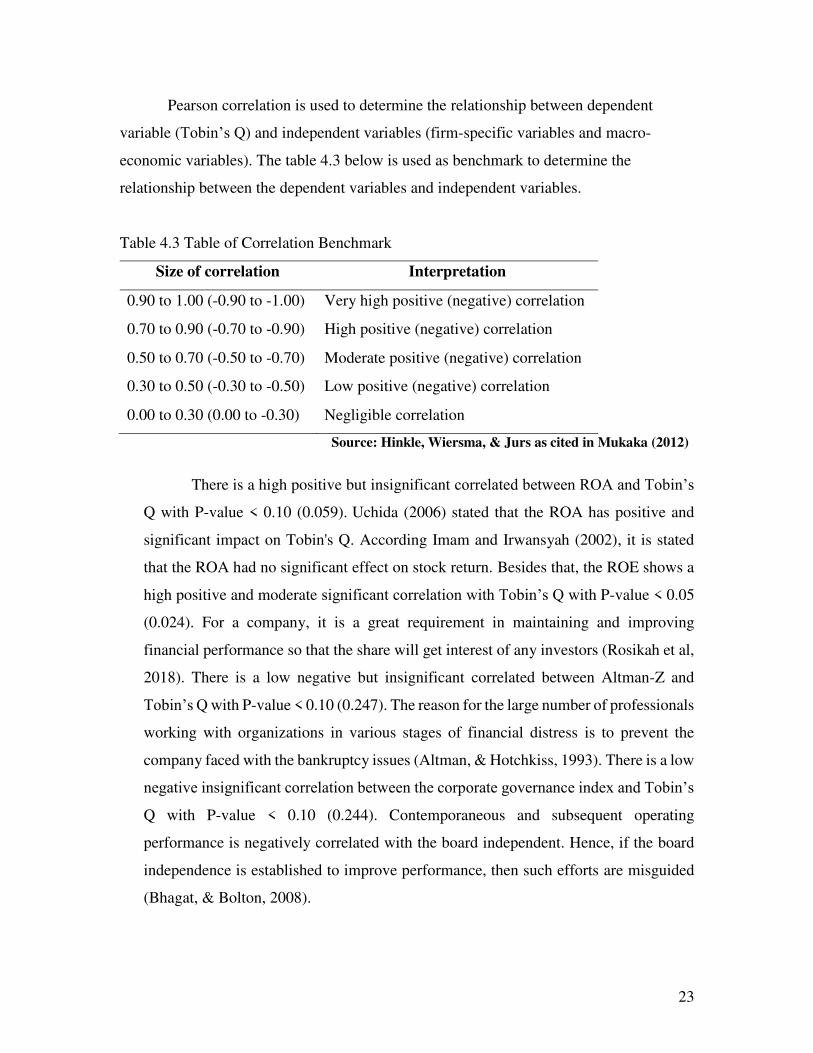
Table 4.3 Table of Correlation Benchmark
Size of correlation Interpretation
0.90 to 1.00 (-0.90 to -1.00) Very high positive (negative) correlation
0.70 to 0.90 (-0.70 to -0.90) High positive (negative) correlation
0.50 to 0.70 (-0.50 to -0.70) Moderate positive (negative) correlation
0.30 to 0.50 (-0.30 to -0.50) Low positive (negative) correlation
0.00 to 0.30 (0.00 to -0.30) Negligible correlation
Source: Hinkle, Wiersma, & Jurs as cited in Mukaka (2012)
There is a high positive but insignificant correlated between ROA and Tobin’s
Q with P-value < 0.10 (0.059). Uchida (2006) stated that the ROA has positive and
significant impact on Tobin's Q. According Imam and Irwansyah (2002), it is stated
that the ROA had no significant effect on stock return. Besides that, the ROE shows a
high positive and moderate significant correlation with Tobin’s Q with P-value < 0.05
(0.024). For a company, it is a great requirement in maintaining and improving
financial performance so that the share will get interest of any investors (Rosikah et al,
2018). There is a low negative but insignificant correlated between Altman-Z and
Tobin’s Q with P-value < 0.10 (0.247). The reason for the large number of professionals
working with organizations in various stages of financial distress is to prevent the
company faced with the bankruptcy issues (Altman, & Hotchkiss, 1993). There is a low
negative insignificant correlation between the corporate governance index and Tobin’s
Q with P-value < 0.10 (0.244). Contemporaneous and subsequent operating
performance is negatively correlated with the board independent. Hence, if the board
independence is established to improve performance, then such efforts are misguided
(Bhagat, & Bolton, 2008).

24
The GDP per capita (USD) shows a high positive but not significant correlation
with Tobin’s Q with P-value < 0.10 (0.066). There is a low negative insignificant
correlated between unemployment rate and Tobin’s Q with P-value < 0.10 (0.190). The
exchange rate shows a low positive insignificant correlation with Tobin’s Q with P-
value < 0.10 (0.294).
4.12 Model Summary
Table 4.4 Model Summary Result for Pooled Model 3
Model Summaryb
Model R R Square
Adjusted R
Square
Std. Error of the
Estimate
Durbin-
Watson
1 .881a .776 .701 .000014406273056 2.312
a. Predictors: (Constant), ROE
b. Dependent Variable: Tobin's Q
According to the Table 4.4 above, the adjusted R-squared is equal to 70.1%. This
indicates that by using the firm-specific variables which is Return on Equity (ROE) in
Model 3, it is shown that the variables used in the model can explain 70.1% of the variance
in the Tobin’s Q of the Huawei Technologies Co., Ltd. While the remaining of 29.9% of
the adjusted R-Squared remain unknown and this implies that the variance in the Tobin’s
Q of the Huawei Technologies Co., Ltd. are unable to be explained by (ROE) for Model
3.
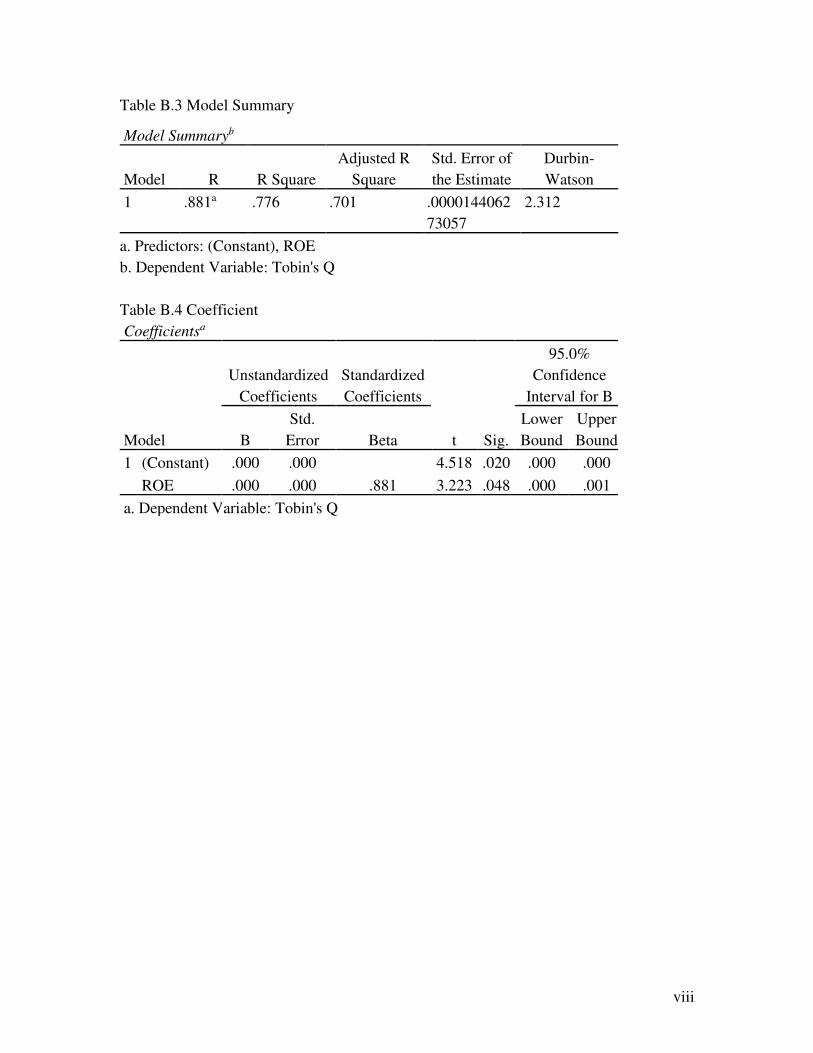
The model summary in Table B.3 (refer appendix B) is a result obtained from firm
specific factors only as the independent variables of Model 1. The adjusted R-squared
value of 0.701 indicates that 70.1% of the independent variables (ROE) can explain the
model well as same as Model 3. While another 29.9% shows that Model 1 is unable to be
explained by the firm-specific factors (ROE).
On the other hand, Model 2 uses macroeconomics factors as independent variables.
The adjusted R-squared value is 0.305 which shows that the Model 2 can explain 30.5%
of the variance in Tobin’s Q of the company. The remaining 69.5% implies that Model 2
is unable to explain by the macroeconomics factors (Refer Appendix C, Table C.3). Hence,
based on the values of adjusted R-squared obtained by Model 1 and Model 2, it can be

25
concluded that the firm-specific factors can explain the variance in the Tobin’s Q of the
company more significantly as compared to the macroeconomic factors. This implies that
the firm-specific factors especially ROE are the main factors that can explain the variance
of the Tobin’s Q of the company.
4.13 Coefficient
Table 4.5 Table of Multiple Regression Coefficients
Coefficientsa
Model
Unstandardized
Coefficients
Standardized
Coefficients
t Sig.
95.0%
Confidence
Interval for B
Collinearity
Statistics
B
Std.
Error Beta
Lower
Bound
Upper
Bound Tolerance VIF
(Constant) .000 .000 4.518 .020 .000 .000 ROE .000 .000 .881 3.223 .048 .000 .001 1.000 1.000
a. Dependent Variable: Tobin's Q
The analysis on coefficients shows how the independent variables that has influence
on the Tobin’s Q can be determined through the identification of significant level of 5 %
with p-value. P-value = 0.000 implies that the independent variables has most significant
influence on dependent variable, P-value < 0.001 indicates that the independent variable
has strong influence on the dependent variable. P-value < 0.05 indicates a moderate
influence of independent variable on the dependent variable while variable that has P-value
< 0.10 has the least significant influence.
Based on Table 4.5 above, Return on Equity (ROE) is highly positive correlated
and moderate significant influenced on the Tobin’s Q with P-value < 0.05 (0.048) for the
independent variables whereby t= 3.223. It implies that any changes in Return on Equity
(ROE) will influence the level of Tobin’s Q moderately. ROE determines the company
financial performance, and this is one of the factors that can be seen by prospective
investors to determine their share investment. For a company, it is a great requirement in
maintaining and improving financial performance so that the share will get interest of any
investors (Rosikah et al, 2018). The interest in the company would likely to be increased

26
which would then cause increase its stock price, which would, in turn, increase its Tobin's
Q.

27
5.0 Conclusion
5.1 Introduction
This study aims to determine the impact of Tobin’s Q in relation with
determinants towards the company’s performances. To achieve this objectives, 5 firm-
specific factors (Corporate governance index, ROA, ROE, Tobin’s Q and Altman Z)
and 3 macroeconomics factors (GDP per capita, unemployment rate and exchange rate)
were investigated in this study. This chapter will discuss about the findings in previous
chapter, conclusion and recommendations for future work.
5.2 Discussion of results
This study aims to investigate the impact of Tobin’s Q in relation with determinants
towards the selected company’s performances. The objectives of the study are:
1. To investigate the impact of Tobin’s Q in relation with firm-specific factors
towards the selected company’s performances.
2. To investigate the impact of Tobin’s Q in relation with macroeconomics factors
towards the selected company’s performances.
3. To investigate the impact of Tobin’s Q in relation with firm-specific factors and
macroeconomics factors towards the selected company’s performances.
Based on the Table 4.2 (Correlation) and Table 4.5 (Coefficient), there are
evidence showing that the Tobin’s Q has been influenced by the firm-specific factors
only in terms of Return on Equity (ROE) only. It is shows that the ROE shows a high
positive and moderate significant correlation with Tobin’s Q with P-value < 0.05
(0.024). This is also indicated that if ROE increases, then the Tobin’s Q will also
increase. Based on the coefficient table, ROE is highly positive correlated and moderate
significant influenced on the Tobin’s Q with P-value < 0.05 (0.048) for the independent
variables whereby t= 3.223. ROE representing the effectiveness of the company in
using the assets to generate profit. By improving the effectiveness in using the assets,
the company can attract more potential investors and increase the share price which
will in turn raise the Tobin’s Q.
28
Macroeconomics factors play a little or nearly insignificant role on influencing
the Tobin’s Q of the Huawei. Based on the Table 4.2 (Correlation), both the
unemployment and exchange rate have low negative and low positive correlation with
Tobin’s Q respectively at where their size of correlation is too small. Three of the
macroeconomics factors including the GDP per capita (USD), unemployment and
exchange rate show insignificant P-value which are P-value = 0.066, 0.190 and 0.294
respectively.
Overall, it can be concluded that both the firm-specific factors and
macroeconomics factors have its influence on Tobin’s Q of the Huawei separately.
According to the Table 4.4 (Model Summary for Pooled Model 3) and Model 1 for
firm-specific independent variables (refer Appendix B, Table B.3), the adjusted R-
squared value shown implies that 70.1% of the variance in the Tobin’s Q of the Huawei
can be explained. While the remaining of 29.9% of the adjusted R-Squared remain
unknown and this implies that the variance in the Tobin’s Q of the Huawei are unable
to be explained by the firm-specific factors (ROE). By referring to the Table C.3 in
Appendix C, the Model 2 (macro-economics independent variables) can explain 30.5%
of the variance in Tobin’s Q of the company whereas the remaining 69.5% implies that
Model 2 is unable to explain by the macroeconomics factors. In conclusion, based on
the values of adjusted R-squared obtained by Model 1 and Model 2, it can be concluded
that the firm-specific factors have a greater impact in the Tobin’s Q of the Huawei as
compared to the macroeconomic factors.
5.3 Limitations
This study is limited on only selecting 1 company that had involved with
scandals regardless of country. This study also covers only five years financial
statements from the year 2011 until 2015 for each company. Thus, only limited amount
of information can be collected and analyzed due to the time constraint.
5.4 Recommendations
Based on the findings, the Return on equity (ROE) shows a high positive and
moderate significant correlation with Tobin’s Q of the company. ROE shows whether
the company is or not effective in earning the profit through using the assets. Hence, to
29
improve ROE, the company is advised to increase its debt with a suitable amount. By
having the cash flows in, the company can purchase new assets to generate profit. The
important thing that needs to be considered is the distribution in the portion of the
equity and liabilities for the company in a long-term way. Even through the
macroeconomics factors have a little impact in Tobin’s Q, the company still requires
in sustaining its growth along the economy conditions by somehow.

i
References
Agrawal, A., & Chadha, S. (2005). Corporate governance and accounting scandals. The
Journal of Law and Economics, 48(2), 371–406. doi:10.1086/430808
Agrawal, A., & Cooper, T. (2017). Corporate governance consequences of accounting
scandals: Evidence from top management, CFO and auditor turnover. Quarterly
Journal of Finance, 07(01), 1650014. doi:10.1142/s2010139216500142
Altman, E. I. & Hotchkiss, E. (Ed.) (1993). Corporate financial distress and bankruptcy:
Predict and avoid bankruptcy, analyze and invest in distressed debt (3rd ed.).
Hoboken, New Jersey, Canada.
Auckland Centre for Financial Research. (n.d.). What is a Corporate Governance Index?
Retrieved from https://acfr.aut.ac.nz/research/new-zealand-corporate-governance-
index/what-is-a-corporate-governance-index
Bhagat, S., & Bolton, B. (2008). Corporate governance and firm performance. Journal of
Corporate Finance, 14(3), 257–273. doi:10.1016/j.jcorpfin.2008.03.006
Black, B. S., Love, I., & Rachinsky, A. (2006). Corporate governance indices and firms’
market values: Time series evidence from Russia. Emerging Markets Review, 7(4),
361–379.doi:10.1016/j.ememar.2006.09.004
Borgia, F. (2005). Corporate governance & transparency role of disclosure: How prevent
new financial scandals and crimes? Transnational Crime and Corruption Center
(TRACCC). (June 2005), 1-52. Retrieved from
http://citeseerx.ist.psu.edu/viewdoc/download?doi=10.1.1.457.722&rep=rep1&ty
pe=pdf
Claessens, S. (2006). Corporate governance and development. The World Bank Research
Observer, 21(1), 91-122. Retrieved from https://doi.org/10.1093/wbro/lkj004
Code of Conduct for Partners. (2019). Retrieved from
https://e.huawei.com/en/partner/partner-program/code-of-conduct-for-partners
ii
Core, J. E., Holthausen, R. W., & Larcker, D. F. (1999). Corporate governance, chief
executive officer compensation, and firm performance1The financial support of
Nomura Securities and Ernst & Young LLP is gratefully acknowledged. We
appreciate the able research assistance of Dan Nunn. We acknowledge the helpful
comments of Abbie Smith (the referee), Kevin Murphy, and workshop participants
at Columbia University, the University of California – Los Angeles, the University
of Colorado – Boulder, Harvard University, George Washington University,
Massachusetts Institute of Technology, New York University, Stanford University,
and Tempe University.1. Journal of Financial Economics, 51(3), 371–406.
doi:10.1016/s0304-405x(98)00058-0
Corporate Governance Overview. (2018). Retrieved from
https://www.huawei.com/en/about-huawei/corporate-governance/corporate-
governance
Corporate Introduction. (2018). Retrieved from https://www.huawei.com/en/about-
huawei/corporate-information
Daily, C. M., & Dalton, D. R. (1994). Bankruptcy and corporate governance: The impact
of board composition and structure. Academy of Management Journal, 37(6),
1603–1617. doi:10.5465/256801
Doidge, Craig, Karolyi, G. Andrew, Stulz, Rene, 2004b. Why are foreign firms listed in
the U.S. worth more? Journal of Financial Economics 71, 205–238.
Fich, E. M., & Slezak, S. L. (2007). Can corporate governance save distressed firms from
bankruptcy? An empirical analysis. Review of Quantitative Finance and
Accounting, 30(2), 225–251. doi:10.1007/s11156-007-0048-5
FocusEconomics, (n.d.). What is GDP per capita? Retrieved from https://www.focus-
economics.com/economic-indicator/gdp-per-capita
Furhmann, R. (2019, April 10). Return on Equity (ROE) vs. Return on Assets (ROA).
Retrieved from https://www.investopedia.com/ask/answers/070914/what-are-
main-differences-between-return-equity-roe-and-return-assets-roa.asp
iii
Gillan SL, Martin JD (2003) Financial engineering, corporate governance, and the collapse
of Enron. Working Paper, Baylor University
Greenspan, A., 1998. Testimony of Chairman Alan Greenspan Before the Committee on
Banking and Financial Services. U.S. House of Representatives, January 30.
Hargrave, M. (2019, April 12). Return on Assets – ROA definition. Retrieved from
https://www.investopedia.com/terms/r/returnonassets.asp
Hayes, A. (2019, April 15). Q Ratio (Tobin's Q Ratio) definition. Retrieved from
https://www.investopedia.com/terms/q/qratio.asp
John, K., & Senbet, L. W. (1998). Corporate governance and board effectiveness. Journal
of Banking & Finance, 22(4), 371-403.
Johnson, S., Boone, P., Breach, A., & Friedman, E. (2000). Corporate governance in the
Asian financial crisis. Journal of Financial Economics, 58(1-2), 141–186.
doi:10.1016/s0304-405x(00)00069-6
Kagan, J. (2019, March 8). Unemployment rate. Retrieved from
https://www.investopedia.com/terms/u/unemploymentrate.asp
Kenton, W. (2019, April 20). Least Squares method definition. Retrieved from
https://www.investopedia.com/terms/l/least-squares-method.asp
Kolk, A. (2007). Sustainability, accountability and corporate governance: Exploring
multinationals’ reporting practices. Business Strategy and the Environment, 17(1),
1–15. doi:10.1002/bse.511
Lambert, R., Larcker, D., Weigelt, K., 1993. The structure of organizational incentives.
Administrative Science Quarterly 38, 438—461.
Lyons, K. (December 6, 2018). Huawei Q&A: What You Need to Know about the
Chinese Phone Maker. Retrieved from
https://www.theguardian.com/technology/2018/dec/06/huawei-qa-what-you-need-
to-know-about-the-chinese-phone-maker

iv
Millar, C. C., Eldomiaty, T. I., Choi, C. J., & Hilton, B. (2005). Corporate governance and
institutional transparency in emerging markets. Journal of Business Ethics. 59(1-
2), 163-174. doi: 10.1007/s10551-005-3412-1
Moulton, W. N., & Thomas, H. (1993). Bankruptcy as a deliberate strategy: Theoretical
considerations and empirical evidence. Strategic Management Journal, 14: 125-135.
Mukaka M. M. (2012). Statistics corner: A guide to appropriate use of correlation
coefficient in medical research. Malawi medical journal: the journal of Medical
Association of Malawi, 24(3), 69–71.
My Accounting Course, (n.d.). Z-Score Guide. Retrieved from
https://www.myaccountingcourse.com/financial-ratios/z-score
Rajasekar, S., Philominathan, P., & Chinnathambi, V. (2006). Research Methodology.
Retrieved April 03, 2018 from the World Wide Web:
https://arxiv.org/pdf/physics/0601009.pdf
Rosikah et al. (2018). Effects of Return on Asset, Return on Equity, Earning Per Share on
Corporate Value. The International Journal of Engineering and Science (IJES).
7(3), PP 04-14, doi:10.9790/1813-0703010614
Stecklow, S. (January 31, 2013). Exclusive: Huawei CFO Linked to Firm that Offered HP
Gear to Iran. Retrieved from https://www.reuters.com/article/us-huawei-
skycom/exclusive-huawei-cfo-linked-to-firm-that-offered-hp-gear-to-iran-
idUSBRE90U0CC20130131
The Economics Times. (n.d.). Definition of 'Exchange Rate'. Retrieved from
https://economictimes.indiatimes.com/definition/exchange-rate
Uchida, Konari, 2006, Faculty of Economics and Business Administration, The University
of Kitakyushu 4-2-1, Kitagata, Kokuraminamiku, Kitakyushu 802-8577 JAPAN.
v
Wardell, J. (July 19, 2013). Former CIA Boss Says Aware of Evidence Huawei Spying for
China. Retrieved from https://www.reuters.com/article/us-huawei-security/former-
cia-boss-says-aware-of-evidence-huawei-spying-for-china-
idUSBRE96I06I20130719
Yermack, D., 1996. Higher market valuation for firms with a small board of directors.
Journal of Financial Economics 40, 185—211.
vi
Appendices
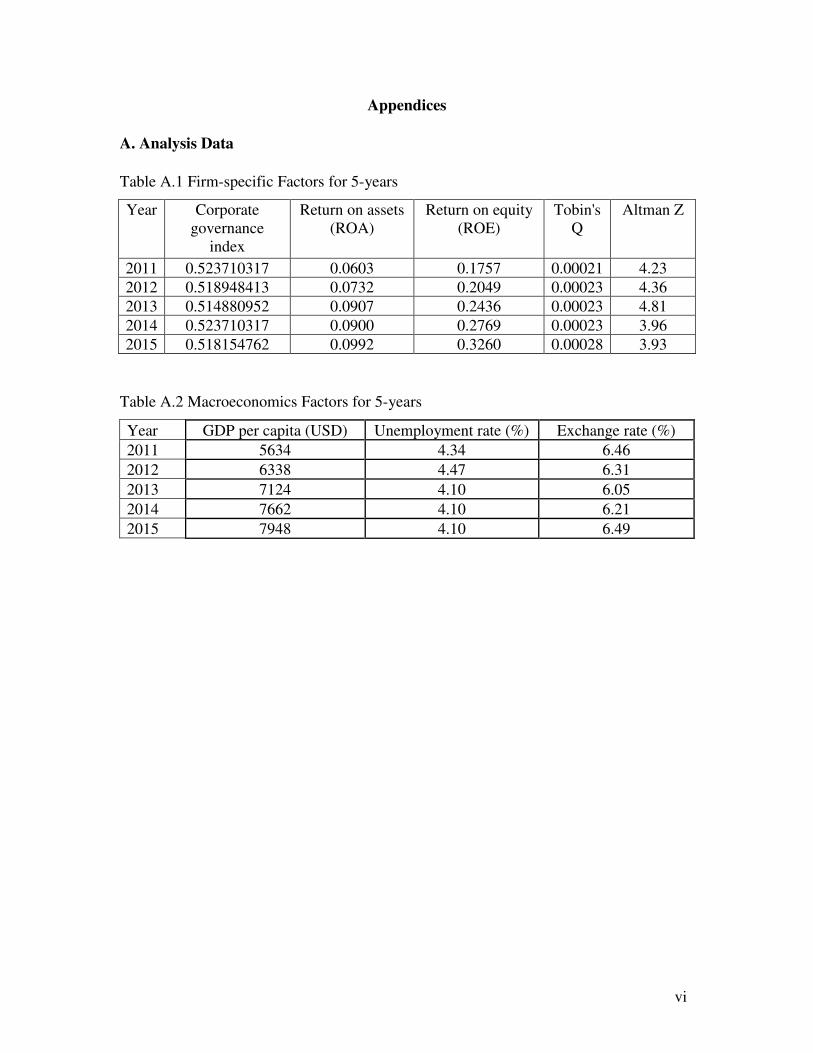
A. Analysis Data
Table A.1 Firm-specific Factors for 5-years
Year Corporate governance
index
Return on assets (ROA)
Return on equity (ROE)
Tobin's Q
Altman Z
2011 0.523710317 0.0603 0.1757 0.00021 4.23
2012 0.518948413 0.0732 0.2049 0.00023 4.36
2013 0.514880952 0.0907 0.2436 0.00023 4.81
2014 0.523710317 0.0900 0.2769 0.00023 3.96
2015 0.518154762 0.0992 0.3260 0.00028 3.93
Table A.2 Macroeconomics Factors for 5-years
Year GDP per capita (USD) Unemployment rate (%) Exchange rate (%)
2011 5634 4.34 6.46
2012 6338 4.47 6.31
2013 7124 4.10 6.05
2014 7662 4.10 6.21
2015 7948 4.10 6.49
vii
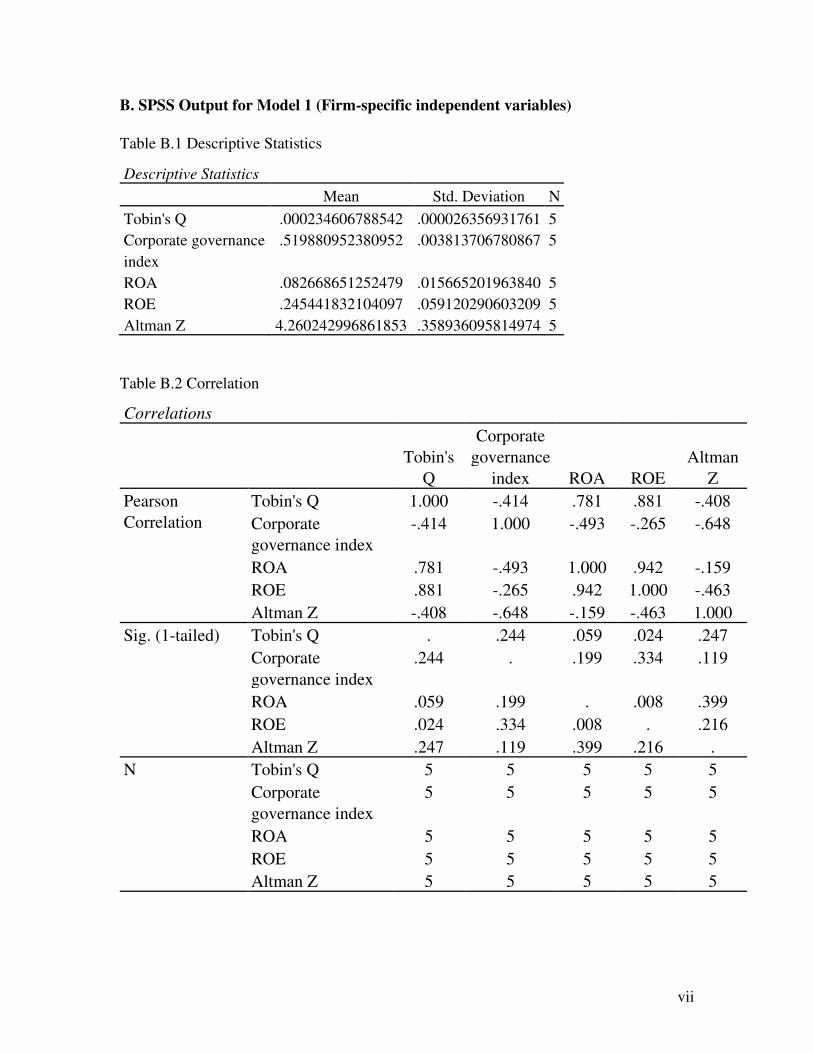
B. SPSS Output for Model 1 (Firm-specific independent variables)
Table B.1 Descriptive Statistics
Descriptive Statistics
Mean Std. Deviation N
Tobin's Q .000234606788542 .000026356931761 5
Corporate governance
index
.519880952380952 .003813706780867 5
ROA .082668651252479 .015665201963840 5
ROE .245441832104097 .059120290603209 5
Altman Z 4.260242996861853 .358936095814974 5
Table B.2 Correlation
Correlations
Tobin's
Q
Corporate
governance
index ROA ROE
Altman
Z
Pearson
Correlation
Tobin's Q 1.000 -.414 .781 .881 -.408
Corporate
governance index
-.414 1.000 -.493 -.265 -.648
ROA .781 -.493 1.000 .942 -.159
ROE .881 -.265 .942 1.000 -.463
Altman Z -.408 -.648 -.159 -.463 1.000
Sig. (1-tailed) Tobin's Q . .244 .059 .024 .247
Corporate
governance index
.244 . .199 .334 .119
ROA .059 .199 . .008 .399
ROE .024 .334 .008 . .216
Altman Z .247 .119 .399 .216 .
N Tobin's Q 5 5 5 5 5
Corporate
governance index
5 5 5 5 5
ROA 5 5 5 5 5
ROE 5 5 5 5 5
Altman Z 5 5 5 5 5
viii
Table B.3 Model Summary
Model Summaryb
Model R R Square
Adjusted R
Square
Std. Error of
the Estimate
Durbin-
Watson
1 .881a .776 .701 .0000144062
73057
2.312
a. Predictors: (Constant), ROE
b. Dependent Variable: Tobin's Q
Table B.4 Coefficient
Coefficientsa
Model
Unstandardized
Coefficients
Standardized
Coefficients
t Sig.
95.0%
Confidence
Interval for B
B
Std.
Error Beta
Lower
Bound
Upper
Bound
1 (Constant) .000 .000 4.518 .020 .000 .000
ROE .000 .000 .881 3.223 .048 .000 .001
a. Dependent Variable: Tobin's Q

ix
C. SPSS Output for Model 2 (Macro-economic Independent Variables)
Table C.1 Descriptive variables
Descriptive Statistics
Mean Std. Deviation N
Tobin's Q .000234606788542 .000026356931761 5
GDP per capita (USD) 6941.20 953.839 5
Unemployment rate 4.222000000000000 .173262806164508 5
Exchange rate 6.3040 .18188 5
Table C.2 Correlation
Correlations
Tobin's
Q
GDP
per
capita
(USD)
Unemployment
rate
Pearson
Correlation
Tobin's Q 1.000 .765 -.509
GDP per capita (USD) .765 1.000 -.812
Unemployment rate -.509 -.812 1.000
Exchange rate .330 -.194 .315
Sig. (1-
tailed)
Tobin's Q . .066 .190
GDP per capita (USD) .066 . .047
Unemployment rate .190 .047 .
Exchange rate .294 .377 .303
N Tobin's Q 5 5 5
GDP per capita (USD) 5 5 5
Unemployment rate 5 5 5
Exchange rate 5 5 5
Table C.3 Model Summary
Model Summaryb
Model R R Square
Adjusted R
Square
Std. Error of
the Estimate
Durbin-
Watson
1 .909a .826 .305 .0000219737
13348
3.110
a. Predictors: (Constant), Exchange rate, GDP per capita (USD),
Unemployment rate
b. Dependent Variable: Tobin's Q

x
Table C.4 Coefficient
Coefficientsa
Model
Unstandardized
Coefficients
Standardized
Coefficients
t Sig.
95.0% Confidence
Interval for B
B
Std.
Error Beta
Lower
Bound
Upper
Bound
1 (Constant) .000 .001 -.719 .603 -.008 .008
GDP per capita
(USD)
2.609E-8 .000 .944 1.313 .414 .000 .000
Unemployment
rate
1.621E-5 .000 .107 .143 .909 -.001 .001
Exchange rate 6.954E-5 .000 .480 1.086 .474 -.001 .001
a. Dependent Variable: Tobin's Q

xi
D. SPSS Output for Model 3 (Pooled Model)
Table D.1 Descriptive Statistics
Descriptive Statistics
Mean Std. Deviation N
Tobin's Q .000234606788542 .000026356931762 5
ROA .082668651252479 .015665201963840 5
ROE .245441832104097 .059120290603209 5
Altman Z 4.260242996861853 .358936095814973 5
GDP per capita (USD) 6941.20 953.839 5
Unemployment rate 4.2220 .17326 5
Exchange rate 6.3040 .18188 5
Corporate governance
index
.519880952380952 .003813706780867 5
Table D.2 Correlation
Correlations
Tobin's
Q ROA ROE
Altman
Z
GDP
per
capita
(USD)
Unemployment
rate
Exchange
rate
Corporate
Governance
Index
Pearson
Correlation
Tobin's Q 1.000 .781 .881 -.408 .765 -.509 .330 -.414
ROA .781 1.00
0
.942 -.159 .976 -.817 -.282 -.493
ROE .881 .942 1.00
0
-.463 .971 -.774 .032 -.265
Altman Z -.408 -.159 -.463 1.000 -.347 .128 -.675 -.648
GDP per capita
(USD)
.765 .976 .971 -.347 1.000 -.812 -.194 -.298
Unemployment
rate
-.509 -.817 -.774 .128 -.812 1.000 .315 .217
Exchange rate .330 -.282 .032 -.675 -.194 .315 1.000 .426
Corporate
governance
index
-.414 -.493 -.265 -.648 -.298 .217 .426 1.000
Sig. (1-
tailed)
Tobin's Q . .059 .024 .247 .066 .190 .294 .244
ROA .059 . .008 .399 .002 .046 .323 .199
ROE .024 .008 . .216 .003 .062 .480 .334

xii
Altman Z .247 .399 .216 . .283 .418 .106 .119
GDP per capita
(USD)
.066 .002 .003 .283 . .047 .377 .313
Unemployment
rate
.190 .046 .062 .418 .047 . .303 .363
Exchange rate .294 .323 .480 .106 .377 .303 . .237
Corporate
governance
index
.244 .199 .334 .119 .313 .363 .237 .
N Tobin's Q 5 5 5 5 5 5 5 5
ROA 5 5 5 5 5 5 5 5
ROE 5 5 5 5 5 5 5 5
Altman Z 5 5 5 5 5 5 5 5
GDP per capita
(USD)
5 5 5 5 5 5 5 5
Unemployment
rate
5 5 5 5 5 5 5 5
Exchange rate 5 5 5 5 5 5 5 5
Corporate
governance
index
5 5 5 5 5 5 5 5
Table D.3 Model Summary
Model Summaryb
Model R R Square
Adjusted R
Square
Std. Error of
the Estimate
Durbin-
Watson
1 .881a .776 .701 .0000144062
73056
2.312
a. Predictors: (Constant), ROE
b. Dependent Variable: Tobin's Q

xiii
Table D.4 Coefficient
Coefficientsa
Model
Unstandardized
Coefficients
Standardized
Coefficients
t Sig.
95.0%
Confidence
Interval for B
Collinearity
Statistics
B
Std.
Error Beta
Lower
Bound
Upper
Bound Tolerance VIF
1 (Constant) .000 .000 4.518 .020 .000 .000 ROE .000 .000 .881 3.223 .048 .000 .001 1.000 1.00
0
a. Dependent Variable: Tobin's Q