Tobias Streicher Hosting the Olympics or not: how ...
132
Tobias Streicher Hosting the Olympics or not: how individuals decide Dissertation for obtaining the degree of Doctor of Business and Economics (Doctor rerum politicarum - Dr. rer. pol.) at WHU – Otto Beisheim School of Management December 29, 2017 First supervisor: Prof. Dr. Sascha L. Schmidt Second supervisor: Prof. Dr. Jochen Menges
Transcript of Tobias Streicher Hosting the Olympics or not: how ...

Tobias Streicher
Hosting the Olympics or not:
how individuals decide
Dissertation
for obtaining the degree of Doctor of Business and Economics
(Doctor rerum politicarum - Dr. rer. pol.)
at WHU – Otto Beisheim School of Management
December 29, 2017
First supervisor: Prof. Dr. Sascha L. Schmidt
Second supervisor: Prof. Dr. Jochen Menges

Acknowledgements
I
Acknowledgements
The present dissertation is the result of my research as a doctoral student at the Center
for Sports and Management (CSM) at WHU – Otto Beisheim School of Management. It
would not have been possible without the support of several people and institutions I am
very grateful to:
• To my first supervisor Prof. Dr. Sascha L. Schmidt for your continuous feedback
on my research and first and foremost your unconditional trust that allowed me
to be physically at CSM while being mentally in my ivory tower for a couple of
weeks to focus on deep dives for our papers (e.g., learning Mplus/SEM) without
the need for interim status reports.
• To Prof. Dr. Jochen Menges for assuming the role of second supervisor for my
dissertation and also for enabling a chat with Prof. Don Lange at an event you
organized, which helped me to make the painful yet valuable decision to revise
my legitimacy theory research ideas.
• To Jun.-Prof. Dr. Dominik Schreyer for your valuable feedback, your drive and
your nice motivating words with respect to our research in the course of my time
at CSM. I am looking forward to continue working on publishing our papers.
• To Prof. Dr. Benno Torgler for your encouragement to continue digging into the
challenging topic of system 1 and system 2 theory, as well as your detailed and
high-quality feedback on the papers we co-authored.
• To my doctoral colleagues at WHU – Florian Bünning, Klaus Eberhard, Lukas
Einmahl, Florian Holzmayer, Mark Kassis, Sebastian Koppers, Caspar Krampe,
Felix Krause, Glenn Leihner-Guarin, Caroline Päffgen, Florian Sander, and

Acknowledgements
II
Alexandra von Bernstorff – for your support, the fun we had, and pushing me to
do real sports together instead of just research on it.
• To Camp Beckenbauer and its sponsors for financing an unusually rich data set
that I was allowed to use in my dissertation and for some thrilling insights into
the sports business.
• To Janina for being such a caring, lovely and funny person, for bringing me
closer to my hometown/my roots again and for unconditionally supporting me to
complete this dissertation and the paper revisions during our short weekends.
Last but definitely not least, I would like to thank my mother, my father, my step-father,
and my grandparents. You supported me all the way and allowed to me to join WHU
back in 2007 for my Bachelor studies, which was a whole new world for me and a big
mental and financial stretch for all of you. Now that I write the last words of my
dissertation, I feel that this educational journey has come to an end. I am incredibly
grateful for what you have done for me and am happy to have you on my side.
Tobias Streicher

Table of contents
III
Overview
Table of contents ........................................................................................................... IV
List of tables .................................................................................................................. VI
List of figures ............................................................................................................... VII
List of abbreviations .................................................................................................. VIII
1 Introduction ............................................................................................................. 1
2 Paper I - Is it the economy, stupid? The role of social versus economic factors
in people’s support for hosting the Olympic Games: evidence from 12 democratic
countries ......................................................................................................................... 13
3 Paper II - Anticipated feelings and the support for public mega projects ...... 23
4 Paper III - Referenda on hosting the Olympics: What drives voter turnout?
Evidence from 12 democratic countries ...................................................................... 54
5 Conclusion ............................................................................................................. 96
6 References ............................................................................................................ 104

Table of contents
IV
Table of contents
Table of contents ........................................................................................................... IV
List of tables .................................................................................................................. VI
List of figures ............................................................................................................... VII
List of abbreviations .................................................................................................. VIII
1 Introduction ............................................................................................................. 1
1.1 Background and motivation .............................................................................. 2
1.2 Research questions and theoretical relevance ................................................... 4
1.3 Research approach and data set ........................................................................ 6
1.4 Outline and abstracts ......................................................................................... 9
2 Paper I - Is it the economy, stupid? The role of social versus economic factors
in people’s support for hosting the Olympic Games: evidence from 12 democratic
countries ......................................................................................................................... 13
2.1 Introduction ..................................................................................................... 15
2.2 Data and econometric method ........................................................................ 16
2.3 Results ............................................................................................................. 19
2.4 Conclusion ...................................................................................................... 22
3 Paper II - Anticipated feelings and the support for public mega projects ...... 23
3.1 Introduction ..................................................................................................... 25
3.2 Theory development and hypotheses .............................................................. 26
3.3 Method ............................................................................................................ 32
3.4 Results ............................................................................................................. 40
3.5 Discussion ....................................................................................................... 46

Table of contents
V
4 Paper III - Referenda on hosting the Olympics: What drives voter turnout?
Evidence from 12 democratic countries ...................................................................... 54
4.1 Introduction ..................................................................................................... 56
4.2 Referenda on mega-sport events and voter turnout ........................................ 58
4.3 Hypotheses and empirical framework ............................................................ 64
4.4 Results and discussion .................................................................................... 72
4.5 Conclusion ...................................................................................................... 81
5 Conclusion ............................................................................................................. 96
5.1 Overall summary ............................................................................................. 97
5.2 Research contribution and future directions ................................................. 100
6 References ............................................................................................................ 104

Table of contents
VI
List of tables
Table 1 - Measurement and rational for variables .................................................... 18
Table 2 - Support for hosting the Olympics (probit models) .................................... 20
Table 3 - Cross-country measurement invariance tests ............................................ 37
Table 4 - SEM results: Model fit and structural path coefficients ........................... 43
Table 5 - Factors that shape voter turnout (final model) .......................................... 73
Table of contents
VII
List of figures
Figure 1 – Comparison of average marginal effects .................................................. 21
Figure 2 - Research model ............................................................................................ 29
Figure 3 - Measurement of optimism (based on Scheier et al., 1994) adjusted for
social desirability (Rauch et al., 2007) ......................................................................... 34
Figure 4 - Full structural equation model (overall model) ........................................ 42
Figure 5 - Moderating role of effortful processing on affective forecasting ............ 45
Figure 6 - Olympic referenda model (ORM) .............................................................. 61
Figure 7 - Drivers of the turnout decision in the Olympic referenda model ........... 65
Figure 8 - Quadratic effect of support on voter turnout (pooled sample) ............... 74
Figure 9 - Quadratic effect of optimism on voter turnout (pooled sample) ............ 76

Table of contents
VIII
List of abbreviations
abs. Absolute
AIC Akaike information criterion
AT Austria
AVE Average variance extracted
BIC Bayesian information criterion
CH Switzerland
CI Confidence interval
CEO Chief executive officer
c.f. Compare (Latin)
CFA Confirmatory factor analysis
CFI Comparative fit index
CR Composite reliability
CSM Center for Sports and Management
df Degrees of freedom
e.g. For example (Latin)
ESP Spain
est. Estimated
et al. And others (Latin)
FIFA Fédération Internationale de Football
Association
FRA France
GDP in PPP Gross domestic product in purchasing
power parity
GER Germany
GRE Greece
i.e. That is (Latin)
IOC International Olympic Committee (IOC)

Table of contents
IX
IT Italy
LOT-R Life Orientation Test-Revised
LMS procedure Latent moderated structural equation
procedure
LR Likelihood ratio
McFadden’s R² McFadden’s coefficient of determination
MG-CFA Mutli-group confirmatory factor analysis
Mplus Latent variable modeling program by
Muthén & Muthén
NIMBY problem ‘Not in My Backyard’ problem
n Sample size
NOR Norway
ns Not significant
OLS regressions Ordinary least squares regressions
ORM Olympic Referenda Model
p. Page
POL Poland
Pr() Probability function
Probit model Type of regression model where the value
of the dependent variable is either zero or
one unit (probit = probability + unit)
R² Coefficient of determination
RMSEA Root mean square error of approximation
SESM conference Sport Economics & Sport Management
conference
SEM Structural equation model
SRMR Standardized root mean square residual
STATA Statistical software package by StataCorp
SWE Sweden

Table of contents
X
TV Television
UK United Kingdom
US United States
USD United States dollar
vs. Versus
WHU Wissenschaftliche Hochschule für
Unternehmensführung

Table of contents
1
1 Introduction

Introduction
Background and motivation
2
1.1 Background and motivation
Unparalleled seems an appropriate word when characterizing the Olympic Games in
today’s society. No other sports event parallels the Olympic Games in their reach of
70% of the world population via mass media (Maennig & Zimbalist, 2012c). No other
sports event has ever created estimated costs of up to USD 50 billion (Boykoff, 2014a).
And no other sports event is similarly used by leaders to demonstrate their country’s
political and economic power (Baade & Matheson, 2016). The Olympic Games have
thus a high perceived economic and social significance for our society (Maennig &
Zimbalist, 2012b).
Their economic significance, however, has been challenged. Economists have created
“bookshelves” (Schmidt, 2017, p. 119) worth of publications examining the economic
impact of the Olympics. Peer-reviewed studies, in contrast to commissioned studies,
find no or hardly any net economic impact of hosting the Olympics (Billings &
Holladay, 2012; Mitchell & Stewart, 2015; Sullivan & Leeds, 2015). Although there are
some indications for a positive social significance of the Olympics, such as increased
community spirit and strengthened sports culture (Kaplanidou & Karadakis, 2010;
Mitchell & Stewart, 2015), citizens seem to turn their back on hosting the Olympics by
voting against it in public referenda. Such referenda have recently ended six
applications to host the Olympics.1 Moreover, Boston, Budapest and Rome stopped
their ambitions to host the 2024 Olympics due to a lack of public support and calls for
referenda.
Unlike research on the economic impact of hosting the Olympics, research examining
why people reject hosting the Olympics is scarce. I attribute this scarcity to three main
1 Graubünden, Munich, and Krakow for the 2022 Olympics, Hamburg for the 2024 Olympics,
Graubünden again for the 2026 Olympics, and Vienna for 2028 Olympics.

Introduction
Background and motivation
3
reasons. First, referenda have only recently gained momentum in supporting or
hindering the hosting of the Olympics. While elected city representatives such as
mayors have formerly decided on their city’s host ambitions, citizens nowadays decide
on their own through referenda (Coates & Wicker, 2015), making Olympic referenda a
relatively new phenomenon with little lead time for research to evolve.
Second, the Olympic Games are designed as a cross-national event (International
Olympic Committee, 2016b) and the rise in referenda is a cross-national observation
(Casella & Gelman, 2008), underlining the importance to also examine the combination
of the two in a cross-national setting. Conducting cross-national research is, ceteris
paribus, more cost-intensive than focusing the research scope on single countries. It is
therefore likely that the costs associated with cross-national research pose an entry
barrier for scholars interested in examining Olympic referenda.
Third, referenda on hosting decisions are unlikely to occur in the “emotional vacuum”
(Elsbach & Barr, 1999, p. 191) of rational decision-making that is assumed in the
traditional economics literature. Hosting decisions seem to polarize supporters and
opponents of hosting the Olympics. For example, after the drop-out of Boston for the
2024 Summer Olympic Games, IOC president Thomas Bach said that he hopes that the
discussions around the next U.S. applicant city will be “a little bit more oriented on
facts than emotions” (Associated Press, 2015, p. 1). Economists interested in
deciphering Olympic referenda decisions thus need to draw on literature beyond
economics to integrate rational and non-rational decision components into their models,
which necessarily increases research complexity.
The motivation for my dissertation is to help overcoming these three challenges, thereby
extending our understanding of hosting decisions at Olympic referenda. To cope with

Introduction
Research questions and theoretical relevance
4
the novelty of Olympic referenda as a research topic and the scarce existing economic
research on the latter, I extend my literature scope beyond the Olympics (e.g., by also
looking at other mega sport event literature) within the economics field and also
integrate literature from decision science, political science and psychology. With
respect to the second challenge of cross-national research, I am grateful to have access
to a unique, population-representative data set with 12,000 participants from eleven
European countries and the United States. I use appropriate statistical measures (e.g.,
measurement invariance testing using structural equation models in the second paper) to
allow for meaningful cross-country comparisons. To address the third challenge that
purely rational models of decision making potentially fall short of Olympic referenda
decisions, I extend my analyses to non-economic factors in all papers and dedicate my
second paper to a dual process model of decision making at Olympic referenda, thereby
hoping to contribute to a recently growing body of economic research on the role of
feelings in individual decision-making (c.f. Kahneman, 2012).
Considering all of the above, I hope to contribute to answering the following
overarching question of my dissertation: how do individuals decide on their support for
hosting the Olympics at referenda and what determines their turnout at such referenda?
1.2 Research questions and theoretical relevance
To answer the question of how individuals decide on their support for hosting the
Olympics, I differentiate between the decision content and the decision process. In order
to examine what determines individuals’ turnout at such referenda, I analyze different
categories of turnout determinants derived from general turnout research. I address
these three topics with three research questions:

Introduction
Research questions and theoretical relevance
5
Question I: To what extent do economic versus social factors influence individuals’
voting behavior at referenda on hosting the Olympics?
Question II: How do the intuitive and deliberate mental systems of individuals
interact when they decide at referenda on hosting the Olympics?
Question III: What are the determinants of individuals’ voter turnout at referenda on
hosting the Olympics?
Research question I is relevant because it can on the one hand help solving a disjunction
between research and practice and on the other hand contribute to rebalancing the focus
of economics research on the Olympics. For that purpose, it is crucial to bear in mind
that economists find no or hardly any evidence of economic benefits from hosting the
Olympics (Billings & Holladay, 2012; Mitchell & Stewart, 2015; Sullivan & Leeds,
2015). Proponents of hosting the Olympics nevertheless run multi-million dollar
campaigns that primarily promise economic benefits (Mitchell & Stewart, 2015), which
have in many cases failed to establish sufficient public support for hosting the
Olympics. Schmidt (2017, p. 120) hence argues that economics research on the
Olympics has “minor or no effects on the real world”. He suggests extending the scope
of analysis to overall social welfare (Schmidt, 2017), which includes both economic and
social factors. Putting economic and social factors into direct comparison can thus be a
first step to alter the priority given to economic factors in both campaigns and research
on hosting the Olympics.
Research question II contributes to our understanding of mental processes underlying
complex decisions, in particular the decision to support or reject hosting the Olympics.
If people face complex decisions, they tend to rely on heuristics instead of
systematically evaluating the pros and contras of a decision (Slovic, Finucane, Peters, &

Introduction
Research approach and data set
6
MacGregor, 2002). Considering that the decision to host or not to host the Olympics is a
complex decision, it seems worth examining heuristics that individuals apply
consciously or subconsciously to the hosting decision, which has – to the best of my
knowledge – not yet been done for the context of Olympic referenda. Even beyond this
context, the mental process underlying complex decisions seems to be a topic worth
examining. Despite a decade-old call by leading economists (Loewenstein, Weber,
Hsee, & Welch, 2001), empirical research on the interplay of affective and deliberative
decision processes is scarce (Mikels, Maglio, Reed, & Kaplowitz, 2011). By modeling
and testing the interplay of the two in a dual process model, I thus hope to advance our
understanding of complex decision-making within and beyond the Olympics context.
Research question III is relevant because the outcome of referenda is affected by both
the decision for or against hosting the Olympics and the decision to cast a vote at the
referendum. The latter decision has received little attention in research on the Olympics,
even though it is well-known from political science that voter turnout can change the
referendum outcome (Hajnal & Trounstine, 2005; Lutz, 2007), lead to a misrepre-
sentation of minorities (Hajnal & Trounstine, 2005) and reduce the acceptance of
referendum outcomes (Franklin, 1999; Lutz, 2007). By transferring and testing findings
from political science in the Olympic hosting context, I thus intend to create an
exploratory basis for further research on turnout at Olympic referenda.
1.3 Research approach and data set
While the three outlined research questions address the same context, namely Olympic
referenda, their answers requires the use of distinct theories and statistical methods for
each of the three questions. I therefore address them in three stand-alone research
papers.

Introduction
Research approach and data set
7
For paper I, I estimate a binary probit model to analyze the predictors of the binary
decision to be in favor or not in favor of hosting the Olympics. I estimate average
marginal effects for each predictor from the two predictor categories, economic factors
and social factors, to draw conclusions about their relative importance for an
individual’s hosting decision. I use the statistics software STATA 14 for the analyses.
Literature on mega sports events and the Olympics in particular, mainly from the field
of sports economics, provides the theoretical basis for this paper.
For paper II, I employ the latent moderated structural equation (LMS) procedure
recently outlined by Sardeshmukh and Vandenberg (2016) to estimate a structural
equation model with moderated-mediation of latent variables. I chose this procedure
because it is, to the best of my knowledge, the best statistical procedure available to
model interactions between affective and deliberative decision components in the
overall decision process on hosting the Olympics. Considering that the model involves
latent psychological constructs that can have a different meaning across the twelve
counties of the study, I apply Jöreskog’s (1971) multi-group confirmatory factor
analysis (MG-CFA) and conduct stepwise tests of the three most commonly
distinguished types of measurement invariance: configural, metric, and scalar
measurement invariance (Rutkowski & Svetina, 2014; Steenkamp & Baumgartner,
1998). In contrast to the other two papers of this dissertation, I use the statistics software
Mplus due to its superior latent variable modeling capabilities.2 In addition to
economics and methodological literature, literature from psychology and decision
science serves as theoretical basis of the analyses.
2 Mplus, in contrast to STATA 14, can handle mediated-moderation of latent variables in a multi-group
model, which is needed given the 12 countries considered.

Introduction
Research approach and data set
8
For paper III, I estimate ordinary least squares (OLS) regressions with robust standard
errors to analyze the predictors of individual voter turnout. Where theory suggests non-
linear relationships for the hypotheses, I test different model specifications (linear vs.
quadratic vs. cubic) against each other. I use the statistics software STATA 14 for the
analyses. In addition to sports economics literature, I draw on general voter turnout
literature from political science as theoretical basis for this paper.
The papers use data from a population-representative online survey that was preceded
by a five-month preparation from November 2014 until March 2015. In the course of
these five months, I developed the English language questionnaire based on a literature
review and regular review sessions with Prof. Dr. Sascha L. Schmidt and Jun.-Prof. Dr.
Dominik Schreyer. These review sessions were complemented by input from Prof. Dr.
Benno Torgler, as well as feedback and pre-tests by my fellow PhD students on an
individual basis and during the formal “brown bag” research seminar series at the
Center for Sports and Management. By mid-February 2015, a fellow PhD student, who
is a native English speaker, reviewed the English questionnaire to ensure language
accuracy.
The result of this multi-stage process was a literature based, English language
questionnaire addressing the distinct variables needed for each paper. For Paper I, a set
questions on social versus economic factors and their influence on the support for
hosting the Olympics was included in the questionnaire (see Table 1 in chapter 2). For
Paper II, a question to proxy affective forecasting and several questions to reflect the
latent variables identification, optimism and effortful processing were included in the
questionnaire (see Appendix 2). And lastly, for Paper III, several questions to reflect
voter turnout and its additional influencing factors such as mobilization factors were
included in the questionnaire (see Appendix 4a and 4b).

Introduction
Outline and abstracts
9
By the end of February 2015, this English original questionnaire was handed over to the
market research company Nielsen Sports (formerly: Repucom) that commissioned the
translation/back-translation of local language versions by native speakers, programmed
the local language versions of the online survey and recruited the respondents in the
United States of America and the following 11 European countries: Austria, France,
Germany, Greece, Italy, Norway, Poland, Spain, Sweden, Switzerland and the United
Kingdom.
This country selection was based on three criteria that I developed. First, I required at
least the democracy status flawed democracy according to the Economist’s Democracy
Index to only pick countries where a referendum on the Olympics is realistic (The
Economist Intelligence Unit, 2014). Second, I decided to focus on countries that hosted
or had the ambition to host the Olympics as indicated by a host city application within
the last 20 years. Third, I prioritized the remaining European countries based on the
gross domestic product in purchasing power parity (GDP in PPP) to proxy the absolute
welfare gain or loss potential from referenda decisions on hosting the Olympics.
Between March and April 2015, a total of 14,051 respondents from the above-
mentioned countries took part in the survey. 753 respondents were excluded due to
overly rapid completion and uniform response patterns and an additional 1,298
respondents were excluded because they participated in the survey after quota targets in
terms of age, gender, country, and region were already achieved. This resulted in a
population-representative data set with 12,000 respondents in 12 countries.
1.4 Outline and abstracts
The main part of this dissertation consists of five chapters. Following the introduction in
this chapter that concludes with an abstract of all three papers, the chapters two, three

Introduction
Outline and abstracts
10
and four comprise the actual three stand-alone papers with independent introduction,
theory, analysis, discussion, and conclusion parts. The fifth chapter summarizes the
contributions of this dissertation and suggests directions for future research.
1.4.1 Paper I: Is it the economy, stupid? The role of social versus economic factors in
people’s support for hosting the Olympic Games: evidence from 12 democratic
countries
The first paper examines the relative importance of social versus economic factors for
individual decisions on hosting the Olympics. Although economists are skeptical that
hosting the Olympics has an economic effect, the results of paper I suggest that
potential economic benefits influence individual’s support for a hosting. Social factors,
however, have a stronger influence than economic factors for individual support for
hosting the Olympics. These findings have both implications for practice and research.
Practitioners involved in campaigning for the Olympics could benefit from rebalancing
the traditional focus of pro-Olympic campaigns from economic to social factors.
Researchers could continue to extend the scope of their analysis to social factors
because they have a higher relative importance for individual hosting decisions.
The paper is co-authored by Prof. Dr. Sascha L. Schmidt, Jun.-Prof. Dr. Dominik
Schreyer, and Prof. Dr. Benno Torgler. It is published in Applied Economics Letters
(Streicher, Schmidt, Schreyer, & Torgler, 2017b). Major findings are also reported in
the book chapter ‘Hosting the Olympic Games’ by Schmidt (2017).
1.4.2 Paper II: Anticipated feelings and the support for public mega projects
The second paper integrates affective forecasting and dual process theory to examine
the interplay of affective and deliberate decision components in the overall decision
process on hosting the Olympics. Paper II provides evidence for a strong role of

Introduction
Outline and abstracts
11
expected feelings in reasoning processes and underline the effect of identification as an
important context-specific antecedent of expected feelings. It further demonstrates that
the level of effortful processing moderates the impact of expected feelings on
individuals’ decisions. The findings thus contribute to the understanding how the
electorate makes decisions on public mega-projects, which is difficult to understand
from a classicist view of rational decision-making. The paper intends to provide a lens
for policy makers and researchers to better analyze past and prepare for future
referenda.
The paper is co-authored by Prof. Dr. Sascha L. Schmidt, Jun.-Prof. Dr. Dominik
Schreyer, and Prof. Dr. Benno Torgler. An earlier version of the paper has been
accepted for presentation at the Sport Economics & Sport Management (SESM)
conference 2017 in Berlin. The paper has been submitted for publication in a leading
journal.
1.4.3 Paper III: Referenda on hosting the Olympics: What drives voter turnout?
Evidence from 12 democratic countries
The third paper draws on sports economics and political science literature to derive a
model, the Olympic Referenda Model (ORM), which serves as the basis for analyzing
the determinants of voter turnout at Olympic referenda. The paper’s findings point at a
crucial role of polarization of the electorate for voter turnout and at an asymmetry of the
mobilization effect of opponents’ versus supporters’ arguments. Opponents’ arguments
have a stronger influence on voter turnout than pro-hosting arguments of supporters.
From a practitioner’s perspective, the paper suggests the use of (de-)polarization
strategies for Olympic campaigns, e.g., “asymmetric demobilization” that some political
scientists believe has contributed to German Chancellor Merkel’s electoral success
(Arnold & Freier, 2016), and a professionalization of the supporters‘ communication

Introduction
Outline and abstracts
12
due to the comparative disadvantage of their arguments against the opponents‘
arguments. With respect to research, this paper is the first to integrate sports economics
and political science literature into a coherent model on turnout at Olympic referenda,
the ORM, which is subsequently tested. It can hopefully serve as a useful starting point
for further research on this topic.
While this paper benefitted greatly from feedback by Prof. Dr. Sascha L. Schmidt and
Jun.-Prof. Dr. Dominik Schreyer, it has not been co-authored in its current form. The
paper has been submitted for publication in a leading sports economics journal and is
currently in the second review round.

Paper I – Is it the economy, stupid?
13
2 Paper I - Is it the economy, stupid?
The role of social versus economic factors in people’s support
for hosting the Olympic Games: evidence from 12 democratic
countries3
3 Streicher, T., Schmidt, S. L., Schreyer, D., & Torgler, B. (2017b). Is it the economy, stupid? The role of
social versus economic factors in people’s support for hosting the Olympic Games: evidence from 12
democratic countries. Applied Economics Letters, 24(3), 170–174.

Paper I: Is it the economy, stupid?
14
Abstract
Public referenda have gained momentum as a democratic tool to legitimize public mega
projects such as hosting the Olympic Games. Interest groups in favor of hosting the
Olympics therefore try to influence voters through public campaigns that primarily
focus on economic benefits. However, recent studies find no or hardly any economic
impact of hosting the Olympics, instead providing evidence for a positive social impact.
This raises the question whether citizens consider economic or social factors when
deciding on hosting the Olympics. Based on representative survey data from 12
countries, our results suggest that economic factors can influence voting behavior,
although the influence of social factors is stronger.
Keywords: Public referenda; Campaigns; Mega sport events; Olympic Games; Hosting

Paper I: Is it the economy, stupid?
Introduction
15
2.1 Introduction
Be it the Greek referendum on bailout measures, the Scottish referendum on
independence from the UK, or upcoming referenda on the liberalization of marijuana in
several American states, referenda have gained momentum as a tool of democracy
(Casella & Gelman, 2008). Mega sport events such as the Olympic Games are not
exempt from this trend. While in the past mainly mayors and city councils have decided
on applying for hosting the Olympics, nowadays, citizens often decide on their city’s
host ambitions through public referenda (Coates & Wicker, 2015). Proponents of
hosting the Olympics react to this trend with multi-million dollar campaigns. Such
campaigns follow Bill Clinton’s famous 1992 presidential campaign mantra ‘It's the
economy, stupid’ and focus on promising economic benefits from hosting (Mitchell
& Stewart, 2015). However, public support for the Olympics seems to have diminished
in Europe and the United States, despite extensive campaigns with their promise of
economic benefits.4
This leads to the question whether citizens are receptive to the promise of economic
benefits because otherwise, campaign budgets could be better spent differently. Recent
studies indeed raise doubts about economic benefits from hosting the Olympics, finding
no or hardly any economic impact (Billings & Holladay, 2012; Mitchell & Stewart,
2015; Sullivan & Leeds, 2015). Citizens might thus put little weight on economic
factors when deciding on hosting the Olympics. Instead, they might focus on social
factors relating to the Olympics, e.g., increased community spirit and strengthened
sports culture (Kaplanidou & Karadakis, 2010; Mitchell & Stewart, 2015). Such factors
4 More recently, Boston (USA) and Hamburg (Germany) withdrew their plans to host the 2024 Summer
Olympics amid a lack of public support. For the same reason, the European cities of Graubünden,
Krakow, Munich, Oslo, and Stockholm decided not to apply for the 2022 Winter Olympics.

Paper I: Is it the economy, stupid?
Data and econometric method
16
could influence citizens because they contribute to an individual’s welfare, which goes
beyond material aspects captured by measures of economic activity (Frey & Stutzer,
2010).
In this study we therefore explore whether economic or social factors are key in
determining citizens’ voting behavior. Our results suggest that potential economic
benefits influence voting behavior, even though economists are skeptical that they
occur. However, the influence of social factors is stronger. Interest groups in favor of
hosting the Olympics could therefore benefit from shifting the focus of their campaigns
from economic to social factors.
2.2 Data and econometric method
We collected data between March and April 2015 via a representative online survey in
12 countries: Austria, France, Germany, Greece, Italy, Norway, Poland, Spain, Sweden,
Switzerland, the United Kingdom, and the United States.5 The market research
company Repucom hosted the survey. A total of 14,051 participants completed the
questionnaire, of which Repucom excluded 753 participants due to quality checks and
1,298 further participants that completed the questionnaire after quota targets in terms
of age, gender, country, and region were already fulfilled, providing a representative
data set with 12,000 valid responses (1,000 per country).
5 The countries were selected based on four criteria: 1) location in Europe or the USA, 2) democratic
system according to the Democracy Index 2013 by The Economist Intelligence Unit (2014), 3) prior
hosting aspiration as documented by an application for or hosting of the Olympics since 1994, and 4)
gross domestic product in purchasing power parity in US Dollars for 2015.

Paper I: Is it the economy, stupid?
Data and econometric method
17
Using this data set, we estimate binary probit models to analyze the influence of social
and economic factors on the support for hosting the Olympics (SUPPORT). Our full
model specification is as follows:
Pr�SUPPORT = 1� = Φ �β� + β�TAX + β�TRANSP + β�SHARE
+ β�ECONIMP + β�INFRA + β�COMM
+β REPU + β!SPOC + β"# CONTROLS)
where SUPPORT, our dependent variable, is based on survey participants’ responses to
the statement ‘I am in support of hosting the Olympic Games in [country]’. The
responses were initially recorded on a 5-point Likert scale and then recoded to account
for the binary nature of public referenda (see Table 1).
The independent variables include five variables on economic factors and three
variables on social factors that reflect responses on a 5-point Likert scale to the
statement ‘Personally, it is important to me that…’. In addition, a number of control
variables, CONTROLS, were included. Table 1 on the next page describes all variables
and explains the rational for considering them.

Paper I: Is it the economy, stupid?
Data and econometric method
18
Table 1 - Measurement and rational for variables
Variables Description and response format Rational for including variable
Dependent variable
SUPPORT ‘I am in support of hosting the Olympic Games in
[country].’
(1 ‘strongly agree’ or ‘agree’, 0 ‘strongly
disagree’, ‘disagree’ or ‘neither/nor’)
• Support of the population is a major requirement for hosting the Olympics (Coates & Wicker, 2015)
Independent variables ‘Personally, it is important to me that…’
(1 ‘strongly disagree’, 2 ‘disagree’, 3 ‘neither/nor’,
4 ‘agree’, 5 ‘strongly agree’)
Economic factors
TAX ‘…no extra costs to the taxpayers are incurred by
hosting the Olympic Games in [country].’ • Citizens are potentially taxed to pay off public debt
created by mega sport events (Essex & Chalkley,
1998)
TRANSP ‘…there is transparency in the total expenditure
and the intended purpose of the funds that will be
spent relating to the Olympic Games in [country].’
• Lack of transparency is considered to lead to
exuberance associated with hosting the Olympics
(Mitchell & Stewart, 2015)
SHARE ‘…revenue and expenditure relating to the
Olympic Games will be distributed fairly among the public sector and the sport federations.’
• Despite high expenditures for hosting the Olympics, host cities’ share in broadcasting revenues has fallen
in favour of the IOC over the last 60 years (Maennig
& Zimbalist, 2012a), potentially raising concerns
about distributional fairness
ECONIMP ‘…the [country] population benefits permanently
from economic impulses, which result from
hosting the Olympic Games.’
• Interest groups for hosting mega sport events usually
promise economic benefits from hosting (Mitchell
& Stewart, 2015)
INFRA ‘...a sustainable concept for the subsequent use of
the infrastructure created for the Olympic Games
exists.’
• Sport mega events require large investments in
infrastructure but can foster urban development
(Malfas, Houlihan, & Theodoraki, 2004)
Social factors
COMM ‘…the sense of community in [country] will be
strengthened by hosting the Olympic Games.’ • Increase in community spirit can be a legacy of the
Olympics (Kaplanidou & Karadakis, 2010)
REPU ‘…the [country]'s international reputation will be
strengthened by hosting the Olympic Games.’ • Mega events like the Olympics are used to promote a
country’s reputation (Lamla, Straub, & Girsberger,
2014)
SPOC ‘…the sports culture in [country] will be
strengthened by hosting the Olympic Games.’ • Positive impact on sports culture is a frequent
argument for hosting the Olympics (Mitchell
& Stewart, 2015)
Control factors (AGE in years, GENDER dummy (male = 1), HHINCOME dummies for low and high household net income groups, POLVIEW
dummies for the political view, and COUNTRY dummies for the country of residence of respondents)
Paper I: Is it the economy, stupid?
Results
19
2.3 Results
To examine the effect of economic and social variables on the support for hosting the
Olympics, three binary probit models have been estimated: (1) an economic factors
model, (2) a social factors model, and (3) an overall model that includes both economic
and social factors (see Table 2).
The results in column (1) indicate that economic factors have a significant impact on
citizens’ support for hosting the Olympics. Thus, the potential economic impact of
hosting the Olympics plays a role when people decide on hosting the Olympics, despite
economists’ skepticism of such impact.
Apart from economic factors, the results in column (2) show that social factors also
have a significant impact on the support for hosting the Olympics. The evaluation
criteria at the bottom of Table 2 indicate a better fit of the social factors model as
compared to the economic factors model, offering a first indication that social factors
could be more important than economic factors in influencing the support for hosting
the Olympics.
The overall model in column (3) reveals that considering both economic and social
factors further improves model fit. For example, both the difference in the BIC’
statistics for the economic or the social versus the overall model provide ‘very strong’
evidence (Raftery, 1995, p. 139) to prefer the overall model over the two other models.
When examining the citizens' support for hosting the Olympics, it is therefore beneficial
to consider both economic and social factors.

Paper I: Is it the economy, stupid?
Results
20
Table 2 - Support for hosting the Olympics (probit models)
(1) (2) (3)
Independent variables
dd
d
Economic
factors model
dd
d
Social
factors model
dd
d
Overall
model
Coefficient (est.) Coefficient (est.) Coefficient (est.) Average marginal effects
for a change by one unit
Economic factors
TAX -0.138 ***
-0.112 *** -0.029 ***
(11.400) (8.353) (8.419)
TRANSP -0.063 *** -0.077 *** -0.020 ***
(4.192) (4.575) (4.586)
SHARE 0.241 *** 0.116 *** 0.030 ***
(16.865) (7.149) (7.192)
ECONIMP 0.395 *** 0.154 *** 0.040 ***
(26.679) (8.966) (9.049)
INFRA 0.191 *** 0.066*** 0.017 ***
(12.325) (3.719) (3.726)
Social factors
COMM 0.336 *** 0.302 *** 0.079 ***
(19.508) (16.978) (17.564)
REPU 0.371 *** 0.333 *** 0.087 ***
(20.344) (17.727) (18.380)
SPOC 0.377 *** 0.336 *** 0.088 ***
(20.815) (18.119) (18.819)
Control factors
AGE -0.006 *** -0.007 *** -0.007 ***
(6.417) (7.063) (6.745)
GENDER 0.114 *** 0.116 *** 0.110 ***
(4.514) (4.260) (3.987)
HHINCOME YES YES YES
POLVIEW YES YES YES
COUNTRY YES YES YES
Evaluation criteria
McFadden’s R² 0.191 0.314 0.331
Observations
correctly
classified
71.4% 77.7% 78.4%
LR chi-squared 3179.398 5284.104 5503.990
BIC’ -2916.404 -5039.895 -5212.817
Notes: *** represents statistical significance at the 1% (p < .01) level. Absolute z-statistics are displayed in parentheses under the coefficient estimates.

Paper I: Is it the economy, stupid?
Results
21
While both economic and social factors are statistically significant, the magnitude of
their effects is difficult to interpret. In order to ease interpretation, average marginal
effects on the probability to support hosting the Olympics for a one unit change in the
independent variables are reported for the overall model. For example, increasing the
importance of avoiding costs to the taxpayers (TAX) by one unit while holding other
variables constant, decreases, on average, the probability of being in support of hosting
the Olympics by 2.9%.
Comparing average marginal effects in Table 2 reveals consistently higher average
marginal effects for social than for economic variables. FIGURE 1 illustrates this
finding. Based on the responses of our survey respondents, we therefore conclude that
social factors have a stronger impact on citizens’ support of hosting the Olympics than
economic factors.
Figure 1 – Comparison of average marginal effects

Paper I: Is it the economy, stupid?
Conclusion
22
2.4 Conclusion
Using survey data from 12,000 respondents across 12 countries, our results suggest that
the potential economic impact of hosting the Olympics influences people’s support. It
therefore makes sense that pro-Olympics groups neglect the doubts of economists and
frequently promise economic benefits to voters.
However, the empirical results indicate that social factors play a more important role
than economic factors for people’s support for hosting the Olympics. Interest groups in
favor of hosting the Olympics could therefore benefit from rebalancing the focus of
their campaigns from economic to social factors.

Paper II – Anticipated feelings and the support for public mega projects
23
3 Paper II -
Anticipated feelings and the
support for public mega projects6
6 Streicher, T., Schmidt, S. L., Schreyer, D., & Torgler, B. (2017a). Anticipated feelings and the support
for public mega projects. Unpublished working paper.
Paper II – Anticipated feelings and the support for public mega projects
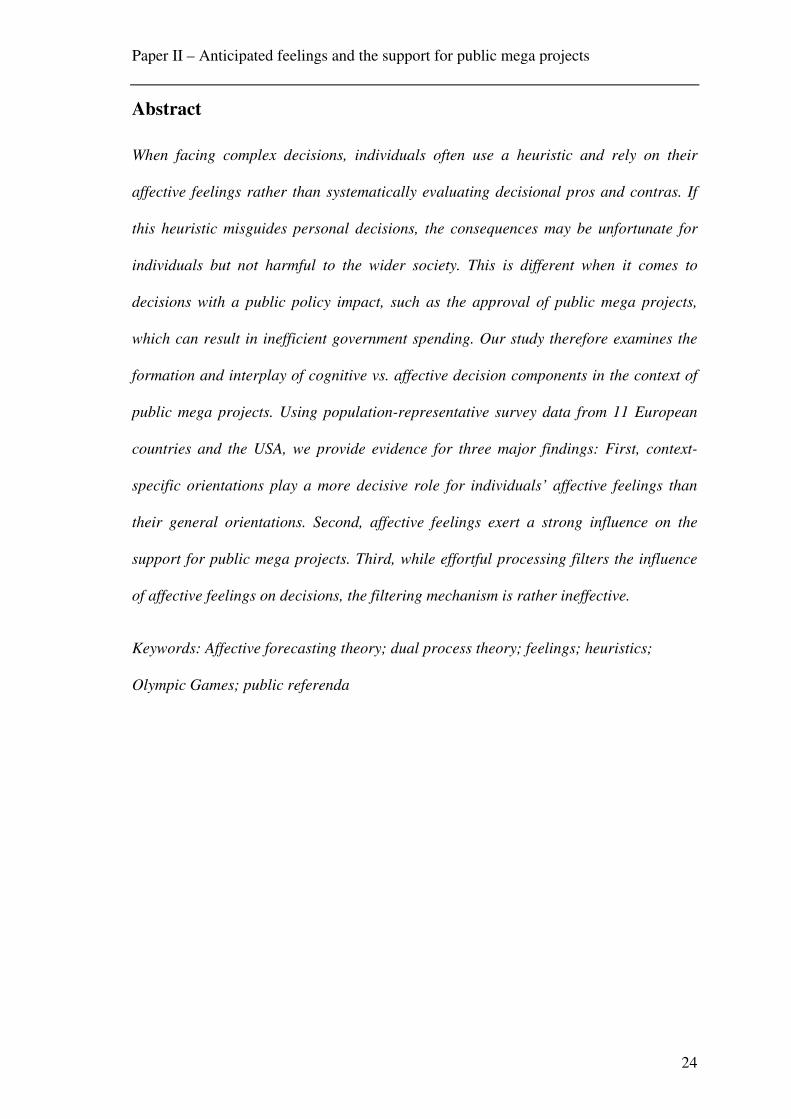
24
Abstract
When facing complex decisions, individuals often use a heuristic and rely on their
affective feelings rather than systematically evaluating decisional pros and contras. If
this heuristic misguides personal decisions, the consequences may be unfortunate for
individuals but not harmful to the wider society. This is different when it comes to
decisions with a public policy impact, such as the approval of public mega projects,
which can result in inefficient government spending. Our study therefore examines the
formation and interplay of cognitive vs. affective decision components in the context of
public mega projects. Using population-representative survey data from 11 European
countries and the USA, we provide evidence for three major findings: First, context-
specific orientations play a more decisive role for individuals’ affective feelings than
their general orientations. Second, affective feelings exert a strong influence on the
support for public mega projects. Third, while effortful processing filters the influence
of affective feelings on decisions, the filtering mechanism is rather ineffective.
Keywords: Affective forecasting theory; dual process theory; feelings; heuristics;
Olympic Games; public referenda

Paper II – Anticipated feelings and the support for public mega projects
Introduction
25
3.1 Introduction
A political brain is an emotional brain. It is not a dispassionate calculating machine,
objectively searching for the right facts, figures, and policies to make a reasoned decision.
Drew Westen (2008, p. 15)
Both the recent presidential election in the United States and the Brexit referendum in
the United Kingdom confronted voters with highly complex decisions whose potential
consequences for immigration, trade, and foreign policy fell well outside the general
citizenry’s area of expertise. When facing such complex decisions, voters tend to find it
easier and more efficient to rely on affect rather than systematically evaluating the
decisional pros and contras (Slovic et al., 2002) or trusted representatives (Stadelmann
& Torgler, 2013). This mental shortcut, known as the affect heuristic (c.f. Kahneman,
2003), implies that decisions, rather than occurring in the “emotional vacuum” (Elsbach
& Barr, 1999, p. 191) implicitly assumed in the traditional decision-making literature,
are in fact impacted by feelings. Yet despite numerous studies supporting this view (c.f.
Isen, Shalker, Clark, & Karp, 1978; Johnson & Tversky, 1983; Loewenstein, 2000;
Wright & Bower, 1992), it has been largely neglected in the extant literature until a
recent re-emphasis in a growing body of economic research on the role of feelings in
individual decision-making (c.f. Kahneman, 2012).
One prominent stream in this latter is affective forecasting research, which takes into
account the expected feelings associated with a decision (Wilson & Gilbert, 2003). This
paradigm postulates that as individuals face a range of decisions at varying intervals
during the day – from eating out or staying home to buying a new car or booking a
beach vacation to major life choices like remaining in a marriage – these decisions will
be shaped by their own predictions of how different options will make them feel (Dunn
& Laham, 2006).

Paper II – Anticipated feelings and the support for public mega projects
Theory development and hypotheses
26
When this use of affect results in misguided personal decisions, the results may be
unfortunate for the individual but not necessarily harmful to the wider society. When it
influences public policy decisions, however, such as the approval for public mega-
projects, it may result in not only inefficient government spending but even the loss of
lives (Sunstein, 2000). Yet despite a decade-old call by leading behavioral economists
for further research on the formation of cognitive versus affective judgments
(Loewenstein et al., 2001), there are still few empirically tested models that explain the
interplay between the two. This important research area thus remains seriously
understudied (Mikels et al., 2011, p. 751).
We aim to narrow this gap in behavioral economics research in three ways: by
examining whether and to what extent affective forecasting influences decision-making
on public mega-projects, by identifying the antecedents of affective forecasting in this
context, and by assessing the extent to which cognitive judgment components regulate
the impact of individual feelings on personal decisions. To achieve these goals, we
employ the type of cross-country research setting recognized as an important condition
for establishing generalizability. More specifically, we use a unique representative data
set of 12,000 respondents from 11 European countries and the USA, whose diverse
origins and backgrounds raise the key concern of equivalent cross-country
comprehension and measurement of research constructs (Rutkowski & Svetina, 2014).
To address this concern, we apply advanced invariance measurement methods to a
common type of public mega-project, one recently proposed in all 12 participating
nations, the hosting of the Olympic Games.
3.2 Theory development and hypotheses
For the conceptual foundation of our analysis in the context of public mega-projects, we
draw on two theoretical paradigms: dual processing and affective forecasting.

Paper II – Anticipated feelings and the support for public mega projects
Theory development and hypotheses
27
3.2.1 Dual process theory
For decades, models postulating two distinct human cognitive processing systems have
generated considerable interest in social, cognitive, and neuropsychology, as well as in
related fields (Achtziger & Alós-Ferrer, 2013; Brocas & Carrillo, 2014; Kahneman,
2003, 2012; Smith & DeCoster, 2000; see, e.g., Strack & Deutsch, 2004). Although
researchers use different names for these two systems – here denoted as intuitive versus
deliberate – they largely agree on their characteristics. The intuitive system or system 1
typically works with little or no cognitive exertion, meaning that its operations are
automatic, impulsive, fast, and based on association. The deliberate system or system 2,
in contrast, requires cognitive effort to operate a reflective, slow, controlled, and rule-
based process. In several dual process models, a primary function of the intuitive system
is to generate both affective and non-affective feelings (Strack & Deutsch, 2004; Zajonc,
1980), which the deliberate system then checks for quality before steering them for
correction through either one or both systems. According to Kahneman and Frederick
(2002), however, such monitoring tends to be lax, leading to an unfiltered impact of the
intuitive output on many judgments, which makes them prone to error. It is therefore
important to understand this intuitive output – especially as it relates to affective feelings
– as a major source of judgment error.
3.2.2 Affective forecasting theory
Although affective forecasting theory can advance our understanding of how affective
feelings function in the context of decision-making, the affective forecasting literature
to date centers on decisions having a predominantly individual impact, such as those on
personal consumption (Ebert, Gilbert, & Wilson, 2009), marriage (Lucas, 2005) or
medical testing (Rhodes & Strain, 2008). Such personal decisions, however, have
nowhere near the importance for the wider society as decisions that influence projects in

Paper II – Anticipated feelings and the support for public mega projects
Theory development and hypotheses
28
the public domain. In the context of nuclear waste treatment site construction, for
example, Slovic, Flynn, and Layman (1991) identify a strong discrepancy between
expert risk assessments of the project and emotionally charged public opposition, which
the experts considered irrational. Thus, finding sites for socially desirable facilities is a
problem as political decision makers face local opposition due to the NIMBY (Not in
My Backyard) problem (Frey, Oberholzer-Gee, & Eichenberger, 1996). In fact,
Sunstein (2000), after summarizing several studies on other public mega projects,
argues that such misguided judgments are costly in terms of both money and lives. Yet
despite scholarly calls for research (e.g., Loewenstein et al., 2001), we are unaware of
any coherent empirical model that can explain the interplay between intuitive and
deliberate judgments in the context of public mega-projects.
3.2.3 Research model
To remedy this research deficit, we develop a dual process model (Figure 2) in which
the individual decision to support the public mega-project of hosting the Olympic
Games is based on an interplay between an intuitive and a deliberate system. More
specifically, the model assumes that the intuitive system generates an output in the form
of an affective forecast through an effortless associative link between two types of
orientations, one context specific and the other general.

Paper II – Anticipated feelings and the support for public mega projects
Theory development and hypotheses
29
Figure 2 - Research model
As the context-specific orientation, we choose social identity theory (see for example
Ashforth, Harrison, & Corley, 2008) for its ability to describe the relations between
individuals’ self-definitions and social groups and events. From this perspective, the
more closely individuals associate themselves with something, the more likely they are
to evaluate it positively (Gilovich, Kumar, & Jampol, 2015), leading Hekman,
Steensma, Bigley, and Hereford (2009, p. 1327) to point to identifications with
“orienting effects” that shape evaluations (p. 1327). This latter is echoed by Conroy,
Becker, and Menges (2017), who argue that identification influences the evaluation of
affective events. We hypothesize that this relation also holds for forward-looking
evaluations in the form of affective forecasts:
H1: Identification has a direct positive effect on affective forecasting.
General
orientation
(Optimism)
Affective
ForecastSupport
Context-specific
orientation
(Identification)
H5 +
H3 +
H1 +
H2 +
H6 -
Effortful processing
Intuitive system Deliberate system
H7a +
Education
Social
dissonance
H7b +
H4 +

Paper II – Anticipated feelings and the support for public mega projects
Theory development and hypotheses
30
Beyond the context-specific orientation, psychologists have long argued that individuals
adhere to general orientations, with one of the most prominent being an individual’s life
orientation, often encapsulated as optimism (Scheier & Carver, 1985). This general
tendency to expect a favorable outcome (Scheier & Carver, 1985) potentially influences
individual evaluations of future affective events. Thus, Lam, Buehler, McFarland, Ross,
and Cheung (2005) argue that differences in affective forecasts, particularly between
individuals from different cultural backgrounds, may simply reflect differences in
optimism, as reflected by our second hypothesis:
H2: Optimism has a direct positive effect on affective forecasting.
One interesting question related to the above hypotheses is whether context-specific and
general orientations only exert influence on individuals’ affective forecasts or whether
they also directly influence their decisions. For instance, Hekman et al. (2009) argue
that identification as a context-specific orientation not only impacts a pure evaluation of
an event but also guides related actions. Other authors (see for example Conroy et al.,
2017, who use identification as a moderator) postulate a rather indirect role for context-
specific and general orientations. We therefore formulate a third hypothesis to test for a
direct influence of identification and optimism, representing a context-specific and
general orientation, respectively:
H3: Identification has a direct positive effect on support for hosting the
Olympics.
H4: Optimism has a direct positive effect on support for hosting the
Olympics.
Admittedly, the above hypotheses, although able to shed light on the antecedents of
affective forecasting, cannot identify its impact on public support for hosting the

Paper II – Anticipated feelings and the support for public mega projects
Theory development and hypotheses
31
Olympic Games (the mega-project under study). Nonetheless, recent studies provide
clear evidence that affective forecasting does shape human decisions in general (Dunn
& Laham, 2006), particularly those about future events (Ebert et al., 2009). Hence,
drawing on these studies, we hypothesize that a positive affective forecast – that is, the
expectation of a hedonic benefit – has a positive effect on the decision to support the
project:
H5: Affective forecasting has a direct positive effect on support for hosting
the Olympics.
In answer to Loewenstein et al.‘s (2001) call for research, a major point of interest in
our study is the interplay between the intuitive and deliberate cognitive systems,
particularly how the latter regulates the impact of the affective forecast produced by the
former. Despite Kahneman and Frederick’s (2002) claim of lax regulation (i.e., little
effortful processing), other studies suggest that effortful processing, triggered by the
information’s relevance for the individual, can reduce the decisional impact of the
affective judgment components (Elsbach & Barr, 1999; Forgas, 1989). To test for this
moderating role of effortful processing, we formulate the following hypothesis:
H6: Effortful processing reduces the impact of affective forecasting on
support for hosting the Olympics.
If effortful processing can indeed induce corrective action on affective forecasting’s
impact, it would be worth understanding what influences the processing effectiveness.
Among the several influencing factors discussed in the literature, the most frequently
referenced are the ability to engage in extensive thought and exposure to statistical rule-
based thinking (for a brief overview of influencing factors, see Kahneman, 2003, p.
711). Although presumably not perfectly correlated, we conjecture that education

Paper II – Anticipated feelings and the support for public mega projects
Method
32
should support the aforementioned ability and exposure, as expressed in the following
hypothesis:
H7a: Education strengthens the negative relation between effortful
processing and the impact of affective forecasting.
Because in our model, affective forecasting as a decision component is sensitive to
social influence (Dane & George, 2014), we are also able to test the research claim that
individual social contexts can greatly influence economic decisions (Mailath &
Postlewaite, 2016). Given that humans strive for consistency through the deliberate
cognitive system (Gawronski & Strack, 2004), we expect them to engage in less
effective corrective actions through effortful processing when their affective forecast
corresponds to their social environment. Conversely, we expect dissonance between
individuals’ affective forecasts and their environments to alert and motivate them to
more effective corrective actions through effortful processing. We express this
expectation in an additional moderation hypothesis:
H7b: Social dissonance strengthens the negative relation between effortful
processing and the impact of affective forecasting.
3.3 Method
3.3.1 Data collection
We collected our data through a representative online survey carried out between March
and April 2015 in 12 countries: Austria, France, Germany, Greece, Italy, Norway,
Poland, Spain, Sweden, Switzerland, the United Kingdom, and the United States. Four
criteria determined our country selection: (i) location in Europe or the U.S., (ii)
definition as a democracy based on the Democracy Index 2013 (The Economist
Intelligence Unit, 2014), (iii) recent aspirations to host the Olympic Games, and (iv) a

Paper II – Anticipated feelings and the support for public mega projects
Method
33
gross domestic product at purchasing power parity (see also Appendix 1). The English
language questionnaire was translated and then back-translated into the respective
languages of the selected countries by native speakers from the market research
company Nielsen Sports,7 which also programmed local language versions of the online
survey and recruited respondents in all countries. In total, 14,051 participants completed
the questionnaire. Nielsen Sports excluded 753 participants because of uniform
response styles and unreasonably rapid completion and dropped 1,298 more participants
who completed the survey after representative quota targets for age, gender, country,
and region had already been met. The resulting population-representative data set
includes 12,000 valid responses across all 12 countries (1,000 per country).
3.3.2 Measures
We use four reflective latent variables (IDENT for identification, OPTI for optimism,
DESI for a social desirability adjustment of OPTI and EFFORT for effortful processing)
and two single-indicator variables (AFCST for affective forecast and SUPPORT for the
support of the public mega-project) that were measured from well-established and
widely cited instruments. In the following, we describe the measurement of these
variables, as well as additional controls and moderators, followed by a confirmatory
factor analysis (CFA) in the subsequent section:
IDENT is a reflective latent variable that proxies an individual’s identification with a
hosting of the Olympics in his or her country. The survey questions for our indicators
were adapted from Mael and Ashforth’s (1992) well-established six-item identification
construct and recorded on a 5-point Likert scale. According to a preliminary
confirmatory factor analysis (CFA), there are common unobserved factors between two
7 Previously Repucom.

Paper II – Anticipated feelings and the support for public mega projects
Method
34
item pairs that focus on the extent to which individuals take the success or failure of
hosting the Olympics in their country personally.8 We account for this commonality in
our models by following Byrne’s (2012) suggestion to correlate the error terms of these
item pairs.
OPTI is also a reflective latent variable. It proxies an individual’s general optimism
based on the widely used Life Orientation Test-Revised (LOT-R) by Scheier, Carver,
and Bridges (1994) with one of the six original items excluded because of a low factor
loading in the preliminary CFA. To account for socially desirable responses (the
tendency for individuals to present themselves as rather optimistic), we employ Rauch,
Schweizer, and Moosbrugger’s adjustment (2007) of the LOT-R and include the method
factor DESI to additionally reflect the positively worded items of the original LOT-R.
DESI can thus best be described as a nested latent variable of OPTI (see Figure 3).
Figure 3 - Measurement of optimism (based on Scheier et al., 1994) adjusted for
social desirability (Rauch et al., 2007)
8 See Appendix 2 for the wording of the item pairs (1st pair: personal insult with personal embarrassment;
2nd pair: personal insult with personal compliment).
Optimism
(OPTI)
op_best ε1
op_future
op_good
ε2
ε3
op_notmyway
op_rarelycount
ε4
ε5
Method factor
for social
desirability
(DESI)

Paper II – Anticipated feelings and the support for public mega projects
Method
35
The last reflective latent variable, EFFORT, indicates a respondent’s willingness to
engage in the cognitively effortful process of considering four different types of
information sources when making a decision: classical media, modern media, the
campaigns of supporters, and the campaigns of opponents of hosting the Olympics. As
in other well-cited survey-based studies assessing respondent consideration of different
information sources (c.f. O'Reilly, 1982), we measure responses on a 5-point Likert
scale ("strongly disagree" to "fully agree"). The preliminary CFA reveals yet another
common unobserved factor for the classical/modern media item pair, 19 to account for
which we again correlate the error terms.
Our model also includes the indicator AFCST, which reflects the affective forecast of
an individual with respect to hosting the Olympics. Given that self-reported measures of
happiness are more reliable than alternative measures (Konow & Earley, 2008), we
employ Bhattacharjee and Mogilner’s (2014) measurement approach for target events
and use a 5-point Likert scale (“strongly disagree” to “fully agree”) to measure
responses to the following statement: “Hosting the Olympic Games in [country] would
make me happy.” Although individuals may make imprecise estimates of the duration
of their forecasted happiness, some recent literature (Carter & Gilovich, 2012; Wilson
& Gilbert, 2003) suggests that they are able to accurately predict the happiness valence
of a future event (i.e., whether it would make them happy or not), which is the relevant
aspect of affective forecasting for our research question.
Our dependent variable is SUPPORT, which, as in several studies on public goods
provision (Kahneman, Ritov, Jacowitz, & Grant, 1993; Streicher, Schmidt, Schreyer, &
Torgler, 2017b), we measure by applying our 5-point Likert scale (“strongly disagree”
9 An analysis of additional variables in our survey points to a general resentment toward the media.

Paper II – Anticipated feelings and the support for public mega projects
Method
36
to “fully agree”) to responses to the following statement: “I am in support of hosting the
Olympic Games in [country].”
In addition to the above indicators, we include two variables that test for a moderating
effect on the relation between AFCST and EFFORT. The first, EDU, is a categorical
variable measuring each respondent’s highest level of formal education from one (low)
to three (high). The second variable, SDIS, measures social dissonance as the absolute
value of the difference between respondents’ own individual support for hosting the
Olympics and their expectations that friends and acquaintances will do the same. Lastly,
we include several control variables to account for possible associations between
AFCST or SUPPORT and age, gender, household net income, and political views.
3.3.3 Invariance of measures across countries
Although cross-country research is an important component in establishing
generalizability, a key concern when using surveys is “measurement invariance,” the
equivalent comprehension and measurement of constructs across countries.10 For
example, without proof of measurement invariance, it is unclear whether differences in
scale means stem from biases in how participants from different countries respond to
the scale items or from actual differences in the underlying constructs (Steenkamp
& Baumgartner, 1998). In our analysis, we avoid the pitfall of “comparing apples and
oranges” (Jilke, Meuleman, & van de Walle, 2015, p. 37) by applying Jöreskog’s (1971)
technique of multi-group confirmatory factor analysis (MG-CFA), which predominates
in cross-country research (Jilke et al., 2015). More specifically, we conduct a stepwise,
hierarchically ordered test of three commonly differentiated forms of measurement
invariance: configural, metric, and scalar (Rutkowski & Svetina, 2014; Steenkamp &
10 See Rutkowski and Svetina (2014) and Vieider et al. (2016) for measurement invariance considerations
in large-scale survey administration.

Paper II – Anticipated feelings and the support for public mega projects
Method
37
Baumgartner, 1998). The results are summarized in Table 3 and will be explained in the
following.
Table 3 - Cross-country measurement invariance tests
(1) (2) (3) (4) (5)
Configural
invariance
model
Full metric
invariance
model
Partial metric
invariance
model
Full scalar
invariance
model
Partial scalar
invariance
model
Fit
χ² 2144.708 3038.130 2905.321 5561.257 3561.521 df 948 1135 1133 1254 1228 χ²/df 2.262 2.677 2.564 4.435 2.900 RMSEA 0.036 0.041 0.040 0.059 0.044 CFI 0.980 0.969 0.971 0.929 0.962
SRMR 0.033 0.056 0.055 0.064 0.057 Measurement
invariance test
Model comparison - (2) vs. (1) (3) vs. (1) (4) vs. (3) (5) vs. (3) Δ CFI - 0.011 0.009 0.042 0.009 Decision Model Model rejected Model accepted Model rejected Model accepted
Freely estimated
loadings/intercepts
Identification
(IDEN)
id_insult all/all -/all -/all -/- -/POL, USA id_interest all/all -/all -/all -/- -/NOR, SWE, id_weour all/all -/all -/all -/- -/AT, IT, POL, id_success all/all -/all -/all -/- -/- id_compli all/all -/all -/all -/- -/- id_embarassm all/all -/all -/all -/- -/ESP, FRA, IT
Optimism (OPTI)
op_best all/all -/all -/all -/- -/IT op_future all/all -/all -/all -/- -/POL op_good all/all -/all -/all -/- -/ESP, NOR
op_notmyway all/all -/all UK, USA/all UK, USA/- UK, USA/UK, op_rarelycount all/all -/all -/all -/- -/GRE
Optimism
desirability
adjustment (DESI)
op_best all/all -/all -/all -/- -/IT op_future all/all -/all -/all -/- -/POL op_good all/all -/all -/all -/- -/ESP, NOR Effortful
processing
(EFFORT)
ef_classic all/all -/all -/all -/- -/CH, GRE ef_modern all/all -/all -/all -/- -/ESP ef_supporters all/all -/all -/all -/- -/POL
ef_opponents all/all -/all -/all -/- -/GRE, POL
Note: Country abbreviations: AT = Austria, CH = Switzerland, ESP = Spain, FRA = France, GER =
Germany, GRE = Greece, IT = Italy, NOR = Norway, POL = Poland, SWE = Sweden, UK = United
Kingdom and USA = United States of America.

Paper II – Anticipated feelings and the support for public mega projects
Method
38
Configural invariance refers to a condition in which factor loadings that are salient (non-
zero) or non-salient (zero or close to zero) in one country exhibit the same pattern in
another country (Steenkamp & Baumgartner, 1998). To test for configural invariance, we
first estimate separate CFA models for each country and then compute a MG-CFA model
across all countries before examining the factor loadings. Even though χ²/df values have
the reputation of being inflated in large sample sizes like ours (see for example, Barrett,
2007; Meade, Johnson, & Braddy, 2008)211, in this analysis, they are below or within the
recommended cutoff values of three to five (Kline, 2005; Wheaton, Muthén, Alwin, &
Summers, 1977), indicating that both the CFA models and the MG-CFA model are an
excellent fit for the data (see Appendix 3a). Likewise, RMSEA and SRMR are well
below the recommended cutoff values of 0.06 and 0.08, respectively, while CFI is above
the 0.95 threshold recommended by Hu and Bentler (1999). Most important, all factor
loadings are significant and exhibit the same pattern across all national samples (see
Appendix 3b), indicating configural invariance across all 12 countries.
Metric invariance requires that scale intervals be equal across all national samples so
that, for example, a one-unit change on a scale is equally meaningful for all countries
(Jilke et al., 2015). The strictest form of metric invariance, full metric invariance, is
tested by checking whether a configural invariance model with freely estimated
loadings for all national samples has a significantly better overall fit than a full metric
invariance model that constrains all factor loadings to be equal across all countries. The
estimation results (see Table 3) indicate that the full metric invariance model fits the
data well, with values for RMSEA (0.041), CFI (0.969), and SRMR (0.056) that fulfill
11 Such inflation occurs because the χ² fit statistic is calculated by multiplying the sample size minus one
by the minimum fitting function (Hu & Bentler, 1999, p. 2).

Paper II – Anticipated feelings and the support for public mega projects
Method
39
Hu and Bentler’s (1999) recommendations. Nevertheless, rather than relying only on
these individual fit statistics and accepting the model, we follow a conservative
approach and also analyze ΔCFI values as suggested in the measurement invariance
literature (Cheung & Rensvold, 2002; Meade, Johnson, & Braddy, 2008; Milfont &
Fischer, 2010). Because our ΔCFI (0.011) is slightly above the commonly
recommended cutoff value of 0.010 (Cheung & Rensvold, 2002; Milfont & Fischer,
2010), we reject the hypothesis of full metric invariance for our model.
Having rejected full variance, we then test for partial metric invariance by successively
identifying and relaxing constraints on loadings with the largest modification indices
until a model is identified whose data fit is statistically no worse than that of the
configural invariance model (Steenkamp & Baumgartner, 1998). According to this
analysis, respondents from an Anglo-American cultural background (UK and USA)
differ strongly from respondents in the other countries with respect to how their
optimism is reflected by one item from the optimism construct. We thus allow this
loading on OPTI to be freely estimated for the USA and UK in a model denoted as
partial metric invariance model (3) in Table 3. This latter produces both strong fit
statistics and a ΔCFI (0.009) below the recommended cutoff value, supporting partial
metric invariance across the 12 countries.
The final invariance type, scalar invariance, implies cross-country equivalence of the
model item intercepts and thus allows cross-country comparison of the latent variable
means (Jilke et al., 2015). The strictest form of scalar invariance, full scalar invariance, is
tested by constraining all item intercepts in a model to be the same across all countries
(full scalar invariance model (4) in Table 3) and then comparing the fit statistics to those
from a less restrictive model (partial metric invariance model (3) in Table 3). As Table 3
shows, the restricted model performs significantly worse, with a ΔCFI (0.042) well

Paper II – Anticipated feelings and the support for public mega projects
Results
40
above the recommended cutoff value of 0.010. We therefore reject the hypothesis of full
scalar invariance and move on to a test of partial scalar invariance. Here again, we follow
Steenkamp and Baumgartner (1998) by allowing about 9% (26) of the (300) intercepts to
be freely estimated across countries (partial scalar invariance model (5) in Table 3). This
model fits the data well, with RMSEA (0.044), CFI (0.962), and SRMR (0.057) values
well in line with Hu and Bentler’s (1999) suggestions. Given that ΔCFI (0.009) also falls
below the previously discussed cutoff value, we conclude partial scalar invariance across
all 12 countries.
3.3.4 Reliability and validity of measurement scales
To further validate our measurement instruments, we also conduct tests of reliability
and discriminant validity (see bottom of Appendix 3a). For the overall model, both the
average variance extracted (AVE) and the composite reliability (CR) for IDEN (0.561
and 0.883), OPTI (0.689 and 0.914), DESI (0.666 and 0.856), and EFFORT (0.504 and
0.800) are above the recommended thresholds of 0.5 (Fornell & Larcker, 1981) and 0.7
(Bagozzi & Yi, 2012), respectively. On an individual country level, with the exception
of the AVE for the latent variable EFFORT, which is slightly below 0.5 in six countries,
all AVEs and CRs are above the recommended levels, indicating that our measurement
instruments are reliable. A Fornell-Larcker test (Fornell & Larcker, 1981) then provides
additional evidence that all non-nested latent variables in our model exhibit discriminant
validity.
3.4 Results
3.4.1 Overall model fit
Using Mplus software and adapting Sardeshmukh and Vandenberg’s (2016) code on
moderated-mediation for latent variable interactions, we estimate structural equation

Paper II – Anticipated feelings and the support for public mega projects
Results
41
models for each of the 12 countries individually and then run estimations for our overall
cross-country model. Because many traditional model fit indices are not valid for latent
variable interaction models and thus not reported by the statistical software, we assess
the fit of the overall model using the two-step procedure suggested by Sardeshmukh and
Vandenberg (2016). Specifically, we first estimate baseline models that do not involve
latent variable interactions, allowing us to check traditional goodness-of-fit indices, and
then estimate models that do include latent variable interactions, which we compare
with the corresponding baseline models using the Akaike Information Criterion (AIC).
As Figure 4 and Table 4 show, our models fit the data very well both for each individual
country and across all countries in the overall model. For example, the baseline versus
interaction fit statistics for the overall model (χ²/df = 2.617, RMSEA = 0.040, CFI =
0.952, and SRMR = 0.048) fulfill currently recommended thresholds and cutoff values.
Of particular interest, the baseline versus interaction comparison of AIC values in this
model (AIC baseline model = 513157.744 vs. AIC interaction model = 513009.384)
reveals that including latent interactions significantly reduces information loss, making
the latent variable interaction model superior to the baseline model. In fact, this
superiority holds in 10 out of the 12 individual countries, applying to all except Italy
and Greece. Even for these two countries, the AIC differences are relatively small,
especially given that AIC punishes for model complexity, which is naturally higher in
the latent interaction model than in the baseline model. We therefore feel confident in
continuing to include these two countries in our latent interaction models while being
cautious in interpreting latent variable interactions for them on an individual country
level.

Paper II – Anticipated feelings and the support for public mega projects
Results
42
Figure 4 - Full structural equation model (overall model)
Note: *** p < 0.001, ** p < 0.01, * p < 0.05, ns= not significant. Based on pooled sample across all countries.
General
orientation
(Optimism)
Affective
ForecastSupport
Context-specific
orientation
(Identification)
Effortful processing
Intuitive system Deliberate system
Education
Social
dissonance
0.839*** (H1)
0.063*** (H2)
0.303*** (H3)
0.066*** (H4)
0.535***
(H5)
-0.133***
(H6)
-0.013ns (H7b)
-0.033ns (H7a)
Fit statistics:
$² (2520) = 6595.550; p < 0.01
$²/df = 2.617
RMSEA = 0.040
CFI = 0.952
SRMR = 0.048
n = 12,000

Paper II – Anticipated feelings and the support for public mega projects
Results
43
Table 4 - SEM results: Model fit and structural path coefficients
(1) (2) (3) (4) (5) (6) (7) (8) (9) (10) (11) (12) (13)
AT
CH ESP FRA GER GRE IT
NOR
POL
SWE
UK
USA
Overall1
Fit of baseline model
χ² 526.628 517.488 515.386 492.867 608.210 429.477 493.552 454.939 576.553 663.051 608.774 700.389 6595.550
df 210 210 210 210 210 210 210 210 210 210 210 210 2520
χ²/df 2.508 2.464 2.454 2.347 2.896 2.045 2.350 2.166 2.745 3.157 2.899 3.335 2.617
RMSEA 0.039 0.038 0.038 0.037 0.044 0.032 0.037 0.034 0.042 0.046 0.044 0.048 0.040
CFI 0.952 0.951 0.958 0.958 0.938 0.968 0.966 0.964 0.939 0.928 0.954 0.939 0.952
SRMR 0.045 0.043 0.049 0.044 0.048 0.037 0.048 0.044 0.047 0.058 0.050 0.061 0.048
Fit comparison between baseline and latent
interaction model
AIC baseline model 43311.572 43350.838 41938.204 43339.044 42026.700 44291.710 40299.047 39928.188 42744.601 42592.956 40226.967 40535.388 513157.74
4 AIC interaction model 43307.864 43338.546 41894.352 43336.622 42016.933 44313.855 40307.336 39926.564 42738.736 42578.957 40192.820 40497.867 513009.38
4 Superiority of interaction model
(AICbaseline > AICinteraction) ✓ ✓ ✓ ✓ ✓ - - ✓ ✓ ✓ ✓ ✓ ✓
Structural path coefficients of latent
interaction model
IDENT -> AFCST (H1) 0.832*** 0.815*** 0.860*** 0.717*** 0.818*** 0.793*** 0.799*** 0.816*** 0.767*** 0.785*** 0.819*** 0.809*** 0.839***
OPTI -> AFCST (H2) 0.086* 0.047 0.108** 0.171*** 0.100** 0.082* 0.049 0.045 0.005 0.075* 0.092** 0.054† 0.063***
IDENT -> SUPPORT (H3) 0.395*** 0.353*** 0.431*** 0.258*** 0.327*** 0.297*** 0.296*** 0.333*** 0.516*** 0.257*** 0.164** 0.167** 0.303***
OPTI -> SUPPORT (H4) 0.139*** 0.071† 0.108** 0.093** 0.111** 0.111** 0.042 0.060 0.015 0.080* 0.035 0.025 0.066***
AFCST .-> SUPPORT (H5) 0.511*** 0.530*** 0.372*** 0.575*** 0.520*** 0.710*** 0.525*** 0.570*** 0.336*** 0.474*** 0.529*** 0.473*** 0.535***
AFCST/EFFORT -> SUPPORT (H6) -0.195** -0.015 -0.235** -0.143* -0.143* -0.064 -0.099** -0.152* -0.131† -0.169** -0.119* -0.069 -0.133***
EDU/AFCST/EFFORT -> SUPPORT (H7a) 0.090 -0.202* -0.097 0.071 0.051 -0.042 0.008 0.025 -0.041 0.054 -0.019 -0.049 -0.033
SDIS/AFCST/EFFORT -> SUPPORT (H7b) 0.079 -0.053 0.115 -0.003 -0.116 0.025 0.019 -0.023 0.002 -0.082 -0.187** -0.184* -0.013
Notes: Robust standard errors and chi-square statistics are estimated using the Satorra-Bentler procedure (Satorra & Bentler, 1994). Country abbreviations: AT = Austria, CH = Switzerland, ESP = Spain, FRA = France,
GER = Germany, GRE = Greece, IT = Italy, NOR = Norway, POL = Poland, SWE = Sweden, UK = United Kingdom, and USA = United States of America. ***p < .001, **p < .01, *p < .05, †p < .1.
1For the overall model (13), the AICs for both the baseline and the interaction model are based on a pooled sample (n = 12,000) across all countries because a multi-group option for LMS is not (yet) implemented in
MPlus or (to the best of our knowledge) any other statistical software.

Paper II – Anticipated feelings and the support for public mega projects
Results
44
3.4.2 Antecedents and impact of affective forecasting on support
As Table 4 further illustrates, both across all 12 of our representative country samples and
within our pooled sample, identification has a significant positive effect on affective
forecasting at the 0.1% level, providing strong support for H1. With respect to H2, we find
that optimism has a direct positive effect (significant at a minimum 10% level) in 8 out of
the 12 countries (excluding Switzerland, Italy, Norway, and Poland), indicating that
optimism’s direct positive effect is not unanimous. Nonetheless, given that the overall model
exhibits a statistically significant effect at the 0.1% level, we conclude that general
orientations like optimism may potentially impact affective forecasting but in a way that is
highly country specific. Moreover, comparing the coefficients of optimism versus
identification on affective forecasting suggests that context-specific orientations may have a
stronger impact than general orientations.
We find a similar pattern for the direct impact of context-specific and general orientations on
support (H3 and H4): both across all 12 countries and in the overall model, identification has a
statistically significant direct positive effect on support decisions at the 0.1% level. Optimism,
in contrast, has lower significance levels in 7 out of 12 countries, as well as in the overall
model. Combined with our findings for H1 and H2, these observations suggest that whereas
context-specific and general orientations can have both an indirect effect (through affective
forecasting) and a direct effect on support decisions; in the context of public mega-projects,
context-specific orientations seemingly play a more decisive role in shaping support decisions.
Lastly, in addition to our hypotheses on the impact of affective forecasting’s antecedents, we
also conjecture that affective forecasting itself has a direct positive influence on support
decisions (H5). The supportive evidence for this hypothesis is strong: both across all
countries and in the overall model, affective forecasting has a statistically significant direct
effect on support at the 0.1% level.
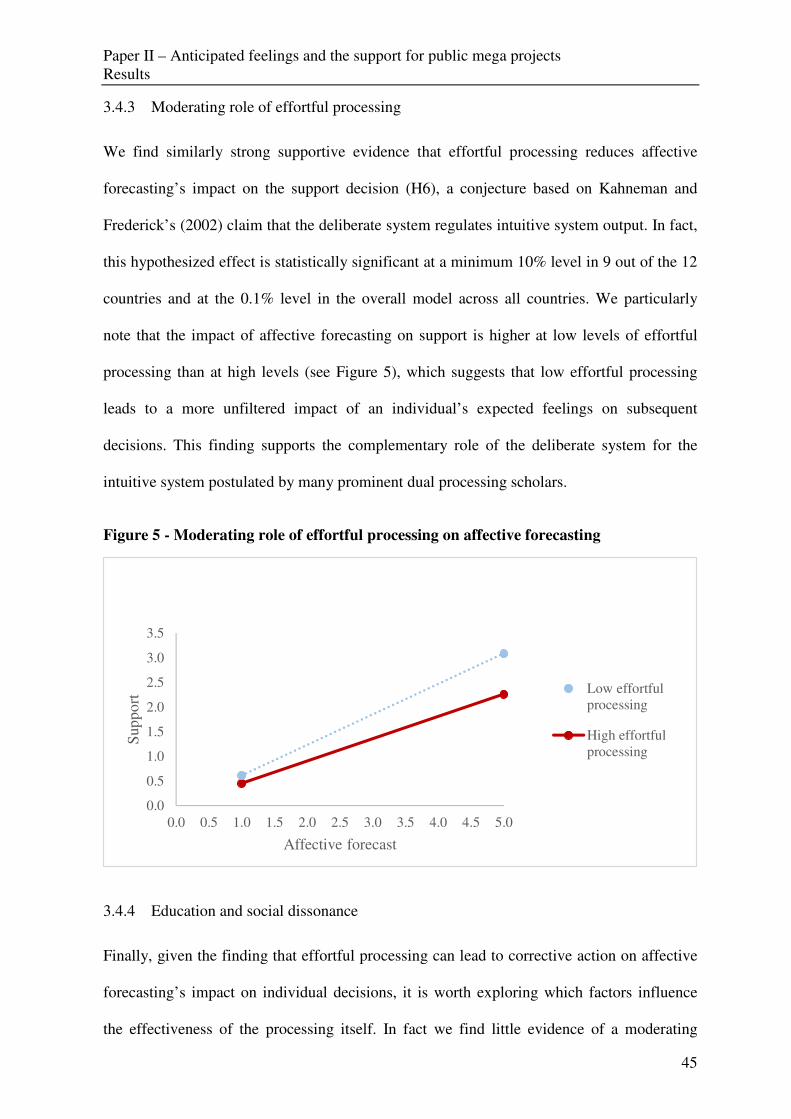
Paper II – Anticipated feelings and the support for public mega projects
Results
45
3.4.3 Moderating role of effortful processing
We find similarly strong supportive evidence that effortful processing reduces affective
forecasting’s impact on the support decision (H6), a conjecture based on Kahneman and
Frederick’s (2002) claim that the deliberate system regulates intuitive system output. In fact,
this hypothesized effect is statistically significant at a minimum 10% level in 9 out of the 12
countries and at the 0.1% level in the overall model across all countries. We particularly
note that the impact of affective forecasting on support is higher at low levels of effortful
processing than at high levels (see Figure 5), which suggests that low effortful processing
leads to a more unfiltered impact of an individual’s expected feelings on subsequent
decisions. This finding supports the complementary role of the deliberate system for the
intuitive system postulated by many prominent dual processing scholars.
Figure 5 - Moderating role of effortful processing on affective forecasting
3.4.4 Education and social dissonance
Finally, given the finding that effortful processing can lead to corrective action on affective
forecasting’s impact on individual decisions, it is worth exploring which factors influence
the effectiveness of the processing itself. In fact we find little evidence of a moderating
0.0
0.5
1.0
1.5
2.0
2.5
3.0
3.5
0.0 0.5 1.0 1.5 2.0 2.5 3.0 3.5 4.0 4.5 5.0
Sup
po
rt
Affective forecast
Low effortful
processing
High effortful
processing

Paper II – Anticipated feelings and the support for public mega projects
Discussion
46
effect of either education (H7a) or social dissonance (H7b) on the relation between effortful
processing and the impact of affective forecasting. Only in two cases (Switzerland for
education and the UK for social dissonance) do we find a statistically significant interaction
at the 5% level. Given no corresponding significant interaction for the overall model across
all countries, we attribute these two exceptions to country-specific factors rather than
generally prevailing mental mechanisms, and thus reject both hypotheses.
3.5 Discussion
To advance the understanding of how expected feelings in the form of affective forecasts
shape individual decisions about public mega-projects, we integrate affective forecasting
and dual process theory to conceptualize expected feelings as an output of the intuitive
cognitive system, whose impact on decisions is later filtered by the deliberate cognitive
system. By applying this framework to data from a large-scale, representative survey across
12 countries, we provide evidence for the crucial role of expected feelings in the dual
process of human reasoning, pinpointing identification as an important context-specific
antecedent of expected feelings. We further show that the impact of expected feelings on our
decisions is moderated by the level of effortful processing. Our research model and
empirical findings thus throw light on how the general citizenry makes decisions on public
mega-projects, a phenomenon difficult to understand from a purely classicist economic view
of rational decision-making.
3.5.1 Contributions of our study
One major contribution of our study is that it broadens the traditional affective forecasting
focus on decisions that primarily impact the decision maker. These personal decisions, even
when misguided by feelings rather than shaped by effortful information processing, have
little impact for society. Such misguided choices in the context of today’s frequent public

Paper II – Anticipated feelings and the support for public mega projects
Discussion
47
referenda (Casella & Gelman, 2008), in contrast, can cost billions of dollars annually and
even risk thousands of lives (Sunstein, 2000). Hence, by extending affective forecasting
theory to the context of public mega-projects and providing novel insights into its
antecedents, we provide a lens through which both researchers and policy makers can better
analyze past decisions and prepare for upcoming referenda.
Another contribution is our integration of affective forecasting and dual processing theory to
build a novel theoretical framework in which to examine the interplay between the intuitive
and deliberate systems of human reasoning. In doing so, we address long unanswered calls
for such research by renowned scholars like Loewenstein et al. (2001) and Mikels et al.
(2011). We also address the dearth of research operationalizing the claim that in cognitive
processing, a deliberate system regulates an intuitive system (Kahneman and Frederick,
(2002). We use our theoretical models to operationalize the deliberate system’s regulatory
intervention as effortful processing that moderates the impact of expected feelings on
decisions.
As one of the largest empirical studies of decision-making (12 countries on two continents),
particularly with respect to affective forecasting and dual process theory, our analysis makes
a valuable contribution to the generalizability of past cross-country findings. We recognize
that experimental costs have forced many past studies to rely on small convenience samples.
These studies have provided the causal foundations of our research model and we are
delighted to build upon them and contribute to their generalizability.
3.5.2 Limitations and future research directions
A frequent criticism of affective forecasting research is that it studies extreme target events
that the public majority clearly perceives as either negative or positive, whereas in reality an
event may also be neutral (Christophe & Hansenne, 2016). We have therefore chosen to

Paper II – Anticipated feelings and the support for public mega projects
Discussion
48
focus on the public mega-project of hosting the Olympic Games, not only because the event
is well known across all the countries surveyed but also because it evokes a broad range of
feelings from excitement to apathy to fierce rejection. Nevertheless, we admit that hosting
the Olympics is a highly specific mega-project implying a need for future research to
replicate and extend our work to both extreme and neutral events that are less specific while
still well understood internationally.
Another limitation is our focus on happiness as the expected feeling, chosen not only
because it is among the most widely researched feelings in economics (see for example Frey
& Stutzer, 2002) but because affective forecasting theory centers on happiness forecasts. In
fact, recent studies in the related field of emotions provide evidence that different types of
emotions affect individuals’ intentions differently (Conroy et al., 2017), implying that
different expected feelings could have different impacts on decisions and the extent to which
they are regulated by the deliberate cognitive system. We consider these questions highly
promising for future research.
A related limitation is our use of a self-reported, single-item measure for affective
forecasting, which, although in line with previous research in related fields (see e.g.,
Bhattacharjee & Mogilner, 2014), is both narrowly focused and subject to possible self-
reporting bias. However, some studies do find such a measure to be reliable (Daly & Wilson,
2016; Konow & Earley, 2008), and recent work suggests that individuals can accurately
predict whether a future event will make them happy or not (Carter & Gilovich, 2012;
Wilson & Gilbert, 2003). Nonetheless, we would welcome future research that develops and
tests multi-item affective forecasting measures for use in our discipline.
Finally, our analyses reveal no statistically significant moderating effect of education or
social dissonance on the relation between effortful processing and individual decisions.

Paper II – Anticipated feelings and the support for public mega projects
Discussion
49
Given the centrality of effortful processing or, more generally, regulatory mechanisms in
dual process models (see for example Kahneman & Frederick, 2002), we hope that future
research will shed light on exactly which factors influence the effectiveness of regulatory
interventions in decision-making. To lay a foundation for such inquiry, we have eschewed
the implicit traditional assumptions of human decision-making in an “emotional vacuum”
(Elsbach & Barr, 1999, p. 191) to provide evidence that decisions impacting public policy
can rather be a “dance of affect and reason” (Slovic et al., 2002, p. 332) in which affect
dictates the rhythm.

Paper II – Anticipated feelings and the support for public mega projects
Appendix
50
Appendix 1: Country selection based on four criteria
(1) (2) (3) (4)
Country
Region Democracy index
≥ 6.01
Application for/
hosting of
Olympics since
1994
GDP2 n
United States North America 8.11 Yes 16,720,000,000,00
0
1,000
Germany Europe 8.31 Yes 3,227,000,000,000 1,000
United Kingdom Europe 8.31 Yes 2,387,000,000,000 1,000
France Europe 7.92 Yes 2,276,000,000,000 1,000
Italy Europe 7.85 Yes 1,805,000,000,000 1,000
Spain Europe 8.02 Yes 1,389,000,000,000 1,000
Poland Europe 7.12 Yes 814,000,000,000 1,000
Sweden Europe 9.73 Yes 393,800,000,000 1,000
Switzerland Europe 9.09 Yes 371,200,000,000 1,000
Austria Europe 8.48 Yes 361,000,000,000 1,000
Norway Europe 9.93 Yes 282,200,000,000 1,000
Greece Europe 7.65 Yes 267,100,000,000 1,000
Note: Countries are ordered by GDP to proxy the welfare loss potential from suboptimal decisions on public mega-
projects. 1According to The Economist Intelligence Unit (2014), a democracy index ≥ 6.0 denotes a democratic society as
compared to hybrid regimes (4.0 to 5.9) and authoritarian regimes (<4.0).
2Gross domestic product in purchasing power parity in US dollars for 2015.

Paper II – Anticipated feelings and the support for public mega projects
Appendix
51
Appendix 2: Measurement of variables
Variable
Description and response format Reference for wording and
scale choice
Endogenous variables
Support ‘I am in support of hosting the Olympic Games in [country].’
(1 ‘strongly disagree’, 2 ‘disagree’, 3 ‘neither/nor’, 4 ‘agree’, 5
‘strongly agree’)
Draws on prominent studies
on the provision of public
goods (cf. Kahneman, Ritov,
Jacowitz, and Grant, 1993)
Affective forecast ‘Hosting the Olympic Games in [country] would make me happier.’
(1 ‘strongly disagree’, 2 ‘disagree’, 3 ‘neither/nor’, 4 ‘agree’, 5
‘strongly agree’)
Draws on the measurement
approach for target events by
Bhattacharjee and Mogilner
(2014)
Exogenous variables
Identification ‘If someone criticizes [country] as host of the Olympic Games, it
would feel like a personal insult.’
‘I am very interested in other people's opinion about [country] as host
of the Olympic Games.’
‘When I talk about hosting the Olympic Games in [country] I would
rather say ‘our’ Olympic Games instead of ‘the’ Olympic Games.’
‘A successful hosting of the Olympic Games in [country] would feel
like a personal success.’
‘If someone praises [country] as host of the Olympic Games, it would
feel like a personal compliment.’
‘If a story in the media criticizes the organization of the Olympic
Games in [country], I would feel embarrassed.’
(1 ‘strongly disagree’, 2 ‘disagree’, 3 ‘neither/nor’, 4 ‘agree’, 5
‘strongly agree’)
Adapted from the well-
established six-item
identification construct by
Mael and Ashforth (1992)
Optimism ‘In uncertain times, I usually expect the best.’
‘It's easy for me to relax.’ (filler item)
‘If something can go wrong for me, it will.’
‘I'm always optimistic about my future.’
‘I enjoy my friends a lot.’ (filler item)
‘It's important for me to keep busy.’ (filler item)
‘I hardly ever expect things to go my way.’
‘I don't get upset too easily.’ (filler item)
‘I rarely count on good things happening to me.’
‘Overall, I expect more good things to happen to me than bad.’
(1 ‘strongly disagree’, 2 ‘disagree’, 3 ‘neither/nor’, 4 ‘agree’, 5
Adapted from the widely used
Life Orientation Test-Revised
(LOT-R) by Scheier, Carver,
and Bridges (1994)
Effortful processing ‘My opinion about hosting the Olympic Games in the USA is
influenced by…’
‘…reports in "classical" media (TV, radio, print).’
‘…news / reports in modern internet media (Facebook, Twitter, etc.).’
‘…the campaigns of the supporters of the Olympic Games in
[country].’
See, for example, O'Reilly,
(1982) for the use of a 5-point
Likert scale to consider
different information sources
Education ‘What is the highest educational level that you have attained?’
Response options differ between the countries based on the different
educational systems in each country. Responses were transformed into
a low, medium and high format.
Country-specific degree
names were provided by the
market research company
Nielsen sports Social dissonance Measured as the absolute value of the difference between a
respondent’s own support (see above) and his expectation of his
friends and acquaintances’ support for hosting the Olympics:
‘The majority of my friends and acquaintances think that hosting the
Olympic Games in the USA is a good idea and they would support it.’
(1 ‘strongly disagree’, 2 ‘disagree’, 3 ‘neither/nor’, 4 ‘agree’, 5
‘strongly agree’)
-

Paper II – Anticipated feelings and the support for public mega projects
Appendix
52
Appendix 3a: CFA results: Fit, reliability and discriminant validity
Fit, reliability and discriminant
validity AT
CH ESP FRA GER GRE IT
NOR
POL
SWE
UK
USA
Overall2
Fit χ² 151.564 164.991 154.234 156.053 169.160 165.410 210.075 121.520 246.566 177.767 183.286 242.581 2144.708
df 79 79 79 79 79 79 79 79 79 79 79 79 948 χ²/df 1.919 2.088 1.952 1.975 2.141 2.094 2.659 1.538 3.121 2.250 2.320 3.071 2.262 RMSEA 0.030 0.033 0.031 0.031 0.034 0.033 0.041 0.023 0.046 0.035 0.036 0.046 0.036 CFI 0.984 0.980 0.985 0.984 0.980 0.983 0.979 0.991 0.960 0.977 0.983 0.973 0.980 SRMR 0.029 0.035 0.031 0.030 0.032 0.033 0.034 0.024 0.043 0.034 0.031 0.036 0.033
Reliability Avg. variance extracted (AVE)
IDEN 0.506 0.516 0.582 0.532 0.539 0.514 0.577 0.577 0.509 0.505 0.595 0.543 0.561
OPTI 0.702 0.645 0.701 0.677 0.656 0.693 0.724 0.761 0.721 0.713 0.731 0.659 0.689
DESI 0.646 0.622 0.690 0.646 0.640 0.637 0.772 0.729 0.736 0.687 0.684 0.663 0.666
EFFORT 0.445 0.427 0.476 0.496 0.436 0.509 0.629 0.520 0.430 0.558 0.567 0.565 0.504 Composite reliability (CR)
IDEN 0.858 0.862 0.891 0.870 0.874 0.860 0.888 0.890 0.859 0.858 0.897 0.875 0.883
OPTI 0.919 0.898 0.917 0.909 0.901 0.914 0.927 0.937 0.920 0.921 0.929 0.905 0.914
DESI 0.843 0.827 0.868 0.844 0.840 0.838 0.910 0.889 0.890 0.866 0.866 0.854 0.856
EFFORT 0.756 0.739 0.775 0.793 0.752 0.803 0.870 0.811 0.744 0.834 0.839 0.838 0.800
Discriminant validity1 Fornell-Larcker test
(AVE > Correlation²)
IDEN vs. OPTI ✓ ✓ ✓ ✓ ✓ ✓ ✓ ✓ ✓ ✓ ✓ ✓ ✓ IDEN vs. DESI ✓ ✓ ✓ ✓ ✓ ✓ ✓ ✓ ✓ ✓ ✓ ✓ ✓ IDEN vs. EFFORT ✓ ✓ ✓ ✓ ✓ ✓ ✓ ✓ ✓ ✓ ✓ ✓ ✓
OPTI vs. EFFORT ✓ ✓ ✓ ✓ ✓ ✓ ✓ ✓ ✓ ✓ ✓ ✓ ✓ DESI vs. EFFORT ✓ ✓ ✓ ✓ ✓ ✓ ✓ ✓ ✓ ✓ ✓ ✓ ✓
Note: Robust standard errors and chi-square statistics are estimated using the Satorra-Bentler procedure (Satorra & Bentler, 1994). Country abbreviations: AT = Austria, CH = Switzerland, ESP =
Spain, FRA = France, GER = Germany, GRE = Greece, IT = Italy, NOR = Norway, POL = Poland, SWE = Sweden, UK = United Kingdom and USA = United States of America. 1We perform no Fornell-Larcker test of DESI versus OPTI, because by definition, all DESI items are nested in OPTI (Rauch et al., 2007). 2For the overall model (13), reliability and discriminant validity values/tests are based on a pooled sample (n = 12,000) across all countries.
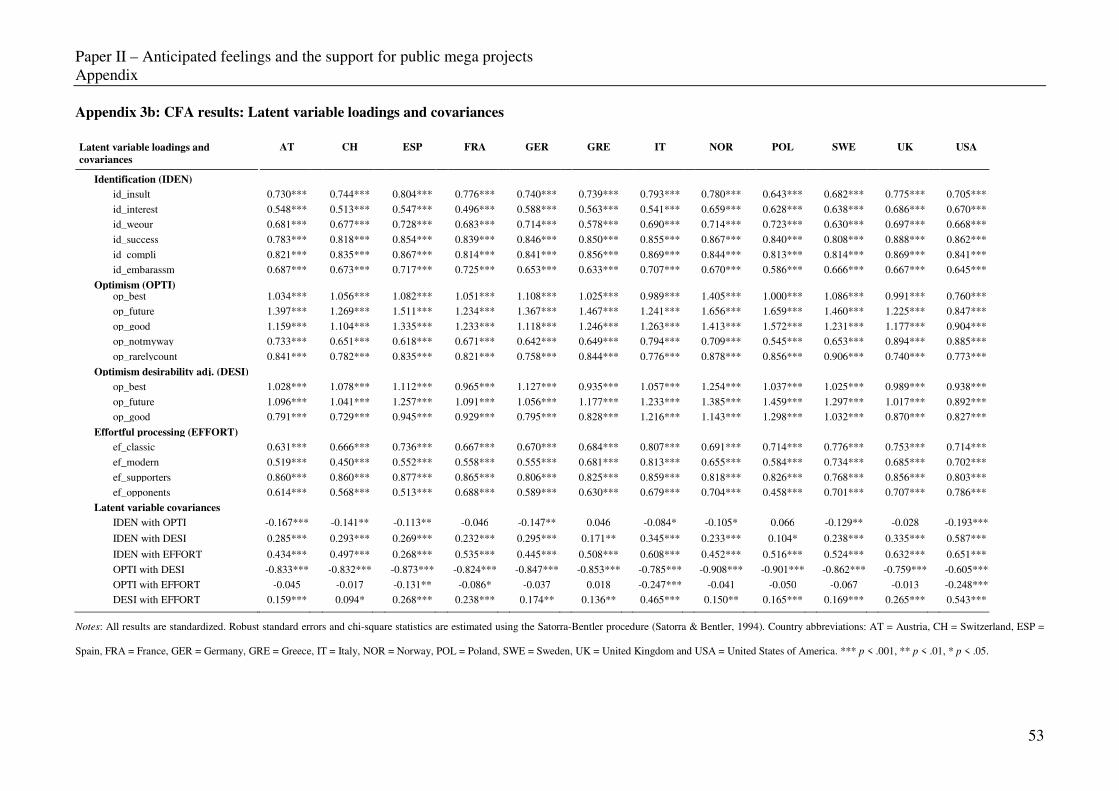
Paper II – Anticipated feelings and the support for public mega projects
Appendix
53
Appendix 3b: CFA results: Latent variable loadings and covariances
AT
CH ESP FRA GER GRE IT
NOR
POL
SWE
UK
USA Latent variable loadings and
covariances
Identification (IDEN) id_insult 0.730*** 0.744*** 0.804*** 0.776*** 0.740*** 0.739*** 0.793*** 0.780*** 0.643*** 0.682*** 0.775*** 0.705***
id_interest 0.548*** 0.513*** 0.547*** 0.496*** 0.588*** 0.563*** 0.541*** 0.659*** 0.628*** 0.638*** 0.686*** 0.670*** id_weour 0.681*** 0.677*** 0.728*** 0.683*** 0.714*** 0.578*** 0.690*** 0.714*** 0.723*** 0.630*** 0.697*** 0.668*** id_success 0.783*** 0.818*** 0.854*** 0.839*** 0.846*** 0.850*** 0.855*** 0.867*** 0.840*** 0.808*** 0.888*** 0.862*** id_compli 0.821*** 0.835*** 0.867*** 0.814*** 0.841*** 0.856*** 0.869*** 0.844*** 0.813*** 0.814*** 0.869*** 0.841***
id_embarassm 0.687*** 0.673*** 0.717*** 0.725*** 0.653*** 0.633*** 0.707*** 0.670*** 0.586*** 0.666*** 0.667*** 0.645*** Optimism (OPTI) op_best 1.034*** 1.056*** 1.082*** 1.051*** 1.108*** 1.025*** 0.989*** 1.405*** 1.000*** 1.086*** 0.991*** 0.760*** op_future 1.397*** 1.269*** 1.511*** 1.234*** 1.367*** 1.467*** 1.241*** 1.656*** 1.659*** 1.460*** 1.225*** 0.847*** op_good 1.159*** 1.104*** 1.335*** 1.233*** 1.118*** 1.246*** 1.263*** 1.413*** 1.572*** 1.231*** 1.177*** 0.904***
op_notmyway 0.733*** 0.651*** 0.618*** 0.671*** 0.642*** 0.649*** 0.794*** 0.709*** 0.545*** 0.653*** 0.894*** 0.885*** op_rarelycount 0.841*** 0.782*** 0.835*** 0.821*** 0.758*** 0.844*** 0.776*** 0.878*** 0.856*** 0.906*** 0.740*** 0.773***
Optimism desirability adj. (DESI) op_best 1.028*** 1.078*** 1.112*** 0.965*** 1.127*** 0.935*** 1.057*** 1.254*** 1.037*** 1.025*** 0.989*** 0.938***
op_future 1.096*** 1.041*** 1.257*** 1.091*** 1.056*** 1.177*** 1.233*** 1.385*** 1.459*** 1.297*** 1.017*** 0.892*** op_good 0.791*** 0.729*** 0.945*** 0.929*** 0.795*** 0.828*** 1.216*** 1.143*** 1.298*** 1.032*** 0.870*** 0.827*** Effortful processing (EFFORT)
ef_classic 0.631*** 0.666*** 0.736*** 0.667*** 0.670*** 0.684*** 0.807*** 0.691*** 0.714*** 0.776*** 0.753*** 0.714*** ef_modern 0.519*** 0.450*** 0.552*** 0.558*** 0.555*** 0.681*** 0.813*** 0.655*** 0.584*** 0.734*** 0.685*** 0.702*** ef_supporters 0.860*** 0.860*** 0.877*** 0.865*** 0.806*** 0.825*** 0.859*** 0.818*** 0.826*** 0.768*** 0.856*** 0.803*** ef_opponents 0.614*** 0.568*** 0.513*** 0.688*** 0.589*** 0.630*** 0.679*** 0.704*** 0.458*** 0.701*** 0.707*** 0.786*** Latent variable covariances
IDEN with OPTI -0.167*** -0.141** -0.113** -0.046 -0.147** 0.046 -0.084* -0.105* 0.066 -0.129** -0.028 -0.193*** IDEN with DESI 0.285*** 0.293*** 0.269*** 0.232*** 0.295*** 0.171** 0.345*** 0.233*** 0.104* 0.238*** 0.335*** 0.587*** IDEN with EFFORT 0.434*** 0.497*** 0.268*** 0.535*** 0.445*** 0.508*** 0.608*** 0.452*** 0.516*** 0.524*** 0.632*** 0.651***
OPTI with DESI -0.833*** -0.832*** -0.873*** -0.824*** -0.847*** -0.853*** -0.785*** -0.908*** -0.901*** -0.862*** -0.759*** -0.605*** OPTI with EFFORT -0.045 -0.017 -0.131** -0.086* -0.037 0.018 -0.247*** -0.041 -0.050 -0.067 -0.013 -0.248*** DESI with EFFORT 0.159*** 0.094* 0.268*** 0.238*** 0.174** 0.136** 0.465*** 0.150** 0.165*** 0.169*** 0.265*** 0.543***
Notes: All results are standardized. Robust standard errors and chi-square statistics are estimated using the Satorra-Bentler procedure (Satorra & Bentler, 1994). Country abbreviations: AT = Austria, CH = Switzerland, ESP =
Spain, FRA = France, GER = Germany, GRE = Greece, IT = Italy, NOR = Norway, POL = Poland, SWE = Sweden, UK = United Kingdom and USA = United States of America. *** p < .001, ** p < .01, * p < .05.

Paper III – Referenda on hosting the Olympics: What drives voter turnout?
54
4 Paper III - Referenda on hosting the
Olympics:
What drives voter turnout? Evidence from 12 democratic
countries12
12 Streicher, T. (2017). Referenda on hosting the Olympics: what drives voter turnout? Evidence from 12
democratic countries. Unpublished working paper.

Paper III – Referenda on hosting the Olympics: What drives voter turnout?
55
Abstract
Public referenda have recently put an end to the ambitions of six cities to host the
Olympic Games. The outcome of referenda depends on two major decisions: a content
decision whether to support hosting the Olympics and a turnout decision whether or not
to cast a vote. Unlike the content decision, the turnout decision has received little
attention in sports economics, even though it can distort the outcome of a referendum,
lead to a misrepresentation of minorities, and reduce the acceptance of referendum
results. I therefore develop a model, the Olympic Referenda Model, to examine the
determinants of turnout at Olympic referenda using a population-representative data
set from 12 democratic countries. The findings suggest a crucial role for polarization in
voter turnout and indicate that arguments from opponents of hosting the Olympics have
a stronger effect on voter turnout than supporters’ arguments.
Keywords: Bid; campaign; host; mega sport events; Olympic Games; public referenda;
turnout; voting

Paper III – Referenda on hosting the Olympics: What drives voter turnout?
Introduction
56
4.1 Introduction
“The voter turnout at the Munich referendum was 29%, with 48% of votes in favor and
52% against the Olympics. This means that, in the end, 15% of the electorate decided
the referendum […]. I know from my time in politics that it’s always easier to mobilize
people against something than for something.”
Michael Vesper, CEO of the German Olympic Sports Confederation13
Referenda have become a frequent tool across Western democracies (Casella
& Gelman, 2008) and this general trend also affects applicant cities for hosting the
Olympic Games. Referenda have recently put an end to six Olympic candidatures
(Graubünden, Munich, and Krakow for the 2022 Olympics, Hamburg for the 2024
Olympics, Graubünden again for the 2026 Olympics, and Vienna for 2028 Olympics).
Additionally, Boston and Budapest cancelled their candidatures for the 2024 Olympics
facing a lack of public support and demands for referenda.
Potentially triggered by the rejections of Olympic host ambitions, researchers have
begun to examine predictors of support for hosting the Olympics in general (Atkinson,
Mourato, Szymanski, & Ozdemiroglu, 2008; Preuss & Werkmann, 2011; Walton,
Longo, & Dawson, 2008; Wicker, Whitehead, Mason, & Johnson, 2016) and predictors
of support within the Olympic referenda context in particular (Coates & Wicker, 2015;
Streicher, Schmidt, Schreyer, & Torgler, 2017b). An individual’s support decision,
however, is only one of two important decisions at referenda; the other one being an
individual’s decision to vote or to abstain from voting instead.
13 The quote of Michael Vesper is taken and translated from Teuffel (2014).

Paper III – Referenda on hosting the Olympics: What drives voter turnout?
Introduction
57
Unlike the support decision, the turnout decision at Olympic referenda has not yet been
studied, even though low voter turnout at Olympic referenda can have severe
consequences. As Michael Vesper’s quote at the introduction of this paper suggests, low
voter turnout can lead to a partisan bias, i.e. change the outcome of referenda as
compared to full voter turnout (Hajnal & Trounstine, 2005; Lutz, 2007). Low turnout is
also frequently associated with a lack of representation of racial and ethnic minorities as
well as poor and uneducated people (Hajnal & Trounstine, 2005) and reduces the
acceptance of referendum outcomes (Franklin, 1999; Lutz, 2007).
Therefore, this paper addresses calls for research on referenda and the role of local
residents for hosting the Olympics from the field of sports economics (Coates &
Wicker, 2015; Könecke, Schubert, & Preuss, 2016; Preuss & Solberg, 2006) and
capitalize on more general turnout research that currently enjoys a “renaissance”
(Green, McGrath, & Aronow, 2013, p. 28). Combining research on the Olympics with
general turnout research, I develop and test an Olympic Referenda Model using a
unique representative data set with 12,000 respondents from the USA and eleven
European countries. To the best of my knowledge, this study is the first to examine
turnout at Olympic referenda.
The paper is structured as follows: it starts with a brief summary of recent Olympic
referenda outcomes and research to derive the Olympic Referenda Model. This model
provides the basis to discuss the drivers of turnout based on general turnout research, to
develop the hypotheses, and to describe the data and measurement approach. The paper
continues with a discussion of the results along four previously defined theoretical
categories and outlines the practical implications. The paper concludes with limitations
and future research directions.

Paper III – Referenda on hosting the Olympics: What drives voter turnout?
Referenda on mega-sport events and voter turnout
58
4.2 Referenda on mega-sport events and voter turnout
4.2.1 Referenda as the new normal for host city candidates
“We are sorry […]. We made a mistake. Take the Games elsewhere.”
Bob Jackson, Colorado State Representative14
In one of the first and probably the most remarkable referendum on hosting the
Olympics, the citizens of Denver voted against a bond issue to finance hosting the
Olympics after the IOC had already awarded Denver the 1976 Olympic Games (Coates
& Wicker, 2015; Moore, 2015).15 While the Denver referendum is the only case where a
host city withdrew after having been awarded the Olympics, it marks the starting point
of a series of referenda over the last 40 years that were held before the IOC’s host city
decision. In the 1980s and 1990s, however, referenda were still an exception.16 The
outcomes of referenda that did take place in this period were rather balanced between an
approval of hosting or financially supporting the Olympics (e.g., Lake Placid for the
1980, Anchorage for the 1994, and Salt Lake City for the 1998 Winter Games) and a
rejection of the former (e.g., Graubünden for the 1988 Winter Games, Lausanne for the
1994 Winter Games, and Los Angeles for the 1984 Summer Games).17
Since 2000, the importance of public approval for the Olympics appears to have
increased, as indicated by the fact that the IOC has since then conducted independent
14 See American Press (1971, p. 10). 15 Four months after Denver’s withdrawal, Innsbruck (Austria) was awarded the 1976 Olympics by the
IOC because it already had some of the required infrastructure from its hosting of the 1964 Olympics in
place. 16 The low number of referenda can partly be attributed to political systems within host cities where
participatory democracy was at lower levels (e.g., Moscow 1980, Sarajevo 1984, and Seoul 1988).
However, referenda also did not take place in more developed democracies (e.g., Calgary 1988,
Barcelona 1992, and Nagano 1988). 17 The Los Angeles referendum prevented public funding for hosting the Olympics. The Olympics were
nevertheless hosted in Los Angeles because a special TV revenue sharing contract and other measures
substituted public funding (Lenskyj & Wagg, 2012).

Paper III – Referenda on hosting the Olympics: What drives voter turnout?
Referenda on mega-sport events and voter turnout
59
opinion surveys in each candidate city (Lauermann, 2016b). While there was still a
limited number of referenda and a balance of support (Vancouver for the 2010 and
Munich for the 2018 Winter Games) and rejection (Bern for the 2010 and Salzburg for
the 2014 Winter Games) at the first Olympic referenda in the new millennium, both the
number of referenda and the share of negative referenda outcomes have increased
significantly in the recent past.18 As stated earlier, referenda have recently put an end to
six candidatures19 and additionally, Boston and Budapest cancelled their candidatures
facing a lack of public support and demands for referenda.
4.2.2 Research on Olympic referenda
Against this background, sport economists have recently begun to stress the role of
public approval for hosting the Olympics using a variety of different data sets and
thematic emphases. Three recent papers exemplify this variety: Coates and Wicker
(2015) use secondary data from the Munich 2022 referendum and identify, amongst
other factors, unemployment, strength of certain political parties, and hotel beds per
capita as determinants of support in the referendum. Könecke et al. (2016) conduct a
qualitative content analysis of the media coverage of the Munich 2022 referendum and
point at the role of damaged brand images of international sport organizations and their
events. And lastly, Streicher et al. (2017b) use survey data to compare the effect of
social versus economic factors for people’s support for hosting the Olympics and
attribute a more dominant role to social factors.
18 The referenda for Munich 2018 took place in Garmisch-Partenkirchen, which was suggested as a venue
for some Olympic skiing events (Chelsom-Pill, 2011) . The referendum in Salzburg was non-binding and
city officials decided to apply despite the negative referendum outcome (Dachs & Floimair, 2008). 19 Graubünden 2022, Munich 2022, Krakow 2022, Hamburg 2024, Graubünden 2026, and Vienna 2028
ended their candidatures following failed referenda.

Paper III – Referenda on hosting the Olympics: What drives voter turnout?
Referenda on mega-sport events and voter turnout
60
To review the current state of research more broadly and in a structured manner, I
developed the “Olympic referenda model” (ORM) that will be outlined in the following
(see Figure 6). The ORM is based on two seminal papers by Preuss and Solberg (2006)
and Easton (1965). It postulates that interactions in the political system of the host
community determine the bid for hosting the Olympics.
While the referendum outcome is a central component of the political system, it is
important to note that the referendum outcome does not determine the bid for hosting
the Olympics on its own. Los Angeles’s bid for the 1984 Summer Olympics or
Salzburg’s bid for the 2014 Winter Olympics exemplify that a negative referendum
outcome does not necessarily put an end to a bid for hosting the Olympics (Dachs &
Floimair, 2008; Lenskyj & Wagg, 2012). Vice-versa, Olympic plans can be withdrawn
despite positive referenda outcomes like in the case of Oslo’s bid for the 2022 Winter
Olympics (Fouche, 2013). Referenda therefore do not directly determine a bid for a
hosting but rather exert their influence through the interaction with stakeholders in the
political system.
The bidding committee is a major stakeholder in the political system (Preuss & Solberg,
2006). It develops a hosting concept and engages in campaigning and lobbying efforts
towards individuals and interest groups, including national and international sports
federations. These efforts can cost several million dollars and are often supported by
public resources, be it through manpower from the applicant city’s admin, tax money or
the use of public infrastructure. Bidding committees need legitimacy from the public for
this use of public resources and ultimately, for their involvement as major stakeholder
in the Olympic bid (Hautbois, Parent, & Séguin, 2012; Mitchell, Agle, & Wood, 1997;
Westerbeek, Turner, & Ingerson, 2002). Depending on their outcome, referenda provide
or deprive bidding committees of this legitimacy.

Paper III – Referenda on hosting the Olympics: What drives voter turnout?
Referenda on mega-sport events and voter turnout
61
Figure 6 - Olympic referenda model (ORM)
Sources: adapted from Preuss and Solberg (2006) and Easton (1965).
Residents
Content
decision(c.f. Könecke et al.,
2016; Coates &
Wicker, 2015)
Turnout
decision(no studies
identified)
Make Referendum
outcome
Bidding
committee
Politics
(De-)legitimizes
Provides
resources
Provides
political
capital
Bid for
hosting the
Olympics
Intra-societal environment Political system
Decisions
determine
Political system
determines
(De-)legitimizes

Paper III – Referenda on hosting the Olympics: What drives voter turnout?
Referenda on mega-sport events and voter turnout
62
Politicians are another major stakeholder in the political system (cf. Hautbois, Parent, &
Séguin, 2012; Westerbeek, Turner, & Ingerson, 2002). They provide bidding
committees with public resources, which makes them accountable to and require
legitimacy from the public (Westerbeek et al., 2002), e.g., through referenda. When
providing public resources, however, politicians rather engage in political reasoning as
compared to a deliberate analysis of the pros and contras of their support (Emery,
2002). Events such as the Olympics give politicians the opportunity to foster their own
political ambitions (Schmidt, 2017; Westerbeek, Turner, & Ingerson, 2002). Politicians
could thus be incentivized to provide public resources because they promise a positive
effect for their own political capital.20
In summary, the political system, through the interaction of its stakeholders, processes
input from the environment and then determines whether or not a bid for hosting the
Olympics will be prepared (Preuss & Solberg, 2006). The input consists of two
decisions that residents make in an intra-societal environment: a content decision (“Am
I in favor of hosting the Olympics?”) and a turnout decision (“Am I going to cast a
ballot?”).21
The content decision has been addressed by researchers in multiple ways. A number of
studies examine residents’ support using survey data. While some survey-based studies
use survey instruments that explicitly ask for people’s support (Schmidt, Schreyer, &
Streicher, 2015; Streicher, Schmidt, Schreyer, & Torgler, 2017b), other studies use
20 For example, Almeida, Coakley, Marchi Júnior, and Starepravo (2012) note allegations that political
support for the Brazilian bids for the FIFA World Cup and the Olympic Games was intended to foster
Dilma Rousseff’s political capital and her campaign to become the Brazilian president. Similarly, Baade
and Sanderson (2012) argue that one reason why Chicago’s Mayor Richard M. Daley suddenly initiated
Chicago’s bid for the 2016 Summer Olympics was to deflect the public's attention away from a corruption
scandal, which can be interpreted as a an act to protect his political capital. 21 Preuss and Solberg (2006, p. 394) distinguish between an extra-societal environment (sport governing
bodies) and an intra-societal environment (residents). For reasons of simplification and due to the
centrality of referenda in this study, I focus on the intra-societal environment only.

Paper III – Referenda on hosting the Olympics: What drives voter turnout?
Referenda on mega-sport events and voter turnout
63
willingness to pay instruments (Atkinson, Mourato, Szymanski, & Ozdemiroglu, 2008;
Preuss & Werkmann, 2011; Walton, Longo, & Dawson, 2008; Wicker, Whitehead,
Mason, & Johnson, 2016). Coates and Wicker (2015) complement this survey-based
research by using secondary data from the actual referendum on Munich’s bid for the
2022 Olympics. Apart from the aforementioned studies, an additional type of study
focusses on discussing the role of media as a major determinant of the support for
hosting the Olympics (Kim, Choi, & Kaplanidou, 2015; Könecke, Schubert, & Preuss,
2016; Ritchie, Shipway, & Monica Chien, 2010). In summary, many studies on support
for hosting the Olympics share two characteristics. First, they put an emphasis on socio-
demographics. Males seem to support a hosting more strongly whereas there is some
evidence that age has a negative impact (Streicher, Schmidt, Schreyer, & Torgler,
2017b; Walton, Longo, & Dawson, 2008; Wicker, Whitehead, Mason, & Johnson,
2016). Income and interest in sports seem to have positive impact on support, too
(Preuss & Werkmann, 2011; Walton, Longo, & Dawson, 2008). Second, most studies
stress the importance of intangible benefits (e.g., pride, prestige, and other social
factors) as opposed to tangible benefits (e.g., employment, tourist inflow, and other
economic factors) of hosting the Olympics (see for example, Streicher, Schmidt,
Schreyer, & Torgler, 2017b; Wicker, Whitehead, Mason, & Johnson, 2016).
In contrast to the content decision, the turnout decision of whether people cast a vote in
Olympic referenda has not yet been studied, even though turnout can have three
important effects on Olympic referenda. First, low turnout can lead to a partisan bias,
i.e. alter the outcome of a referendum as compared to the outcome that would occur
with full turnout (Hajnal & Trounstine, 2005; Lutz, 2007). For the example of Swiss
referenda, Lutz (2007) provides evidence that 35% of referenda would have had a
different approval rate at full turnout. In these cases, the lower than full turnout has

Paper III – Referenda on hosting the Olympics: What drives voter turnout?
Hypotheses and empirical framework
64
favored outcomes supported by left-wing parties (Lutz, 2007). Due to the frequent
opposition of left-wing parties against hosting the Olympics, it is thus possible that low
turnout contributes to the rejection probability of hosting plans.22
Second, low turnout can imply a lack of representation of the interests of non-voters,
who consist of a disproportionately high share of poor, racial and ethnic minorities as
well as less educated people (for a brief review, see Hajnal & Trounstine, 2005). These
groups’ concerns might be overlooked and they might be underprivileged when it
comes to the distribution of public goods (Bennett & Resnick, 1990; Martin, 2003)
associated with the Olympics.
Third, high turnout can positively affect the acceptance of referendum results (Franklin,
1999; Lutz, 2007). This can potentially reduce protest and activism that frequently
accompanies today’s Olympics (Boykoff, 2014b) and channel opposition into more
constructive forms of political participation. For these three reasons and due to the
“renaissance” (Green et al., 2013, p. 28) that general research on voter turnout currently
enjoys, I consider it worth exploring the determinants of voter turnout at Olympic
referenda in the next paragraphs.
4.3 Hypotheses and empirical framework
4.3.1 Overall model
Even after decades of research on voter turnout, researchers are still examining the
micro-foundations of voter turnout (Arceneaux & Nickerson, 2009; Blais, 2006) and
have not agreed on a “core” model of voter turnout (Geys, 2006b, p. 637). Smets and
22 For example, Coates and Wicker (2015) find that the share of favorable votes in the referendum on
Munich’s bid for the 2022 Winter Olympics was significantly lower in communities with a high share of
votes for the leftist party.
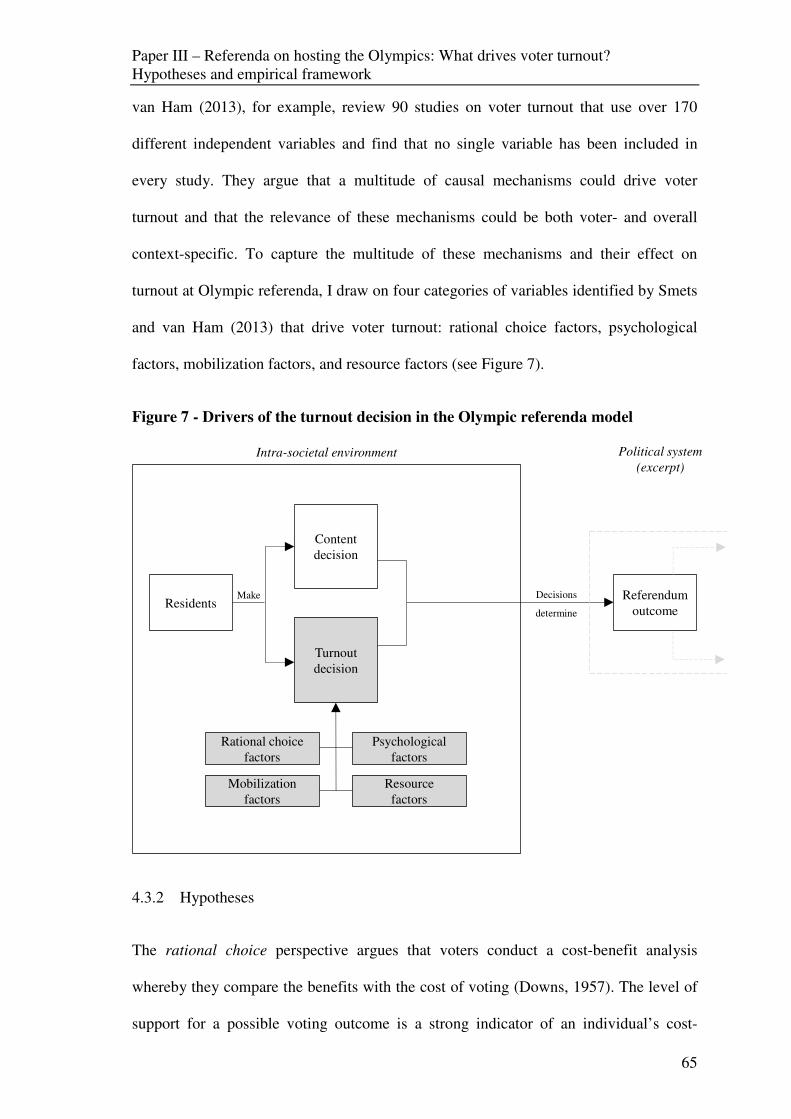
Paper III – Referenda on hosting the Olympics: What drives voter turnout?
Hypotheses and empirical framework
65
van Ham (2013), for example, review 90 studies on voter turnout that use over 170
different independent variables and find that no single variable has been included in
every study. They argue that a multitude of causal mechanisms could drive voter
turnout and that the relevance of these mechanisms could be both voter- and overall
context-specific. To capture the multitude of these mechanisms and their effect on
turnout at Olympic referenda, I draw on four categories of variables identified by Smets
and van Ham (2013) that drive voter turnout: rational choice factors, psychological
factors, mobilization factors, and resource factors (see Figure 7).
Figure 7 - Drivers of the turnout decision in the Olympic referenda model
4.3.2 Hypotheses
The rational choice perspective argues that voters conduct a cost-benefit analysis
whereby they compare the benefits with the cost of voting (Downs, 1957). The level of
support for a possible voting outcome is a strong indicator of an individual’s cost-
Residents
Content
decision
Turnout
decision
Make Referendum
outcome
Intra-societal environment Political system
(excerpt)
Decisions
determine
Rational choice
factors
Psychological
factors
Mobilization
factors
Resource
factors

Paper III – Referenda on hosting the Olympics: What drives voter turnout?
Hypotheses and empirical framework
66
benefit analysis and thus his propensity to vote. If a voter is indifferent between the
choices of an election, i.e. perceives a balance of costs and benefits, it is rational for him
not to vote (Geys, 2006a). In contrast to indifferent people, those people with extreme
opinions are more likely to vote (Zorn & Martin, 1986). I intend to test these findings
from general elections for Olympic referenda using the following hypothesis:
H1: The support for hosting the Olympics has a quadratic effect on voter
turnout, i.e. high and low levels of support lead to a higher turnout
than indifference.
Research on support for hosting the Olympics has recently departed from a pure focus
on economic motivations and emphasized social motivations (Streicher, Schmidt,
Schreyer, & Torgler, 2017b; Wicker, Whitehead, Mason, & Johnson, 2016). This trend
is paralleled in recent turnout research that portrays voting as an act involving both the
consideration of personal benefits and the benefits of others (Fowler, 2006). I put this
recent view to test using the following hypothesis:
H2: Economic and social motivational factors have a positive effect on
voter turnout.
While voters can come to a conclusion whether costs or benefits from a hosting would
prevail, it is unclear whether they care about the result of their analysis. The outcome,
be it positive or negative, might just not be important enough to them. It is thus no
surprise that low perceived importance of an election lowers voter turnout and induces
voters to delegate their decision (Franklin, 1999; Matsusaka, 1995), leading to the
following two hypotheses:
H3: The perceived importance of the hosting question has a positive effect
on voter turnout.
H4: The tendency to delegate the hosting decision to politicians has a
negative effect on voter turnout.

Paper III – Referenda on hosting the Olympics: What drives voter turnout?
Hypotheses and empirical framework
67
In addition to rational choice, Smets and van Ham (2013) use psychological factors as
another category of variables explaining turnout. Smets and van Ham (2013) show that
most psychological variables in their literature review do not have a significant effect on
voter turnout. I therefore focus on a psychological variable not covered in their
literature review: optimism. Optimism has an effect on how people perceive themselves
and their environment, how they process information and, most importantly, how they
make their choices based on these information (Forgeard & Seligman, 2012). Political
campaigns, which cost several million US dollars for Olympic applicant cities, try to
influence the level of optimism about electoral outcomes (Krizan & Sweeny, 2013). The
optimism literature suggests that optimists address problems using an approach strategy
while pessimists use an avoidance strategy (Nes & Segerstrom, 2006). This would
imply that optimists rather vote for hosting the Olympics while pessimists rather vote
against it. High and low levels of optimism could thus both foster turnout at Olympic
referenda. Zorn and Martin (1986) suggest this effect of optimism beyond the Olympics
context and further argue that a medium level of optimism leads to a comparatively
lower voter turnout. I address the applicability of their theory for the Olympic referenda
context using the following hypothesis:
H5: Optimism has a quadratic effect on voter turnout, i.e. high and low
optimism levels lead to a higher voter turnout than medium levels.
Mobilization factors are another category identified by Smets and van Ham (2013). The
category is based on the idea that political parties, interest groups, and personal social
networks provide citizens with information relevant to the election and decrease
citizens’ voting costs if citizens are receptive to these information sources. While there
is a variety of potential information sources for a resident’s hosting decision (see Preuss
(2004, p. 49) for a brief overview), I decide to test a resident’s openness towards three
information sources:

Paper III – Referenda on hosting the Olympics: What drives voter turnout?
Hypotheses and empirical framework
68
H6: Openness towards supporters‘ arguments for hosting the Olympics has
a positive effect on voter turnout.
H7: Openness towards opponents‘ arguments for hosting the Olympics has
a positive effect on voter turnout.
H8: Openness towards arguments of friends and acquaintances on
hosting the Olympics has a positive effect on voter turnout.
The fourth category of variables considered is resource factors. The basic idea behind
this category is that voting requires resources. Four commonly observed resource
factors are age, gender, education, and income. It is well-established that the likelihood
to vote increases with age (Blais, 2006; Smets & van Ham, 2013). With an increasing
age people have had more opportunities to learn from previous behavior around votes,
which reduces their voting cost and contributes to a stronger preference for voting
(Geys, 2006a). Unlike for education and income that are usually found to be positively
associated with turnout (Geys, 2006a; Smets & van Ham, 2013), the literature is less
unanimous when it comes to gender. While men have long been considered to have
more resources to vote (e.g., the voting right itself), recent studies find no (Smets & van
Ham, 2013) or even a negative effect of male gender on turnout (Geys, 2006a). I
suggest to test both the established effects of age, education, and gender as well the less
clear effect of gender on turnout in the Olympics context using the following
hypotheses:
H9: Age has a positive effect on voter turnout.
H10: Education has a positive effect on voter turnout.
H11: Household net income has a positive effect on voter turnout.
H12: Being male has a positive effect on voter turnout.
Apart from the aforementioned resource factors derived from the general turnout
literature, I consider two additional resource factors important for the Olympics context.

Paper III – Referenda on hosting the Olympics: What drives voter turnout?
Hypotheses and empirical framework
69
First, sports and sporting events can foster pride among certain population segments
(e.g., Hallmann, Breuer, & Kühnreich, 2013; Pawlowski, Downward, & Rasciute,
2014). The ability to experience pride from hosting the Olympics could thus function as
a powerful resource that increases the voting likelihood of individuals. Second, media
exposure can influence people’s perception of the Olympics (Kim, Choi, & Kaplanidou,
2015; Könecke, Schubert, & Preuss, 2016; Ritchie, Shipway, & Monica Chien, 2010)
and outside the Olympics context, it has been shown that media exposure influences
voter turnout (Gerber, Karlan, & Bergan, 2009). I hypothesize that this finding also
holds for the Olympics context and test it together with the hypothesis on pride:
H13: Anticipated pride from hosting the Olympics has a positive effect on
voter turnout.
H14: Consumption of sports media has a positive effect on voter turnout.
4.3.3 Data collection
I used data from a representative online survey conducted between March and April
2015 in the United States and eleven European countries (Austria, France, Germany,
Greece, Italy, Norway, Poland, Spain, Sweden, Switzerland, and the United Kingdom).
I selected the eleven European countries based on three criteria. First, the countries were
required to have at least the democracy status flawed democracy according to the
Economist’s Democracy Index to ensure a meaningful political-institutional context to
examine voter turnout (The Economist Intelligence Unit, 2014). Second, there had to be
evidence of a country’s recent aspiration to host the Olympics as indicated by an
application for or hosting of the Olympics within the last twenty years. Third, I
prioritized eleven out of the remaining European countries based on gross domestic
product in purchasing power parity as an indicator of the welfare loss potential from
suboptimal referenda decisions on hosting the Olympics.

Paper III – Referenda on hosting the Olympics: What drives voter turnout?
Hypotheses and empirical framework
70
The English questionnaire was developed and tested by the author team. The market
research company Nielsen sports ensured the translation/back-translation of local
language versions by native speakers, programmed the local language versions of the
online survey and recruited the respondents in all selected countries. A total of 14,051
respondents took part in the survey. 753 respondents were excluded due to overly rapid
completion and uniform response patterns and an additional 1,298 respondents were
excluded because they participated in the survey after quota targets in terms of age,
gender, country, and region were already reached, which resulted in a population-
representative data set with 12,000 respondents in 12 countries.
4.3.4 Measurement
I generally draw on widely cited question types from both the Olympics and the voter
turnout literature to measure the variables. In the following, I first describe the
measurement of the dependent variable, before I provide information on the
measurement of the independent variables.
VOTE is the dependent variable. I use a 5-point Likert scale to measure turnout
intention with responses to the statement “Please imagine that the [country] government
will organize an opinion survey to analyze the attitude of the population towards hosting
the Olympic Games in [country]. How likely is it that you will participate in this
opinion survey?” ranging from “very unlikely” to “very likely”. Measuring turnout
intention as opposed to asking respondents about their turnout in the past election or
using validated turnout data based on official voter records is one of the three common
methods of measuring a turnout variable (Smets & van Ham, 2013). I excluded the
other two measurement options because of, first, a lack of past Olympic referenda in
some countries and, second, a general lack official voter records in most countries
(Smets & van Ham, 2013).

Paper III – Referenda on hosting the Olympics: What drives voter turnout?
Hypotheses and empirical framework
71
I summarize the measurement and theoretical basis of all independent variables in the
Appendices 4a and 4b. Due to their centrality to the analysis, I describe the two
independent variables SUPPORT and OPTIMISM in more detail.
SUPPORT proxies an individual’s level of support for hosting the Olympics because
support as compared to indifference has a positive effect on turnout (Geys, 2006a).
Drawing on other studies on the provision of public goods (Kahneman, Ritov, Jacowitz,
& Grant, 1993; Streicher, Schmidt, Schreyer, & Torgler, 2017b), I measure support
using a 5-point Likert scale with responses to the statement “I am in support of hosting
the Olympic in [country]” with response options ranging from “I strongly disagree” to
“I fully agree”.
OPTIMISM proxies the general optimism of an individual. It is based on the well-
established reflective Life Orientation Test-Revised construct by Scheier et al. (1994). It
consists of six items that I averaged. The construct is sufficiently reliable with a
Cronbach’s alpha of 0.74 (Churchill, 1979).
For the analysis of these variables, I use ordinary least squares (OLS) regressions with
robust standard errors to minimize a potential heteroscedasticity bias. Using the
statistics software Stata 14, I conduct the analyses both for each of the twelve obtained
country samples individually as well as for a pooled sample with the full 12,000
respondents. If hypotheses suggest testing non-linear relationships (H1 and H5), I
provide a comparison of alternative model specifications. I discuss the results of the
analyses in the next paragraph along the four factor categories affecting turnout in the
research model.

Paper III – Referenda on hosting the Olympics: What drives voter turnout?
Results and discussion
72
4.4 Results and discussion
4.4.1 Rational choice factors
I find strong evidence for our first hypothesis indicating that support for hosting the
Olympics has in fact a quadratic effect on turnout at Olympic referenda, i.e. low and
high support lead to higher turnout than indifference. Both in the overall model and in
all twelve individual country models, the support coefficient and its squared counterpart
are significant at the 0.1% level (see Table 5).
I also test the quadratic specification of effect of support on turnout against two
alternative model specifications of support, namely a linear and a cubic specification
(see Appendix 5). For every country sample and the overall sample, however, a
quadratic specification of support explains more variance in turnout than a linear
specification as indicated by the adjusted R². The cubic alternative, if at all, only leads
to a marginally higher adjusted R² while support coefficients do not have a significant
effect on turnout in nine out of twelve countries.
I therefore conclude that the effect of support on turnout is indeed quadratic as depicted
in Figure 8 (cf. Appendices 8a-b). Overall, the finding suggests that polarization of the
public opinion towards hosting the Olympics drives voter turnout internationally.

Paper III – Referenda on hosting the Olympics: What drives voter turnout?
Results and discussion
73
Table 5 - Factors that shape voter turnout (final model)
Variables All countr. AT CH ESP FRA GER GRE IT NOR POL SWE UK USA Rational choice factors
Support -0.671*** -0.599*** -0.642*** -0.689*** -0.495*** -0.372** -0.498*** -0.417*** -1.273*** -0.717*** -0.595*** -0.597*** -0.647*** Support##Support 0.113*** 0.110*** 0.113*** 0.116*** 0.087*** 0.065*** 0.096*** 0.070*** 0.202*** 0.112*** 0.111*** 0.105*** 0.097*** Economic motivation Tax 0.024** -0.048 0.046† 0.041 0.014 0.049 0.001 0.048 0.129*** 0.007 0.077* 0.035 -0.016 Transparency 0.065*** 0.163*** 0.130** 0.101* 0.067 0.039 -0.028 0.141** 0.078** 0.081* 0.112** 0.009 0.054† Fairshare 0.024* 0.092* -0.015 0.036 -0.010 0.065† -0.028 0.060 0.020 0.028 0.155*** -0.021 0.006 Econimpulses -0.011 0.036 0.009 -0.030 -0.001 -0.030 -0.026 -0.072† -0.003 0.062 -0.025 0.050 -0.0450,1 Infrastructure 0.096*** 0.105* 0.147*** 0.026 0.136* 0.173*** 0.034 0.126** 0.040 0.067 0.109** 0.061 0.134*** Social motivation Community -0.026* -0.015 0.005 -0.028 -0.033 0.024 -0.027 -0.125** -0.021 -0.007 -0.027 0.005 -0.018 Reputation 0.027† -0.056 0.037 0.080 0.008 0.029 0.102* -0.001 0.006 -0.052 -0.029 0.093† 0.025 Sportsculture 0.021 0.053 -0.020 -0.034 0.067 -0.023 0.032 0.042 0.051 0.011 0.010 -0.038 0.065 Importance 0.045*** 0.040 0.033 0.040 0.095** 0.068* 0.053 -0.010 0.149*** 0.046 -0.006 -0.039 -0.025 Delegation -0.044*** -0.104*** -0.078** -0.017 -0.024 -0.066* -0.020 -0.007 -0.091*** -0.025 -0.089** 0.002 -0.006 Psychological factors Optimism -0.474*** -0.224 -0.277 -1.243*** -0.794* 0.131 0.288 -0.428† -0.315 -0.220 -0.583 -0.475* -0.569** Optimism##Optimism 0.080*** 0.033 0.048 0.190*** 0.138* -0.011 -0.033 0.071† 0.043 0.042 0.101† 0.082* 0.104*** Mobilization factors Considersupp 0.015 -0.048 -0.031 0.016 0.020 -0.004 -0.020 0.055 0.076* 0.047 -0.009 0.112† 0.076 Consideropp 0.085*** 0.071 0.113** 0.111* 0.155*** 0.118* 0.095* -0.018 0.130*** 0.077* 0.025 0.029 0.048 Considerfracq 0.057*** 0.187*** 0.062 -0.017 -0.024 -0.008 0.031 0.042 -0.024 0.058 0.096† 0.051 0.138** Resource factors Age 0.006*** 0.004 0.008*** 0.005† 0.001 0.008** 0.009** 0.001 0.007*** 0.001 0.004† 0.008*** 0.005* Gender (male = 1) 0.029 0.070 0.023 -0.083 0.031 0.178** 0.095 -0.076 0.063 0.047 -0.034 -0.021 0.000 Education Medium 0.129*** 0.185† 0.027 0.331** 0.127 -0.002 0.150 0.099 0.188 0.067 0.013 0.192 0.014 High 0.219*** 0.061 0.159* 0.363** 0.094 0.155 0.305 0.147 0.343** 0.109 0.180 0.296* 0.204 Household net income Medium 0.078*** 0.036 0.117† 0.009 0.057 0.109 0.170* 0.010 0.082 0.113† 0.036 0.091 0.045 High 0.090*** 0.149† 0.103 0.050 0.113 0.154† -0.158 -0.055 0.105 0.159* 0.039 0.002 0.099 Nationalpride 0.062*** -0.046 0.019 0.147*** 0.041 0.065 0.046 0.115** 0.056 0.114* 0.089* 0.059 0.222*** Sportconsump 0.087*** 0.114*** 0.111*** 0.033 0.077* 0.046 0.087** 0.061* 0.115*** 0.130*** 0.097** 0.071** 0.072** R² 0.215 0.248 0.275 0.218 0.174 0.220 0.166 0.154 0.363 0.265 0.254 0.251 0.355
Notes: *** represents statistical significance at the 0.1% (p < .001), ** at the 1% (p < .01), * at the 5% (p < .05) and † at the 10% (p < .1) level.
Country abbreviations: AT = Austria, CH = Switzerland, ESP = Spain, FRA = France, GER = Germany, GRE = Greece, IT = Italy, NOR = Norway, POL = Poland, SWE = Sweden, UK = United Kingdom and USA = United States of America.

Paper III – Referenda on hosting the Olympics: What drives voter turnout?
Results and discussion
74
Figure 8 - Quadratic effect of support on voter turnout (pooled sample)
Unlike for the first hypothesis, I find only mixed support for the second hypothesis that
economic and social motivations have a significant positive effect on voter turnout
across the twelve surveyed countries. All social factors and three out of five economic
factors (tax, fairshare, and econimpulses) are significant in three countries at the most.
Two economic factors, however, are an exception. First, the perceived importance of
transparency about the use of funds related to hosting the Olympics has a significant
positive effect on turnout in eight out of twelve survey countries. Second, the perceived
importance of a sustainable infrastructure concept for hosting the Olympics is a
significant driver of voter turnout in seven countries. Taking into account previous
research (Streicher, Schmidt, Schreyer, & Torgler, 2017b; Wicker, Whitehead, Mason,
& Johnson, 2016), the findings suggest that economic and social motivations rather
influence the content than the turnout decision at referenda on hosting the Olympics.
3.5
4
4.5
5
Tu
rno
ut lik
elih
ood
(p
redic
tion
)
1 2 3 4 5
Support for hosting
Point estimate 95% CI
All countries

Paper III – Referenda on hosting the Olympics: What drives voter turnout?
Results and discussion
75
The hypotheses that the perceived importance of the hosting question has a positive
(H3) and that the tendency to delegate the hosting decision to politicians has a negative
effect on turnout (H4) hold for the overall model and for three (H3) or five (H4) out of
twelve countries. I do not have a definite answer why the effects are significant in some
countries while they are not in others. However, socially desirable responding, i.e. the
tendency to present oneself as an engaged democratic citizen, and the political-
institutional context within each country could play a role. With respect to the latter, I
note that countries with a significant effect of the delegation tendency (Austria,
Germany, Norway, Sweden, and Switzerland) score higher on The Economist’s
democracy index than countries with no significant effect (score of 9.11 versus 7.85;
The Economist Intelligence Unit, 2014). This finding could be interpreted from a cost-
benefit perspective that people have an incentive to save voting costs and delegate their
vote on hosting the Olympics where the democratic system is rather strong and
potentially produces an adequate hosting decision even without people’s own effort. I
hope that future research will further examine this interpretation.
4.4.2 Psychological factors
The hypothesis that optimism has a quadratic effect on voter turnout holds for the
overall model as well as a group of Mediterranean (France, Italy, and Spain) and Anglo-
American countries (the United Kingdom and the United States) in the sample. Figure 9
and Appendices 9a-b depict the quadratic effects graphically.
Interestingly, most countries where optimism has no significant effect have recently
experienced a failed referendum or a withdrawal of their Olympic application amid a
lack of public support (Austria, Switzerland, Germany, Norway, and Sweden) while the
countries where optimism has a significant effect have not experienced such events at
the time of the survey. Optimism could therefore play a more decisive role for voter

Paper III – Referenda on hosting the Olympics: What drives voter turnout?
Results and discussion
76
turnout where people have less exposure to concrete plans for hosting the Olympics and
thus rather rely on psychological factors.
Figure 9 - Quadratic effect of optimism on voter turnout (pooled sample)
4.4.3 Mobilization factors
Testing hypotheses six to eight, I examine the effect of people’s openness towards the
arguments of supporters (H6), opponents (H7), and friends and acquaintances (H8) on
voter turnout. While openness towards supporters and friends and acquaintances only
has a significant effect in two or, respectively, three countries, the openness towards
opponents’ arguments has a significant effect in seven countries. In contrast to the
openness towards supporters’ arguments, the effect of openness towards opponents’
arguments also has a significant effect on voter turnout in the overall model.
These results are in line with a recent finding of Könecke et al. (2016), who found that
supporters were not as dominant communicators around the referendum on hosting the
3.5
4
4.5
5
Tu
rno
ut lik
elih
ood
(p
redic
tion
)
1 2 3 4 5
Optimism
Point estimate 95% CI
All countries

Paper III – Referenda on hosting the Olympics: What drives voter turnout?
Results and discussion
77
Olympics in Munich 2022 as the authors expected and that supporters did not manage to
establish sufficient communication with residents. In summary, these findings and
recent research point at an asymmetry between the effects of supporters versus
opponents on voter turnout, with opponents being the more dominant information
source for turnout.
4.4.4 Resource factors
The examination of resource factors reveals that their effect on turnout at Olympic
referenda is in line with the general turnout literature for some resource factors while it
differs for other resource factors. In line with more general turnout literature (Smets
& van Ham, 2013), I find that age is positively associated with voter turnout at Olympic
referenda (H9) in both the overall model and eight out of twelve countries. Also in line
with recent findings (Smets & van Ham, 2013), I can reject the hypothesis that being
male has a positive effect on voter turnout (H12) in the overall model and for eleven out
of twelve countries. The only exception is Germany where being male has a statistically
significant effect on voter turnout at the 1% level.
The findings further reveal that the positive effects of education (H10) and household
net income (H11) on voter turnout suggested in the general turnout literature do rather
not apply to turnout at Olympic referenda. Dummy variables for medium and high
education or income are only significant in two to four out of twelve countries. While
education and income seem to be significant predictors of the content decision at
Olympic referenda (see for example, Streicher et al., 2017b), the findings suggest that
they are not generally significant predictors of the turnout decision at Olympic
referenda.

Paper III – Referenda on hosting the Olympics: What drives voter turnout?
Results and discussion
78
Apart from resource factors that are examined in general turnout studies, I also provide
evidence on the effect of the two context-specific resource factors: anticipated pride
(H13) and sports media consumption (H14). The evidence for a significant effect of
anticipated pride is mixed, with anticipated pride being statistically significant in five
out of twelve countries. Sports media consumption, on the other hand, has a statistically
significant effect on voter turnout at Olympic referenda in ten out of twelve countries.
Sports media consumption thus seems to be an important resource for voters to cope
with voting costs. Overall, the findings suggest that the effect of traditional resource
factors can differ and that non-traditional resource factors such as sports media
consumption play an important role for turnout at Olympic referenda.
4.4.5 Practical implications
Low voter turnout can change the outcome of referenda on the multi-billion dollar event
of hosting the Olympics. I therefore believe it is worth discussing five important
practical implications of this study.
The first practical implication relates to the finding that support has a quadratic effect
on voter turnout, i.e. both low and high levels of support raise voter turnout as
compared to indifference. Polarization of the electorate is thus needed to foster voter
turnout at Olympic referenda. It might not be enough for supporters to convince voters
that hosting the Olympics is rather positive or for opponents to convince voters that
hosting the Olympics is rather negative. Supporters and opponents need to fully
convince their target groups and move them to the minimum or maximum boundary
levels of support (see Figure 8) to make sure they actually cast a vote. Vice-versa, the
findings of this study show that de-polarization reduces turnout, which can be used
strategically through an approach called “asymmetric demobilization” that some
political scientists believe has contributed to German Chancellor Merkel’s electoral

Paper III – Referenda on hosting the Olympics: What drives voter turnout?
Results and discussion
79
success over more than a decade. This strategy entails holding still on controversial
issues and putting core topics of the political opponent on the own agenda, thereby
demobilizing more of the opponent’s than of one’s own voters (Arnold & Freier, 2016).
The second practical implication relates to the common campaign practice of supporters
to spend substantial funds on maintaining optimism (Krizan & Sweeny, 2013). The
findings of this study suggest that optimism only has a significant effect on voter
turnout in countries without a recent history of failed referenda or withdrawals of
hosting plans. Campaign strategists of applicant cities from a country with such a
history should therefore run tests before spending scarce campaign resources on
increasing optimism.
In addition to optimism, campaign strategists should also bear in mind that economic
and social motivations that have an effect on residents’ content decision at Olympic
referenda do not automatically have an effect on residents’ turnout decision. The
perceived importance of transparency and sustainable infrastructure, however, are
significant predictors of turnout in the majority of surveyed countries. It might therefore
be useful to address these two topics in turnout campaigns.
The fourth finding with strong practical relevance is an imbalance between people’s
openness towards supporters’ as opposed to opponents’ arguments. It seems to be easier
for the voice of opponents to be heard than for the voice of supporters. This
interpretation is supported by research of Könecke et al. (2016), who conclude that
supporters of hosting the Olympics in Munich did not manage to establish sufficient
communication with local residents. Lauermann (2016a) also identifies the No Boston
Olympics group as the more dominant voice than the comparably unknown pro-
Olympia Boston 2024 Partnership. Going forward, I believe that more elaborate

Paper III – Referenda on hosting the Olympics: What drives voter turnout?
Results and discussion
80
communication plans can help supporters to mobilize the electorate and that such plans
need to reach a similar importance than infrastructure and financing plans of a bid.
Lastly, I find that young residents as compared to their older fellow citizens
rather abstain from voting at Olympic referenda. This is particularly problematic from a
pro-Olympia perspective because support for hosting the Olympics is the highest among
young supporters (Streicher et al., 2017b). Applicant cities facing an Olympic
referendum therefore run the risk of forgoing a support base that could alter the
referendum outcome. A greater involvement of young population segments in the
organizing committee and targeted mobilization efforts towards young voters could
mitigate this risk.
4.4.6 Limitations and future research directions
Turnout is a popular research topic outside the Olympics context (Green et al., 2013).
Even after decades of turnout research, however, the micro-foundations of turnout are
still debated and a core model of voter turnout has not yet emerged (Arceneaux &
Nickerson, 2009; Blais, 2006; Geys, 2006b). Drawing on this general turnout research
that itself undergoes a dynamic development at its micro-foundational level, I am the
first to examine referenda in a unique context–the Olympics context. This study is thus
by any means exploratory and I expect future research to identify additional
determinants of voter turnout at Olympic referenda. Together with the Olympic
referenda model, I hope that the empirical findings of this study are the starting point
for such exploratory and also confirmatory research.
Another frequent limitation in survey-based turnout research is the influence of social
desirability bias (Smets & van Ham, 2013), i.e. the tendency to present oneself
favorably towards others. Respondents tend to report in post-election surveys that they

Paper III – Referenda on hosting the Olympics: What drives voter turnout?
Conclusion
81
voted even though turnout data from public records shows that some of them in fact did
not vote (Smets & van Ham, 2013). Like all other survey-based turnout studies, I cannot
rule out that turnout bias has an effect on the results. However, I assume that the
anonymous online format of the underlying survey mitigates the risk of socially
desirable responding as compared to post-election surveys where people are at times
contacted in person. I nevertheless hope that turnout scholars will develop research
methods to test and adjust for socially desirable responding in turnout surveys.
In addition, this study provides evidence that respondents are more open to the
arguments of opponents than to the arguments of supporters of hosting the Olympics.
The question why the voice of opponents is heard more easily is out of scope of this
study, but I feel it is a very fruitful line of future research on the Olympics. Such
research could also shed light on the effects of different campaign stimuli that
supposedly support openness towards arguments of supporters and also opponents of
hosting the Olympics. To mitigate inference problems when analyzing treatment and
effect in such studies and to complement the general survey focus of turnout research
(Green et al., 2013), I believe that a stronger reliance on experiments could complement
future turnout research.
4.5 Conclusion
Referenda have become a common practice when cities in Western democracies intend
to host the Olympics. While there is research explaining people’s support for hosting
the Olympics at referenda, there is no research explaining people’s turnout decision at
Olympic referenda. However, low voter turnout at Olympic referenda can have severe
consequences: it can change the referendum outcome, lower the acceptance of
referendum results among the population, and lead to a misrepresentation of minorities.

Paper III – Referenda on hosting the Olympics: What drives voter turnout?
Conclusion
82
This study is therefore the first to address the topic of voter turnout at Olympic
referenda. Integrating theory from the general turnout literature with theory on the
Olympics, I develop the Olympic Referenda Model and derive hypotheses on the
drivers of voter turnout at Olympic referenda. I test the hypotheses using a unique
population-representative data set with responses from 12,000 participants across the
United States and eleven European countries. The results show, for example, that
polarization drives voter turnout, opponents of hosting the Olympics have a stronger
effect on voter turnout than supporters, and that social and economic motivations that
increase support for hosting the Olympics do not automatically increase turnout at
Olympic referenda. I elaborate on the practical implications of these findings for future
applicant cities, particularly for their campaigning efforts.
Summarizing his impression of the multitude of theories and variables in the general
turnout literature, Geys (2006a, p. 29) succinctly notes that “all roads may eventually
lead to Rome”. For the specific context of Olympic referenda, I hope to support other
researchers with the presented model and empirical findings in prioritizing among and
paving the roads for fruitful future research.
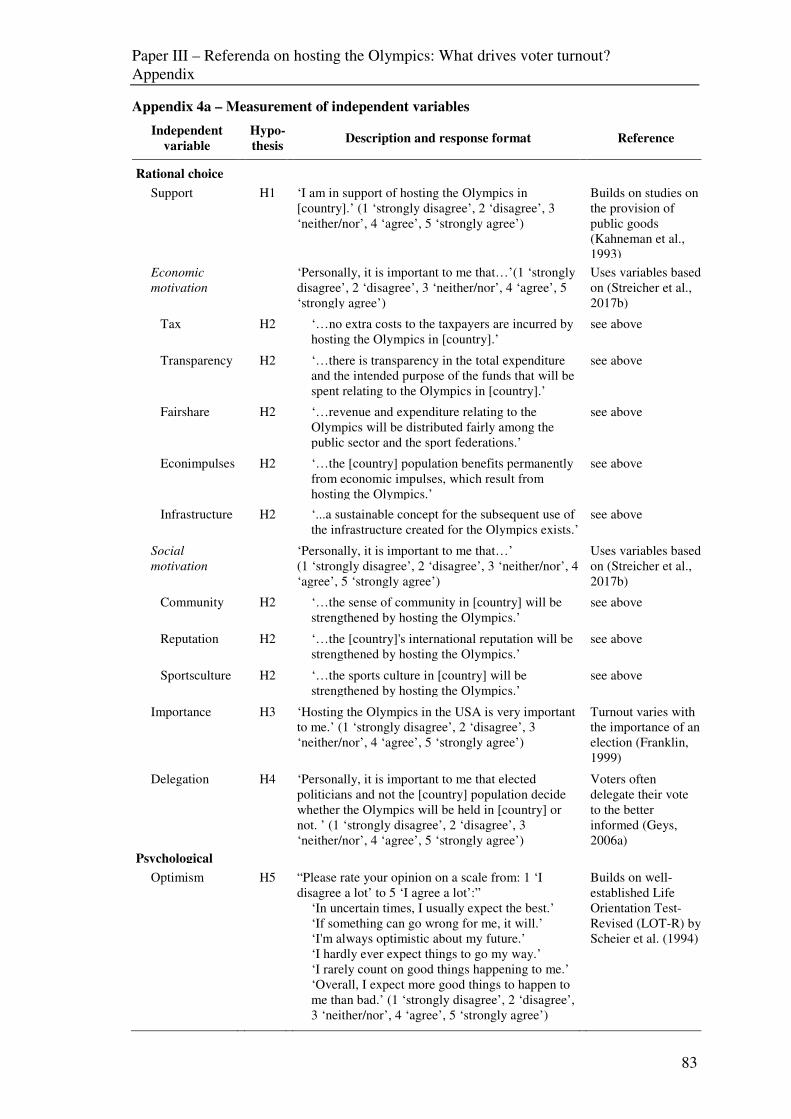
Paper III – Referenda on hosting the Olympics: What drives voter turnout?
Appendix
83
Appendix 4a – Measurement of independent variables
Independent
variable
Hypo-
thesis
Description and response format Reference
Rational choice
Support H1 ‘I am in support of hosting the Olympics in
[country].’ (1 ‘strongly disagree’, 2 ‘disagree’, 3
‘neither/nor’, 4 ‘agree’, 5 ‘strongly agree’)
Builds on studies on
the provision of
public goods
(Kahneman et al.,
1993) Economic
motivation
‘Personally, it is important to me that…’(1 ‘strongly
disagree’, 2 ‘disagree’, 3 ‘neither/nor’, 4 ‘agree’, 5
‘strongly agree’)
Uses variables based
on (Streicher et al.,
2017b)
Tax H2 ‘…no extra costs to the taxpayers are incurred by
hosting the Olympics in [country].’
see above
Transparency H2 ‘…there is transparency in the total expenditure
and the intended purpose of the funds that will be
spent relating to the Olympics in [country].’
see above
Fairshare H2 ‘…revenue and expenditure relating to the
Olympics will be distributed fairly among the
public sector and the sport federations.’
see above
Econimpulses H2 ‘…the [country] population benefits permanently
from economic impulses, which result from
hosting the Olympics.’
see above
Infrastructure H2 ‘...a sustainable concept for the subsequent use of
the infrastructure created for the Olympics exists.’
see above
Social
motivation
‘Personally, it is important to me that…’
(1 ‘strongly disagree’, 2 ‘disagree’, 3 ‘neither/nor’, 4
‘agree’, 5 ‘strongly agree’)
Uses variables based
on (Streicher et al.,
2017b)
Community H2 ‘…the sense of community in [country] will be
strengthened by hosting the Olympics.’
see above
Reputation H2 ‘…the [country]'s international reputation will be
strengthened by hosting the Olympics.’
see above
Sportsculture H2 ‘…the sports culture in [country] will be
strengthened by hosting the Olympics.’
see above
Importance H3 ‘Hosting the Olympics in the USA is very important
to me.’ (1 ‘strongly disagree’, 2 ‘disagree’, 3
‘neither/nor’, 4 ‘agree’, 5 ‘strongly agree’)
Turnout varies with
the importance of an
election (Franklin,
1999)
Delegation H4 ‘Personally, it is important to me that elected
politicians and not the [country] population decide
whether the Olympics will be held in [country] or
not. ’ (1 ‘strongly disagree’, 2 ‘disagree’, 3
‘neither/nor’, 4 ‘agree’, 5 ‘strongly agree’)
Voters often
delegate their vote
to the better
informed (Geys,
2006a) Psychological
Optimism H5 “Please rate your opinion on a scale from: 1 ‘I
disagree a lot’ to 5 ‘I agree a lot’:”
‘In uncertain times, I usually expect the best.’
‘If something can go wrong for me, it will.’
‘I'm always optimistic about my future.’
‘I hardly ever expect things to go my way.’
‘I rarely count on good things happening to me.’
‘Overall, I expect more good things to happen to
me than bad.’ (1 ‘strongly disagree’, 2 ‘disagree’,
3 ‘neither/nor’, 4 ‘agree’, 5 ‘strongly agree’)
Builds on well-
established Life
Orientation Test-
Revised (LOT-R) by
Scheier et al. (1994)

Paper III – Referenda on hosting the Olympics: What drives voter turnout?
Appendix
84
Appendix 4b – Measurement of independent variables
Independent
variable
Hypo-
thesis
Description and response format Reference
Mobilization
Considersupp H9 ‘If Olympia supporters provide me with
arguments relating to the Olympics in [country], I
would take them into consideration.’ (1 ‘strongly
disagree’, 2 ‘disagree’, 3 ‘neither/nor’, 4 ‘agree’,
5 ‘strongly agree’)
Draws on findings that
informed citizens are
more likely to vote
(Meffert, Huber,
Gschwend, & Pappi,
2011) and that supporters
as a lobby group are an
important inform. source
(Preuss, 2004)
Consideropp H10 ‘If Olympia opponents provide me with
arguments relating to the Olympics in [country], I
would take them into consideration.’ (1 ‘strongly
disagree’, 2 ‘disagree’, 3 ‘neither/nor’, 4 ‘agree’,
5 ‘strongly agree’)
see above
Considerfracq H11 ‘If my friends/acquaintances provide me with pro
and contra arguments relating to the Olympics in
the USA, I would take them into consideration.’
(1 ‘strongly disagree’, 2 ‘disagree’, 3
‘neither/nor’, 4 ‘agree’, 5 ‘strongly agree’)
Draws on finding that
opinion on the Olympics
is influenced by friends
and neighbors (Hiller &
Wanner, 2011)
Resource
Age H9 ‘How old are you?’
(‘years’ was displayed next to the survey field)
-
Education H10 ‘What is the highest educational level that you
have attained?’23
Degree names for each
country provided by our
survey partner Nielsen
Household net
income
H11 ‘What is the yearly net income in your entire
household?’ (explanation on response options see
education)
Income categories
provided by our survey
partner Nielsen Gender H12 ‘Please specify your gender.’
(Female/male; male coded as 1 for the analysis in
this study)
-
Pride H13 ‘I would be proud to be a citizen of a country that
hosts the Olympic Games.’
(1 ‘strongly disagree’, 2 ‘disagree’, 3
‘neither/nor’, 4 ‘agree’, 5 ‘strongly agree’)
Builds on finding that
sports/sporting events
can foster pride among
population segments
(Hallmann, Breuer, &
Kühnreich, 2013;
Pawlowski, Downward,
& Rasciute, 2014) Sportconsump H14 ‘How many times per week do you follow sports
news in the media?’
(‘Daily’, ‘6 times per week’, ‘5 times per week’,
‘4 times per week’, ‘3 times per week’, ‘2 times
per week’, ‘Once a week’, ‘Less than once a
week’, ‘I do not follow any sports in the media’)
Draws on finding that
media exposure can
influence voter turnout
(Gerber et al., 2009)
23 Response options are based on the different educational systems in each country. To allow for
comparisons, responses are transformed into a low, medium and high format.

Paper III – Referenda on hosting the Olympics: What drives voter turnout?
Appendix
85
Appendix 5 – Overview: comparison of alternative models
All countries AT CH ESP FRA GER GRE
Model component to be varied
(linear to quadratic to cubic)
Support Optimism Support Optimism Support Optimism Support Optimism Support Optimism Support Optimism Support Optimism
Significance of support/optimism
regression coefficients
Linear model x ✓ x x x x x x x x x x ✓ x Quadratic model ✓ ✓ ✓ x ✓ x ✓ ✓ ✓ ✓ ✓ x ✓ x Cubic Model ✓ x ✓ x x x ✓ x x x x x x x Adjusted R² Linear model 0.184 0.210 0.207 0.229 0.227 0.257 0.170 0.187 0.139 0.149 0.191 0.200 0.125 0.145 Quadratic model 0.213 0.213 0.229 0.229 0.257 0.257 0.198 0.198 0.153 0.153 0.199 0.199 0.144 0.144 Cubic model 0.213 0.213 0.231 0.228 0.256 0.257 0.205 0.197 0.153 0.152 0.199 0.199 0.144 0.144
IT NOR POL SWE UK USA
Model component to be varied
(linear to quadratic to cubic)
Support Optimism Support Optimism Support Optimism Support Optimism Support Optimism Support Optimism
Significance of support/optimism
regression coefficients
Linear model x x ✓ x x x ✓ x ✓ x x ✓ Quadratic model ✓ ✓ ✓ x ✓ x ✓ x ✓ ✓ ✓ ✓ Cubic Model x x x x x x ✓ x x x x x
Adjusted R² Linear model 0.120 0.130 0.267 0.347 0.219 0.247 0.212 0.232 0.206 0.227 0.322 0.330 Quadratic model 0.132 0.132 0.346 0.346 0.247 0.247 0.235 0.235 0.232 0.232 0.338 0.338 Cubic model 0.133 0.133 0.347 0.346 0.246 0.247 0.238 0.235 0.231 0.232 0.337 0.338
Notes: Details on the model comparisons can be found in Appendices 6a-c and 7a-c.
Country abbreviations: AT = Austria, CH = Switzerland, ESP = Spain, FRA = France, GER = Germany, GRE = Greece, IT = Italy, NOR = Norway, POL = Poland, SWE = Sweden, UK = United Kingdom and USA = United States of America.

Paper III – Referenda on hosting the Olympics: What drives voter turnout?
Appendix
86
Appendix 6a –Comparison of alternative support models
All countries AT CH ESP FRA Variables Linear Quadratic Cubic Linear Quadratic Cubic Linear Quadratic Cubic Linear Quadratic Cubic Linear Quadratic Cubic Rational choice factors
Support 0.010 -0.671*** -1.095*** 0.028 -0.599*** -1.446** 0.027 -0.642*** -0.962* 0.031 -0.689*** -2.230*** 0.012 -0.495*** -1.093† Support##Support - 0.113*** 0.269*** - 0.110*** 0.430* - 0.113*** 0.233 - 0.116*** 0.673*** - 0.087*** 0.306 Support##Support##Support - - -0.017** - - -0.035† - - -0.013 - - -0.059** - - -0.024 Economic motivation Tax 0.025** 0.024** 0.024** -0.051 -0.048 -0.051 0.037 0.046† 0.045† 0.043 0.041 0.041 0.015 0.014 0.013 Transparency 0.072*** 0.065*** 0.066*** 0.170*** 0.163*** 0.165*** 0.134** 0.130** 0.132** 0.115* 0.101* 0.102* 0.078† 0.067 0.067 Fairshare 0.026* 0.024* 0.023* 0.103* 0.092* 0.090* -0.010 -0.015 -0.015 0.042 0.036 0.035 -0.007 -0.010 -0.011 Econimpulses -0.008 -0.011 -0.011 0.039 0.036 0.036 0.023 0.009 0.009 -0.021 -0.030 -0.021 -0.007 -0.001 -0.002 Infrastructure 0.101*** 0.096*** 0.097*** 0.096* 0.105* 0.109* 0.141*** 0.147*** 0.148*** 0.021 0.026 0.020 0.150** 0.136* 0.138* Social motivation Community -0.031* -0.026* -0.026* -0.028 -0.015 -0.014 -0.009 0.005 0.004 -0.028 -0.028 -0.031 -0.037 -0.033 -0.033 Reputation 0.022 0.027† 0.027† -0.062 -0.056 -0.055 0.033 0.037 0.038 0.070 0.080 0.087† -0.003 0.008 0.010 Sportsculture 0.011 0.021 0.022† 0.043 0.053 0.057 -0.041 -0.020 -0.020 -0.043 -0.034 -0.032 0.063 0.067 0.069 Importance 0.070*** 0.045*** 0.044*** 0.071* 0.04 0.039 0.063* 0.033 0.033 0.074* 0.040 0.041 0.117** 0.095** 0.092* Delegation -0.053*** -0.044*** -0.044*** -0.102*** -0.104*** -0.100*** -0.092*** -0.078** -0.077** -0.021 -0.017 -0.021 -0.027 -0.024 -0.022 Psychological factors Optimism -0.648*** -0.474*** -0.478*** -0.372 -0.224 -0.201 -0.487 -0.277 -0.313 -1.323*** -1.243*** -1.297*** -0.906* -0.794* -0.813* Optimism##Optimism 0.108*** 0.080*** 0.080*** 0.057 0.033 0.030 0.080 0.048 0.053 0.204*** 0.190*** 0.198*** 0.156** 0.138* 0.141* Mobilization factors Considersupp 0.007 0.015 0.016 -0.067 -0.048 -0.049 -0.032 -0.031 -0.030 -0.012 0.016 0.021 0.024 0.020 0.026 Consideropp 0.080*** 0.085*** 0.084*** 0.080 0.071 0.075 0.116** 0.113** 0.113** 0.112* 0.111* 0.112* 0.140** 0.155*** 0.151** Considerfracq 0.063*** 0.057*** 0.057*** 0.197*** 0.187*** 0.183*** 0.058 0.062 0.061 -0.015 -0.017 -0.019 -0.022 -0.024 -0.024 Resource factors Age 0.007*** 0.006*** 0.006*** 0.005† 0.004 0.004 0.008*** 0.008*** 0.007*** 0.005† 0.005† 0.005† 0.000 0.001 0.001 Gender (male = 1) 0.053** 0.029 0.029 0.083 0.07 0.059 0.050 0.023 0.020 -0.047 -0.083 -0.084 0.043 0.031 0.026 Education Medium 0.121*** 0.129*** 0.129*** 0.188† 0.185† 0.185† 0.010 0.027 0.028 0.331** 0.331** 0.324** 0.118 0.127 0.126 High 0.217*** 0.219*** 0.219*** 0.044 0.061 0.062 0.147* 0.159* 0.158* 0.379*** 0.363** 0.361** 0.096 0.094 0.093 Household net income Medium 0.085*** 0.078*** 0.078*** 0.038 0.036 0.032 0.126† 0.117† 0.118† 0.023 0.009 0.009 0.035 0.057 0.055 High 0.101*** 0.090*** 0.090*** 0.136 0.149† 0.146† 0.112 0.103 0.103 0.042 0.050 0.044 0.112 0.113 0.114 Nationalpride 0.063*** 0.062*** 0.062*** -0.039 -0.046 -0.049 0.023 0.019 0.018 0.161*** 0.147*** 0.139** 0.049 0.041 0.04 Sportconsump 0.102*** 0.087*** 0.086*** 0.121*** 0.114*** 0.115*** 0.129*** 0.111*** 0.111*** 0.055† 0.033 0.030 0.090** 0.077* 0.078* Adjusted R² 0.184 0.213 0.213 0.207 0.229 0.231 0.227 0.257 0.256 0.17 0.198 0.205 0.139 0.153 0.153
Notes: *** represents statistical significance at the 0.1% (p < .001), ** at the 1% (p < .01), * at the 5% (p < .05) and † at the 10% (p < .1) level.
Country abbreviations: AT = Austria, CH = Switzerland, ESP = Spain, FRA = France, GER = Germany, GRE = Greece, IT = Italy, NOR = Norway, POL = Poland, SWE = Sweden, UK = United Kingdom and USA = United States of America.

Paper III – Referenda on hosting the Olympics: What drives voter turnout?
Appendix
87
Appendix 6b –Comparison of alternative support models
GER GRE IT NOR POL
Variables Linear Quadratic Cubic Linear Quadratic Cubic Linear Quadratic Cubic Linear Quadratic Cubic Linear Quadratic Cubic Rational choice factors
Support 0.009 -0.372** -0.377 0.073† -0.498*** -0.732 -0.001 -0.417*** 0.108 -0.096** -1.273*** -1.686*** 0.003 -0.717*** -0.381 Support##Support - 0.065*** 0.067 - 0.096*** 0.184 - 0.070*** -0.125 - 0.202*** 0.361* - 0.112*** -0.006 Support##Support##Support - - 0.000 - - -0.010 - - 0.021 - - -0.018 - - 0.012 Economic motivation Tax 0.049 0.049 0.049 0.003 0.001 0.001 0.051 0.048 0.050 0.145*** 0.129*** 0.128*** 0.017 0.007 0.007 Transparency 0.041 0.039 0.039 -0.023 -0.028 -0.027 0.144** 0.141** 0.138** 0.096** 0.078** 0.077** 0.104* 0.081* 0.082* Fairshare 0.072† 0.065† 0.065† -0.027 -0.028 -0.029 0.061 0.060 0.060 0.016 0.020 0.019 0.033 0.028 0.028 Econimpulses -0.024 -0.030 -0.030 -0.035 -0.026 -0.026 -0.069† -0.072† -0.073* 0.004 -0.003 -0.002 0.058 0.062 0.063 Infrastructure 0.177*** 0.173*** 0.173*** 0.034 0.034 0.033 0.129** 0.126** 0.123** 0.053 0.040 0.041 0.059 0.067 0.064 Social motivation Community 0.016 0.024 0.024 -0.024 -0.027 -0.026 -0.119** -0.125** -0.123** -0.008 -0.021 -0.020 -0.017 -0.007 -0.008 Reputation 0.025 0.029 0.029 0.105* 0.102* 0.102* -0.006 -0.001 0.001 -0.002 0.006 0.004 -0.057 -0.052 -0.051 Sportsculture -0.035 -0.023 -0.023 0.032 0.032 0.031 0.030 0.042 0.039 0.049 0.051 0.054 0.018 0.011 0.008 Importance 0.095** 0.068* 0.068* 0.059† 0.053 0.054 0.000 -0.010 -0.011 0.205*** 0.149*** 0.150*** 0.069* 0.046 0.046 Delegation -0.072** -0.066* -0.066* -0.027 -0.02 -0.020 -0.007 -0.007 -0.008 -0.127*** -0.091*** -0.092*** -0.032 -0.025 -0.025 Psychological factors Optimism 0.072 0.131 0.131 0.062 0.288 0.295 -0.512* -0.428† -0.428† -0.928* -0.315 -0.316 -0.431 -0.220 -0.222 Optimism##Optimism -0.001 -0.011 -0.011 0.003 -0.033 -0.034 0.084* 0.071† 0.071† 0.142* 0.043 0.043 0.074 0.042 0.042 Mobilization factors Considersupp -0.016 -0.004 -0.004 -0.020 -0.020 -0.018 0.048 0.055 0.054 0.058 0.076* 0.077* 0.041 0.047 0.045 Consideropp 0.118* 0.118* 0.118* 0.080† 0.095* 0.094* -0.015 -0.018 -0.016 0.126** 0.130*** 0.128** 0.076* 0.077* 0.077* Considerfracq -0.001 -0.008 -0.008 0.042 0.031 0.032 0.048 0.042 0.041 -0.041 -0.024 -0.023 0.056 0.058 0.058 Resource factors Age 0.008** 0.008** 0.008** 0.010** 0.009** 0.009** 0.001 0.001 0.001 0.008*** 0.007*** 0.007*** 0.001 0.001 0.001 Gender (male = 1) 0.191** 0.178** 0.178** 0.115† 0.095 0.094 -0.079 -0.076 -0.077 0.126* 0.063 0.064 0.072 0.047 0.047 Education Medium 0.000 -0.002 -0.002 0.161 0.150 0.150 0.125 0.099 0.100 0.191 0.188 0.189 0.007 0.067 0.062 High 0.167 0.155 0.155 0.315 0.305 0.304 0.175 0.147 0.152 0.343* 0.343** 0.345** 0.057 0.109 0.105 Household net income Medium 0.116 0.109 0.109 0.167* 0.170* 0.170* 0.012 0.010 0.013 0.080 0.082 0.081 0.116† 0.113† 0.114† High 0.165† 0.154† 0.154† -0.178 -0.158 -0.161 -0.046 -0.055 -0.056 0.143† 0.105 0.108 0.166* 0.159* 0.160* Nationalpride 0.066 0.065 0.065 0.039 0.046 0.047 0.104** 0.115** 0.114** 0.033 0.056 0.058 0.108* 0.114* 0.115* Sportconsump 0.053 0.046 0.046 0.098** 0.087** 0.087** 0.072** 0.061* 0.062* 0.147*** 0.115*** 0.115*** 0.146*** 0.130*** 0.130*** Adjusted R² 0.191 0.199 0.199 0.125 0.144 0.144 0.120 0.132 0.133 0.267 0.346 0.347 0.219 0.247 0.246
Notes: *** represents statistical significance at the 0.1% (p < .001), ** at the 1% (p < .01), * at the 5% (p < .05) and † at the 10% (p < .1) level.
Country abbreviations: AT = Austria, CH = Switzerland, ESP = Spain, FRA = France, GER = Germany, GRE = Greece, IT = Italy, NOR = Norway, POL = Poland, SWE = Sweden, UK = United Kingdom and USA = United States of America.
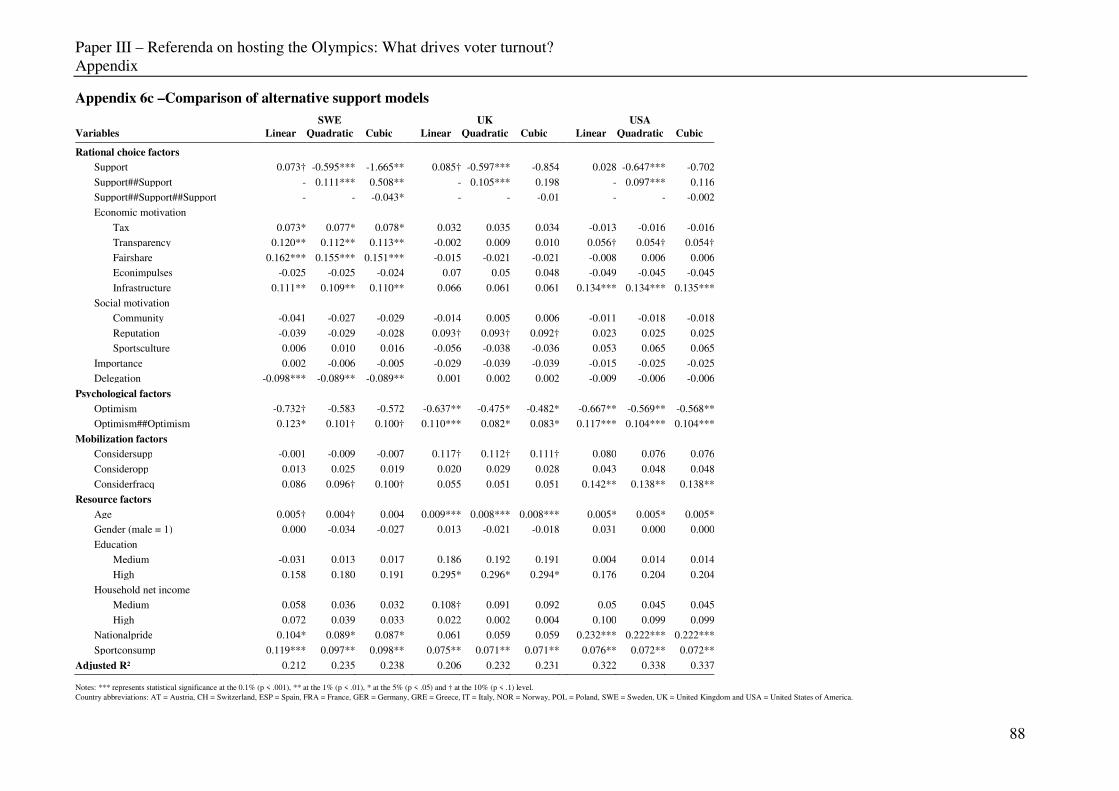
Paper III – Referenda on hosting the Olympics: What drives voter turnout?
Appendix
88
Appendix 6c –Comparison of alternative support models
SWE UK USA
Variables Linear Quadratic Cubic Linear Quadratic Cubic Linear Quadratic Cubic Rational choice factors
Support 0.073† -0.595*** -1.665** 0.085† -0.597*** -0.854 0.028 -0.647*** -0.702 Support##Support - 0.111*** 0.508** - 0.105*** 0.198 - 0.097*** 0.116 Support##Support##Support - - -0.043* - - -0.01 - - -0.002 Economic motivation Tax 0.073* 0.077* 0.078* 0.032 0.035 0.034 -0.013 -0.016 -0.016 Transparency 0.120** 0.112** 0.113** -0.002 0.009 0.010 0.056† 0.054† 0.054† Fairshare 0.162*** 0.155*** 0.151*** -0.015 -0.021 -0.021 -0.008 0.006 0.006 Econimpulses -0.025 -0.025 -0.024 0.07 0.05 0.048 -0.049 -0.045 -0.045 Infrastructure 0.111** 0.109** 0.110** 0.066 0.061 0.061 0.134*** 0.134*** 0.135*** Social motivation Community -0.041 -0.027 -0.029 -0.014 0.005 0.006 -0.011 -0.018 -0.018 Reputation -0.039 -0.029 -0.028 0.093† 0.093† 0.092† 0.023 0.025 0.025 Sportsculture 0.006 0.010 0.016 -0.056 -0.038 -0.036 0.053 0.065 0.065 Importance 0.002 -0.006 -0.005 -0.029 -0.039 -0.039 -0.015 -0.025 -0.025 Delegation -0.098*** -0.089** -0.089** 0.001 0.002 0.002 -0.009 -0.006 -0.006 Psychological factors Optimism -0.732† -0.583 -0.572 -0.637** -0.475* -0.482* -0.667** -0.569** -0.568** Optimism##Optimism 0.123* 0.101† 0.100† 0.110*** 0.082* 0.083* 0.117*** 0.104*** 0.104*** Mobilization factors Considersupp -0.001 -0.009 -0.007 0.117† 0.112† 0.111† 0.080 0.076 0.076 Consideropp 0.013 0.025 0.019 0.020 0.029 0.028 0.043 0.048 0.048 Considerfracq 0.086 0.096† 0.100† 0.055 0.051 0.051 0.142** 0.138** 0.138** Resource factors Age 0.005† 0.004† 0.004 0.009*** 0.008*** 0.008*** 0.005* 0.005* 0.005* Gender (male = 1) 0.000 -0.034 -0.027 0.013 -0.021 -0.018 0.031 0.000 0.000 Education Medium -0.031 0.013 0.017 0.186 0.192 0.191 0.004 0.014 0.014 High 0.158 0.180 0.191 0.295* 0.296* 0.294* 0.176 0.204 0.204 Household net income Medium 0.058 0.036 0.032 0.108† 0.091 0.092 0.05 0.045 0.045 High 0.072 0.039 0.033 0.022 0.002 0.004 0.100 0.099 0.099 Nationalpride 0.104* 0.089* 0.087* 0.061 0.059 0.059 0.232*** 0.222*** 0.222*** Sportconsump 0.119*** 0.097** 0.098** 0.075** 0.071** 0.071** 0.076** 0.072** 0.072** Adjusted R² 0.212 0.235 0.238 0.206 0.232 0.231 0.322 0.338 0.337
Notes: *** represents statistical significance at the 0.1% (p < .001), ** at the 1% (p < .01), * at the 5% (p < .05) and † at the 10% (p < .1) level.
Country abbreviations: AT = Austria, CH = Switzerland, ESP = Spain, FRA = France, GER = Germany, GRE = Greece, IT = Italy, NOR = Norway, POL = Poland, SWE = Sweden, UK = United Kingdom and USA = United States of America.

Paper III – Referenda on hosting the Olympics: What drives voter turnout?
Appendix
89
Appendix 7a –Comparison of alternative optimism models
All countries AT CH ESP FRA
Variables Linear Quadratic Cubic Linear Quadratic Cubic Linear Quadratic Cubic Linear Quadratic Cubic Linear Quadratic Cubic Rational choice factors
Support -0.693*** -0.671*** -0.671*** -0.607*** -0.599*** -0.600*** -0.652*** -0.642*** -0.638*** -0.707*** -0.689*** -0.689*** -0.520*** -0.495*** -0.496*** Support##Support 0.117*** 0.113*** 0.113*** 0.111*** 0.110*** 0.110*** 0.115*** 0.113*** 0.113*** 0.120*** 0.116*** 0.116*** 0.090*** 0.087*** 0.087*** Economic motivation Tax 0.024** 0.024** 0.024** -0.048 -0.048 -0.048 0.045† 0.046† 0.045† 0.037 0.041 0.041 0.016 0.014 0.015 Transparency 0.067*** 0.065*** 0.065*** 0.165*** 0.163*** 0.163*** 0.131** 0.130** 0.132** 0.115* 0.101* 0.102* 0.071 0.067 0.067 Fairshare 0.024* 0.024* 0.024* 0.092* 0.092* 0.092* -0.014 -0.015 -0.015 0.037 0.036 0.035 -0.010 -0.010 -0.011 Econimpulses -0.012 -0.011 -0.011 0.035 0.036 0.036 0.010 0.009 0.009 -0.023 -0.030 -0.030 0.001 -0.001 -0.001 Infrastructure 0.099*** 0.096*** 0.096*** 0.105* 0.105* 0.105* 0.149*** 0.147*** 0.150*** 0.024 0.026 0.026 0.138* 0.136* 0.136* Social motivation Community -0.027* -0.026* -0.026* -0.016 -0.015 -0.014 0.005 0.005 0.004 -0.031 -0.028 -0.028 -0.028 -0.033 -0.033 Reputation 0.028* 0.027† 0.027* -0.053 -0.056 -0.056 0.037 0.037 0.035 0.078 0.080 0.081 0.007 0.008 0.009 Sportsculture 0.022† 0.021 0.021 0.052 0.053 0.053 -0.020 -0.020 -0.019 -0.030 -0.034 -0.034 0.072 0.067 0.069 Importance 0.042*** 0.045*** 0.045*** 0.039 0.040 0.040 0.032 0.033 0.034 0.031 0.040 0.039 0.091* 0.095** 0.096** Delegation -0.048*** -0.044*** -0.044*** -0.105*** -0.104*** -0.103*** -0.080** -0.078** -0.078** -0.023 -0.017 -0.017 -0.036 -0.024 -0.023 Psychological factors Optimism 0.043** -0.474*** -0.884** -0.002 -0.224 -0.764 0.053 -0.277 1.561 0.016 -1.243*** -0.772 0.053 -0.794* 0.052 Optimism##Optimism - 0.080*** 0.218* - 0.033 0.211 - 0.048 -0.515 - 0.190*** 0.036 - 0.138* -0.163 Optimism##Optimism##Optimism - - -0.015 - - -0.019 - - 0.055 - - 0.016 - - 0.034 Mobilization factors Considersupp 0.014 0.015 0.015 -0.049 -0.048 -0.049 -0.032 -0.031 -0.032 0.014 0.016 0.016 0.019 0.020 0.017 Consideropp 0.084*** 0.085*** 0.085*** 0.072 0.071 0.072 0.113** 0.113** 0.113** 0.105* 0.111* 0.111* 0.160*** 0.155*** 0.157*** Considerfracq 0.058*** 0.057*** 0.057*** 0.187*** 0.187*** 0.187*** 0.063 0.062 0.063 -0.007 -0.017 -0.018 -0.028 -0.024 -0.023 Resource factors Age 0.006*** 0.006*** 0.006*** 0.004 0.004 0.004 0.007** 0.008*** 0.007** 0.005† 0.005† 0.005† 0.001 0.001 0.001 Gender (male = 1) 0.027 0.029 0.029 0.069 0.070 0.069 0.024 0.023 0.020 -0.094 -0.083 -0.084 0.029 0.031 0.032 Education Medium 0.131*** 0.129*** 0.129*** 0.188† 0.185† 0.184† 0.030 0.027 0.025 0.328** 0.331** 0.332** 0.126 0.127 0.126 High 0.222*** 0.219*** 0.219*** 0.065 0.061 0.059 0.158* 0.159* 0.159* 0.368** 0.363** 0.365** 0.099 0.094 0.093 Household net income Medium 0.076*** 0.078*** 0.078*** 0.035 0.036 0.037 0.116† 0.117† 0.121† 0.013 0.009 0.010 0.041 0.057 0.058 High 0.091*** 0.090*** 0.090*** 0.150† 0.149† 0.151† 0.111 0.103 0.103 0.034 0.050 0.051 0.113 0.113 0.110 Nationalpride 0.061*** 0.062*** 0.062*** -0.046 -0.046 -0.046 0.018 0.019 0.018 0.146*** 0.147*** 0.147*** 0.041 0.041 0.041 Sportconsump 0.085*** 0.087*** 0.087*** 0.112*** 0.114*** 0.113*** 0.109*** 0.111*** 0.110*** 0.034 0.033 0.033 0.075* 0.077* 0.078* Adjusted R² 0.210 0.213 0.213 0.229 0.229 0.228 0.257 0.257 0.257 0.187 0.198 0.197 0.149 0.153 0.152
Notes: *** represents statistical significance at the 0.1% (p < .001), ** at the 1% (p < .01), * at the 5% (p < .05) and † at the 10% (p < .1) level.
Country abbreviations: AT = Austria, CH = Switzerland, ESP = Spain, FRA = France, GER = Germany, GRE = Greece, IT = Italy, NOR = Norway, POL = Poland, SWE = Sweden, UK = United Kingdom and USA = United States of America.

Paper III – Referenda on hosting the Olympics: What drives voter turnout?
Appendix
90
Appendix 7b –Comparison of alternative optimism models
GER GRE IT NOR POL
Variables Linear Quadratic Cubic Linear Quadratic Cubic Linear Quadratic Cubic Linear Quadratic Cubic Linear Quadratic Cubic Rational choice factors
Support -0.371** -0.372** -0.372** -0.487*** -0.498*** -0.494*** -0.436*** -0.417*** -0.423*** -1.285*** -1.273*** -1.273*** -0.729*** -0.717*** -0.712*** Support##Support 0.065*** 0.065*** 0.065*** 0.094*** 0.096*** 0.095*** 0.073*** 0.070*** 0.071*** 0.204*** 0.202*** 0.202*** 0.114*** 0.112*** 0.112*** Economic motivation Tax 0.049 0.049 0.049 0.000 0.001 0.000 0.050 0.048 0.046 0.130*** 0.129*** 0.129*** 0.007 0.007 0.005 Transparency 0.039 0.039 0.039 -0.029 -0.028 -0.030 0.145** 0.141** 0.142** 0.078** 0.078** 0.078** 0.081* 0.081* 0.078† Fairshare 0.065† 0.065† 0.065† -0.026 -0.028 -0.028 0.065† 0.060 0.059 0.020 0.020 0.020 0.029 0.028 0.030 Econimpulses -0.030 -0.030 -0.030 -0.025 -0.026 -0.024 -0.072† -0.072† -0.072† -0.003 -0.003 -0.003 0.062 0.062 0.061 Infrastructure 0.172*** 0.173*** 0.173*** 0.034 0.034 0.036 0.128** 0.126** 0.122** 0.041 0.040 0.040 0.068 0.067 0.070 Social motivation Community 0.023 0.024 0.024 -0.026 -0.027 -0.027 -0.127** -0.125** -0.124** -0.021 -0.021 -0.020 -0.008 -0.007 -0.006 Reputation 0.030 0.029 0.029 0.102* 0.102* 0.102* -0.004 -0.001 0.000 0.007 0.006 0.006 -0.051 -0.052 -0.056 Sportsculture -0.023 -0.023 -0.023 0.030 0.032 0.032 0.046 0.042 0.044 0.051 0.051 0.051 0.011 0.011 0.013 Importance 0.068* 0.068* 0.067* 0.053 0.053 0.052 -0.011 -0.010 -0.011 0.148*** 0.149*** 0.149*** 0.046 0.046 0.046 Delegation -0.065* -0.066* -0.066* -0.020 -0.020 -0.020 -0.013 -0.007 -0.006 -0.093*** -0.091*** -0.092*** -0.026 -0.025 -0.024 Psychological factors Optimism 0.060 0.131 0.345 0.064 0.288 -1.271 0.014 -0.428† -1.566† -0.052 -0.315 0.524 0.062 -0.220 -2.203 Optimism##Optimism - -0.011 -0.083 - -0.033 0.474 - 0.071† 0.470† - 0.043 -0.248 - 0.042 0.658 Optimism##Optimism##Optimism - - 0.008 - - -0.052 - - -0.044 - - 0.032 - - -0.061 Mobilization factors Considersupp -0.004 -0.004 -0.004 -0.020 -0.020 -0.022 0.057 0.055 0.053 0.076* 0.076* 0.076* 0.047 0.047 0.044 Consideropp 0.118* 0.118* 0.118* 0.094* 0.095* 0.095* -0.023 -0.018 -0.016 0.130*** 0.130*** 0.132*** 0.075* 0.077* 0.078* Considerfracq -0.008 -0.008 -0.008 0.033 0.031 0.032 0.042 0.042 0.046 -0.025 -0.024 -0.025 0.061 0.058 0.059 Resource factors Age 0.008** 0.008** 0.008** 0.009** 0.009** 0.009** 0.001 0.001 0.000 0.007*** 0.007*** 0.007*** 0.001 0.001 0.001 Gender (male = 1) 0.178** 0.178** 0.178** 0.096 0.095 0.100 -0.081 -0.076 -0.078 0.062 0.063 0.064 0.045 0.047 0.050 Education Medium -0.003 -0.002 -0.002 0.149 0.150 0.156 0.101 0.099 0.097 0.188 0.188 0.190 0.062 0.067 0.059 High 0.154 0.155 0.155 0.303 0.305 0.315 0.147 0.147 0.148 0.344** 0.343** 0.344** 0.104 0.109 0.099 Household net income Medium 0.109 0.109 0.109 0.169* 0.170* 0.162* 0.001 0.010 0.010 0.082 0.082 0.084 0.117† 0.113† 0.112† High 0.154† 0.154† 0.154† -0.157 -0.158 -0.161 -0.058 -0.055 -0.056 0.102 0.105 0.105 0.167* 0.159* 0.154* Nationalpride 0.065 0.065 0.065 0.047 0.046 0.045 0.117** 0.115** 0.115** 0.055 0.056 0.057 0.114* 0.114* 0.113* Sportconsump 0.046 0.046 0.046 0.088** 0.087** 0.086** 0.059* 0.061* 0.060* 0.114*** 0.115*** 0.115*** 0.128*** 0.130*** 0.130*** Adjusted R² 0.200 0.199 0.199 0.145 0.144 0.144 0.130 0.132 0.133 0.347 0.346 0.346 0.247 0.247 0.247
Notes: *** represents statistical significance at the 0.1% (p < .001), ** at the 1% (p < .01), * at the 5% (p < .05) and † at the 10% (p < .1) level.
Country abbreviations: AT = Austria, CH = Switzerland, ESP = Spain, FRA = France, GER = Germany, GRE = Greece, IT = Italy, NOR = Norway, POL = Poland, SWE = Sweden, UK = United Kingdom and USA = United States of America.

Paper III – Referenda on hosting the Olympics: What drives voter turnout?
Appendix
91
Appendix 7c –Comparison of alternative optimism models
SWE UK USA
Variables Linear Quadratic Cubic Linear Quadratic Cubic Linear Quadratic Cubic Rational choice factors
Support -0.616*** -0.595*** -0.596*** -0.640*** -0.597*** -0.597*** -0.686*** -0.647*** -0.649*** Support##Support 0.115*** 0.111*** 0.111*** 0.112*** 0.105*** 0.105*** 0.104*** 0.097*** 0.098*** Economic motivation Tax 0.075* 0.077* 0.078* 0.032 0.035 0.035 -0.021 -0.016 -0.018 Transparency 0.115** 0.112** 0.111** 0.006 0.009 0.009 0.058† 0.054† 0.054† Fairshare 0.163*** 0.155*** 0.157*** -0.02 -0.021 -0.023 0.007 0.006 0.006 Econimpulses -0.034 -0.025 -0.024 0.053 0.050 0.049 -0.044 -0.045 -0.047 Infrastructure 0.118** 0.109** 0.109** 0.069 0.061 0.060 0.142*** 0.134*** 0.137*** Social motivation Community -0.030 -0.027 -0.028 -0.003 0.005 0.004 -0.021 -0.018 -0.019 Reputation -0.027 -0.029 -0.031 0.094† 0.093† 0.095† 0.028 0.025 0.026 Sportsculture 0.010 0.010 0.012 -0.031 -0.038 -0.038 0.066 0.065 0.067† Importance -0.005 -0.006 -0.004 -0.048 -0.039 -0.039 -0.040 -0.025 -0.024 Delegation -0.095*** -0.089** -0.090** 0.000 0.002 0.001 -0.015 -0.006 -0.006 Psychological factors Optimism 0.074 -0.583 0.591 0.022 -0.475* -1.368† 0.103** -0.569** -1.396† Optimism##Optimism - 0.101† -0.290 - 0.082* 0.401 - 0.104*** 0.388 Optimism##Optimism##Optimism - - 0.041 - - -0.036 - - -0.030 Mobilization factors Considersupp -0.012 -0.009 -0.008 0.105 0.112† 0.114† 0.083 0.076 0.079 Consideropp 0.023 0.025 0.024 0.027 0.029 0.029 0.043 0.048 0.046 Considerfracq 0.094† 0.096† 0.094† 0.059 0.051 0.048 0.132** 0.138** 0.138** Resource factors Age 0.005† 0.004† 0.005† 0.008*** 0.008*** 0.008*** 0.005* 0.005* 0.004* Gender (male = 1) -0.042 -0.034 -0.035 -0.022 -0.021 -0.022 -0.005 0.000 -0.001 Education Medium 0.015 0.013 0.008 0.190 0.192 0.184 -0.007 0.014 0.016 High 0.189 0.180 0.177 0.297* 0.296* 0.289* 0.182 0.204 0.201 Household net income Medium 0.033 0.036 0.035 0.088 0.091 0.093 0.042 0.045 0.044 High 0.028 0.039 0.042 0.005 0.002 0.005 0.099 0.099 0.096 Nationalpride 0.087* 0.089* 0.090* 0.060 0.059 0.061 0.224*** 0.222*** 0.221*** Sportconsump 0.093** 0.097** 0.098** 0.070** 0.071** 0.071** 0.076** 0.072** 0.071** Adjusted R² 0.232 0.235 0.235 0.227 0.232 0.232 0.330 0.338 0.338
Notes: *** represents statistical significance at the 0.1% (p < .001), ** at the 1% (p < .01), * at the 5% (p < .05) and † at the 10% (p < .1) level.
Country abbreviations: AT = Austria, CH = Switzerland, ESP = Spain, FRA = France, GER = Germany, GRE = Greece, IT = Italy, NOR = Norway, POL = Poland, SWE = Sweden, UK = United Kingdom and USA = United States of America.

Paper III – Referenda on hosting the Olympics: What drives voter turnout?
Appendix
92
3.5
4
4.5
5T
urn
ou
t lik
elih
ood
(pre
dic
tion)
1 2 3 4 5
Support for hosting
Austria (AT)
3.5
4
4.5
5
Turn
ou
t lik
elih
ood
(pre
dic
tion)
1 2 3 4 5
Support for hosting
Switzerland (SUI)
3.5
4
4.5
5
Turn
ou
t lik
elih
ood
(pre
dic
tion)
1 2 3 4 5
Support for hosting
Spain (ESP)
3.5
4
4.5
5
Turn
out lik
elih
oo
d (
pre
dic
tion
)
1 2 3 4 5
Support for hosting
France (FRA)
3.5
4
4.5
5T
urn
out lik
elih
oo
d (
pre
dic
tion
)
1 2 3 4 5
Support for hosting
Germany (GER)
3.5
4
4.5
5
Turn
out lik
elih
oo
d (
pre
dic
tion
)
1 2 3 4 5
Support for hosting
Greece (GRE)
Point estimate 95% CI
Appendix 8a – Quadratic effect of support on voter turnout per country

Paper III – Referenda on hosting the Olympics: What drives voter turnout?
Appendix
93
3.5
4
4.5
5T
urn
out lik
elih
ood (
pre
dic
tion)
1 2 3 4 5
Support for hosting
Italy (ITA)
3.5
4
4.5
5
Turn
out lik
elih
ood (
pre
dic
tion)
1 2 3 4 5
Support for hosting
Norway (NOR)
3.5
4
4.5
5
Turn
out lik
elih
ood (
pre
dic
tion)
1 2 3 4 5
Support for hosting
Poland (POL)
3.5
4
4.5
5
Turn
ou
t lik
elih
ood
(pre
dic
tion
)
1 2 3 4 5
Support for hosting
Sweden (SWE)
3.5
4
4.5
5T
urn
ou
t lik
elih
ood
(pre
dic
tion
)
1 2 3 4 5
Support for hosting
United Kingdom (UK)
3.5
4
4.5
5
Turn
ou
t lik
elih
ood
(pre
dic
tion
)
1 2 3 4 5
Support for hosting
United States (USA)
Point estimate 95% CI
Appendix 8b – Quadratic effect of support on voter turnout per country

Paper III – Referenda on hosting the Olympics: What drives voter turnout?
Appendix
94
3.5
4
4.5
5T
urn
out lik
elih
ood (
pre
dic
tion)
1 2 3 4 5
Optimism
Austria (AT)
3.5
4
4.5
5
Turn
out lik
elih
ood (
pre
dic
tion)
1 2 3 4 5
Optimism
Switzerland (SUI)
3.5
4
4.5
5
Turn
out lik
elih
ood (
pre
dic
tion)
1 2 3 4 5
Optimism
Spain (ESP)
3.5
4
4.5
5
Turn
ou
t lik
elih
ood
(pre
dic
tion
)
1 2 3 4 5
Optimism
France (FRA)
3.5
4
4.5
5T
urn
ou
t lik
elih
ood
(pre
dic
tion
)
1 2 3 4 5
Optimism
Germany (GER)
3.5
4
4.5
5
Turn
ou
t lik
elih
ood
(pre
dic
tion
)
1 2 3 4 5
Optimism
Greece (GRE)
Point estimate 95% CI
Appendix 9a – Quadratic effect of optimism on voter turnout per country

Paper III – Referenda on hosting the Olympics: What drives voter turnout?
Appendix
95
3.5
4
4.5
5T
urn
out lik
elih
ood (
pre
dic
tion)
1 2 3 4 5
Optimism
Italy (ITA)
3.5
4
4.5
5
Turn
out lik
elih
ood (
pre
dic
tion)
1 2 3 4 5
Optimism
Norway (NOR)
3.5
4
4.5
5
Turn
out lik
elih
ood (
pre
dic
tion)
1 2 3 4 5
Optimism
Poland (POL)
3.5
4
4.5
5
Turn
ou
t lik
elih
ood
(pre
dic
tion
)
1 2 3 4 5
Optimism
Sweden (SWE)
3.5
4
4.5
5T
urn
ou
t lik
elih
ood
(pre
dic
tion
)
1 2 3 4 5
Optimism
United Kingdom (UK)
3.5
4
4.5
5
Turn
ou
t lik
elih
ood
(pre
dic
tion
)
1 2 3 4 5
Optimism
United States (USA)
Point estimate 95% CI
Appendix 9b – Quadratic effect of optimism on voter turnout per country

Conclusion
96
5 Conclusion

Conclusion
Overall summary
97
5.1 Overall summary
This dissertation’s objective was to gain insight into how individuals decide on their
support for hosting the Olympics at referenda and what determines their turnout at these
referenda. In order to pursue this objective, I analyzed three theoretically relevant
research questions:
Question I: To what extent do economic versus social factors influence individuals’
voting behavior at referenda on hosting the Olympics?
Question II: How do the intuitive and deliberate mental systems of individuals
interact when they decide at referenda on hosting the Olympics?
Question III: What are the determinants of individuals’ voter turnout at referenda on
hosting the Olympics?
These three research questions were addressed in three empirical stand-alone papers,
which contain a thorough discussion of the results and the implications for both research
and practice. The following section provides a condensed summary of the results and
implications.
The first paper of this dissertation addresses research question I by analyzing the
marginal effects of economic and social factors on individuals’ support for hosting the
Olympics. I find that economic factors generally matter for individuals’ decisions on
hosting the Olympics, even though economists are skeptical that hosting the Olympics
has a net economic impact at all (Billings & Holladay, 2012; Mitchell & Stewart, 2015;
Sullivan & Leeds, 2015). From a non-ethical and purely instrumental point of view, it
therefore makes sense that pro-Olympics campaigns keep promising economic benefits
of the Olympics to the electorate. Comparing the effect of economic and social factors,

Conclusion
Overall summary
98
however, shows that more weight in campaigns should be given to social factors. Their
marginal effects are consistently higher than the marginal effects of economic factors.
The second paper complements the findings of paper I and addresses research question
II by directing its focus on the process through which individuals make their hosting
decision at referenda. It integrates affective forecasting and dual process theory to
analyze the interplay of affective and deliberate decision mechanisms. The paper’s
findings indicate that identification has a strong influence on affective decision
components. The latter exert a direct influence on the hosting decision, which is
moderated through a deliberate mechanism described as effortful processing. I thus
conclude a dominant role of the intuitive system for hosting decisions. Hosting
decisions seem to be rather regulated by the deliberate system in the sense of a
watchdog function theorized by Kahneman and Frederick (2002) than driven by it.
These findings can be useful for both practitioners’ short- and long-term strategies to
influence an Olympic referendum. In the short-term before a referendum, they could
benefit from designing pro-Olympic campaigns in a way that they rather prioritize
evoking affective feelings than communicating facts. In the long-term, pro-Olympic
hosting practitioners could benefit from investing into new and existing grassroots
initiatives associated with the Olympics (e.g., “Jugend trainiert für Olympia” in
Germany). Such investments could strengthen the identification of the youth with the
Olympics, which can pay off through affective decision components once the youth is
allowed to vote at referenda.
The third paper of this dissertation addresses research question III by analyzing the
effect of four categories of variables identified by Smets and van Ham (2013) on voter
turnout: rational choice factors, mobilization factors, psychological factors, and
resource factors. Considering that the effects of most psychological and resource factors
Conclusion
Overall summary
99
are largely country-specific, it seems worth focusing on rational choice and
mobilization factors for this short summary section. With respect to the rational choice
factors, I find a u-shaped effect of support on voter turnout across all twelve
participating countries, which suggests that polarization, be it against or for hosting the
Olympics, has a strong effect voter turnout. Practitioners involved in Olympic
campaigns can use this finding strategically to influence referendum outcomes, e.g., by
applying methods such as asymmetric demobilization (see detailed description in
chapter 4). With regards to mobilization factors, I identify an asymmetry between the
effects of opponents’ versus supporters’ arguments for or against hosting the Olympics,
with opponents’ arguments being more likely to influence voter turnout. This finding is
in line with Könecke et al. (2016), who find that supporters of hosting the Olympics in
Munich failed to establish sufficient communication with local residents. I therefore
advocate a further professionalization of pro-Olympic communication plans. Such plans
need to reach a similar quality and probably require similar investments than the
detailed infrastructure and financing plans that were, for example, created for
Hamburg’s 2024 Summer Olympics campaign.
Taken together, the three research papers provide clear answers to all three research
questions. First, social factors are more important than economic factors for individuals’
support of hosting the Olympics. Second, the intuitive system of individuals has a
dominant influence on the decision making process for hosting the Olympics, with
deliberate mechanisms exerting a moderating role. Third, the determinants of voter
turnout are country-specific but generally include rational choice, mobilization,
psychological and resource factors, with the rational choice factor support having a
strong, u-shaped effect across all twelve participating countries.

Conclusion
Research contribution and future directions
100
5.2 Research contribution and future directions
This dissertation contributes to two streams of existing research, the first one being
research on the Olympics in the field of sports economics. Within this field, the focus
has so far mainly been on the economic impact of hosting the Olympics (Schmidt,
2017). Although there are a few studies that focus on social factors associated with a
hosting of the Olympics (see for example, Kaplanidou & Karadakis, 2010), there is no
study that compares the strength of the effect of social factors on an individual’s hosting
decision to the strength of the effect of economic factors. This dissertation closes this
gap and shows, based on a comparison of marginal effects, that social factors have a
stronger influence. This finding hopefully motivates future sports economics research to
advance from a dominant focus on economic factors to a balanced recognition of both
social and economic factors.
Like social factors for the hosting decision itself, the determinants of turnout at Olympic
referenda have received little attention in the Olympics literature. In the political science
literature, in contrast, there is a multitude of studies on turnout (Geys, 2006a). A major
contribution of this dissertation is that it has condensed and transferred the multitude of
studies from political science into a structured model for examining turnout at Olympic
referenda, which can serve as a starting point for future research.
In addition, the identified crucial role of polarization, i.e., the u-shaped effect of
support, and the asymmetry between the influence of supporters’ versus opponents’
arguments on turnout further point at two findings that have been largely overlooked by
sports economists. I hope that this dissertation can instill curiosity and further research
on these two factors.
Beyond its contribution to sports economics, this dissertation contributes to the dual
process theory of decision making. Even though many studies have been conducted on

Conclusion
Research contribution and future directions
101
either the effect of intuitive or deliberate processes of decision making, the interplay of
the two is “understudied” (Mikels et al., 2011, p. 751) and a decade-old call for research
on this interplay by renowned scholars like Loewenstein et al. (2001) has so far
remained unanswered. Paper II of this dissertation contributes to closing this gap by
integrating dual process and affective forecasting theory into a coherent model, which is
tested using population-representative data across twelve countries. This makes Paper
II, to the best of my knowledge, the first academic work that provides generalizable
evidence for Kahneman and Frederick‘s theory (2002) on the regulatory influence of
deliberate decision components on intuitive decision components. It further identifies
identification as an important context-specific antecedent of expected feelings and
provides evidence for a strong role of expected feelings in the decision-making process,
thereby departing from the traditional economics literature that portrays decisions as
occurring in the “emotional vacuum” (Elsbach & Barr, 1999, p. 191) of rational
decision-making.
In addition to its theoretical contributions, this dissertation could provide some
methodological insights. Paper II of this dissertation is, to the best of my knowledge, the
first large-scale application of the latent moderated structural equation (LMS)
procedure, which is not yet integrated into leading statistical software packages such as
STATA 14. Sardeshmukh and Vandenberg (2016) have only recently developed the
LMS procedure to estimate structural equation models with moderated-mediation of
latent variables. I adapted their procedure using the statistics software Mplus to draw
multi-group comparisons and to test for measurement invariance across different
groups. As I found the few existing large-scale measurement invariance studies very
helpful for my own research, I hope that other researchers can likewise benefit from my
work that focuses on a multi-group application of moderated-mediation of latent
variables.

Conclusion
Research contribution and future directions
102
Apart from the contributions, this dissertation has limitations that potentially open new
research opportunities. Four limitations stand out and are worth summarizing. First,
Olympic referenda are a relatively new topic. The theoretical models developed and
tested are based on a transfer from general Olympics literature as well as related fields
such as political science and decision making. The variable selection employed in this
dissertation is thus unlikely to be exhaustive for the specific context of the Olympics.
Future exploratory research is needed to determine and prioritize further Olympic-
specific variables.
Second, the findings of this dissertation are survey-based. Despite a careful participant
selection, anonymity and statistical countermeasures, the findings are not immune to a
certain level of socially desirable responding. I would therefore welcome other research
approaches (e.g., certain types of experiments) that can fully account for such potential
biases.
Third, the geographical focus of this dissertation is on the United States and eleven
democratic European countries. It would be interesting to replicate the analyses in both
non-Western countries with established democracies (e.g., Japan and South Korea) and
without established democracies (e.g., China and Russia). Particularly insightful would
be a comparison of the importance of the different social and economic factors for the
support of hosting the Olympics. Differences could support giving host cities more
freedom in organizing Olympics adapted to local needs as opposed to fulfilling detailed
IOC standards, which have been above 7,000 pages long for hosting the 2022 Winter
Olympics (International Olympic Committee, 2016a).
Fourth, I recognize that the Olympics are a specific event for analyzing decision-
making. It offers the advantage that it is well-know and requires little explanation to

Conclusion
Research contribution and future directions
103
most survey participants. Also, it evokes a broad range of feelings from excitement to
indifference to strong refusal, which avoids a common fallacy of only picking target
events that are clearly positive or negative to all participants (Christophe & Hansenne,
2016). I would nevertheless appreciate to test the findings of this dissertation within the
context of other mega sport events (e.g., the FIFA World Cup) and beyond mega sport
events.
All in all, I would welcome to see more economic research on the Olympics beyond the
economic impact studies that have dominated over the last decade. Broadening the
research focus on the Olympics can help economists to achieve a greater impact among
decision makers (Schmidt, 2017) and to support the Olympics to remain an unparalleled
event promoting sports and peaceful internationalism.

References
104
6 References

References
105
References
Achtziger, A., & Alós-Ferrer, C. (2013). Fast or rational? A response-times study of
Bayesian updating. Management Science, 60(4), 923–938.
Almeida, B. S. de, Coakley, J., Marchi Júnior, W., & Starepravo, F. A. (2012). Federal
government funding and sport: the case of Brazil, 2004–2009. International Journal
of Sport Policy and Politics, 4(3), 411–426.
American Press (1971). Denver Olympics termed wasteful. The Montreal Gazette
(January 12), p. 10.
Arceneaux, K., & Nickerson, D. W. (2009). Who is mobilized to vote? A re‐analysis of
11 field experiments. American Journal of Political Science, 53(1), 1–16.
Arnold, F., & Freier, R. (2016). Only conservatives are voting in the rain: evidence
from German local and state elections. Electoral Studies, 41(1), 216–221.
Ashforth, B. E., Harrison, S. H., & Corley, K. G. (2008). Identification in organizations:
an examination of four fundamental questions. Journal of Management, 34(3), 325–
374.
Associated Press (2015). IOC President Bach: Boston failed to deliver on 'promises' to
USOC during failed 2024 bid. Hartford Courant (July 29, 2015).
Atkinson, G., Mourato, S., Szymanski, S., & Ozdemiroglu, E. (2008). Are we willing to
pay enough to 'back the bid'? Valuing the intangible impacts of London's bid to host
the 2012 Summer Olympic Games. Urban Studies, 45(2), 419–444.
Baade, R. A., & Matheson, V. A. (2016). Going for the gold: the economics of the
Olympics. Journal of Economic Perspectives, 30(2), 201–218.

References
106
Baade, R. A., & Sanderson, A. R. (2012). An analysis of the political economy for
bidding for the Summer Olympic Games: lessons from the Chicago 2016 bid. In W.
Maennig & A. Zimbalist (Eds.), International handbook on the economics of mega
sporting events (pp. 85–107). Northampton, MA: Edward Elgar.
Bagozzi, R., & Yi, Y. (2012). Specification, evaluation, and interpretation of structural
equation models. Journal of the Academy of Marketing Science, 40(1), 8–34.
Barrett, P. (2007). Structural equation modelling: adjudging model fit. Personality and
Individual Differences - Special issue on Structural Equation Modeling, 42(5), 815–
824.
Bennett, S. E., & Resnick, D. (1990). The implications of nonvoting for democracy in
the United States. American Journal of Political Science, 34(3), 771–802.
Bhattacharjee, A., & Mogilner, C. (2014). Happiness from ordinary and extraordinary
experiences. Journal of Consumer Research, 41(1), 1–17.
Billings, S. B., & Holladay, J. S. (2012). Should cities go for the gold? The long-term
impacts of hosting the Olympics. Economic Inquiry, 50(3), 754–772.
Blais, A. (2006). What affects voter turnout? Annual Review of Political Science, 9(1),
111–125.
Boykoff, J. (2014a). A bid for a better Olympics: A game-changing chance to reform
the Olympic Movement. Retrieved from
http://www.nytimes.com/2014/08/14/opinion/a-chance-to-reform-the-olympic-
movement.html?_r=0 (June 14, 2016).
Boykoff, J. (2014b). Activism and the Olympics: dissent at the games in Vancouver and
London. New Brunswick, NJ: Rutgers University Press.

References
107
Brocas, I., & Carrillo, J. D. (2014). Dual-process theories of decision-making: a
selective survey. Journal of Economic Psychology, 41, 45–54.
Carter, T. J., & Gilovich, T. (2012). I am what I do, not what I have: the differential
centrality of experiential and material purchases to the self. Journal of Personality
and Social Psychology, 102(6), 1304–1317.
Casella, A., & Gelman, A. (2008). A simple scheme to improve the efficiency of
referenda. Journal of Public Economics, 92(10-11), 2240–2261.
Chelsom-Pill, C. (2011). Garmisch-Partenkirchen votes to back 2018 Winter Olympic
bid. Retrieved from http://www.dw.com/en/garmisch-partenkirchen-votes-to-back-
2018-winter-olympic-bid/a-15060369 (January 13, 2015).
Cheung, G. W., & Rensvold, R. B. (2002). Evaluating goodness-of-fit indexes for
testing measurement invariance. Structural Equation Modeling, 9(2), 233–255.
Christophe, V., & Hansenne, M. (2016). Dispositional happiness and affective
forecasting: general or specific effect? Journal of Positive Psychology, 11(2), 209–
214.
Churchill, G. A. (1979). A paradigm for developing better measures of marketing
constructs. Journal of Marketing Research, 64–73.
Coates, D., & Wicker, P. (2015). Why were voters against the 2022 Munich Winter
Olympics in a referendum? International Journal of Sport Finance, 10(3), 267–283.
Conroy, S. A., Becker, W. J., & Menges, J. I. (2017). The meaning of my feelings
depends on who I am: work-related identifications shape emotion effects in
organizations. Academy of Management Journal, 60(3), 1071–1093.
Dachs, H., & Floimair, R. (2008). Salzburger Jahrbuch für Politik 2007. Vienna,
Austria: Böhlau.
References
108
Daly, M. C., & Wilson, D. J. (2016). Happiness, unhappiness, and suicide: an empirical
assessment. Journal of the European Economic Association, 7(2-3), 539–549.
Dane, E., & George, J. M. (2014). Unpacking affective forecasting and its ties to project
work in organizations. Academy of Management Review, 39(2), 181–201.
Downs, A. (1957). An economic theory of democracy. New York City, NY: Harper.
Dunn, E. W., & Laham, S. L. (2006). Affective forecasting: a user’s guide to emotional
time travel. In J. P. Forgas (Ed.), Frontiers of social psychology. Affect in social
thinking and behavior (pp. 177–193). New York City, NY: Psychology Press.
Easton, D. (1965). A framework for political analysis. Contemporary political theory.
Englewood Cliffs, NJ: Prentice Hall.
Ebert, J. E., Gilbert, D. T., & Wilson, T. D. (2009). Forecasting and backcasting:
predicting the impact of events on the future. Journal of Consumer Research, 36(3),
353–366.
Elsbach, K. D., & Barr, P. S. (1999). The effects of mood on individuals' use of
structured decision protocols. Organization Science, 10(2), 181–198.
Emery, P. R. (2002). Bidding to host a major sports event: the local organising
committee perspective. International Journal of Public Sector Management, 15(4),
316–335.
Essex, S., & Chalkley, B. (1998). Olympic Games: catalyst of urban change. Leisure
Studies, 17(3), 187–206.
Forgas, J. P. (1989). Mood effects on decision making strategies. Australian Journal of
Psychology, 41(2), 197–214.
Forgeard, M., & Seligman, M. (2012). Seeing the glass half full: a review of the causes
and consequences of optimism. Pratiques Psychologiques, 18(2), 107–120.

References
109
Fornell, C., & Larcker, D. F. (1981). Evaluating structural equation models with
unobservable variables and measurement error. Journal of Marketing Research,
18(1), 39–50.
Fouche, G. (2013). Oslo votes to bid for 2022 Winter Games. Retrieved from
http://www.reuters.com/article/us-olympics-norway-referendum-
idUSBRE98907M20130910 (October 21, 2016).
Fowler, J. H. (2006). Altruism and turnout. The Journal of Politics, 68(3), 674–683.
Franklin, M. N. (1999). Electoral engineering and cross-national turnout differences:
what role for compulsory voting? British Journal of Political Science, 29(1), 205–
216.
Frey, B. S., Oberholzer-Gee, F., & Eichenberger, R. (1996). The old lady visits your
backyard: a tale of morals and markets. Journal of Political Economy, 104(6), 1297–
1313.
Frey, B. S., & Stutzer, A. (2002). Happiness and economics: how the economy and
institutions affect well-being. Princeton, NJ: Princeton University Press.
Frey, B. S., & Stutzer, A. (2010). Happiness and public choice. Public Choice, 144(3-
4), 557–573.
Gawronski, B., & Strack, F. (2004). On the propositional nature of cognitive
consistency: dissonance changes explicit, but not implicit attitudes. Journal of
Experimental Social Psychology, 40(4), 535–542.
Gerber, A. S., Karlan, D., & Bergan, D. (2009). Does the media matter? A field
experiment measuring the effect of newspapers on voting behavior and political
opinions. Applied Economics, 1(2), 35–52.

References
110
Geys, B. (2006a). 'Rational' theories of voter turnout: a review. Political Studies
Review, 4(1), 16–35.
Geys, B. (2006b). Explaining voter turnout: a review of aggregate-level research.
Electoral Studies, 25(4), 637–663.
Gilovich, T., Kumar, A., & Jampol, L. (2015). A wonderful life: experiential
consumption and the pursuit of happiness. Journal of Consumer Psychology, 25(1),
152–165.
Green, D. P., McGrath, M. C., & Aronow, P. M. (2013). Field experiments and the
study of voter turnout. Journal of Elections, Public Opinion and Parties, 23(1), 27–
48.
Hajnal, Z., & Trounstine, J. (2005). Where turnout matters: the consequences of uneven
turnout in city politics. Journal of Politics, 67(2), 515–535.
Hallmann, K., Breuer, C., & Kühnreich, B. (2013). Happiness, pride and elite sporting
success: what population segments gain most from national athletic achievements?
Sport Management Review, 16(2), 226–235.
Hautbois, C., Parent, M. M., & Séguin, B. (2012). How to win a bid for major sporting
events? A stakeholder analysis of the 2018 Olympic Winter Games French bid. Sport
Management Review, 15(3), 263–275.
Hekman, D. R., Steensma, H. K., Bigley, G. A., & Hereford, J. F. (2009). Effects of
organizational and professional identification on the relationship between
administrators' social influence and professional employees' adoption of new work
behavior. Journal of Applied Psychology, 94(5), 1325–1335.
Hiller, H. H., & Wanner, R. A. (2011). Public opinion in host Olympic cities: the case
of the 2010 Vancouver Winter Games. Sociology, 45(5), 883–899.

References
111
Hu, L., & Bentler, P. M. (1999). Cutoff criteria for fit indexes in covariance structure
analysis: conventional criteria versus new alternatives. Structural Equation
Modeling, 6(1), 1–55.
International Olympic Committee. (2016a). Host city contract principles. Retrieved
from https://www.olympic.org/news/ioc-strengthens-its-stance-in-favour-of-human-
rights-and-against-corruption-in-new-host-city-contract (December 12, 2016).
International Olympic Committee. (2016b). Olympic charter. Lausanne, Switzerland:
International Olympic Committee.
Isen, A. M., Shalker, T. E., Clark, M., & Karp, L. (1978). Affect, accessibility of
material in memory, and behavior: a cognitive loop? Journal of Personality and
Social Psychology, 36(1), 1–12.
Jilke, S., Meuleman, B., & van de Walle, S. (2015). We need to compare, but how?
Measurement equivalence in comparative public administration. Public
Administration Review, 75(1), 36–48.
Johnson, E. J., & Tversky, A. (1983). Affect, generalization, and the perception of risk.
Journal of Personality and Social Psychology, 45(1), 20–31.
Jöreskog, K. G. (1971). Simultaneous factor analysis in several populations.
Psychometrika, 36(4), 409–426.
Kahneman, D. (2003). A perspective on judgment and choice: mapping bounded
rationality. The American Psychologist. (9), 697–720.
Kahneman, D. (2012). Thinking, fast and slow. London, UK: Penguin Books.
Kahneman, D., & Frederick, S. (2002). Representativeness revisited: attribute
substitution and intuitive judgment. In T. Gilovich, D. W. Griffin, & D. Kahneman

References
112
(Eds.), Heuristics and biases. The psychology of intuitive judgement (pp. 49–81).
Cambridge, UK: Cambridge University Press.
Kahneman, D., Ritov, I., Jacowitz, K. E., & Grant, P. (1993). Stated willingness to pay
for public goods: a psychological perspective. Psychological Science, 4(5), 310–317.
Kaplanidou, K., & Karadakis, K. (2010). Understanding the legacies of a host Olympic
city: the case of the 2010 Vancouver Olympic Games. Sport Marketing Quarterly,
19(2), 110–118.
Kim, A., Choi, M., & Kaplanidou, K. (2015). The role of media in enhancing people’s
perception of hosting a mega sport event: the case of Pyeongchang's Winter
Olympics bids. International Journal of Sport Communication, 8(1), 68–86.
Kline, R. B. (2005). Principles and practice of structural equation modeling. New York
City, NY: Guildford Press.
Könecke, T., Schubert, M., & Preuss, H. (2016). (N)Olympia in Germany? An analysis
of the referendum against Munich 2022. Sportwissenschaft, 46(1), 15–24.
Konow, J., & Earley, J. (2008). The hedonistic paradox: is homo economicus happier?
Journal of Public Economics, 92(1–2), 1–33.
Krizan, Z., & Sweeny, K. (2013). Causes and consequences of expectation trajectories.
Psychological Science, 24(5), 706–714.
Lam, K., Buehler, R., McFarland, C., Ross, M., & Cheung, I. (2005). Cultural
differences in affective forecasting: the role of focalism. Personality and Social
Psychology Bulletin, 31(9), 1296–1309.
Lamla, M. J., Straub, M., & Girsberger, E. M. (2014). On the economic impact of
international sport events: microevidence from survey data at the EURO 2008.
Applied Economics, 46(13-15), 1693–1703.

References
113
Lauermann, J. (2016a). Boston’s Olympic bid and the evolving urban politics of event-
led development. Urban Geography, 37(2), 1–8.
Lauermann, J. (2016b). Politics as early as possible: democratizing the Olympics by
contesting Olympic bids. In C. Colomb & J. Novy (Eds.), Protest and resistance in
the tourist city (pp. 210–226). New York City, NY: Routledge.
Lenskyj, H., & Wagg, S. (2012). The Palgrave handbook of Olympic studies. New York
City, NY: Palgrave Macmillan.
Loewenstein, G. (2000). Emotions in economic theory and economic behavior. The
American Economic Review. (2), 426–432.
Loewenstein, G. F., Weber, E. U., Hsee, C. K., & Welch, N. (2001). Risk as feelings.
Psychological Bulletin, 127(2), 267–286.
Lucas, R. E. (2005). Time does not heal all wounds: a longitudinal study of reaction and
adaptation to divorce. Psychological Science, 16(12), 945–950.
Lutz, G. (2007). Low turnout in direct democracy. Electoral Studies, 26(3), 624–632.
Mael, F., & Ashforth, B. E. (1992). Alumni and their alma mater: a partial test of the
reformulated model of organizational identification. Journal of Organizational
Behavior, 13(2), 103–123.
Maennig, W., & Zimbalist, A. (Eds.). (2012a). International handbook on the
economics of mega sporting events. Northampton, MA: Edward Elgar.
Maennig, W., & Zimbalist, A. (2012b). Introduction: the economics of mega sporting
events. In W. Maennig & A. Zimbalist (Eds.), International handbook on the
economics of mega sporting events (pp. 3–8). Northampton, MA: Edward Elgar.

References
114
Maennig, W., & Zimbalist, A. (2012c). What is a mega sporting event? In W. Maennig
& A. Zimbalist (Eds.), International handbook on the economics of mega sporting
events (pp. 9–14). Northampton, MA: Edward Elgar.
Mailath, G. J., & Postlewaite, A. (2016). The social context of economic decisions.
Journal of the European Economic Association, 1(2-3), 354–362.
Malfas, M., Houlihan, B., & Theodoraki, E. (2004). Impacts of the Olympic Games as
mega-events. Municipal Engineer. (3), 209–220.
Martin, P. S. (2003). Voting's rewards: voter turnout, attentive publics, and
congressional allocation of federal money. American Journal of Political Science,
47(1), 110–127.
Matsusaka, J. G. (1995). Explaining voter turnout patterns: an information theory.
Public Choice, 84(1), 91–117.
Meade, A. W., Johnson, E. C., & Braddy, P. W. (2008). Power and sensitivity of
alternative fit indices in tests of measurement invariance. Journal of Applied
Psychology, 93(3), 568–592.
Meffert, M. F., Huber, S., Gschwend, T., & Pappi, F. U. (2011). More than wishful
thinking: causes and consequences of voters’ electoral expectations about parties and
coalitions. Electoral Studies, 30(4), 804–815.
Mikels, J. A., Maglio, S. J., Reed, A. E., & Kaplowitz, L. J. (2011). Should I go with
my gut? Investigating the benefits of emotion-focused decision making. Emotion,
11(4), 743–753.
Milfont, T. L., & Fischer, R. (2010). Testing measurement invariance across groups:
applications in cross-cultural research. International Journal of Psychological
Research, 3(1), 111–121.
References
115
Mitchell, H., & Stewart, M. F. (2015). What should you pay to host a party? An
economic analysis of hosting sports mega-events. Applied Economics, 47(15), 1550–
1561.
Mitchell, R. K., Agle, B. R., & Wood, D. J. (1997). Toward a theory of stakeholder
identification and salience: defining the principle of who and what really counts.
Academy of Management Review, 22(4), 853–886.
Moore, J. (2015). When Denver rejected the Olympics in favour of the environment and
economics: Colorado’s biggest city won the bid to host the 1976 Winter Games, but
its citizens decided they had other priorities. Retrieved from
https://www.theguardian.com/sport/blog/2015/apr/07/when-denver-rejected-the-
olympics-in-favour-of-the-environment-and-economics (November 27, 2016).
Nes, L. S., & Segerstrom, S. C. (2006). Dispositional optimism and coping: a meta-
analytic review. Personality and Social Psychology Review, 10(3), 235–251.
O'Reilly, C. A. (1982). Variations in decision makers' use of information sources: the
impact of quality and accessibility of information. Academy of Management Journal,
25(4), 756–771.
Pawlowski, T., Downward, P., & Rasciute, S. (2014). Does national pride from
international sporting success contribute to well-being? An international
investigation. Sport Management Review, 17(2), 121–132.
Preuss, H. (2004). The economics of staging the Olympics: a comparison of the Games
1972-2008. Northampton, MA: Edward Elgar.
Preuss, H., & Solberg, A. H. (2006). Attracting major sporting events: the role of local
residents. European Sport Management Quarterly, 6(4), 391–411.

References
116
Preuss, H., & Werkmann, K. (2011). Experiential value of hosting the 2018 Winter
Olympics in Munich [English title]. Sport und Gesellschaft, 8(2), 97–123.
Raftery, A. E. (1995). Bayesian model selection in social research. Sociological
Methodology, 25, 111–164.
Rauch, W. A., Schweizer, K., & Moosbrugger, H. (2007). Method effects due to social
desirability as a parsimonious explanation of the deviation from unidimensionality in
LOT-R scores. Personality and Individual Differences, 42(8), 1597–1607.
Rhodes, R., & Strain, J. J. (2008). Affective forecasting and its implications for medical
ethics. Cambridge Quarterly of Healthcare Ethics, 17(01), 54–65.
Ritchie, B. W., Shipway, R., & Monica Chien, P. (2010). The role of the media in
influencing residents' support for the 2012 Olympic Games. International Journal of
Event and Festival Management, 1(3), 202–219.
Rutkowski, L., & Svetina, D. (2014). Assessing the hypothesis of measurement
invariance in the context of large-scale international surveys. Educational and
Psychological Measurement, 74(1), 31–57.
Sardeshmukh, S. R., & Vandenberg, R. J. (2016). Integrating moderation and
mediation: a structural equation modeling approach. Organizational Research
Methods, Online first version.
Satorra, A., & Bentler, P. M. (1994). Corrections to test statistics and standard errors in
covariance structure analysis. In A. v. Eye & C. C. Clogg (Eds.), Latent variables
analysis. Applications for developmental research (pp. 399–419). Thousand Oaks,
CA: Sage.

References
117
Scheier, M. F., & Carver, C. S. (1985). Optimism, coping, and health: assessment and
implications of generalized outcome expectancies. Health Psychology, 4(3), 219–
247.
Scheier, M. F., Carver, C. S., & Bridges, M. W. (1994). Distinguishing optimism from
neuroticism (and trait anxiety, self-mastery, and self-esteem): a reevaluation of the
Life Orientation Test. Journal of Personality and Social Psychology, 67(6), 1063–
1078.
Schmidt, S. L. (2017). Hosting the Olympic Games. In B. S. Frey & D. Iselin (Eds.),
Economic ideas you should forget (pp. 119–120). Cham, Switzerland: Springer
International Publishing.
Schmidt, S. L., Schreyer, D., & Streicher, T. (2015). To host or not to host the
Olympics: a transnational perspective. Camp Beckenbauer Research Report (Vol. 1).
Kitzbühel, Austria.
Slovic, P., Finucane, M., Peters, E., & MacGregor, D. G. (2002). Rational actors or
rational fools: implications of the affect heuristic for behavioral economics. Journal
of Socio-Economics, 31, 329–342.
Slovic, P., Flynn, J. H., & Layman, M. (1991). Perceived risk, trust, and the politics of
nuclear waste. Science, 254(5038), 1603–1607.
Smets, K., & van Ham, C. (2013). The embarrassment of riches? A meta-analysis of
individual-level research on voter turnout. Electoral Studies, 32(2), 344–359.
Smith, E. R., & DeCoster, J. (2000). Dual-process models in social and cognitive
psychology: conceptual integration and links to understanding memory systems.
Personality & Social Psychology Review, 4(2), 108–131.

References
118
Stadelmann, D., & Torgler, B. (2013). Bounded rationality and voting decisions over
160 years: voter behavior and increasing complexity in decision-making. PloS ONE,
8(12), 1–8.
Steenkamp, J.-B. E., & Baumgartner, H. (1998). Assessing measurement invariance in
cross-national consumer research. Journal of Consumer Research, 25(1), 78–90.
Strack, F., & Deutsch, R. (2004). Reflective and impulsive determinants of social
behavior. Personality & Social Psychology Review, 8(3), 220–247.
Streicher, T. (2017). Referenda on hosting the Olympics: what drives voter turnout?
Evidence from 12 democratic countries. Unpublished working paper.
Streicher, T., Schmidt, S. L., Schreyer, D., & Torgler, B. (2017a). Anticipated feelings
and the support for public mega projects. Unpublished working paper.
Streicher, T., Schmidt, S. L., Schreyer, D., & Torgler, B. (2017b). Is it the economy,
stupid? The role of social versus economic factors in people’s support for hosting the
Olympic Games: evidence from 12 democratic countries. Applied Economics Letters,
24(3), 170–174.
Sullivan, C., & Leeds, M. A. (2015). Will the games pay? An event analysis of the 2020
Summer Olympics announcement on stock markets in Japan, Spain, and Turkey.
Applied Economics Letters, 23(12), 880–883.
Sunstein, C. R. (2000). Cognition and cost-benefit analysis. Journal of Legal Studies,
29(2), 1059–1103.
Teuffel, F. (2014). Finanzieller Ruin durch Olympische Spiele? Das Gegenteil ist der
Fall. Retrieved from http://www.tagesspiegel.de/sport/dosb-chef-michael-vesper-
finanzieller-ruin-durch-olympische-spiele-das-gegenteil-ist-der-fall/11169028.html
(November 18, 2016).

References
119
The Economist Intelligence Unit. (2014). Democracy index 2013: Democracy in limbo.
A report from The Economist Intelligence Unit, 1–47.
Vieider, F. M., Lefebvre, M., Bouchouicha, R., Chmura, T., Hakimov, R., Krawczyk,
M., & Martinsson, P. (2016). Common components of risk and uncertainty attitudes
across contexts and domains: evidence from 30 Countries. Journal of the European
Economic Association, 13(3), 421–452.
Walton, H., Longo, A., & Dawson, P. (2008). A contingent valuation of the 2012
London Olympic Games. Journal of Sports Economics, 9(3), 304–317.
Westen, D. (2008). The political brain: the role of emotion in deciding the fate of the
nation. New York City, NY: PublicAffairs (Perseus Books Group).
Westerbeek, H. M., Turner, P., & Ingerson, L. (2002). Key success factors in bidding
for hallmark sporting events. International Marketing Review, 19(3), 303–322.
Wheaton, B., Muthén, B., Alwin, D. F., & Summers, G. F. (1977). Assessing reliability
and stability in panel models. In D. R. Heise (Ed.), Sociological Methodology
(pp. 84–136). San Francisco, CA: Jossey-Bass.
Wicker, P., Whitehead, J. C., Mason, D. S., & Johnson, B. K. (2016). Public support for
hosting the Olympic Summer Games in Germany: the CVM approach. Urban
Studies, Online first version.
Wilson, T. D., & Gilbert, D. T. (2003). Affective forecasting. Advances in Experimental
Social Psychology, 35, 345–411.
Wright, W. F., & Bower, G. H. (1992). Mood effects on subjective probability
assessment. Organizational Behavior and Human Decision Processes, 52(2), 276–
291.

References
120
Zajonc, R. B. (1980). Feeling and thinking: preferences need no inferences. American
Psychologist, 35(2), 151–175.
Zorn, T. S., & Martin, D. T. (1986). Optimism and pessimism in political and market
institutions. Public Choice, 49(2), 165–178.

Eidesstattliche Erklärung
Name: ___________________________________ Vorname: ____________________________
Eidesstattliche Erklärung nach §10 Abs. 1 Nr. 6 der Promotionsordnung der WHU
vom 05.03.2008 i. d. F. vom 08.03.2012 Ich erkläre hiermit an Eides Statt, dass ich die bei der Wissenschaftlichen Hochschule für Unternehmensführung (WHU) -Otto-Beisheim-Hochschule-, vorgelegte
Dissertation selbständig und ohne Benutzung anderer als der angegebenen Hilfsmittel angefertigt habe. Die Arbeit wurde bisher in gleicher oder ähnlicher Weise keiner anderen Prüfungsbehörde vorgelegt. Aus fremden Quellen wörtlich oder inhaltlich übernommene Sätze, Textpassagen, Daten oder Konzepte sind unter Angabe der Quelle gekennzeichnet. Ohne Angabe des Ursprungs, auch bei im Internet zugänglichen Quellen, gelten diese als Plagiat. Die WHU - Otto-Beisheim-Hochschule - behält sich vor, eingereichte Arbeiten mit Hilfe einer Plagiaterkennungssoftware zu überprüfen, um sicherzustellen, dass sie rechtmäßig verfasst wurden. Ich bin mit der Überprüfung meiner Arbeit durch eine Plagiaterkennungssoftware einverstanden und werde zu diesem Zweck eine elektronische Version der Dissertation auf einer speziellen Website hochladen um damit die automatisierte Überprüfung auf Plagiate zu ermöglichen. Bei der Auswahl und Auswertung folgenden Materials haben mir die nachstehend aufgeführten Personen in der jeweils beschriebenen Weise entgeltlich / unentgeltlich geholfen:
Name Vorname Art der Hilfestellung entgeltlich / unentgeltlich
Prof. Dr. Schmidt
Sascha L. Feedback im Rahmen seiner Funktion als Doktorvater und Co-Autor einzelner Aufsätze
Unentgeltlich
Jun.-Prof. Dr. Schreyer
Dominik Feedback/Review im Rahmen der Co-Autorenschaft einzelner Aufsätze
Unentgeltlich
Prof. Dr. Torgler
Benno Feedback/Review im Rahmen seiner Co-Autorenschaft einzelner Aufsätze
Unentgeltlich
Weitere Personen waren an der inhaltlich-materiellen Erstellung der vorliegenden Arbeit nicht beteiligt. Insbesondere habe ich hierfür nicht die entgeltliche Hilfe von Vermittlungs- bzw. Beratungsdiensten (Promotionsberater oder anderer Personen) in Anspruch genommen. Niemand hat von mir unmittelbar oder mittelbar geldwerte Leistungen für Arbeiten erhalten, die im Zusammenhang mit dem Inhalt der vorgelegten Dissertation stehen. Die Dissertation enthält keine Teile, die Gegenstand noch laufender oder bereits abgeschlossener Promotionsverfahren sind. Ort, Datum:______________________________________________ Unterschrift:______________________________________________