TO WHAT EXTENT DO INVESTMENT BARRIERS INFLUENCE FDI FLOW ...
26
TO WHAT EXTENT DO INVESTMENT BARRIERS INFLUENCE FDI FLOW INTO CHINA? Vivian Wangari Karanja The People’s Republic of China has recently experienced an incredible rise in FDI inflow despite being totally closed to foreign investors as recently as 1979. Despite this increase, several investment barriers into China persist. Many different authors have empirically investigated the determinants of FDI into developing countries. However, this study employs a panel data method to analyse the relationship between investment barriers and FDI inflows in the time between 2006 and 2014 from a sample of 83 countries. This is done in conjunction with other explanatory variables, namely: GDP, human capital investment, investment in infrastructure, Corporate Tax rate and Real Effective Exchange Rate. This study finds that investment barriers have a negative but statistically insignificant effect on FDI inflows into China.
Transcript of TO WHAT EXTENT DO INVESTMENT BARRIERS INFLUENCE FDI FLOW ...

TO WHAT EXTENT DO INVESTMENT BARRIERS
INFLUENCE FDI FLOW INTO CHINA?
Vivian Wangari Karanja
The People’s Republic of China has recently experienced an incredible rise in FDI inflow despite
being totally closed to foreign investors as recently as 1979. Despite this increase, several
investment barriers into China persist. Many different authors have empirically investigated
the determinants of FDI into developing countries. However, this study employs a panel data
method to analyse the relationship between investment barriers and FDI inflows in the time
between 2006 and 2014 from a sample of 83 countries. This is done in conjunction with other
explanatory variables, namely: GDP, human capital investment, investment in infrastructure,
Corporate Tax rate and Real Effective Exchange Rate. This study finds that investment barriers
have a negative but statistically insignificant effect on FDI inflows into China.

1
1. Introduction
In 2014, the People’s Republic of China (hereafter China) hosted the largest volume of inward Foreign
Direct Investment (FDI) (UNCTAD, 2015). This is remarkable in itself, but is made even more so when
one considers that foreign investors have only been permitted to participate in the Chinese economy
for less than 4 decades. The meteoric rise of China as a host for FDI makes it an interesting topic of
study, especially considering that FDI can act as a vehicle for economic growth (Zhao, 2013). It can be
seen that the initial decision to allow foreign investment in the late 1970s was the single biggest
catalyst in putting China on the path of becoming the greatest destination for foreign investment
today (Coughlin & Segev, 2000). However, the extent of the effect government policy decisions have
on FDI into the country is less obvious in recent times as the liberalisation of the Chinese market has
progressed. Hence there is value in empirically evaluating the extent to which further opening of the
Chinese economy serves to influence inward FDI into China.
Firstly, it is necessary to highlight the nature of investment barriers that exist in China today. A review
of the literature reveals that opaque approval processes, barriers to market access, lack of access to
recourse for disputes and the favouring of domestic competitors present the most significant types of
investment barriers to foreign investors. In turn, it is also important to consider the recognised factors
that are known to contribute to FDI. As there is no theoretical framework that outlines this factor
(Demirhan & Masca, 2008), the existing studies of FDI determinants have tended to be empirical in
nature. In reviewing the literature it can be found that market size and growth rate, characteristics of
the labour force, quality of infrastructure, tax regimes and currency valuation are the most often
considered when evaluating FDI determinants.
The aim of this paper is to empirically evaluate the nature and extent of the effect of investment
barriers on FDI flow into China. In order to do so, a panel data fixed effects model will be employed to
estimate the effect of investment barriers on FDI in conjunction with several other explanatory
variables, namely: GDP, Human Capital Investment, investment in infrastructure, Real Effective
Exchange Rate (REER) and Corporate Tax rate. In addition, a time lag of one year will be included.
Several studies have sought to uncover the underlying factors that contribute to FDI, including for the
specific case of China, as this paper aims to do. However, none have done so by evaluating FDI flows
in the time period of 2006-2014 as this paper aims to do, or have explicitly investigated the effect of
investment barriers in this context. Hence this paper presents a novel approach to evaluating this
topic.
The conclusions found in this study are that the significant determinants of FDI into China over this
time period are GDP and Infrastructure- each with positive effects- and REER with a negative effect.

2
The instrumental variable of investment barriers is found to have a negative but statistically
insignificant effect. However, the high degree of collinearity between several variables presents a
limitation to the inferences that can be drawn from these results. In addition, significant time effects
are found to be present. Hence, I would not totally conclude that investment barriers have no effect
on FDI flows.
2. Institutional background
As a result of the political environment of the cold war era, investment relationships between
mainland China and the rest of the world (particularly Western powers) were virtually non-existent. It
was not until the ‘Law of the People’s Republic of China on Joint Ventures Using Chinese and Foreign
Investment’ was passed in 1979 that foreign investors were first allowed to participate in the Chinese
economy within specifically formed special economic zones, (Coughlin & Segev, 2000). One view of
the motivation behind this decision is the Communist Party of China’s (CCP) aim to legitimise their rule
by delivering economic development and improving standards of living in a time where the Maoist
ideology was losing its appeal (Casarini, 2006). Whether this is the case or not, it is clear that the CCP
came to recognise that the benefits that could be delivered by allowing foreign investment
outweighed the ideological reasons for maintaining a closed border.
China’s 2001 World Trade Organisation (WTO) accession can be seen as another major catalyst in
changing the way foreign investment was received in the country. Initially, entirely foreign owned
companies were not allowed, and as such, foreign investment had to take the form of joint equity
ventures (unless they exported the majority of their products or utilised advanced technology and
equipment) (Guoqiang, 2005). In addition to this, enterprises with foreign ownership were required
to meet performance requirements such as technology transfers and the establishment of Research
and Development centres (Guoqiang, 2005). However, as part of the conditions of its inclusion in the
WTO, the Chinese government was required to implement changes in policies that were viewed to be
inconsistent with WTO rules, such as the aforementioned restrictions, and this allowed for wholly
foreign owned enterprises to be established in the country (Blancher & Rumbaugh, 2004).
Although investment in specific sectors remains prohibited or restricted for foreign investors, the
trend of opening up the Chinese economy has continued. Policies in recent times have also aimed to
further the decentralisation of FDI administration such that it can be carried out on the provincial level
(Davies , 2013). One such change was outlined in a 2011 circular by the Ministry of Commerce of the
People’s Republic of China (MOFCOM) removing the need for additional application processes when
establishing a branch of a foreign enterprise that is not subject to any special requirements (Davies ,
3
2013). Such changes serve to indicate that the CCP is still implementing policy changes with the aim
of decreasing investment barriers into the country and promoting FDI inflow. The government also
released a State Council circular in 2010 reiterating its aim to use foreign investment to boost
technological innovation and promote development in poorer regions of the country that have not
equally benefited from China’s recent economic growth (Davies , 2013).
However, while great progress has been made in approving inbound foreign investment, there are still
some issues raised with regards to this process. A report by the U.S Chamber of Commerce (2012)
highlighted that the opaque approval processes can at times be used to selectively grant approval for
investment on the condition of setting up joint ventures with selected Chinese partners and that in
some cases, vaguely worded or unwritten rules are employed in order to preserve the competitiveness
of local firms. Evidently, further changes would be needed to establish a fully open and transparent
environment for inward FDI.
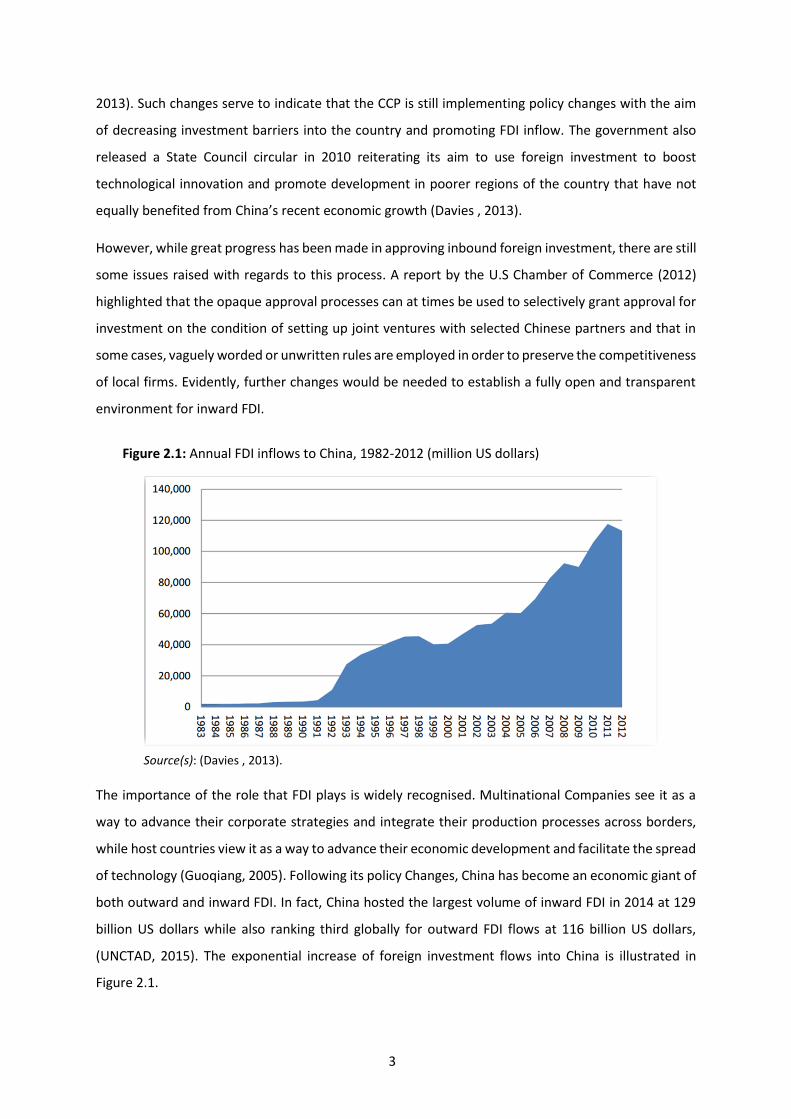
Figure 2.1: Annual FDI inflows to China, 1982-2012 (million US dollars)
Source(s): (Davies , 2013).
The importance of the role that FDI plays is widely recognised. Multinational Companies see it as a
way to advance their corporate strategies and integrate their production processes across borders,
while host countries view it as a way to advance their economic development and facilitate the spread
of technology (Guoqiang, 2005). Following its policy Changes, China has become an economic giant of
both outward and inward FDI. In fact, China hosted the largest volume of inward FDI in 2014 at 129
billion US dollars while also ranking third globally for outward FDI flows at 116 billion US dollars,
(UNCTAD, 2015). The exponential increase of foreign investment flows into China is illustrated in
Figure 2.1.

4
That the flow of foreign investment into China has seen incredible rates of growth over the past 4
decades is undeniable. The CCP’s focus in using foreign capital as a vehicle for economic growth lends
importance to understanding how policy changes can influence the use of FDI in the country as
compared to other economic factors. Several works have been put forward that aim to understand
how different factors contribute to the growth of FDI into a country.
3. Literature review
3.1 Investment barriers into China
Given the strength of the influence the government has historically had over the market in China, it
may be the case that there exists a greater level of investment barriers. Although much has been done
to address these since the beginning of the opening up policy, several barriers still exist. The European
Chamber of Commerce in China publishes annual position papers compiled by conducting forums with
European companies currently operating in China. The perception given here is that the objective of
opening up foreign investment in China has lost momentum and that protectionist policies persist
(European Chamber of Commerce in China, 2015). Taking steps to reduce the prevalence of these
barriers could have a significant positive effect on inward FDI.
3.2 Approval processes
The inbound FDI approval process into China is described as opaque and at times discriminatory to
foreign investors (U.S Chamber of Commerce, 2012). The first way in which this occurs is through
authorities applying unwritten or vague requirements with the express intention of delaying the entry
of a foreign company that is otherwise fully qualified (U.S Chamber of Commerce, 2012). The second
way in which this may occur is the inclusion of conditions that are specific to the investment deal being
considered (U.S Chamber of Commerce, 2012). This is often the case in industries where it is required
for a foreign investor to enter the market with a local partner and authorities use their scope in the
approval to ensure that intellectual property is made available to the local partner as a condition of
approving the application (U.S Chamber of Commerce, 2012).
3.3 Market access
There still exist several barriers to market access for foreign investors. The most obvious of these
would be the list of the remaining 139 sectors outlined by the Chinese government in which foreign
investment is totally prohibited (Godement & Stanzel, 2015). In some sectors where foreign
investment is allowed, it may be subject to additional requirements and restrictions such as the
requirement to operate in a joint venture (Godement & Stanzel, 2015). Work by Francois, et al. (2012)
5
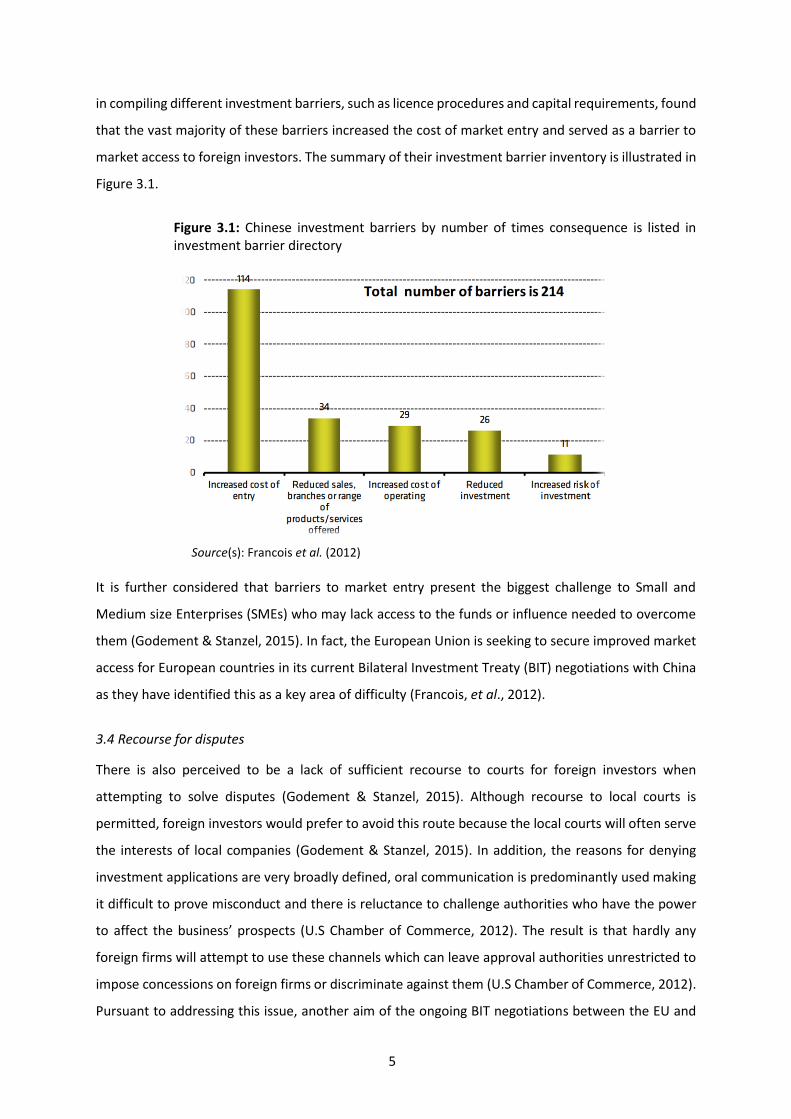
in compiling different investment barriers, such as licence procedures and capital requirements, found
that the vast majority of these barriers increased the cost of market entry and served as a barrier to
market access to foreign investors. The summary of their investment barrier inventory is illustrated in
Figure 3.1.
Figure 3.1: Chinese investment barriers by number of times consequence is listed in investment barrier directory
Source(s): Francois et al. (2012)
It is further considered that barriers to market entry present the biggest challenge to Small and
Medium size Enterprises (SMEs) who may lack access to the funds or influence needed to overcome
them (Godement & Stanzel, 2015). In fact, the European Union is seeking to secure improved market
access for European countries in its current Bilateral Investment Treaty (BIT) negotiations with China
as they have identified this as a key area of difficulty (Francois, et al., 2012).
3.4 Recourse for disputes
There is also perceived to be a lack of sufficient recourse to courts for foreign investors when
attempting to solve disputes (Godement & Stanzel, 2015). Although recourse to local courts is
permitted, foreign investors would prefer to avoid this route because the local courts will often serve
the interests of local companies (Godement & Stanzel, 2015). In addition, the reasons for denying
investment applications are very broadly defined, oral communication is predominantly used making
it difficult to prove misconduct and there is reluctance to challenge authorities who have the power
to affect the business’ prospects (U.S Chamber of Commerce, 2012). The result is that hardly any
foreign firms will attempt to use these channels which can leave approval authorities unrestricted to
impose concessions on foreign firms or discriminate against them (U.S Chamber of Commerce, 2012).
Pursuant to addressing this issue, another aim of the ongoing BIT negotiations between the EU and
6
China has also been to establish, “potential recourse to international arbitrators in a process known
as investor-state dispute settlements,” (Godement & Stanzel, 2015). The fact that these negotiations
are still ongoing indicates that there is still room for improvement in China’s administrative recourse
policies in the eyes of foreign investors.
3.5 Favouring domestic competitors
Chinese government administrators are charged with making sure that inbound projects are in line
with the country’s plans for economic and social development which explicitly includes encouraging
and promoting domestic companies and brands (U.S Chamber of Commerce, 2012). This can prove
problematic for foreign investors because the industrial policy of the region is shaped by this goal. One
of the ways in which administrators pursue this aim is through selectively approving foreign projects
on the condition that the investor acquiesces to a joint venture with a selected Chinese company (U.S
Chamber of Commerce, 2012). Some investors have reported being required to transfer technology
and provide access to international markets through the joint ventures (U.S Chamber of Commerce,
2012). This behaviour is not entirely surprising as there is evidence that both inward and outward FDI
activity can affect the competitive advantage environment of the host economy (Dunning, 2002).
Whether this effect is positive or negative largely depends on the specific circumstances. On one hand,
multinational companies can easily shift value adding operations across borders in search of
favourable conditions; on the other, governments enacting policies to attract such companies may be
doing so to the detriment of local businesses (Dunning, 2002). However, although favouritism by
officials may not be unfounded, it does present a barrier to foreign investors.
This is by no means an exhaustive list of the investment barriers that exist into China. It is also
important to note that while larger companies may be able to overcome these barriers, smaller
companies report finding it much more difficult to access the market and navigate the regulatory
environment in China (Godement & Stanzel, 2015). Reducing investment barriers would thus likely
open up the Chinese economy to different types of foreign investors who are currently completely
blocked from the market.
Despite these barriers, China still remains an attractive destination for FDI. This is illustrated by the
fact that although the GDP growth rate has been slowing down, China is becoming a more attractive
destination for FDI with opportunities for foreign investors expected to grow in several sectors (KPMG
Global China Practice, 2016). However, the concerns of foreign investors highlighted in this section
show that the country may be able to benefit from addressing these barriers in order to further boost
FDI inflow. In order to estimate the effect of the above-mentioned barriers on FDI inflow into China,
it would be important to use a measure that most wholly includes these factors.

7
3.6 Factors influencing FDI
Zhao (2013) identifies reform and opening-up as the keys to China’s economic success. This view is
supported by the results of their panel data analysis in which it was found that FDI and privatisation
significantly contributed to China’s economic growth for the time period 1978-2008. The trend of
privatisation – and by extension, decreased government intervention in market processes – is cited
as, “an essential prelude,” to the opening up of market transactions (Zhao, 2013). This paper serves
to illustrate how important FDI has been as a vehicle for economic growth in China as well as the
important interdependency between FDI and government policy.
Several empirical investigations seeking to explore the factors that contribute to FDI decisions,
specifically in the case of developing economies, exist. Arita & Tanaka (2013) indicate that developing
countries currently have greater barriers to inward foreign investment than their developed
counterparts. They constructed a counterfactual policy experiment that served to show that
decreasing such barriers (specifically the length and complexity of foreign investment procedures)
would have a significant positive impact on individual firm decisions to participate in foreign
investment. It is important to note here that the methodology used reflects a key difficulty in
evaluating this topic. It is difficult to find a way to directly quantify the degree of government policy
or intervention. Hence, there is difficulty in identifying suitable proxies for government policy or,
similarly, investment barriers.
In addition to the factors that contribute to individual firms’ foreign investment decisions, there is a
wide range of literature seeking to identify and quantify the factors that influence inward FDI flow into
a country as whole. However, Demirhan & Masca (2008) point out that this field lacks a consensus of
the theoretical framework to explain FDI. Hence this issue can only be evaluated through the empirical
works that have sought to quantify these variables. Bearing in mind the differences in investment
environments between developed and developing economies as described by Arita & Tanaka (2013),
I will only consider studies that focus on developing nations or on China itself as these are most likely
to shed light on the variables most at play in the Chinese economy.
3.6.1 Market size and growth rate
The literature shows a consensus that the size of the market and the growth rate form two of the most
important factors in determining FDI to developing countries (Ang, 2008; Rao, et al., 2010; Demirhan
& Masca, 2008). GDP and GDP growth rates are used to quantify these. Ang (2008) suggests that the
increased FDI linked to a larger domestic market size is as a result of the fact that a larger market size
allows for the exploitation of economies of scale. Further, it is hypothesised that growth plays an
important role in attracting FDI because faster growing economies present a better prospect for

8
generating profits (Demirhan & Masca, 2008). Even in the case where the effect of growth is
empirically found to be mild, Ang (2008) emphasises that the evidence shows that the presence of
strong economic growth was still important in attracting FDI. There is also evidence to suggest that, in
fact, investors prefer growing economies to large economies (Demirhan & Masca, 2008). Both these
factors are evidently at play in the Chinese economy which in addition to being one of the largest
economies in the world with a 2014 GDP of over 10 trillion US dollars, also boasts a high growth rate
growing at 7.3% in 2014 (World Bank, 2016).
3.6.2 Labour
Higher labour costs would be expected to negatively affect FDI inflows as it would increase potential
costs (Rao, et al., 2010). However, the evidence concerning the nature and significance of wage rates
to FDI delivers no consensus and varies from study to study (Demirhan & Masca, 2008). Demirhan &
Masca (2008) find the effect of wage to be negative but statistically insignificant whereas Rao, et al.
(2010) find it to be negative but significant. Other factors, such as the labour sensitivity of the intended
sector, can influence the degree to which the wage rate influences FDI as well as the fact that using
wage rates fails to control for productivity or changing exchange rates (Rao, et al., 2010). In an
alternative treatment of this the labour variable, He & Sun (2014) include “human capital investment”
in their model instead of wage rates. In this case, it was calculated by, “the ratio of secondary school
enrolment (grades 7 to 12) to labour force,” (He & Sun, 2014). Here they find the factor of human
capital investment to be positive and statistically significant at the 5% level in contributing to FDI
inflow into China for the time period 1995-2002. This could lead to the conclusion that the quality (or
productivity) of labour available is also an important factor in determining FDI inflow.
3.6.3 Infrastructure
Poor infrastructure can present a significant challenge to business operations within a country and as
such, is an important factor in determining FDI into a country (Demirhan & Masca, 2008). A further
explanation to this is that a country that finds itself with the opportunity to attract FDI would be
motivated to invest in improving its infrastructure leading to a strong relationship between the two
(Demirhan & Masca, 2008; Rao, et al., 2010). This is reflected in the results found by Rao, et al. (2010),
where infrastructure proved to be a positive statistically significant factor in determining FDI inflow
into BRICS (Brazil, Russia, India, China and South Africa) countries for the time period 1975-2007.
Demirhan & Masca (2008) also generated the same result in their cross-sectional analysis of
developing countries. In terms of estimating this variable, Demirhan & Masca (2008) state that fixed
telephone lines per 1,000 people is usually the standard measure. However, they go on to further

9
explain that it may only form an incomplete picture as it does not take into consideration the quality
of the infrastructure or the prevalence of mobile telephones.
3.6.4 Tax
It is suggested that, “lowering corporate tax rate is an effective policy instrument to boost inward FDI,”
(Ang, 2008). Indeed, Ang (2008) finds tax to be a negative and significant factor in determining FDI
into Malaysia. This result is mirrored by Demirhan & Masca (2008) in their cross-sectional analysis of
developing countries; however, in their review they do note that the significance of this variable varies
from study to study.
3.6.5 Currency value
REER (Real Effective Exchange Rate) is often used to evaluate relative currency value. Ang (2008) finds
a statistically significant negative relationship between FDI and REER which he explains to be because
a lower value of the domestic currency would increase foreign investors’ relative wealth position and
so lower their cost of capital. Rao, et al., (2010) find a similar result in their analysis of BRICS countries
which lends credence to the view that currency valuation is indeed an important factor in determining
FDI.
The factors considered here have each been reviewed in different studies, with some being found to
be significant in certain cases and insignificant in others. Specifically, “labour costs, trade barriers,
trade balance, exchange rate and tax have been found to have both negative and positive effects on
FDI,” (Demirhan & Masca, 2008). Consequently, there exists no accepted “true” set of determinants
of FDI. Even within the studies considered here, none of the authors specified the exact same set of
explanatory variables in their model. In addition, although the various studies have sought to uncover
the underlying factors that contribute to FDI (and some even in the case of China itself), none have
done so for the FDI flows in the time period of 2006-2014 as this paper aims to do, or for the range of
countries considered in this case. Finally, none of the preceding works have sought to explicitly
investigate the effect of investment barriers in this context. Hence, this paper provides a novel
approach to the question of the determinants of FDI.
4. Methodology
4.1 Dataset
This empirical investigation will consist of a panel data sample of inward FDI flows into China from 83
countries for the time period 2006-2014. These will be lagged to be modelled against dependent
variables for the time period 2005-2013 for a total of 747 observations. All global regions are included

10
in the sample used in this investigation. Hence, I believe it to be a representative sample. The time
period chosen reflects the availability of data. Firstly, the most recent FDI figures separated by country
of origin are for 2014. Secondly, the chosen proxy for investment barriers limits our earliest
observation to 2005 (as will be discussed later in the next chapter). Table 4.1 shows the summary
statistics for the variables used in this investigation.
Table 4.1: Variable Summary Statistics
Variables Mean Standard Deviation
Minimum Maximum
FDI (in 100 000 US
dollars, deflated to year 2000)
774
4,040 0.34823 47,200
GDP (in 100 000
US dollars, deflated to year 2000)
3,200,000
1,400,000
1,320,000
5,510,000
Economic Freedom Index
6.084 0.105 5.870 6.250
Human Capital Investment factor
0.109 0.003 0.0103 0.115
REER 98.078 9.806 84.3 115.3 Infrastructure Investment factor
0.138 0.0174 0.116 0.166
Corporate tax rate (%)
27.67 3.773 25 33
log(FDI)
17.113 2.747 10.458 24.577
log(GDP)
28.689 0.473 27.906 29.337
N 747
In addition, Table 4.2 shows the correlations between the variables used in the model.
11
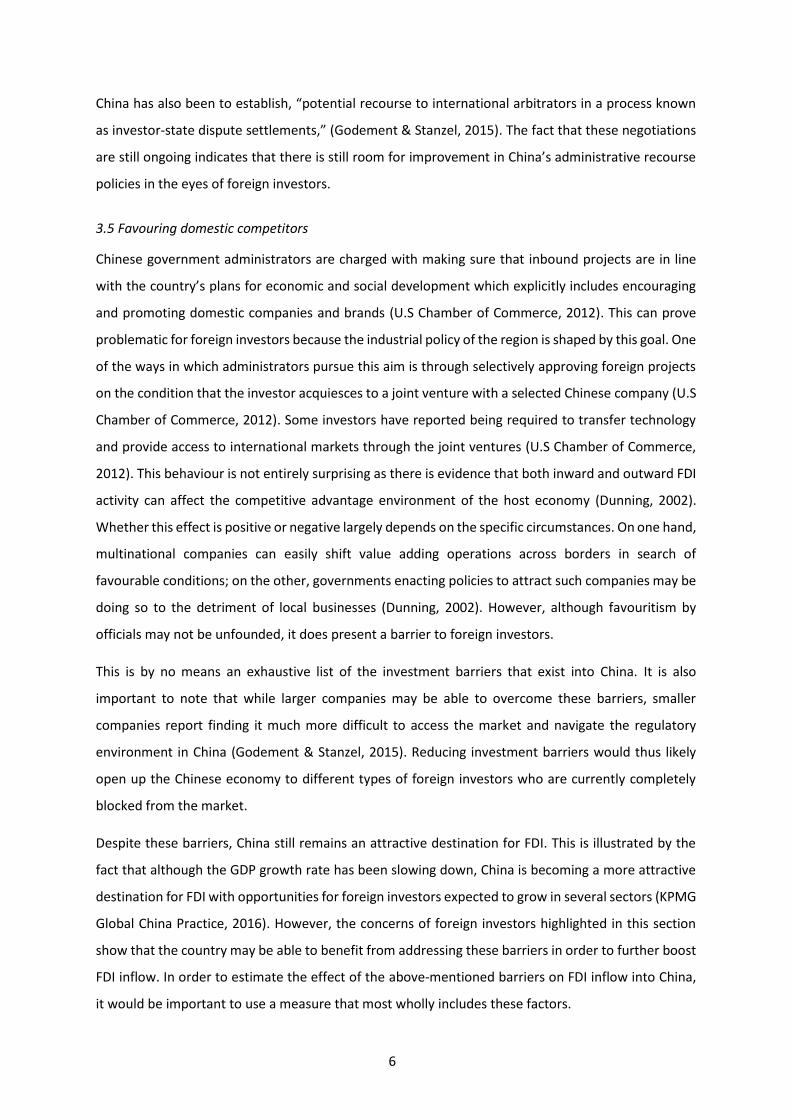
Table 4.2: Variable Correlation matrix
log(FDI) log(GDP) Economic Freedom
Index
Human Capital Investment
factor
REER Infrastructure Investment
factor
Corporate tax rate
log(FDI) 1 log(GDP) -0.0614 1 Economic Freedom Index
-0.0605 0.926 1
Human capital investment factor
0.0523 -0.916 -0.910 1
REER -0.0691 0.971 0.916 -0.919 1 Infrastructure investment factor
-0.0430 0.741 0.685 -0.789 0.816 1
Corporate tax rate
0.0434 -0.860 -0.703 0.839 -0.852 -0.777 1
The sources, construction and determination of each of these variables will be further discussed in
this chapter.
4.2 Dependent variable
The dependent variable in this case is FDI inflow into China. The aim is to evaluate the extent of the
impact of investment barriers on this figure. The FDI figure for each country was sourced from the
National Bureau of Statistics of China (NBS). It is specified as:
“Investment in China through the establishment of foreign invested enterprises… and the
establishment of branch organizations of foreign enterprises. [It] can be made in forms of cash,
physical investment, technical know-how and reinvestment of the foreign enterprises with the
profits gained from the investment.” (National Bureau of Statistics of China, 2014).
Although the inclusion of subjective values such as technical know-how may impact the reliability of
this figure, I still consider this an appropriate measure as it most wholly encapsulates the degree of
interaction between countries by considering additional forms that foreign investment can take. In
order to convert this figure in to real terms and allow for comparisons over time, the figure stated by
the NBS will be divided by the GDP deflator obtained from the World Bank’s World Development
Indicators (WDI) dataset with a base year of 2000. Hence the determination of the FDI figures used in
the model will be as shown in Equation 1.

12
Equation 1:
𝐹𝐷𝐼 =𝐹𝐷𝐼 𝑖𝑛 𝑈𝑆 𝑑𝑜𝑙𝑙𝑎𝑟𝑠
𝐺𝐷𝑃 𝐷𝑒𝑓𝑙𝑎𝑡𝑜𝑟
The GDP deflator is the most appropriate measure of inflation to use as it looks at the economy as a
whole rather than reflecting price changes relative to a “basket of goods” which may be subject to
change (World Bank, 2016).
4.3 Independent Variables
Although the primary aim of this investigation is to evaluate the extent to which investment barriers
affect FDI inflow into China, it is also necessary to include other explanatory variables in order to avoid
omitted variable bias (Gujarati & Porter, 2009). The independent variables in this specification have
been chosen carefully based on their potential significance as reflected in the reviewed literature.
There is a consensus among the literature that GDP is an important determining factor for FDI. Hence,
I expect it to have a significant positive effect. The GDP figures used in this investigation are sourced
from World Bank data. This is given in current USD dollars. In order to convert this figure to a
comparable level to that used for FDI, the GDP figures will be deflated using the most recent GDP
deflator to convert them to a real GDP level for the base year 2000. Hence, the determination of GDP
is summarised by Equation 2.
Equation 2:
GDP =𝐺𝐷𝑃 𝑖𝑛 𝑐𝑢𝑟𝑟𝑒𝑛𝑡 𝑈𝑆 𝑑𝑜𝑙𝑙𝑎𝑟𝑠
2014 𝐺𝐷𝑃 𝑑𝑒𝑓𝑙𝑎𝑡𝑜𝑟
There is no conviction within the literature as to the nature of the effect of Corporate Tax rates on
FDI. I expect it to have a negative effect and insignificant effect in this case. The data used for this is
sourced from the Trading Economics website and is reported in percentages which are transferred
directly into the dataset for the time period in question. On the other hand, the literature reviewed
confirmed a negative and significant effect of REER on FDI. I expect to find the same. REER is calculated
as the nominal exchange rate (weighted against several foreign currencies) divided by a deflator and
for this study is sourced from World Banks WDI data (World Bank, 2016).
For the purposes of this investigation, I will construct a factor reflecting investment in human capital
in China. The aim here is to construct a proxy for the quality of labour available by gauging the extent
to which there is investment in educating the labour force. As discussed by Rao, et al. (2010), simply
using wage rates fails to control for factors including productivity and changing exchange rates (a

13
factor which has already been included in this model). As such, the method used to determine this
Human Capital Investment factor is that which He & Sun (2014) use. To reflect the investment in
education, the number of new students enrolling in senior secondary school is considered. This is then
given as a proportion of the number of economically active persons to provide an indication of the
investment in education relative to the size of China’s labour force. Both of these figures are obtained
from the NBS. I expect this to have a positive and statistically significant effect.
Telephone lines per 1000 people as often considered as the standard indicator for infrastructure
(Demirhan & Masca, 2008). However, Demirhan & Masca (2008) point out the weaknesses of this
measure as it fails to account for mobile technology. This must only be more so the case considering
that mobile technology has progressed further since the time of publication. Hence I will use an
Infrastructure Investment factor to indicate the extent to which the government in China is investing
in improving infrastructure. This factor will be constructed as shown in equation 3.
Equation 3:
𝐼𝑛𝑓𝑟𝑎𝑠𝑡𝑟𝑢𝑐𝑢𝑡𝑟𝑒 𝐼𝑛𝑣𝑒𝑠𝑡𝑚𝑒𝑛𝑡 𝐹𝑎𝑐𝑡𝑜𝑟 = 𝑆𝑡𝑎𝑡𝑒 𝐵𝑢𝑑𝑔𝑒𝑡 𝑜𝑛 𝐹𝑖𝑥𝑒𝑑 𝐴𝑠𝑠𝑒𝑡𝑠 (𝑖𝑛 𝑌𝑢𝑎𝑛)
𝑇𝑜𝑡𝑎𝑙 𝐺𝑜𝑣𝑒𝑟𝑛𝑚𝑒𝑛𝑡 𝐸𝑥𝑝𝑒𝑛𝑑𝑖𝑡𝑢𝑟𝑒 (𝑖𝑛 𝑌𝑢𝑎𝑛)
The figures for both of these are sourced from the NBS. I expect this factor to have a positive and
significant effect on FDI. A limitation of using this measure is that it is impossible to determine the
proportion of the Fixed Assets budget that is used in improving infrastructures that would be relevant
to foreign investors (for example roads). However, World Bank data for telephone lines per 100 people
in China shows a decreasing trend over recent years which I take to reflect the shift to mobile
telephones rather than a deterioration in infrastructure (World Bank, 2016). Hence, I believe judging
infrastructure by the proportion of government expenditure on fixed assets would be more valid than
using the standard measure.
4.4 Investment Barriers
The instrumental variable that this investigation seeks to evaluate is that of investment barriers.
However, there is difficulty in considering this factor as it is neither explicitly observable nor directly
quantifiable. In the case of China, the main manifestations of barriers to investment include barriers
to approval, market access, access to recourse for dispute and equal treatment of foreign entities as
discussed earlier. A good proxy for this factor would need to take these into consideration and
adequately weight them to create an accurate evaluation of the degree of investment barriers as well
as an accurate reflection of the changes in these.

14
To this end, this study will use the Economic Freedom of the World Index as a proxy for investment
barriers. This Index creates a score for each country on a scale of 1-10 where a higher score indicates
a higher degree of economic freedom (Gwartney, et al., 2015). As such, a higher value will indicate a
lower level of investment barriers. The full set of variables considered in the construction of this index
is listed in Appendix 1. However, the main categories that are investigated are: size of government,
legal system and property rights, soundness of money, freedom to trade internationally and the
regulatory environment (Gwartney, et al., 2015). This index especially forms a good proxy in this case
as it includes indicators for each of the forms of investment barriers that were identified as the most
prevalent earlier in this paper. For instance, it takes into account favouritism and the enforcement of
legal contracts.
It is also important to note that the index numbers used have been chain-linked for the time period in
question making them more accurate indicators of changes in investment barriers relative to the
previous time period (Gwartney, et al., 2015). This further serves to make this an appropriate indicator
when evaluating relative changes in investment barriers over time.
To construct the Economic Freedom Index variable, the figures provided in this index are directly
transferred to the dataset.
4.5 Model Specification
The FDI flow is lagged by one year against the explanatory variables resulting in a model as shown in
equation 4.
Equation 4:
log (𝐹𝐷𝐼𝑖𝑡+1) = 𝛽1 log(𝐺𝐷𝑃𝑖𝑡) + 𝛽2𝐸𝑐𝑜𝑛𝑜𝑚𝑖𝑐 𝐹𝑟𝑒𝑒𝑑𝑜𝑚 𝐼𝑛𝑑𝑒𝑥𝑖𝑡
+ 𝛽3𝐻𝑢𝑚𝑎𝑛 𝐶𝑎𝑝𝑖𝑡𝑎𝑙 𝐼𝑛𝑣𝑒𝑠𝑡𝑚𝑒𝑛𝑡 𝐹𝑎𝑐𝑡𝑜𝑟𝑖𝑡 + 𝛽4𝑅𝐸𝐸𝑅𝑖𝑡
+ 𝛽5𝐼𝑛𝑓𝑟𝑎𝑠𝑡𝑟𝑢𝑐𝑡𝑢𝑟𝑒 𝐼𝑛𝑣𝑒𝑠𝑡𝑚𝑒𝑛𝑡 𝐹𝑎𝑐𝑡𝑜𝑟𝑖𝑡 + 𝛽6𝐶𝑜𝑟𝑝𝑜𝑟𝑎𝑡𝑒 𝑇𝑎𝑥 𝑅𝑎𝑡𝑒𝑖𝑡 + 𝜇
Where i is each foreign country investing in China, t is the specific year in the time period 2005-2013
and μ is the error term.
As this is a panel data study, the models used for estimation will be the Pooled Ordinary Least Squares
(OLS) model, Fixed Effects Model (FEM) and Random Effects Model (REM). Although the literature
reviewed did not include a study that specifically considered this variable, I expect to find a positive
relationship between the Economic Freedom Index and FDI. This is because a higher Freedom Index
would indicate a lower degree of investment barriers into China which I would expect to be linked
15
with higher FDI inflows. However, I do not expect the coefficient of this variable to be statistically
significant.
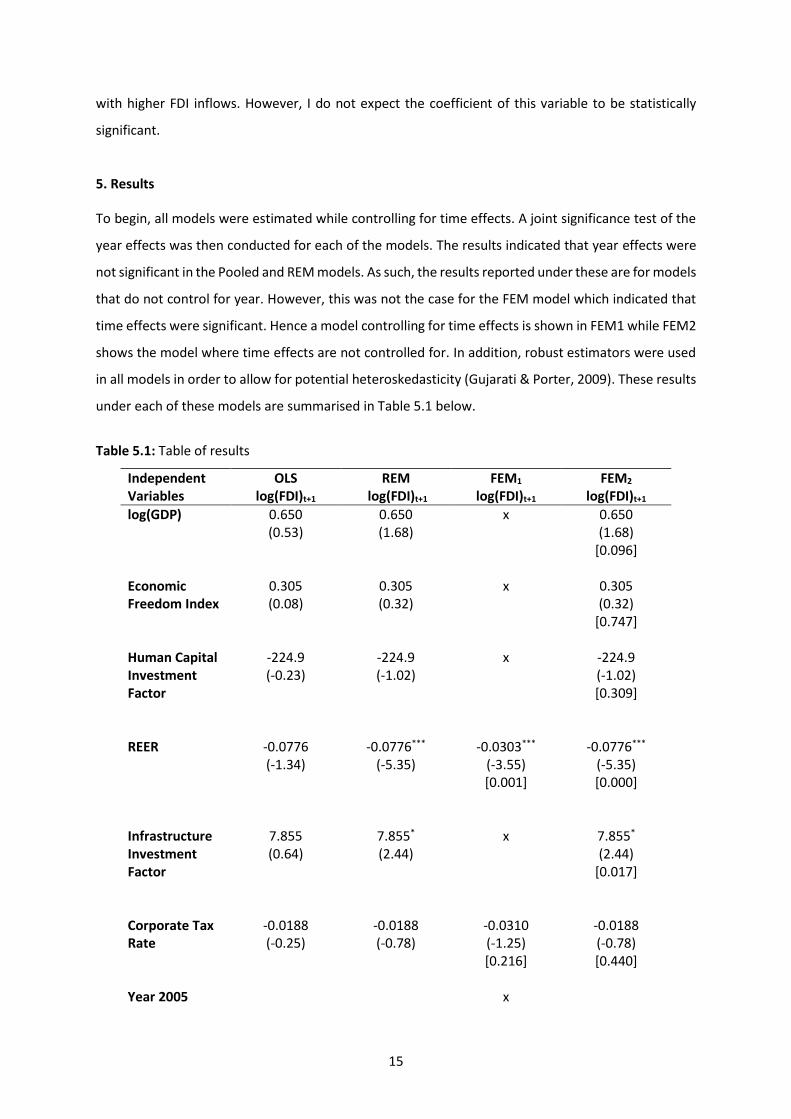
5. Results
To begin, all models were estimated while controlling for time effects. A joint significance test of the
year effects was then conducted for each of the models. The results indicated that year effects were
not significant in the Pooled and REM models. As such, the results reported under these are for models
that do not control for year. However, this was not the case for the FEM model which indicated that
time effects were significant. Hence a model controlling for time effects is shown in FEM1 while FEM2
shows the model where time effects are not controlled for. In addition, robust estimators were used
in all models in order to allow for potential heteroskedasticity (Gujarati & Porter, 2009). These results
under each of these models are summarised in Table 5.1 below.
Table 5.1: Table of results
Independent OLS REM FEM1 FEM2
Variables log(FDI)t+1 log(FDI)t+1 log(FDI)t+1 log(FDI)t+1
log(GDP) 0.650 0.650 x 0.650 (0.53) (1.68) (1.68) [0.096] Economic 0.305 0.305 x 0.305 Freedom Index (0.08) (0.32) (0.32) [0.747] Human Capital -224.9 -224.9 x -224.9 Investment Factor
(-0.23) (-1.02) (-1.02) [0.309]
REER -0.0776 -0.0776*** -0.0303*** -0.0776*** (-1.34) (-5.35) (-3.55) (-5.35) [0.001] [0.000] Infrastructure 7.855 7.855* x 7.855* Investment Factor
(0.64) (2.44) (2.44) [0.017]
Corporate Tax -0.0188 -0.0188 -0.0310 -0.0188 Rate (-0.25) (-0.78) (-1.25) (-0.78) [0.216] [0.440] Year 2005 x

16
Year 2006 0.0538 (0.66) [0.513] Year 2007 0.221 (1.91) [0.059] Year 2008 x Year 2009 0.242* (2.43) [0.017] Year 2010 0.243* (2.22) [0.029] Year 2011 0.0930 (0.88) [0.382] Year 2012 0.183 (1.82) [0.072] Year 2013 x Constant 6.121 6.121 20.82*** 6.121 (0.17) (0.64) (14.28) (0.64)
N 747 747 747 747
F statistic 0.74 5.65 6.34
Probability > F 0.6137 0.0000 0.0000
Probability > χ2 0.0000 Notes: t statistics are shown in round parentheses “( )”
P values are shown in square parentheses “[ ]” x indicates a variable was omitted for collinearity * indicates statistical significance at a 5% significance level, ** indicates statistical significance at a 1% significance level *** indicates statistical significance at a 0.1% significance level
The first regression is performed using the pooled model. However, a performance of the Breusch-
Pagan test reveals that the REM would be better in evaluating this model. This fact is corroborated by
the fact that the F statistic under the pooled model suggests that the joint effect of the coefficients is
not statistically different from 0. I then conducted a Hausman test to evaluate the merits of the REM

17
as compared to the FEM. The results indicate strong evidence that the difference in coefficients is
systematic hence the FEM is a more appropriate model to use in this case.
However, a key difficulty at this stage is that the instrumental variable, Economic Freedom Index, is
omitted as a result of collinearity when time effects are controlled for. The dependency of this variable
is evaluated by regressing it against the other explanatory variables. The result is the dependency
equation for Economic Freedom as shown in Equation 5 which also yielded an R2 value of 0.9340.
Equation 5:
𝐸𝑐𝑜𝑛𝑜𝑚𝑖𝑐 𝐹𝑟𝑒𝑒𝑑𝑜𝑚 𝐼𝑛𝑑𝑒𝑥
= 0.147[𝑙𝑜𝑔(𝐺𝐷𝑃)] − 153(𝐻𝑢𝑚𝑎𝑛 𝐶𝑎𝑝𝑖𝑡𝑎𝑙 𝐼𝑛𝑣𝑒𝑠𝑡𝑚𝑒𝑛𝑡 𝐹𝑎𝑐𝑡𝑜𝑟)
+ 0.00239(𝑅𝐸𝐸𝑅) + 0.0126(𝐶𝑜𝑟𝑝𝑜𝑟𝑎𝑡𝑒 𝑇𝑎𝑥 𝑅𝑎𝑡𝑒) + 2.991
Several other key variables are also omitted under FEM1, this makes it impossible to evaluate the
effect that they each may have. Hence, despite the presence of time effects, I opted to estimate FEM2
under which time effects are not controlled for and evaluate the variables resulting from this. As such,
it is essential interpret these results in the context that average log(FDI) figures fluctuated over time,
and that this effect has not be controlled for. This will influence the accuracy of the results in
describing the true degree of the effect each variable will have on FDI.
The relationship between log(FDI) and log(GDP) is found to be positive which is as expected. The P-
value for log(GDP) under the FEM2 was 0.096 showing that it is statistically significant at the 10% level.
Although both this directionality and statistical significance was the expected result, I had anticipated
significance would be at the under the 5% level. Especially considering that GDP is widely considered
the most robust determinant of FDI (Demirhan & Masca, 2008).
There is a positive relationship between the Economic Freedom Index and log(FDI). However, with a
P-value of 0.747, this coefficient is not statistically significant. This finding matches my expectations.
The effect of the Infrastructure Investment Factor is both positive and statistically significant at the
5% level. This result is as expected and serves to reiterate the importance that infrastructure can have
to foreign investors.
The relationship between the Human Capital Investment factor and log(FDI) emerges as negative but
statistically insignificant. The directionality of this relationship is highly surprising and is also in
contrast with the findings of He & Sun (2014). However, I would not infer a negative relationship
between FDI and Human Capital Investment from this result. I suspect rather an underlying
relationship between FDI and the variables used to construct this proxy or the model specification
used are likely the cause of this finding.
18
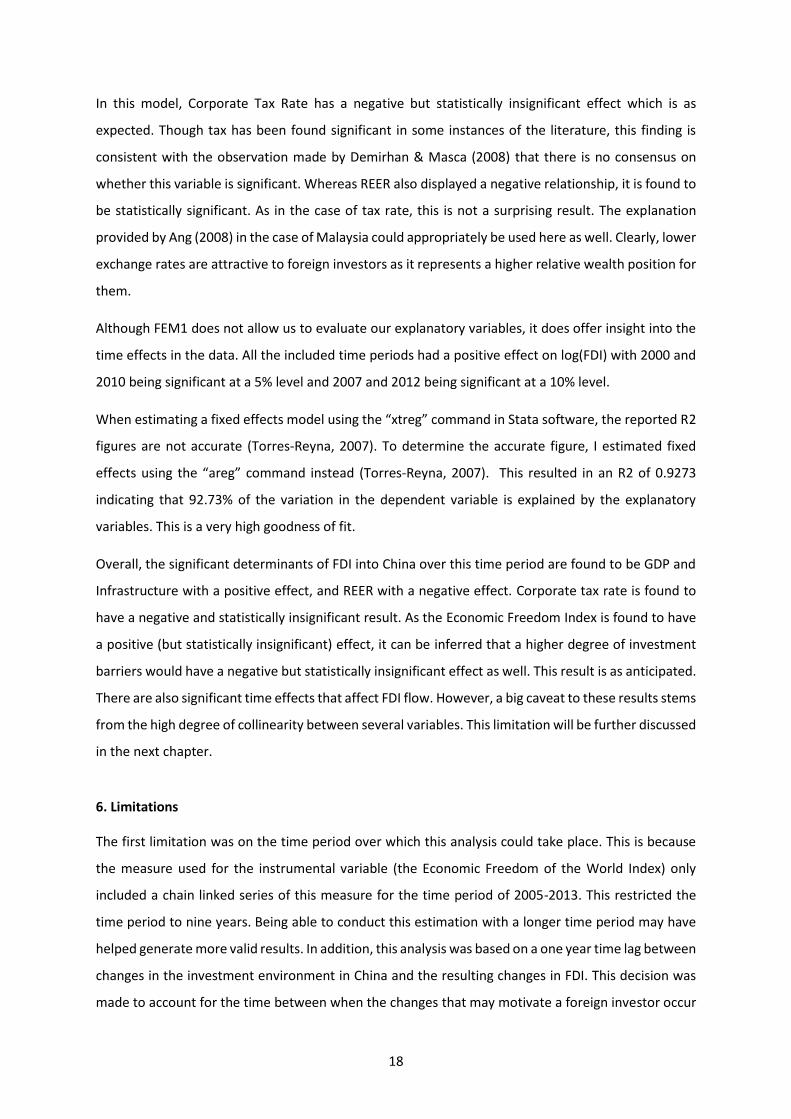
In this model, Corporate Tax Rate has a negative but statistically insignificant effect which is as
expected. Though tax has been found significant in some instances of the literature, this finding is
consistent with the observation made by Demirhan & Masca (2008) that there is no consensus on
whether this variable is significant. Whereas REER also displayed a negative relationship, it is found to
be statistically significant. As in the case of tax rate, this is not a surprising result. The explanation
provided by Ang (2008) in the case of Malaysia could appropriately be used here as well. Clearly, lower
exchange rates are attractive to foreign investors as it represents a higher relative wealth position for
them.
Although FEM1 does not allow us to evaluate our explanatory variables, it does offer insight into the
time effects in the data. All the included time periods had a positive effect on log(FDI) with 2000 and
2010 being significant at a 5% level and 2007 and 2012 being significant at a 10% level.
When estimating a fixed effects model using the “xtreg” command in Stata software, the reported R2
figures are not accurate (Torres-Reyna, 2007). To determine the accurate figure, I estimated fixed
effects using the “areg” command instead (Torres-Reyna, 2007). This resulted in an R2 of 0.9273
indicating that 92.73% of the variation in the dependent variable is explained by the explanatory
variables. This is a very high goodness of fit.
Overall, the significant determinants of FDI into China over this time period are found to be GDP and
Infrastructure with a positive effect, and REER with a negative effect. Corporate tax rate is found to
have a negative and statistically insignificant result. As the Economic Freedom Index is found to have
a positive (but statistically insignificant) effect, it can be inferred that a higher degree of investment
barriers would have a negative but statistically insignificant effect as well. This result is as anticipated.
There are also significant time effects that affect FDI flow. However, a big caveat to these results stems
from the high degree of collinearity between several variables. This limitation will be further discussed
in the next chapter.
6. Limitations
The first limitation was on the time period over which this analysis could take place. This is because
the measure used for the instrumental variable (the Economic Freedom of the World Index) only
included a chain linked series of this measure for the time period of 2005-2013. This restricted the
time period to nine years. Being able to conduct this estimation with a longer time period may have
helped generate more valid results. In addition, this analysis was based on a one year time lag between
changes in the investment environment in China and the resulting changes in FDI. This decision was
made to account for the time between when the changes that may motivate a foreign investor occur

19
and the time for that investment to be realised. However, I could not find concrete data on exactly
how long this time lag generally is as it seems to vary greatly from case to case. Hence it was necessary
to simply assume that one year is the case on average. However, there was no way to determine if
this was true.
The high correlation between explanatory variables was highly problematic. The extent of this is fully
shown in Table 4.2. The core problems that arise as a result of collinearity are larger standard errors
leading to more explanatory variables emerging as statistically insignificant even in the case that the
model as a whole has a high R2 value (Belsley, 1991; Gujarati & Porter, 2009). In other words it results
in Type II error and mistaking significant variables to be insignificant. Secondly, collinearity can
significantly undermine the stability of the estimators such that even small changes in the inputs can
result in large changes in the coefficients and even changing signs (Belsley, 1991). Both of this cases
are evident in the results of this study which resulted in difficulties specifying the correct model and
accurately interpreting the results. This can explain the surprising directionality of the coefficient for
the Human Capital Investment factor. It was especially problematic when attempting to control for
time effects as it led to several important variables being omitted. A solution to this can be presented
by constructing a model in which the highly correlated variables are excluded (Ho, 2004). However,
when using the fixed effects model while controlling for time effects, there was no iteration of the
model that did not result in the instrumental variable of Economic Freedom being omitted- not even
in the case where it was the sole explanatory variable. Taking this limitation into consideration, it may
be the case that more factors would have been statistically significant than the results would suggest.
It is also the case that the reason for high correlation between some of the variables (for instance
Human Capital Investment and REER) is not immediately clear which may suggest the presence of an
unobserved “lurking” variable or reverse causality between some variables; in other words, some
degree of endogeneity is likely present (Antonakis, et al., 2014). The problem of potential endogeneity
of variables may be solved by conducting a Generalised Methods of Moments (GMM) analysis rather
than an FEM (Hall, 2005). As such, I conducted an instrumental variable regression using the GMM
model to control for endogeneity- the results of which can be seen in Appendix 2. However, this model
did not generate significant coefficients and so was excluded from my final results.
In addition to the issues that arose in analysing the time-variant variables, there may also exist
significant time-invariant variables. For instance, although GDP and FDI may fluctuate from year to
year, the distance between countries would remain the same (Davies, et al., 2008). The Fixed Effects
model cannot account for these. A potential solution to this could be using the panel fixed effects with
vector decomposition (XTFEVD) method which, “removes biases induced by the correlation between
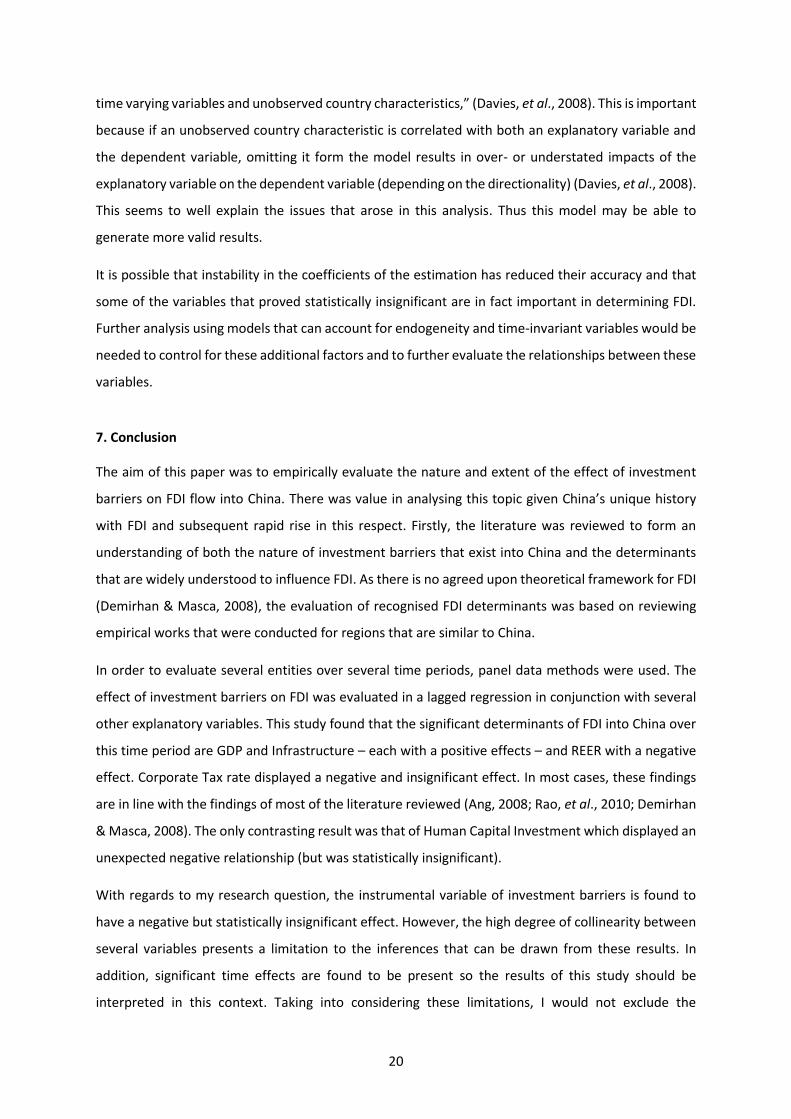
20
time varying variables and unobserved country characteristics,” (Davies, et al., 2008). This is important
because if an unobserved country characteristic is correlated with both an explanatory variable and
the dependent variable, omitting it form the model results in over- or understated impacts of the
explanatory variable on the dependent variable (depending on the directionality) (Davies, et al., 2008).
This seems to well explain the issues that arose in this analysis. Thus this model may be able to
generate more valid results.
It is possible that instability in the coefficients of the estimation has reduced their accuracy and that
some of the variables that proved statistically insignificant are in fact important in determining FDI.
Further analysis using models that can account for endogeneity and time-invariant variables would be
needed to control for these additional factors and to further evaluate the relationships between these
variables.
7. Conclusion
The aim of this paper was to empirically evaluate the nature and extent of the effect of investment
barriers on FDI flow into China. There was value in analysing this topic given China’s unique history
with FDI and subsequent rapid rise in this respect. Firstly, the literature was reviewed to form an
understanding of both the nature of investment barriers that exist into China and the determinants
that are widely understood to influence FDI. As there is no agreed upon theoretical framework for FDI
(Demirhan & Masca, 2008), the evaluation of recognised FDI determinants was based on reviewing
empirical works that were conducted for regions that are similar to China.
In order to evaluate several entities over several time periods, panel data methods were used. The
effect of investment barriers on FDI was evaluated in a lagged regression in conjunction with several
other explanatory variables. This study found that the significant determinants of FDI into China over
this time period are GDP and Infrastructure – each with a positive effects – and REER with a negative
effect. Corporate Tax rate displayed a negative and insignificant effect. In most cases, these findings
are in line with the findings of most of the literature reviewed (Ang, 2008; Rao, et al., 2010; Demirhan
& Masca, 2008). The only contrasting result was that of Human Capital Investment which displayed an
unexpected negative relationship (but was statistically insignificant).
With regards to my research question, the instrumental variable of investment barriers is found to
have a negative but statistically insignificant effect. However, the high degree of collinearity between
several variables presents a limitation to the inferences that can be drawn from these results. In
addition, significant time effects are found to be present so the results of this study should be
interpreted in this context. Taking into considering these limitations, I would not exclude the

21
importance of investment barriers on FDI. Particularly considering the very high correlation between
variables as displayed in Table 4.2, the consequences associated with high collinearity and
endogeneity must be considered when evaluating these results.
Allowing for these limitations, I would imagine that there is a scope for further analysis to determine
the true empirical relationship between investment barriers and FDI inflow. Anecdotally, the concerns
raised when evaluating the nature of investment barriers into China illustrated that their effects are
still felt by foreign investors, particularly by smaller companies (Godement & Stanzel, 2015). Hence,
although the size of this effect may not have been concretely determined, I would say that there would
be some positive impact on FDI from reducing investment barriers.

22
Bibliography
Ang, J.B. 2008. Determinants of foreign direct investment in Malaysia. Journal of Policy Modeling. Volume 30, p. 185–189.
Antonakis, J., Bendahan, S., Jacquart, P., and Lalive, R. 2014. Causality and endogeneity: Problems and solutions. In: The Oxford Handbook of Leadership and Organizations. New York: Oxford University Press, pp. 93-117.
Arita, S., and Tanaka, K. 2013. FDI and Investement Barriers in Developing Economies. Chiba: Institute of Developing Economics. [Online]. [Accessed: 9th May 2016]. Available at: http://www.ide.go.jp/English/Publish/Download/Dp/431.html
Belsley, D. 1991. Conditioning Diagnostics: Collinearity and Weak Data in Regression. New York: Wiley.
Blancher, N., and Rumbaugh, T. 2004. China: International Trade and WTO Accession. International Monteary Fund. [Online]. [Accessed: 9th May 2016]. Available at: https://www.imf.org/external/pubs/cat/longres.aspx?sk=17189.0
Casarini, N. 2006. The evolution of the EU-China relationship: from constructive engagement to strategic partnership. Paris: European Union Institute for Security Studies.
Coughlin, C.C., and Segev, E. 2000. Foreign Direct Investment in China: A Spatial Econometric Study. The World Economy. 23(1), pp. 1-23.
Davies , K. 2013. China Investment Policy: An update. Paris: OECD Publishing. [Accessed: 9th May 2016]. [Online]. Available at: http://hinrichfoundation.com/china-investment-policy-update/
Davies, R.B., Ionascu, D., and Kristjánsdóttir, H. 2008. Estimating the Impact of Time-Invariant Variables on FDI with Fixed Effects. Review of World Economics. 144(3), pp. 381-407.
Demirhan, E., and Masca, . M. 2008. Determinants of foreign direct investment flows to developing countries: a cross-sectional analysis. Prague Economic Papers. 17(4), pp. 337-369.
Dunning, J.H. 2002. Competitive advantages and MNE activity. In: Global capitalism, FDI and competitiveness. Cheltenham: Edward Elgar, pp. 289-314.
European Chamber of Commerce in China. 2015. European Business in China. Beijing: European Chamber. [Online]. [Accessed: 9th May 2016]. Available at: http://www.europeanchamber.com.cn/en/publications-position-paper
Francois, J., Sunesen, E. R., and Thelle, M.H. 2012. EU-China Investment Study. Copenhagen: Copenhagen Economics. [Online]. [Accessed: 9th May 2016]. Available at: https://www.copenhageneconomics.com/publications/publication/eu-chinainvestment -study
Godement, F., and Stanzel, A. 2015. The European Interest in an Investment Treaty with China. London: European Council on Foreign Relations.
Gujarati, D.N., and Porter, D.C., 2009. Basic Econometrics. 5 ed. Singapore: McGraw-Hill. Guoqiang, L. 2005. China's policies on FDI : review and evaluation. In: Does foreign direct investment promote development?. Washington, DC: Institute for International Economics, pp. 315-336.
Gwartney, J., Hall, J., and Lawson, R. 2015. Economic Freedom of the World: 2015 Annual Report. Canada: Fraser Institute. [Online]. [Accessed: 9th May 2016]. Available at: http://www.freetheworld.com/release.html

23
Hall, A. R. 2005. Generalized method of moments. Oxford: Oxford University Press.
He, Q., and Sun, M. 2014. Does fiscal decentralization promote the inflow of FDI in China?. Economic Modelling. Volume 43, pp. 361-371.
Ho, O.C. 2004. Determinants of Foreign Direct Investment in China: A Sectoral Analysis. University of Western Australia [Online]. [Accessed: 9th May 2016]. Available at: https://ideas.repec.org/p/uwa/wpaper/04-18.html
KPMG Global China Practice, 2016. China Outlook 2016. [Online] [Accessed: 8th May 2016]. Available at: http://www.kpmg.com/cn/en/issuesandinsights/articlespublications/pages/china-outlook-2016.aspx#.VxUHKPkrLIU
National Bureau of Statistics of China, 2014. National Data. [Online] [Accessed: 8th May 2016]. Available at: http://data.stats.gov.cn/english/easyquery.htm?cn=C01
Rao, K. C. S., Sridharan, P., and Vijayakumar, N. 2010. Determinants of FDI in BRICS Countries: A panel analysis. International Journal of Business Science and Applied Management. 5(3), pp. 1-13.
Torres-Reyna, O. 2007. Panel Data Analysis Fixed and Random Effects using Stata (v. 4.2). [Online]. [Accessed: 8th May 2016]. Available at: http://dss.princeton.edu/training/
Trading Economics, n.d. China Corporate Tax Rate. [Online]. [Accessed: 7th May 2016]. Available at: http://www.tradingeconomics.com/china/corporate-tax-rate
U.S Chamber of Commerce. 2012. China's Approval Process for Inbound Foreign Direct Investment: Impact on Market Access, National Treatment and Transparency. [no place]: United States Chamber of Commerce.
UNCTAD. 2015. World Investment Report 2015: Reforming International Investment Governance. Geneva: UNCTAD. [Online]. [Accessed: 9th May 2016]. Available at: http://unctad.org/en/pages/PublicationWebflyer.aspx?publicationid=1245
World Bank. 2016. World Development Indicators. [Online].[Accessed: 17th April 2016]. Available at: http://databank.worldbank.org/data/reports.aspx?source=2&country=CHN&series=& period=
Zhao, S. 2013. Privatization, FDI inflow and economic growth: evidence from China's provinces, 1978–2008. Applied Economics. 45(15), p. 2127–2139.

24
Appendix
Appendix 1: Economic Freedom of the World Index

25
(continued)
Appendix 2: GMM estimation results
Independent GMM Variables log(FDI)t+1
log(GDP) 0.394 (0.25) [0.799] REER -0.0493 (-0.81) [0.420] Human Capital -597.5 Investment Factor (-0.75) [0.455] Economic -0.759 Freedom Index (-0.25) [0.799] Constant 21.79 (0.58) [0.562]
N 747
Probability > χ2 0.4326 Notes: z statistics are shown in round parentheses “( )” P values are shown in square parentheses “[ ]” Instrumented variables: log(GDP), REER Instruments: Human Capital Investment Factor, Economic Freedom Index, Corporate tax rate, Infrastructure Investment factor, year 2006, year 2007