To Tell the Truth: Management Forecasts in Periods of Accounting Fraud
43
To Tell the Truth: Management Forecasts in Periods of Accounting Fraud Stephen P. Baginski* University of Georgia Sean McGuire Texas A&M University Nathan Sharp Texas A&M University Brady Twedt Texas A&M University July 27, 2011 We thank J. Karpoff, S. Lee, and G. Martin as well as Audit Integrity for sharing SEC Enforcement Action data. *Corresponding author Stephen P. Baginski Terry College of Business 255 Brooks Hall The University of Georgia Athens, GA 30602-6252 Phone: 706.542.3608 Fax: 706.542.3630 [email protected]
Transcript of To Tell the Truth: Management Forecasts in Periods of Accounting Fraud
To Tell the Truth: Management Forecasts in Periods of Accounting Fraud
Stephen P. Baginski*
University of Georgia
Sean McGuire
Texas A&M University
Nathan Sharp
Texas A&M University
Brady Twedt
Texas A&M University
July 27, 2011
We thank J. Karpoff, S. Lee, and G. Martin as well as Audit Integrity for sharing SEC
Enforcement Action data.
*Corresponding author
Stephen P. Baginski
Terry College of Business
255 Brooks Hall
The University of Georgia
Athens, GA 30602-6252
Phone: 706.542.3608
Fax: 706.542.3630

1
ABSTRACT
Using a sample of firms subject to Securities and Exchange Commission (SEC) Enforcement Actions, we
compare changes in the incidence, news content, bias, and accuracy of fraud firms’ management earnings
forecasts to the changes observed in a sample of control firms matched on industry, size, and fraud risk.
We find that, although managers of control firms significantly increase the number of their earnings
forecasts over time, managers of fraud firms initially provide more forecasts during the fraud period, but,
once the fraud period ends, managers of fraud firms decrease the quantity of their earnings forecasts both
in the post-fraud period before the fraud is revealed and after the fraud is publicly known. Relative to
control firms, managers of fraud firms are more likely to issue a significantly greater proportion of bad
news forecasts during fraud than either before or after the fraud period, and issue less ex post
optimistically biased and more accurate forecasts during the fraud period than they did prior to the fraud
period. In combination, our results suggest that managers of fraud firms increase their use of credible
earnings forecasts to manage investor expectations downward during periods of fraud while
simultaneously fraudulently manipulating earnings to meet or beat market expectations. We also find that,
relative to the control sample, the market responds more strongly to both the good news and bad news
earnings forecasts of fraud firms, both during and after fraud, relative to the pre-fraud market response.
Thus, public revelation of the fraud does not appear to taint the credibility of management forecasts. As
a whole, the results suggest that management forecasts are of a high quality (traditionally defined) and
perceived as credible while managers commit fraud.
JEL classification:
M40
M41
M45
Keywords:
Management forecasts
Voluntary disclosure
Fraud
2
1. Introduction
Empirical accounting research related to earnings quality and voluntary disclosure quality has
progressed, to a great extent, in isolation, even though accounting theory has long recognized the potential
relation between the two. Recently, empirical findings suggest a complementary relation. For example,
Lennox and Park (2006) find that firms with higher earnings response coefficients (a proxy for earnings
quality) release management earnings forecasts more frequently (a proxy for voluntary disclosure
quality). Using several alternative proxies for earnings quality (i.e., accruals magnitude, earnings
variability, and predictive ability for cash flows), Francis et al. (2008) also find that firms with higher
earnings quality have higher voluntary disclosure quality as measured by an index of disclosure derived
from annual reports. More recently, Ball et al. (2009) extend the notion of a complementary relation by
testing the “confirmation” hypothesis, a conjecture that reported, audited, backwards-looking outcomes
discipline and hence enhance management forecast credibility. Specifically, they document that firms
committing to higher audit fees (a proxy for earnings quality because it measures the extent of verification
and hence the freedom from earnings manipulation) also issue management forecasts that are more
frequent, more precise, and elicit larger price reactions.
We extend this literature by investigating an important context in which the relation between
earnings quality and voluntary disclosure quality is likely unique – the context of accounting fraud. In
most accounting frauds, managers interject bias into realized earnings numbers by violating generally
accepted accounting principles governing earnings measurement. Thus, earnings quality declines, and a
complementary relationship between earnings quality and voluntary disclosure quality implies lower
voluntary disclosure quality as well. However, a key incentive to commit fraud, the desire to meet or beat
earnings expectations, also creates an incentive for more frequent, less optimistically biased, and more
accurate management earnings forecasts (an important voluntary disclosure) to manage the expectations
that firms wish to beat. That is, in periods in which the incentive to meet or beat expectations has become
so strong so that managers choose to commit fraud and damage earnings quality, voluntary disclosure
3
quality (traditionally measured) can remain high, and may in fact increase due to an enhanced role of
management forecasts in managing earnings expectations.
To investigate the association between fraud (our earnings quality proxy) and voluntary
disclosure quality, we examine the management earnings forecast behavior of 119 firms that were subject
to accounting-related Securities and Exchange Commission (SEC) Enforcement Actions during pre-fraud,
fraud, post-fraud, and public periods, where public period is defined by public knowledge of the fraud
(i.e., when regulatory proceedings are initiated and the public is informed of the alleged fraud).1
Specifically, we compare changes over time in the incidence, news content, bias, and accuracy of fraud
firms’ management earnings forecasts to the changes observed in a sample of control firms matched on
industry, size, and fraud risk. We find that relative to the pre-fraud period, managers of both fraud and
matched non-fraud firms significantly increase the frequency of earnings forecasts during the fraud
period. In addition, we find that relative to both the control firms and their own behavior in the pre-fraud
period, firms that engage in fraud are more likely to issue management forecasts that contain bad news
during the fraud period. The forecasts during fraud periods are also less ex post optimistically biased
relative to the pre-fraud period, and more ex post accurate relative to the pre-fraud period. These results
are consistent with managers of fraud firms using multiple tools (i.e., managing expectations downward
while simultaneously manipulating earnings) to meet market expectations. As fraud firms move from the
fraud periods to post-fraud and public periods, they significantly decrease the frequency of their forecasts
and are less likely to issue forecasts that contain bad news relative to control firms. However, the fraud
firms maintain the relatively lower bias and greater accuracy for the forecasts they issue in post-fraud and
public periods.
We also examine investor assessment of the credibility of fraud period management forecasts by
examining the stock market reaction to management forecasts in those periods compared to our sample of
control firms. We find that, relative to the control sample, market responses to fraud firm forecasts are
1 Technically, the term “fraud” is a legal term that can only be determined by a court of law. However, we use
“fraud” to refer to firms that face enforcement actions from the Securities and Exchange Commission for outside-
4
more pronounced for both good and bad news in fraud, post-fraud, and public periods relative to pre-fraud
periods. This finding is in marked contrast to Hui and Lennox (2009), who find that investors discount
actual earnings news in fraud periods even after they control for ex ante fraud risk (as we do via a control
group matched to our fraud firms on industry, size, and fraud risk). These results suggest that investors
perceive management forecasts as credible in fraud periods and are consistent with our finding that firms
issue more accurate and less ex post optimistically biased forecasts during periods of fraud, thereby
establishing a reputation for credible disclosure.2
Furthermore, our results suggest that the improvement in forecast quality demonstrated by fraud
firms during the fraud period and maintained during post-fraud establishes a reputation for credible
forecasting among investors that persists after the fraud ends. Public revelation of the fraud does not
appear to taint the credibility of management forecasts. Interestingly, while the decrease in management
forecast frequency we detect post-fraud is consistent with a reduced need to manage expectations, it is
also consistent with a fear of drawing attention to the firm before the fraud is revealed. The further
forecast frequency reduction in the public period is consistent with increased monitoring from regulators.3
This study contributes to the literature on the relation between voluntary disclosure and earnings
quality, the literature that investigates the causes and consequences of fraudulent reporting4, and the
voluntary disclosure literature in general. With respect to the relation between earnings quality and
voluntary disclosure, the conclusion of recent studies is that the relation is complementary. We extend
this line of research using an unambiguous measure of the choice of earnings quality: the incidence of
2 An alternative interpretation is that the market is fooled by accounting manipulations during fraud periods (Bardos
et al. 2010) that simply make the management forecasts appear to be credible. However, this interpretation admits
that managers can choose low earnings quality to cause the market to perceive that voluntary disclosure quality is
high, and thus, expands the interpretation of Ball et al.’s (2009) confirmation hypothesis to add the idea that both
earnings quality enhancing choices (e.g., paying higher audit fees to reduce the ex ante likelihood of fraud) and
earnings quality destruction choices (e.g., commission of ex post fraud) can enhance investors’ perception of
management forecast credibility. 3 A related potential alternative explanation is that new participants in the earnings measurement and disclosure
process (i.e., new CEOs) wish to establish a reputation for credible forecasting in the presence of this increased
monitoring. In a supplemental analysis, we control for management turnover and our results remain qualitatively
similar. 4 See Dechow et al. (1996), Healy and Palepu (2003), Palmrose and Scholz (2004), Desai et al. (2006), Erickson,
Hanlon, and Maydew (2006), Efendi et al. (2007), Karpoff et al. (2008a, 2008b), and Dechow et al. (2010).
5
fraud. Contrary to findings in prior research, our results suggest that voluntary disclosure quality (as
measured by accuracy, bias, and information content) and earnings quality are not complementary during
periods of accounting fraud. Identifying different effects for alternative proxies for earnings quality is an
important theme in Dechow et al. (2010). In addition to documenting a unique relation between earnings
quality and voluntary disclosure quality when earnings quality is proxied by fraud, our findings and
interpretations suggest that research into the relationship between fraud and voluntary disclosure quality
requires a more precise definition of voluntary disclosure quality to permit unambiguous interpretation of
the association of fraud-induced low earnings quality and voluntary disclosure quality.
With respect to understanding the effects of fraud, it is reasonable to believe that fraud might taint
the credibility of the entire measurement and disclosure process. However, our results suggest that
incentives to engage in quality voluntary disclosure while committing fraud remain strong, most likely
because of management’s incentive to meet market expectations and the usefulness of credible voluntary
disclosure to lower investors’ earnings expectations while concurrently increasing reported earnings
(artificially) through fraudulent reporting. To our knowledge, ours is the first study to present evidence on
whether the act of fraud influences the voluntary disclosure behavior of fraud firms in fraud periods.
Finally, while research on management earnings forecasts has examined the effects of
shareholder litigation (Skinner 1997; Rogers and Van Buskirk 2009), managerial incentives (Aboody and
Kasznik 2000; Rogers and Stocken 2005), proprietary information costs (Ajinkya et al. 2005; Wang
2007), and accounting conservatism (Hui et al. 2009) on firms’ voluntary disclosure behavior, it has not
addressed the question of how accounting fraud impacts managers’ use of earnings forecasts. Also, prior
research has examined the intertemporal relation between disclosure reputation and assessment of
management forecast credibility (e.g., Baginski and Hassell 1990; Williams 1996; Mercer 2004; Rogers
and Stocken 2005), but it has not investigated the effects of fraud on assessments of management earnings
forecast credibility. We provide evidence concerning how investors respond to the issuance of subsequent
voluntary disclosures once a fraud has become public knowledge. Specifically, our results suggest that
6
once a firm has established a reputation for credible forecasting, the benefits to forecast credibility appear
to be long-lived.5
The remainder of the paper proceeds as follows: Section 2 reviews the literature and develops our
empirical predictions. The research design is specified in Section 3. We describe our sample of fraud and
matched nonfraud firms in Section 4, and empirical results are presented in Section 5. Section 6 discusses
additional analyses, and Section 7 concludes the paper.
2. Key Definitions, Assumptions, and Empirical Predictions
Prior to making empirical predictions, we discuss earnings quality and voluntary disclosure
quality constructs, our proxies for the two constructs, and the assumptions under which the proxies are
valid.
2.1. Earnings “Quality”
Dechow et al. (2010) note the existence of several alternative proxies for earnings quality, each
with its own strengths and weaknesses. The primary strength of using SEC Accounting and Auditing
Enforcement Releases (AAERs) as a proxy for low earnings quality is that an outside source, the SEC,
has identified a problem with earnings quality, and thus, the researcher benefits from avoiding the
potential misspecification (and resulting Type I errors) of a model of earnings quality. Further, as
opposed to samples of restatements and internal control deficiencies, AAERs maximize the likelihood
that the decline in earnings quality is intentional. This characteristic of AAERs is important for our study
because voluntary disclosure quality is also a choice, and we are interested in the complementary nature
of earnings quality and disclosure quality choices.
5 An independently developed concurrent study, Ettredge, Huang, and Zhang (2011) examine whether managers
change their forecasting behavior subsequent to the public announcement of an accounting restatement. In contrast,
our study examines whether the act of intentionally misreporting is associated with changes in managers’ forecasting
behavior before, during, or after the period in which managers commit fraud. In addition, we document the market’s
assessment of forecast credibility during fraud periods. We provide insights into the role that voluntary disclosures
play in helping managers of fraudulent firms manage market expectations during and after fraud. We also examine
whether the changes in managers’ voluntary disclosure behavior persists into future periods, including the period
after the fraud is revealed to the public.
7
The primary weakness of choosing AAERs as a measure of lower earnings quality is identifying
the “high quality” condition. Dechow et al. (2010) note that a non-SEC enforcement control group might
also contain firms that engage in overly aggressive earnings management but, for some reason, avoid SEC
enforcement (a Type II error). Accordingly, we use the fraud firm as its own control by basing our
primary tests on differences in voluntary disclosure behavior in fraud periods relative to periods in which
the SEC either argues fraud has not been committed or that it is not sufficiently certain that fraud has been
committed to say so. Therefore, our key assumption is that, given the SEC has chosen to charge a given
firm with fraud and investigated it, the SEC’s designation of the period in which the fraud was committed
is reliable evidence that earnings quality was compromised in an egregious manner relative to periods
designated as not containing fraud.
We also utilize a control group of firms matched on size, industry, and fraud risk (discussed
later). But, the purpose of that control group is to control intertemporally for changes in expected
voluntary disclosure characteristics (i.e., management forecasts frequency, bias, accuracy, tenor of news,
and information content) of firms that fit the profile of high fraud risk firms based on corporate
governance structures and changes in key financial statement variables.
2.2. Voluntary Disclosure “Quality”
Ball et al. (2009) document an association between higher audit fees and more frequent
management forecasts, more specific management forecasts, and a greater price reaction to those
forecasts. The first two proxies, frequency and specificity, are commonly used measures of management
forecast quality (Bamber and Cheon 1998; Ajinkya et al. 2005; Francis et al. 2008; Rogers and Van
Buskirk 2009). The proxy for management forecast credibility in equity markets, price reaction to the
forecast, is also well-established (Pownall and Waymire 1989). Related to forecast specificity (to the
extent that it measures uncertainty), management forecast bias and accuracy are additional measures of
management forecast quality obtained by an ex post comparison of the forecast to realized earnings
(Williams 1996; Rogers and Stocken 2005).
8
Consistent with prior literature, our empirical tests use frequency, bias, accuracy, and price
reaction as measures of management forecast disclosure quality, and we draw conclusions assuming that
the proxies are valid. Whenever possible, we consider alternative interpretations and what those
interpretations teach us about the association between earnings quality and disclosure quality. This is
necessary because each of these proxies has its strengths and weaknesses in general and in the specific
context of fraud.
Frequency is a simple count of forecast incidence and, thus, is independent of whether actual
earnings are measured in accordance with generally accepted accounting principles or fraudulently.
However, more frequent forecasts are not necessarily less biased, more accurate, or more price
informative. That is, in the context of Dechow et al.’s (2010) discussion of earnings quality, forecast
frequency is divorced from any discernable decision task.
Bias and accuracy directly measure the ability of managers to forecast earnings, and thus
(assuming a known mapping of earnings into prices), are directly linked to an investor’s decision task.
However, their measurement depends on realized earnings, which can be manipulated by management.
That is, the earnings quality condition affects the measurement of voluntary disclosure quality. However,
if the decision task of interest is predicting what earnings number will be revealed in the upcoming
earnings release (a task that is independent of earnings quality), then management forecast bias and
accuracy are valid measures of quality.6 Alternatively, if the decision task of interest is predicting what
value-relevant earnings will be revealed in the upcoming earnings release, then management forecast bias
and accuracy remain valid measures of quality if the market does not differentially value the fraudulent
component of earnings.
6 Management earnings forecasts are fundamentally different from many other types of voluntary disclosure. Some
voluntary disclosures are of non-mandated information. For example, disclosing an expansion strategy or attributing
an expected earnings increase or decrease to some internal or external phenomenon represent disclosures that are not
followed by a mandatorily disclosure of the same information. However, management earnings forecasts are simply
early disclosures of forthcoming (often, shortly forthcoming) mandated earnings releases. The timing aspect of a
management forecast permits sharing of management’s private information, mitigation of private information
acquisition by others, reduction of information asymmetry, and increase in share value.

9
Price reaction at the management forecast date has the advantage of being independent of
realized earnings unless managers convey a forecast of what they know will be fraudulently reported
earnings. Known forecasting of fraudulent earnings does not render price reactions as invalid
measurements of management forecast credibility if the market discounts fraudulent earnings. Whether
the market can ascertain fraud before it is publicly announced is an empirical question on which there are
mixed results. Hui and Lennox (2009) find that investors respond less strongly to the positive earnings
surprises of firms committing accounting fraud than the positive surprises of nonfraud firms. However,
recent evidence from Bardos et al. (2010) suggests investors are unable to initially see through mistakes
in materially misstated earnings and attach the same valuation to the component of a positive earnings
surprise that will be restated as they do to the true earnings surprise.
2.3. Empirical Predictions
2.3.1. Frequency
While all managers have incentives to meet the market’s expectations of earnings, the willingness
of managers of fraud firms to engage in unlawful behavior suggests they face greater pressure to avoid
missing market expectations than managers of other firms. Indeed, SAS No. 99 identifies external
pressure as one of the three risk factors associated with fraudulent behavior (Skousen and Wright 2008).
Similarly, Dechow et al. (1996) state that “influencing investor perceptions of firm value provides a
primary motivation for earnings manipulation,” (p.4) and Graham et al. (2005) find that managers view
the meeting of earnings targets as essential to maintaining credibility with the market and preventing a
decrease in stock price. Graham et al. (2005) also report that managers are frequently willing to make
sacrifices in long-term economic value in order to meet current analyst and investor earnings
expectations.
As an alternative to manipulating actual earnings, managers can also manage earnings
expectations through voluntary disclosure (Ajinkya and Gift 1984). Soffer et al. (2000) document that
managers strategically time the disclosure of bad news in order to walk down investors’ earnings
10
expectations to a beatable level, and Baik and Jiang (2006) find that managers’ attempts to use pessimistic
guidance to lower expectations often result in an increased probability of meeting analyst forecasts. Also,
Brown and Higgins (2005) find that U.S. managers are more likely to use forecast guidance to avoid
negative earnings surprises than managers in other countries, due to strong investor protection laws.
Matsumoto (2002) and Burgstahler and Eames (2006) find evidence that managers often use a
combination of increasing reported earnings through earnings management while lowering expectations
through negative earnings guidance.
If managers of fraud firms face increased pressure to manage the market’s expectations, we
expect to observe a higher frequency of management earnings forecasts during periods of fraud than we
observe for managers of matched nonfraud firms. Further, fraud is evidence that within GAAP earnings
management is constrained, suggesting an enhanced role for management forecasts in meeting or beating
expectations. Given that an increase in management forecast frequency is a measure of voluntary
disclosure quality, this prediction is in contrast to the notion of a complementary relation between
earnings quality and voluntary disclosure quality during periods of fraud.
However, managers of fraud firms also have incentives to reduce their voluntary disclosures
during fraud for two reasons. First, managers are exposed to legal penalties under SEC Rule 10b-5,
which provides that the plaintiff must establish that managers’ earnings forecasts were intentionally false
or misleading. If the fraud is uncovered, managers whose voluntary disclosures are shown to have misled
the market through overly optimistic forecasts or by failing to disclose materially adverse information are
likely to face shareholder lawsuits under SEC Rule 10b-5. Second, bad news management forecasts
disclose poor performance, a condition that managers are generally trying to hide via fraud. So, bad news
forecasts might be suppressed. Thus, it is possible that the frequency of management earnings forecasts
will decline during periods of fraud.
2.3.2. News Content
Managers’ efforts to lower investor expectations should result in the issuance of forecasts that fall
below current market expectations (Matsumoto 2002). Therefore, we expect that managers are more
11
likely to issue disclosures that fall short of analyst expectations during periods of fraud. Evidence on our
conjecture provides a gauge of the relative strength of competing incentives. While bad news forecasting
is consistent with maximizing the likelihood of meeting or beating lowered expectations, it is not
consistent with the notion that managers have incentives to hide or at least delay bad news. Dechow et al.
(2010) suggest that managers of fraudulent firms attempt to hide declining performance and note that
fraudulent firms have abnormally strong stock return performance in the years before the fraud begins.
Accordingly, managers of fraudulent firms may be less likely to issue bad news forecasts in an effort to
mask declining performance and maintain their firm’s stock price. Further, Kothari et al. (2009) provide
evidence that suggests that, on average, managers delay the disclosure of bad news and disclose good
news in a timely manner.
2.3.3. Bias
In addition to controlling the overall news content of their forecasts, managers have the ability to
bias their earnings forecasts (Hirst et al. 2008). However, Rogers and Stocken (2005) note that managers’
abilities to bias their forecasts are limited because investors are able to use the subsequent earnings report
to determine whether management is providing credible forecasts. To the extent that fraud allows
managers to hide or at least delay the revelation of declining performance, the act of fraud would be
associated with more optimistically biased forecasts. Consistent with this notion, Rogers and Stocken
(2005) find that managers are more likely to strategically bias their forecasts, according to their
incentives, when it is more difficult for investors to assess the credibility of the forecasts. In contrast, the
act of fraud is potentially associated with less optimistically biased forecasts because, as discussed above,
managers are likely to be concerned with the legal liability associated with issuing false or misleading
forecasts under SEC Rule 10b-5 and may not wish to suffer the capital market consequences of falling
short of a management forecast. In addition, prior research suggests that managers develop a forecasting
reputation based on their prior forecasts (Williams 1996), which suggests that optimistically biased
management forecasts will potentially taint management’s forecasting reputation and limit managers’
ability to use earnings forecasts to meet or beat expectations in the future.
12
2.3.4 Accuracy
Finally, we examine whether managers’ strategic incentives influence the accuracy of their
forecasts during fraud. Although managers have incentives to disregard forecast accuracy and issue
forecasts in a strategic manner, we expect that fraud will be associated with more accurate forecasts for
two reasons. First, as discussed above, managers are able to minimize their legal liability under SEC Rule
10b-5 by providing accurate forecasts. Second, prior research suggests that managers with greater
accounting flexibility are more likely to issue accurate forecasts (Kasznik 1999). Given that managers
engaging in financial statement fraud have more control over reported “actual” earnings than managers of
nonfraud firms, they should be more capable of ensuring that reported earnings are in line with their own
forecasts than managers of nonfraud firms. In addition, accurate forecasts likely strengthen
management’s forecasting reputation and enhance the role of forecasts in meeting or beating expectations.
2.4. Investor Assessment of Management Earnings Forecast Credibility
Bardos et al. (2010) find evidence that investors are initially unable to see through mistakes in
materially misstated earnings and attach the same valuation to the component of a positive earnings
surprise that will be restated as they do to the true earnings surprise. However, Hui and Lennox (2009)
find that investors respond less strongly to the positive earnings surprises of firms committing accounting
fraud than the positive surprises of nonfraud firms. This result suggests that even before a fraud is
revealed publicly, investors discount the earnings of firms that are later revealed to have reported
fraudulently. Based on this evidence, we would also expect the market to view the earnings forecasts of
fraud firms as less credible than the forecasts of nonfraud firms during the fraud period.
Earnings forecasts of fraud firms issued during the public period could also be viewed by the
market as either more or less credible than those of nonfraud firms. Specifically, the market may discount
the credibility of fraud firms’ forecasts in the public period because managers’ willingness to engage in
deceitful behavior is now known publicly. After investors learn that managers have deceived them,
investors may find it difficult to trust the subsequent forecasts issued by those same managers.

13
Alternatively, investors may view the revelation of fraud as the beginning of managers’ efforts to
develop a stronger future reputation. For example, prior research has found that accounting fraud often
leads to significant management turnover (Karpoff et al. 2008a).7 To the extent that firms make a
substantial effort post-fraud to regain the trust of investors, including the use of managerial turnover, their
subsequent forecasts may have more credibility with the market than those of other firms. In addition, if
fraud firms establish a reputation for accurate forecasts during the fraud period, this reputational effect
may persist into subsequent periods.
3. Research Design
3.1. Management Forecast Properties
To investigate the association between accounting fraud and changes in firms’ disclosure
behavior, we follow Rogers and Van Buskirk (2009) in regressing proxies for firms’ disclosure behavior
on a series of indicator variables that represent different time periods relative to the event of interest,
which in our setting is the fraud period. Our initial model is as follows:
DiscProxy = β0 + β1 PreFraudPeriod + β2 PostFraudPeriod + β3 PublicPeriod + ε (1)
The dependent variable, DiscProxy, represents various measures of management forecast quality
in different regressions. Frequency is defined as the average number of forecasts per quarter issued by
the firm during a given time period. BadNewsD, a dummy variable equal to one if the earnings forecast
contains negative news, and zero otherwise, where news content is determined by comparing the forecast
to the most recent consensus analyst forecast; Bias, equal to the management EPS forecast minus reported
EPS scaled by the stock price as of two days before the forecast; and F_AbsError, measured as the
absolute value of Bias. Consistent with prior research, larger values of F_AbsError indicate less accurate,
and thus lower quality, forecasts (Ajinkya et al. 2005; Bamber et al. 2010).
7 In additional analysis (discussed later), we control for executive turnover and find that our inferences remain the
same.
14
In equation (1), we use indicator variables that are designed to capture changes in disclosure
behavior relative to the fraud period (the benchmark period). We define the fraud period based on
information from SEC Enforcement Actions and examine three separate time periods that surround the
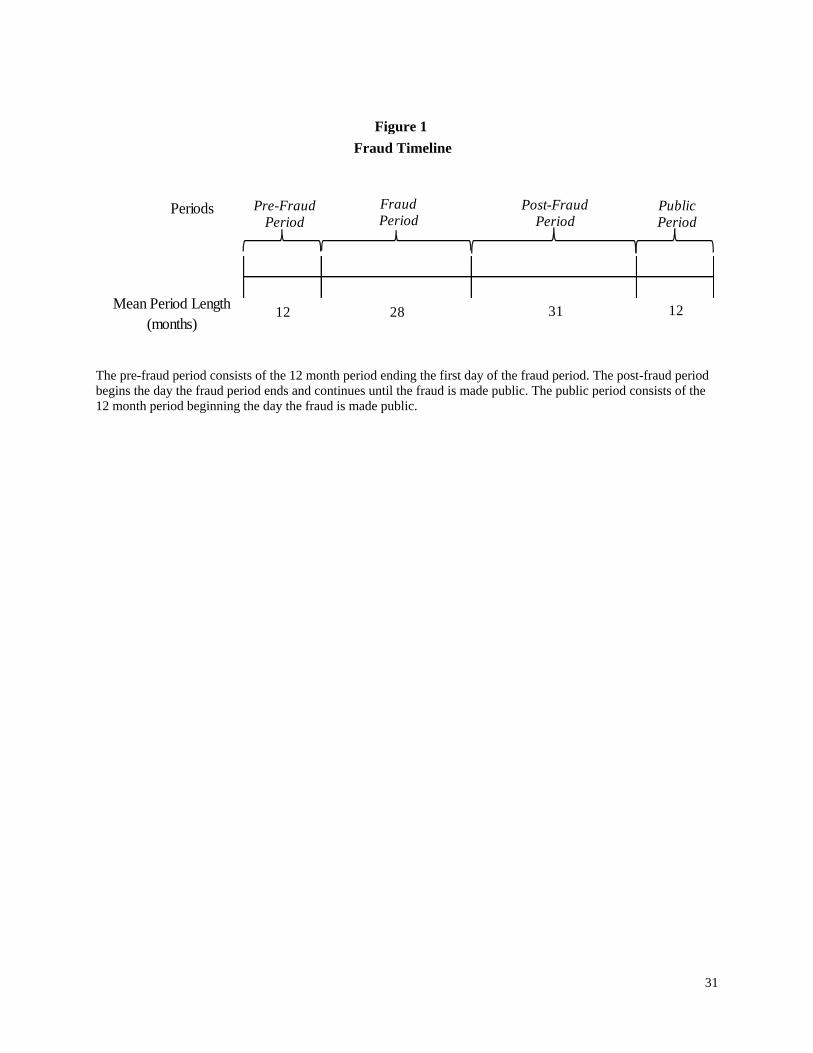
fraud period (see Figure 1). PreFraudPeriod is an indicator variable set equal to one during the twelve
months preceding the fraud, and zero otherwise. PostFraudPeriod is an indicator variable set equal to
one for the period after the fraud, but before the fraud becomes public knowledge, and zero otherwise.
Finally, PublicPeriod is an indicator variable set equal to one during the twelve months after the fraud
becomes public knowledge, and zero otherwise.8
Using equation (1), we can observe changes in the disclosure behavior of fraud firms by
examining the coefficients on the various time periods (β1 to β3) relative to the fraud period (the base
group). However, both the decision to commit fraud and the decision to change forecasting behavior are
endogenous firm choices. Accordingly, we match each fraud firm with a nonfraud firm based on
industry, size, and ex ante fraud risk. This ensures that observed changes in disclosure behavior are driven
by the fraud event itself, and not other factors that high fraud risk firms have in common.9 Details of this
matching procedure are presented in Section 4.1.
We assign each control firm to pre-fraud, fraud, post-fraud, and public time periods that
correspond to those of the fraud firm with which it is paired. We then augment equation (1) by including
two indicator variables to distinguish between the fraud firms and matched firms. In the augmented
equation (2), the indicator variable Fraud equals one if the observation represents a firm that committed
8 Kedia and Rajgopal (KR, 2011) present a timeline of SEC events as depicted in Karpoff et al. (2008a) in their
Figure 1 (p. 265). To enhance the comparison of our paper to theirs, our pre-fraud period is the period left of the KR
“violation period.” Our fraud period is the same as the KR “violation period.” Our post-fraud period is the period
between the end of the KR “violation date” and the date of the “initial regulatory proceeding” in KR. Our public
period is the period after the initial regulatory proceeding, which is the point at which it is known publicly that the
SEC is initiating an enforcement action. The SEC typically conducts an informal and\or formal investigation (which
is generally not known publicly) before the Enforcement Action is announced on the initial regulatory proceeding
date and does not move forward with an Enforcement Action unless they believe there is evidence of egregious
misreporting. 9 Prior research also suggests that disclosure choices are driven by firm performance (e.g., Miller 2002). To
examine whether our results are robust to changes in firm performance, we perform supplemental analyses in which
we match firms based on size, industry, and return on assets at the beginning of the fraud period. Inferences remain
the same under the alternative matching procedure.
15
fraud, and zero otherwise, and the indicator variable Match equals one if the observation is from a
matched firm, and zero otherwise. Additionally, we include firm size, defined as the natural log of market
value of equity, book-to-market ratio, analyst following, and industry fixed effects to control for other
factors that may have an effect on firms’ disclosure behavior.10 All continuous variables are winsorized at
the 1st and 99th percentiles to alleviate the effects of outliers on the analysis. Our final regression model is
as follows, with standard errors clustered by firm and year to control for dependency in the error terms
(Gow et al. 2010; Petersen 2009):
DiscProxy = β0 + β1 Fraud x PreFraudPeriod + β2 Fraud x PostFraudPeriod
+ β3 Fraud x PublicPeriod + β4 Match x PreFraudPeriod
+ β5 Match x FraudPeriod + β6 Match x PostFraudPeriod
+ β7 Match x PublicPeriod + Гi CONTROLS + ε (2)
The benchmark group in equation (2) (captured by the intercept) is fraud firms during the fraud
period. Therefore, the coefficients on the fraud firm variables, β1, β2, and β3, represent the change in the
fraud firms’ disclosure behavior from the fraud period to the pre-fraud, post-fraud, or public period,
respectively. To capture the change in disclosure for the matched firms, the coefficients for the matched
firms in the nonfraud periods (β4, β6, and β7) can be compared to the matched firms’ disclosure behavior
during the fraud period (β5).
Because we are primarily interested in the abnormal change in the disclosure behavior of fraud
firms (that is, the change incremental to that observed in comparable nonfraud firms), we test our
hypotheses by comparing the coefficients on the fraud firm variables to the combined coefficients on the
matched firm variables using F-tests. For example, to examine whether a change in disclosure behavior
from the fraud period to the public period is different for fraud firms than for matched firms, we perform
an F-test on the difference between β3 and (β7 - β5). A positive difference represents a larger change in
disclosure for the fraud firms relative to the change in disclosure behavior for the matched firms from the
10 Our results are robust to including additional control variables in equation (2). Specifically, inferences remain the
same when we control for firm performance (return on assets) during the period, management forecast horizon, and
whether the forecast was for quarterly or annual earnings.
16
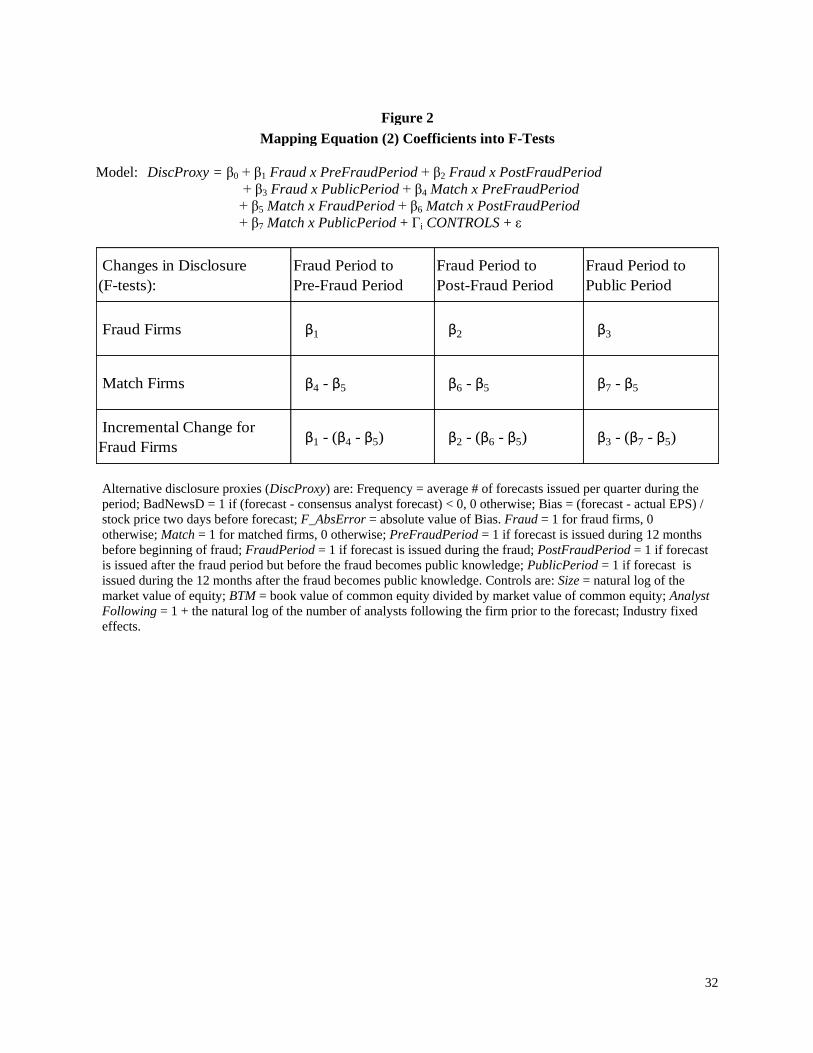
fraud period to the public period. Figure 2 details how the coefficients from equation (2) map into the F-
tests upon which we base our inferences. By focusing our analysis on F-tests comparing changes in the
disclosure behavior of fraud firms over time relative to those observed in the matched firms, we are able
to better isolate the changes in disclosure behavior that are due exclusively to the fraud event itself.
3.2. Investor Assessment of Management Forecast Credibility
Next, we examine the impact of accounting fraud on investor assessment of management forecast
credibility. Following prior research (e.g., Pownall and Waymire 1989), we use the market reaction to the
news contained in a forecast as a proxy for forecast credibility, where news is defined as the forecast’s
deviation from the most recent consensus analyst forecast. To investigate how the act of fraudulent
reporting impacts the market reaction to management earnings forecasts, we estimate the following
regression, again with standard errors clustered by firm and year:
CAR = γ0 + γ1 GoodNews + γ2 BadNews + γ3 Fraud
+ γ4 Fraud x GoodNews + γ5 Fraud x BadNews
+ γ6 Period + γ7 Period x GoodNews + γ8 Period x BadNews
+ γ9 Period x Fraud x GoodNews + γ10 Period x Fraud x BadNews
+ Гi CONTROLS + ε (3)
The dependent variable in the above regression, CAR, is the firm’s three day, size-adjusted stock
return centered on the day the management forecast is issued. ForecastNews is the management forecast
minus the current consensus analyst forecast, scaled by the stock price as of two days before the forecast.
GoodNews equals ForecastNews when ForecastNews is greater than zero, ranked by year and scaled to
range between zero and one, and zero otherwise. BadNews equals the absolute value of ForecastNews
when ForecastNews is less than zero, ranked by year and scaled to range between zero and one, and zero
otherwise.11 Fraud is an indicator variable equal to one for fraud firms, and zero for matched firms.12
11 Results are qualitatively similar when the raw values of GoodNews and BadNews are used in place of the
rankings. 12 As described above and in Section 4.1, match firms are identified based on industry, size, and ex ante fraud risk. It
is especially important to identify comparable match firms based on ex ante fraud risk because investors’
17
Period is defined contextually. For example, when we compare the fraud period to the pre-fraud period,
Period equals one in the fraud period and zero in the pre-fraud period. Coefficients of primary interest are
γ9, which measures the change between periods of interest in information content of good news forecasts
by fraud firms relative to control firms, and γ10, which measures the same effect for bad news forecasts.
The other variables in equation (3) are included to control for additional factors that have been
shown to affect the market reaction to management earnings forecasts. Shock is defined as the absolute
value of ForecastNews. Precision is a count variable set equal to two for point estimates, one for range
estimates, zero for open-ended forecasts, and missing for qualitative forecasts. Horizon is an indicator
variable set equal to one for quarterly forecasts, and zero for annual forecasts. Size and BTM are defined
as the natural log of market value of equity and book-to-market ratio, respectively. Again, all continuous
variables are winsorized at the first and 99th percentiles.
4. Sample Description
4.1. Sample Selection
Our initial sample of fraud firms is based on 396 firms subject to SEC enforcement actions for
fraud periods beginning after 1997.13 From this initial sample, we remove 68 firms whose public periods
end after 2008, where the public period is defined as the year after the existence of the fraud becomes
public knowledge. We also require each firm to issue at least one earnings forecast, obtained from First
Call’s Company Issued Guidance Database, between the pre-fraud and public periods, resulting in the
elimination of an additional 146 firms.14
perceptions of fraud risk potentially cause the market to discount the credibility of management’s earnings forecasts.
Accordingly, matching on ex ante fraud risk reduces that likelihood that any differential market response to the
forecasts of fraud firms relative to nonfraud firms is driven by differences is investors’ perceptions of the likelihood
that a firm is committing fraud. 13 Our sample of SEC enforcement actions comes from hand collected samples obtained from Karpoff et al.
(2008a,b) and from Audit Integrity. We require the fraud period to begin after 1997 to ensure availability of
management earnings forecast data from First Call. 14 Following Ajinkya et al. (2005), we require that all sample firms (both fraud and match firms) have analyst
coverage on the First Call Analyst Forecast Database during the sample period to ensure that our sample firms are
covered by First Call during the sample period.
18
Next, we match each of the remaining 182 fraud firms with a nonfraud firm based on industry,
size, and a fraud risk measure commercially produced by Audit Integrity called Accounting and
Governance Risk (AGR). Price et al. (2011) find that AGR detects and predicts fraud as well or better
than risk proxies developed in the academic literature, including Dechow et al.’s (2011) F-score. We
begin our matching procedure by identifying all nonfraud firms with the same 2 digit SIC code as the
fraud firm.15 We then retain those firms with total assets within 25% of the fraud firm’s total assets as of
the beginning of the fraud period. Out of the remaining possible matches, we keep the firm with the
closest AGR score to that of the fraud firm.
As discussed in the previous section, we match our fraud and nonfraud firms on ex ante fraud risk
because we are interested in the effects of the fraud itself on changes in firms’ disclosure behavior, not
effects driven by other firm characteristics that might be common among firms that operate in a high
fraud risk environment. Thus, matching firms on fraud risk provides us with the most conservative
method for isolating the effects of the fraud itself from other firm characteristics when conducting our
analyses. We lose 63 additional observations due to missing AGR scores or the inability to find a suitable
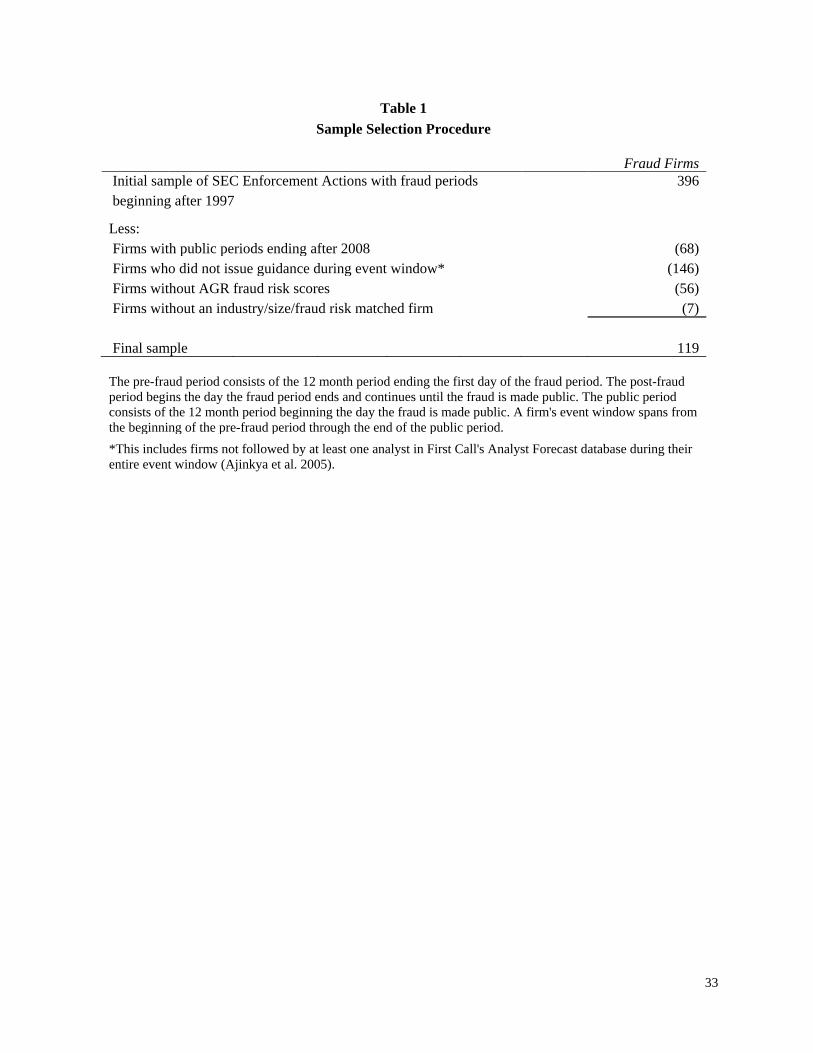
match firm based on the above criteria. The resulting 119 fraud firms and their corresponding matched
firms become our final sample. Table 1 summarizes the sample selection procedure.
4.2. Descriptive Statistics
Table 2 provides various descriptive statistics for our sample. As seen in Panel A, the majority of
the frauds begin between 1998 and 2001. The frauds in our sample begin in 2003 or earlier due to our
data requirement that a firm’s public period must end before 2009 to be included in the final sample. Our
fraud firms also appear to be concentrated in the manufacturing (SIC 20-39) and services (SIC 70-88)
industries (Table 2, Panel B). Panels C and D of Table 2 display characteristics of the fraud and nonfraud
matched firms, respectively. The average fraud is just over two years in length, and it is roughly two and a
half years after the fraud has ended before it becomes public knowledge. Importantly, untabulated
15 We match 14 of our firms on 1 digit SIC codes due to the inability to find suitable matches using 2 digit SIC
codes.
19
analysis suggests that the fraud and matched firms are similar in terms of size (both market value of
equity and total assets), fraud risk (AGR), and economic performance (ROA), which suggests that our
matching procedure is effective.
4.3. Univariate Analysis of Intertemporal Disclosure Trends
Prior to performing our main tests with appropriate controls, we examine simple time series
trends in the management earnings forecast disclosure characteristics (other than information content to
equity markets). Table 3 shows an increase in disclosures per quarter for fraud firms in the fraud period
relative to the pre-fraud period, followed by monotonic decreases in the post-fraud and public periods.
Matched firms substantially increase their disclosures per quarter in a monotonic fashion over the four
periods presented. As we show in Figure 1, the mean number of months from the beginning of the pre-
fraud period to the end of the public period is 83, approximately seven years. This relatively long period
motivates the use of the control group matched on industry, size, and fraud risk to capture general trends
in forecast disclosure frequencies over time. The only other systematic change observable from Table 3
is the intertemporal behavior of the percentage of management forecasts that are bad news. Fraud firms
release fewer bad news management forecasts in the pre-fraud period relative to matched firms. This
condition reverses in the fraud and post-fraud periods.
5. Main Results
In Table 4, Panel A, we present the results of estimating Equation (2). As mentioned in Section 3,
we focus our discussion on the results of F-tests of “differences in differences” derived from the Table 4,
Panel A regressions and presented in Table 4, Panel B.
5.1. Management Forecast Frequency
The results for forecast frequency are presented in the first column of Table 4, Panel B.
Coefficient β1 on Fraud*PreFraudPeriod is negative and significant, indicating that fraud firms
experience a significant increase in the average number of forecasts issued per quarter from the pre-fraud
period to the fraud period (p = 0.047). However, this increase does not appear to be abnormal, or
20
incremental to that observed in the matched firms over the same time frame, as the incremental change for
fraud firms is not statistically different from zero (p = 0.265).
In examining the change in forecast frequency from the fraud period to both the post-fraud period
and the public period, we find significant incremental changes for fraud firms relative to nonfraud firms.
Relative to the nonfraud firms, fraud firms significantly decrease the frequency of their management
earnings forecasts from the fraud period to both the post-fraud and public periods. Specifically, the
incremental changes of -0.388 and -0.643 for the post-fraud period and public period, respectively,
indicate an initial 38.8% decrease in the disclosure levels of fraud firms once the fraud itself has come to
an end, after controlling for any changes in the disclosure behavior of the matched firms, with an
additional 25.5% abnormal decrease in forecast frequency after the fraud becomes public knowledge. The
decreases are significant (p = 0.003 and p = 0.001, respectively).
Overall, our results suggest that both fraud and nonfraud firms significantly increase disclosure
during periods of fraud. However, relative to nonfraud firms, firms that engage in fraud significantly
reduce the frequency of their management earnings forecasts subsequent to the fraud. The decrease in
management earnings forecasts is most pronounced after the fraud has been revealed to the general public
(the public period), which suggests that managers of fraud firms exhibit more cautious behavior
subsequent to the fraud, and especially once the fraud becomes public knowledge.
5.2. Management Forecast News Content
The second column of Table 4, Panel B examines changes in the tendency to issue bad news
forecasts across periods. The negative and significant β1 coefficient indicates that managers of fraud
firms are more likely to issue forecasts that fall short of market expectations during periods of fraud. In
contrast, the difference between β4 and β5 is not statistically different from zero, which indicates that
nonfraud firms do not experience a significant change in the probability of issuing a bad news forecast
during their pseudo-fraud period. The difference in differences test is significantly negative (p = 0.001),
which indicates that the increase in the probability of issuing a bad news forecast is significantly higher
for fraud firms relative to nonfraud firms.
21
In both the post-fraud and public periods, fraud firms are not significantly more likely to issue a
bad news forecast relative to the fraud period (i.e., β2 and β3 are not significant). In contrast, nonfraud
firms are significantly more likely to issue bad news forecasts once the pseudo-fraud period ends
(significantly positive β6 - β5 and β7 - β5). The differences-in-differences are both significantly negative
(p = 0.063 and p = 0.033, respectively). In summary, for fraud firms, the tendency to skew management
earnings forecasts toward bad news increases in the fraud period and decreases in the post-fraud and
public periods. These results are consistent with managers of fraud firms increasing their use of
voluntary forecasts to lower analysts’ earnings expectations during periods of accounting fraud.
5.3. Management Forecast Bias
The third column of Table 4, Panel B presents the results of F-tests examining abnormal changes
in the bias of forecasts issued by fraud firms over time with larger values of Bias indicating more
optimistically biased forecasts. Coefficient β1 (which measures bias in the pre-forecast period relative to
the fraud period) is positive and significant, which suggests that managers of fraud firms provide less
optimistically biased forecasts during periods of fraud. In contrast, the change in bias for the matched
firms is insignificant, which indicates that matched firms did not alter the level of bias in their forecasts
during the pseudo-fraud period. In addition, the incremental change from the fraud period to the pre-
fraud period (i.e., the difference in differences) indicates that managers of fraudulent firms significantly
reduce the optimism in their forecasts during periods of fraud (p = 0.018). This finding is consistent with
managers of fraudulent firms attempting to minimize their legal exposure under SEC Rule 10b-5 by
providing less optimistic forecast during periods of fraud. Further, the differences in the forecast bias of
fraud firms between the fraud period and both the post-fraud period and public period are insignificant,
suggesting that managers continue to issue less optimistically biased forecasts once the fraud concludes.
5.4. Management Forecast Accuracy
The final column of Panel B presents the results for forecast accuracy with larger values of
F_AbsError representing less accurate forecasts. Consistent with expectations, the coefficient β1 is
positive and significant, which suggests that managers of fraud firms provide more accurate forecasts

22
when they are committing fraud relative to the pre-fraud period. In contrast, the change in accuracy for
the matched firms is insignificant, which indicates that matched firms did not alter the level of accuracy in
their forecasts during the pseudo-fraud period. The test of fraud firms incremental change relative to the
match firms is positive and significant (p = 0.006), which is consistent with managers of fraud firms
issuing more accurate forecasts during periods of fraud because, relative to the pre-fraud period, they fear
additional legal exposure, and in addition, credible forecasting is necessary to management market
expectations. Furthermore, fraudulent accounting practices can be used to meet their forecasted earnings
number. We also find a marginally significant incremental change for fraud firms from the fraud period to
the post-fraud period of 0.015 (p = .091), but no significant abnormal change when comparing the fraud
period to the public period. This result suggests that the accuracy of fraud firms’ management earnings
forecasts remains relatively constant after the fraud ends but before the public is aware of the fraud.
Our findings regarding changes in the frequency, news content, bias, and accuracy of
management issued forecasts during periods of accounting fraud provide evidence that managers of fraud
firms actively attempt to manage market expectations through the use of voluntary earnings forecasts. We
find that relative to matched firms, fraud firms decrease their disclosure levels after the fraud period, issue
more bad news during fraud than before or after the fraud period, and issue less optimistically biased and
more accurate forecasts during fraud than they did previously. More frequent, less biased, and more
accurate management forecasts are traditionally considered higher quality management forecasts.
5.5. Management Forecast Credibility in the Equity Market
Table 5 presents the results of estimating equation (3). The coefficients of primary interest are γ9
on the Period x Fraud x GoodNews interaction and γ10 on the Period x Fraud x BadNews interaction.
These coefficients capture the change across periods in the pricing of fraud firms’ good and bad news
management forecasts relative to the matched control firms (i.e., differences in differences).
In Panel A, Period equals one for the fraud period, and zero for the designated non-fraud period. In the
first column, the designated non-fraud period is the pre-fraud period. Coefficients γ9 and γ10 are
significantly positive (p = 0.055) and negative (p = 0.002), respectively, when measuring price reactions
23
to good and bad news in the fraud relative to the pre-fraud period. Therefore, the market treats both good
and bad news management earnings forecasts issued by fraud firms as more credible during fraud periods
relative to the pre-fraud periods. The designated non-fraud periods in the second and third columns are
the post-fraud period and public period, respectively. In both columns, we find that the coefficients on γ9
and γ10 are not statistically different from zero, which suggests that there is not a significant change in
investors’ perceptions of the credibility of management earnings forecasts issued by fraud firms in the
post-fraud and public periods (i.e., we are unable to reject the null hypothesis that post-fraud and public
period management forecasts are not viewed as more or less credible by the equity market).
Table 5, Panel B, recasts the same analysis in a different way. Period equals one for the pre-fraud
period, and zero for the other periods. The significantly negative γ9 in each column means that the price
reaction to good news in fraud, post-fraud, and public periods is more positive than the price reaction to
good news in the pre-fraud period. The significantly positive γ10 in each column means that the price
reaction to bad news in fraud, post-fraud, and public periods is more negative than the price reaction to
bad news in the pre-fraud period.
In summary, the price reaction tests are consistent with the tests on bias and accuracy.
Management earnings forecast quality increases during the fraud period, and that increase persists into the
post-fraud period and even into the period in which the public is aware of the fraud.
6. Additional Analysis
6.1. Management Turnover
Prior research suggests that accounting fraud often leads to significant management turnover
(Karpoff et al. 2008a). Because prior research suggests that managers play a significant role in their
firms’ disclosure policies (Bamber et al. 2010), it is necessary to examine whether our results are robust
to controlling for management turnover. We identify firms that experience a change in CEO or CFO
during or after the fraud period and create an indicator variable (Turnover) equal to one if the firm
24
changed its CEO or CFO and zero otherwise. We find that the coefficient on Turnover is insignificant in
most model specifications and that all our inferences remain the same.
6.2. Additional Characteristics of Management Forecasts
In supplemental tests, we investigate changes in additional attributes of management issued
forecasts during accounting fraud. Specifically, we examine changes in the precision, specificity, and
horizon of forecasts issued during and after periods of fraud. We measure forecast precision using a count
variable set equal to four for point forecasts, three for range forecasts, two for open-ended forecasts, and
one for qualitative guidance. Forecast specificity is defined as the high end minus the low end of range
forecasts, scaled by the stock price as of two days before the forecast. Specificity is set equal to zero for
point forecasts and missing for open-ended and qualitative forecasts. Thus, a larger value of precision
indicates a more precise forecast, while a higher value of specificity indicates a less specific forecast.
Horizon is first measured as the number of days between the date the forecast is issued and the fiscal
period end date. As a second measure of horizon, we use an indicator variable set equal to one for
quarterly forecasts, and zero for annual forecasts.
In untabulated analysis, we observe no significant incremental changes in the precision,
specificity, or our first measure of the horizon of management issued forecasts for fraud firms relative to
matched firms from the fraud period to the pre-fraud, post-fraud, or public periods. However, we do find
that compared to nonfraud firms, fraud firms issue significantly more quarterly forecasts relative to
annual forecasts during the fraud period than they did previously (incremental change of -0.748; p =
0.002). It appears that as managers use earnings guidance to manage market expectations during periods
of fraud, they focus primarily on short-term quarterly expectations.
6.3. Alternative Matching Procedure
In our primary analysis, we match fraud and nonfraud firms on size, industry, and ex ante fraud
risk using a commercially produced risk measure called Accounting and Governance Risk (AGR). We do
this because matching firms on fraud risk is likely to provide us with the most conservative method for
25
isolating the effects of the fraud itself from other firm characteristics common among firms with high
fraud risk when investigating changes in disclosure behavior.
However, economic performance has been shown to be a potentially significant determinant of a
firm’s disclosure behavior (Miller 2002; Roger and Van Buskirk 2009). As economic performance is also
a determinant of accounting fraud, it is likely that the performance of our sample of fraud firms has a non-
random distribution, and thus the observed changes in disclosure behavior could be attributable to
changes in performance rather than the act of committing fraud. To ensure that this is not the case, we
replicate our primary analysis, again matching firms on industry and size, but replacing fraud risk (AGR)
with return on assets (ROA). This setting provides us with fraud and nonfraud firms that have similar
performance levels in the year before the fraud began. Inferences remain the same.
7. Conclusion
Using a sample of firms that were subject to Securities and Exchange Commission (SEC)
Enforcement Actions, we compare changes in the incidence, news content, bias, and accuracy of fraud
firms’ management earnings forecasts to the changes observed in a sample of control firms matched on
industry, size, and fraud risk. We find that relative to the period before the fraud begins, managers of
both fraud and matched nonfraud firms significantly increase the number of earnings forecasts during the
fraud period. However, once the fraud period ends (and before the fraud is known publicly), we find that
while managers of nonfraud firms continue to increase the frequency of their forecasts, managers of fraud
firms decrease the quantity of their earnings forecasts, and the difference between fraud and nonfraud
firms is significant. Similarly, after the fraud becomes publicly known, managers of fraud (nonfraud)
firms further decrease (increase) the frequency of their management forecasts, and again the difference is
significant. Thus, the decision to commit fraud is associated with significant changes in voluntary
disclosure behavior. Lower forecast frequencies post-fraud are consistent with a fear of drawing attention
to the firm before the fraud is revealed. The further forecast frequency reduction in the public period is
consistent with increased monitoring from regulators. A related potential alternative explanation is that
26
new participants in the earnings measurement and disclosure process wish to establish a reputation for
credible forecasting in the presence of this increased monitoring.
When managers choose to issue an earnings forecast, we find that relative to managers of
matched nonfraud firms, managers of fraud firms are more likely to issue a significantly greater
proportion of bad news forecasts during fraud than either before or after the fraud period, and issue less
ex post optimistically biased and more accurate forecasts during the fraud period than they did prior to the
fraud period. In combination, our results suggest that managers of fraud firms increase their use of
earnings forecasts to manage investor expectations downward during periods of fraud. These results are
consistent with managers of fraud firms using multiple tools (i.e., credibly managing expectations
downward while simultaneously fraudulently manipulating earnings) to meet market expectations.
We also find that, relative to the control sample, the market responds more strongly to both the
good news and bad news earnings forecasts of fraud firms, both during and after fraud, relative to the pre-
fraud period market response. These results are likely attributable to our previous finding that firms issue
more accurate forecasts during periods of fraud, thereby establishing a reputation for credible disclosure
that persists after the fraud ends. Thus, public revelation of the fraud does not appear to taint the
credibility of management forecasts. The results are also consistent with other recent evidence that
suggests investors are initially unable to see through mistakes in materially misstated earnings (Bardos et
al. 2010).
As a whole, the results suggest that management forecasts are of a high quality (traditionally
defined) and perceived as credible while managers commit fraud. If managers achieve this observable
accuracy and low optimistic bias by fraud, then managers can choose low earnings quality to cause the
market to perceive that voluntary disclosure quality is high.
Our findings and interpretations suggest that research into the relationship between fraud and
voluntary disclosure quality requires a more precise definition of voluntary disclosure quality to permit
unambiguous interpretation of the association of fraud-induced low earnings quality and voluntary
disclosure quality. At issue is the question of how voluntary disclosure quality should be defined when it

27
is being tested for association with the underlying determinant of its content, earnings. Our findings
suggest that traditionally defined measures of management earnings forecast quality and earnings quality
are not complements during periods of fraud.
28
References
Aboody, D., Kasznik, R., 2000. CEO stock options awards and the timing of corporate voluntary
disclosures. Journal of Accounting and Economics 29, 73-100.
Ajinkya, B., Gift, M., 1984. Corporate managers’ earnings forecasts and symmetrical adjustments of
market expectations. Journal of Accounting Research 22, 425-444.
Ajinkya, B., Bhojraj, S., Sengupta, P., 2005. The association between outside directors, institutional
investors and the properties of management earnings forecasts. Journal of Accounting Research
43, 343-375.
Baginski, S., Hassell, J., 1990. The market interpretation of management earnings forecasts as a predictor
of subsequent financial analyst forecast revisions. The Accounting Review 65, 175-190.
Baik, B., Jiang, G. 2006. The use of management forecasts to dampen analysts’ expectations. Journal of
Accounting and Public Policy 25, 531-553.
Ball, R., Jayaraman, S., Shivakumar, L., 2009. The complementary roles of audited financial reporting
and voluntary disclosure: A test of the confirmation hypothesis. Working paper, University of
Chicago, Washington University, London Business School.
Bamber, L., Cheon, Y., 1998. Discretionary management earnings forecast disclosures: Antecedents and
outcomes associated with forecast venue and forecast specificity choices. Journal of Accounting
Research 36, 167-190.
Bamber, L., Jiang, J., Wang I., 2010. What’s my style? The influence of top managers on voluntary
corporate financial disclosure. The Accounting Review 85, 1131-1162.
Bardos, K., Golec. J., Harding, J. 2011. Do investors see through mistakes in reported earnings? Journal
of Financial and Quantitative Analysis (forthcoming).
Brown, L., Higgins, H. 2005. Managers’ forecast guidance of analysts: International evidence. Journal of
Accounting and Public Policy 24, 280-299.
Burgstahler, D., Eames, M., 2006. Management of earnings and analysts’ forecasts to achieve zero and
small positive earnings surprises. Journal of Business Finance and Accounting 33, 633-652.
Dechow, P., Sloan, R., Sweeney, A., 1996. Causes and consequences of earnings management: An
analysis of firms subject to enforcement actions by the SEC. Contemporary Accounting Research
13, 1-36.
Dechow, P., Ge, W., Larson, C., Sloan, R., 2011. Predicting material accounting manipulations.
Contemporary Accounting Research (forthcoming).
Desai, H., Hogan, C., Wilkins, M., 2006. The reputational penalty for aggressive accounting: Earnings
restatements and management turnover. The Accounting Review 81, 83-112.
29
Efendi, J., Srivastava, A., Swanson, E., 2007. Why do corporate managers misstate financial statements?
The role of in-the-money options and other incentives. Journal of Financial Economics 85 (3),
667-708.
Erickson, M., Hanlon, M., Maydew, E., 2006. Is there a link between executive equity incentives and
accounting fraud? Journal of Accounting Research 44, 1-31.
Ettredge, M., Huang, Y., Zhang, W., 2011. Restatement disclosures and management earnings forecast
behavior. Working paper, University of Kansas.
Francis, F., Nanda, D., Olsson, P., 2008. Voluntary disclosure, earnings quality, and cost of capital.
Journal of Accounting Research 46, 53-99.
Gow, I., Ormazabal, G., Taylor, D., 2010. Correcting for cross-sectional and time-series dependence in
accounting research. The Accounting Review (forthcoming).
Graham, J., Harvey, C., Rajgopal, S., 2005. The economic implications of corporate financial reporting.
Journal of Accounting and Economics 40, 3-73.
Healy, P., Palepu, K., 2003. The fall of Enron. The Journal of Economic Perspectives 17(2), 3-26.
Hirst, D. E., Koonce, L., Venkataraman, S., 2008. Management earnings forecasts: A review and
framework. Accounting Horizons 22 (3), 315-338.
Hui, K., Lennox, C., 2009. How do investors respond to fraudulent earnings news? Working Paper, Hong
Kong University of Science and Technology.
Hui, K., Matsunaga, S., Morse, D., 2009. The impact of conservatism on management earnings forecasts.
Journal of Accounting and Economics 47, 192-207.
Kasznik, R., 1999. On the association between voluntary disclosure and earnings management. Journal of
Accounting Research 37 (1), 57-81.
Karpoff, J. Lee, D., Martin, G., 2008a. The consequences to managers for financial misrepresentation.
Journal of Financial Economics 88, 193-215.
Karpoff, J., Lee, D., Martin, G., 2008b. The cost to firms of cooking the books. Journal of Financial and
Quantitative Analysis 43 (3), 581-612.
Kedia, S., Rajgopal, S., 2011. Do the SEC’s enforcement preferences affect corporate misconduct?
Journal of Accounting and Economics 51, 259-278.
King, R., Pownall, G., Waymire, G., 1990. Expectations adjustments via timely management forecasts:
Review, synthesis, and suggestions for future research. Journal of Accounting Literature 9, 113-
144.
Kothari, S., Shu, S., Wysocki, P., 2009. Do managers withhold bad news? Journal of Accounting
Research 47 (1), 241-276.
30
Lennox, C., Park, C., 2006. The informativeness of earnings and management’s issuance of earnings
forecasts. Journal of Accounting and Economics 42, 439-458.
Matsumoto, D., 2002. Management’s incentives to avoid negative earnings surprises. The Accounting
Review 77, 483-514.
Mercer, M., 2004. How do investors assess the credibility of management disclosures? Accounting
Horizons 18, 185-196.
Miller, G., 2002. Earnings performance and discretionary disclosure. Journal of Accounting Research 40,
173-204.
Palmrose, Z., Scholz, S., 2004. The circumstances and legal consequences of non-GAAP reporting:
Evidence from restatements. Contemporary Accounting Research 21, 139-180.
Peterson, M., 2009. Estimating standard errors in finance panel data sets: Comparing approaches. The
Review of Financial Studies 22, 435-480.
Pownall, G., Waymire, G., 1989. Voluntary disclosure credibility and securities prices: Evidence from
management forecasts, 1969-73. Journal of Accounting Research 27, 227-245.
Price, R., Sharp, N., Wood, D., 2011. Detecting and predicting accounting irregularities: A comparison of
commercial and academic risk measures. Accounting Horizons, forthcoming.
Rogers, J., Stocken, P., 2005. Credibility of management forecasts. The Accounting Review 80, 1233-
1260.
Rogers, J., Van Buskirk, A., 2009. Shareholder litigation and changes in disclosure behavior. Journal of
Accounting and Economics 47, 136-156.
Skinner, D., 1997. Earnings disclosure and stockholder lawsuits. Journal of Accounting and Economics
23, 249-282.
Skousen, C., Wright, C., 2008. Contemporaneous risk factors and the prediction of financial statement
fraud. Journal of Forensic Accounting 9, 37-61.
Soffer, L., Thiagarajan, S., Walther, B., 2000. Earnings preannouncement strategies. Review of
accounting studies 5, 5-26.
Wang, I., 2007. Private earnings guidance and its implications for disclosure regulation. The Accounting
Review 82, 1299-1332.
Williams, P., 1996. The relation between a prior earnings forecast by management and analyst response to
a current management forecast. The Accounting Review 71: 103-115.
31
Figure 1
Fraud Timeline
Periods
Mean Period Length
(months)
Pre-FraudPeriod
12 28 31 12
FraudPeriod
Post-FraudPeriod
Public Period
The pre-fraud period consists of the 12 month period ending the first day of the fraud period. The post-fraud period
begins the day the fraud period ends and continues until the fraud is made public. The public period consists of the
12 month period beginning the day the fraud is made public.
32
Figure 2
Mapping Equation (2) Coefficients into F-Tests
Model: DiscProxy = β0 + β1 Fraud x PreFraudPeriod + β2 Fraud x PostFraudPeriod
+ β3 Fraud x PublicPeriod + β4 Match x PreFraudPeriod
+ β5 Match x FraudPeriod + β6 Match x PostFraudPeriod
+ β7 Match x PublicPeriod + Гi CONTROLS + ε
Changes in Disclosure
(F-tests):
Fraud Period to
Pre-Fraud Period
Fraud Period to
Post-Fraud Period
Fraud Period to
Public Period
Fraud Firms β1 β2 β3
Match Firms β4 - β5 β6 - β5 β7 - β5
Incremental Change for
Fraud Firms β1 - (β4 - β5) β2 - (β6 - β5) β3 - (β7 - β5)
Alternative disclosure proxies (DiscProxy) are: Frequency = average # of forecasts issued per quarter during the
period; BadNewsD = 1 if (forecast - consensus analyst forecast) < 0, 0 otherwise; Bias = (forecast - actual EPS) /
stock price two days before forecast; F_AbsError = absolute value of Bias. Fraud = 1 for fraud firms, 0
otherwise; Match = 1 for matched firms, 0 otherwise; PreFraudPeriod = 1 if forecast is issued during 12 months
before beginning of fraud; FraudPeriod = 1 if forecast is issued during the fraud; PostFraudPeriod = 1 if forecast
is issued after the fraud period but before the fraud becomes public knowledge; PublicPeriod = 1 if forecast is
issued during the 12 months after the fraud becomes public knowledge. Controls are: Size = natural log of the
market value of equity; BTM = book value of common equity divided by market value of common equity; Analyst
Following = 1 + the natural log of the number of analysts following the firm prior to the forecast; Industry fixed
effects.
33
Table 1
Sample Selection Procedure
Fraud Firms
Initial sample of SEC Enforcement Actions with fraud periods 396
beginning after 1997
Less:
Firms with public periods ending after 2008 (68)
Firms who did not issue guidance during event window* (146)
Firms without AGR fraud risk scores (56)
Firms without an industry/size/fraud risk matched firm (7)
Final sample 119
The pre-fraud period consists of the 12 month period ending the first day of the fraud period. The post-fraud
period begins the day the fraud period ends and continues until the fraud is made public. The public period
consists of the 12 month period beginning the day the fraud is made public. A firm's event window spans from
the beginning of the pre-fraud period through the end of the public period.
*This includes firms not followed by at least one analyst in First Call's Analyst Forecast database during their
entire event window (Ajinkya et al. 2005).
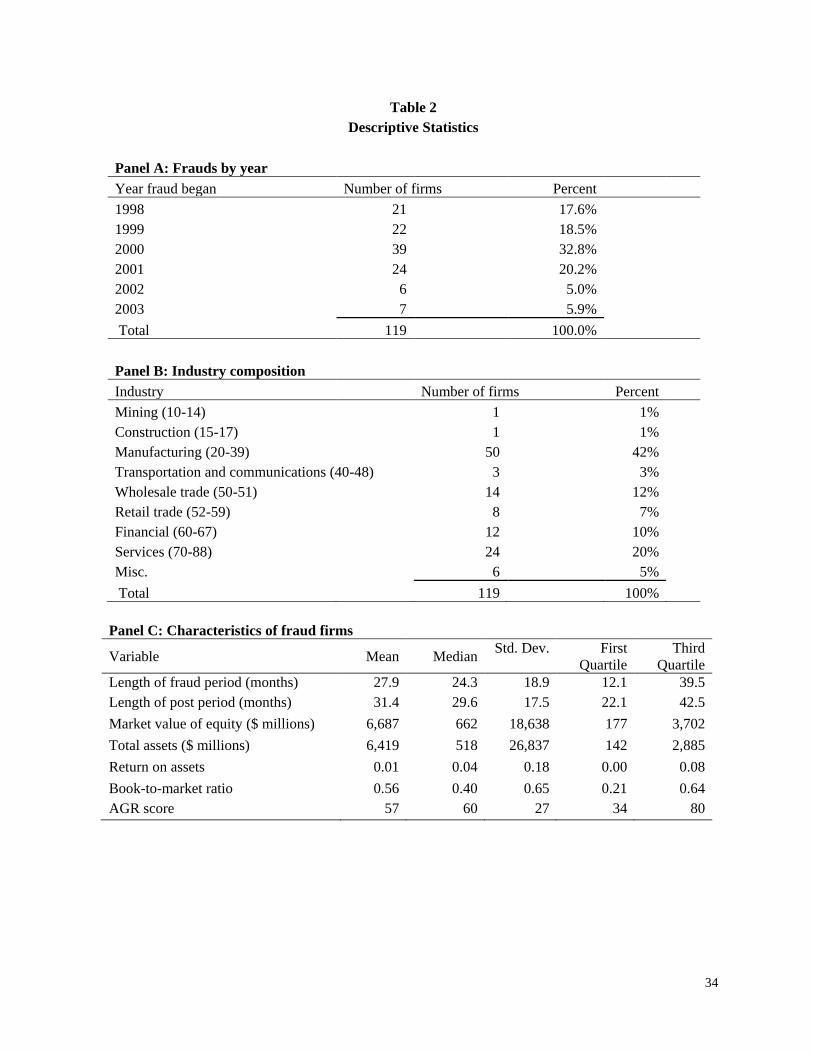
34
Table 2
Descriptive Statistics
Panel A: Frauds by year
Year fraud began Number of firms Percent
1998 21 17.6%
1999 22 18.5%
2000 39 32.8%
2001 24 20.2%
2002 6 5.0%
2003 7 5.9%
Total 119 100.0%
Panel B: Industry composition
Industry Number of firms Percent
Mining (10-14) 1 1%
Construction (15-17) 1 1%
Manufacturing (20-39) 50 42%
Transportation and communications (40-48) 3 3%
Wholesale trade (50-51) 14 12%
Retail trade (52-59) 8 7%
Financial (60-67) 12 10%
Services (70-88) 24 20%
Misc. 6 5%
Total 119 100%
Panel C: Characteristics of fraud firms
Variable Mean Median Std. Dev. First
Quartile
Third
Quartile
Length of fraud period (months) 27.9 24.3 18.9 12.1 39.5
Length of post period (months) 31.4 29.6 17.5 22.1 42.5
Market value of equity ($ millions) 6,687 662 18,638 177 3,702
Total assets ($ millions) 6,419 518 26,837 142 2,885
Return on assets 0.01 0.04 0.18 0.00 0.08
Book-to-market ratio 0.56 0.40 0.65 0.21 0.64
AGR score 57 60 27 34 80

35
Table 2 (continued)
Panel D: Characteristics of match firms
Variable Mean Median Std. Dev. First
Quartile
Third
Quartile
Market value of equity ($ millions) 7,642 576 28,892 151 2,940
Total assets ($ millions) 6,158 481 25,917 138 2,577
Return on assets 0.01 0.04 0.25 0.01 0.08
Book-to-market ratio 0.50 0.40 0.47 0.20 0.75
AGR score 55 57 25 36 75
Panel A presents the distribution of the fraud firms over time, based on the year the fraud began. Panel B displays
the distribution of the fraud firms over 2-digit SIC codes. Variables in Panels C and D are calculated as of the end
of the year prior to the beginning of the fraud period.
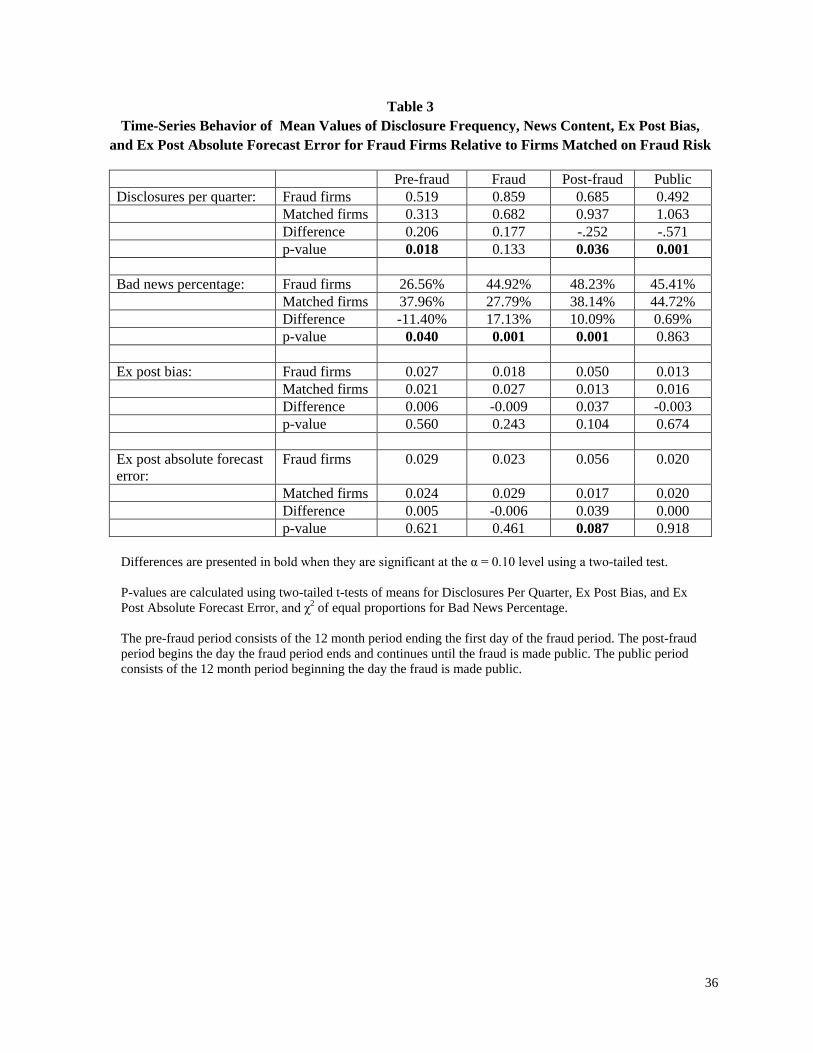
36
Table 3
Time-Series Behavior of Mean Values of Disclosure Frequency, News Content, Ex Post Bias,
and Ex Post Absolute Forecast Error for Fraud Firms Relative to Firms Matched on Fraud Risk
Pre-fraud Fraud Post-fraud Public
Disclosures per quarter: Fraud firms 0.519 0.859 0.685 0.492
Matched firms 0.313 0.682 0.937 1.063
Difference 0.206 0.177 -.252 -.571
p-value 0.018 0.133 0.036 0.001
Bad news percentage: Fraud firms 26.56% 44.92% 48.23% 45.41%
Matched firms 37.96% 27.79% 38.14% 44.72%
Difference -11.40% 17.13% 10.09% 0.69%
p-value 0.040 0.001 0.001 0.863
Ex post bias: Fraud firms 0.027 0.018 0.050 0.013
Matched firms 0.021 0.027 0.013 0.016
Difference 0.006 -0.009 0.037 -0.003
p-value 0.560 0.243 0.104 0.674
Ex post absolute forecast
error:
Fraud firms 0.029 0.023 0.056 0.020
Matched firms 0.024 0.029 0.017 0.020
Difference 0.005 -0.006 0.039 0.000
p-value 0.621 0.461 0.087 0.918
Differences are presented in bold when they are significant at the α = 0.10 level using a two-tailed test.
P-values are calculated using two-tailed t-tests of means for Disclosures Per Quarter, Ex Post Bias, and Ex
Post Absolute Forecast Error, and χ2 of equal proportions for Bad News Percentage.
The pre-fraud period consists of the 12 month period ending the first day of the fraud period. The post-fraud
period begins the day the fraud period ends and continues until the fraud is made public. The public period
consists of the 12 month period beginning the day the fraud is made public.
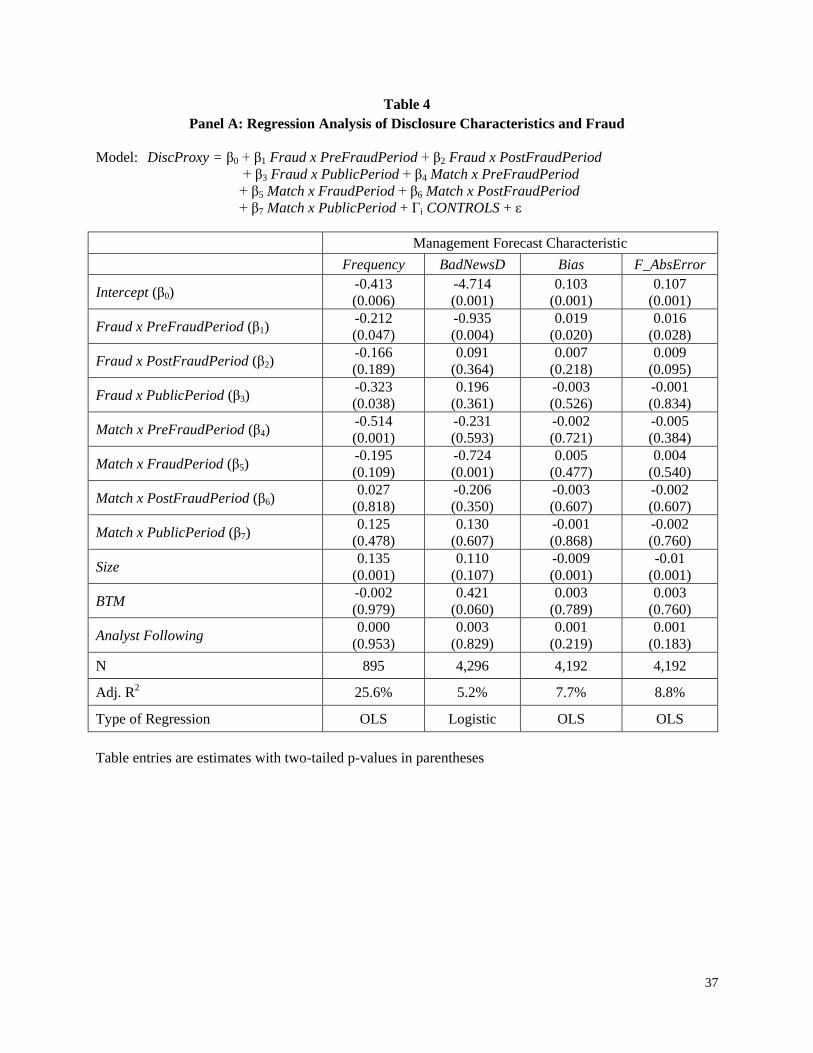
37
Table 4
Panel A: Regression Analysis of Disclosure Characteristics and Fraud
Model: DiscProxy = β0 + β1 Fraud x PreFraudPeriod + β2 Fraud x PostFraudPeriod
+ β3 Fraud x PublicPeriod + β4 Match x PreFraudPeriod
+ β5 Match x FraudPeriod + β6 Match x PostFraudPeriod
+ β7 Match x PublicPeriod + Гi CONTROLS + ε
Management Forecast Characteristic
Frequency BadNewsD Bias F_AbsError
Intercept (β0) -0.413
(0.006)
-4.714
(0.001)
0.103
(0.001)
0.107
(0.001)
Fraud x PreFraudPeriod (β1) -0.212
(0.047)
-0.935
(0.004)
0.019
(0.020)
0.016
(0.028)
Fraud x PostFraudPeriod (β2) -0.166
(0.189)
0.091
(0.364)
0.007
(0.218)
0.009
(0.095)
Fraud x PublicPeriod (β3) -0.323
(0.038)
0.196
(0.361)
-0.003
(0.526)
-0.001
(0.834)
Match x PreFraudPeriod (β4) -0.514
(0.001)
-0.231
(0.593)
-0.002
(0.721)
-0.005
(0.384)
Match x FraudPeriod (β5) -0.195
(0.109)
-0.724
(0.001)
0.005
(0.477)
0.004
(0.540)
Match x PostFraudPeriod (β6) 0.027
(0.818)
-0.206
(0.350)
-0.003
(0.607)
-0.002
(0.607)
Match x PublicPeriod (β7) 0.125
(0.478)
0.130
(0.607)
-0.001
(0.868)
-0.002
(0.760)
Size 0.135
(0.001)
0.110
(0.107)
-0.009
(0.001)
-0.01
(0.001)
BTM -0.002
(0.979)
0.421
(0.060)
0.003
(0.789)
0.003
(0.760)
Analyst Following 0.000
(0.953)
0.003
(0.829)
0.001
(0.219)
0.001
(0.183)
N 895 4,296 4,192 4,192
Adj. R2 25.6% 5.2% 7.7% 8.8%
Type of Regression OLS Logistic OLS OLS
Table entries are estimates with two-tailed p-values in parentheses
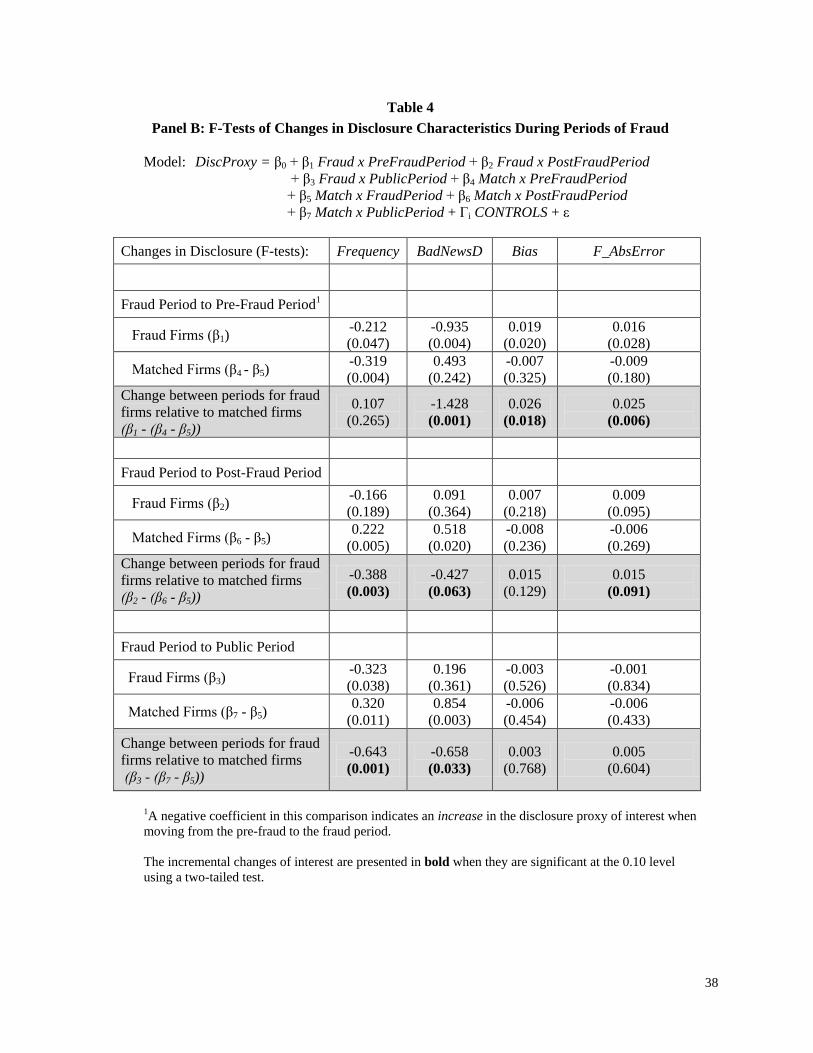
38
Table 4
Panel B: F-Tests of Changes in Disclosure Characteristics During Periods of Fraud
Model: DiscProxy = β0 + β1 Fraud x PreFraudPeriod + β2 Fraud x PostFraudPeriod
+ β3 Fraud x PublicPeriod + β4 Match x PreFraudPeriod
+ β5 Match x FraudPeriod + β6 Match x PostFraudPeriod
+ β7 Match x PublicPeriod + Гi CONTROLS + ε
Changes in Disclosure (F-tests): Frequency BadNewsD Bias F_AbsError
Fraud Period to Pre-Fraud Period1
Fraud Firms (β1) -0.212
(0.047)
-0.935
(0.004)
0.019
(0.020)
0.016
(0.028)
Matched Firms (β4 - β5) -0.319
(0.004)
0.493
(0.242)
-0.007
(0.325)
-0.009
(0.180)
Change between periods for fraud
firms relative to matched firms
(β1 - (β4 - β5))
0.107
(0.265)
-1.428
(0.001)
0.026
(0.018)
0.025
(0.006)
Fraud Period to Post-Fraud Period
Fraud Firms (β2) -0.166
(0.189)
0.091
(0.364)
0.007
(0.218)
0.009
(0.095)
Matched Firms (β6 - β5) 0.222
(0.005)
0.518
(0.020)
-0.008
(0.236)
-0.006
(0.269)
Change between periods for fraud
firms relative to matched firms
(β2 - (β6 - β5))
-0.388
(0.003)
-0.427
(0.063)
0.015
(0.129)
0.015
(0.091)
Fraud Period to Public Period
Fraud Firms (β3) -0.323
(0.038)
0.196
(0.361)
-0.003
(0.526)
-0.001
(0.834)
Matched Firms (β7 - β5) 0.320
(0.011)
0.854
(0.003)
-0.006
(0.454)
-0.006
(0.433)
Change between periods for fraud
firms relative to matched firms
(β3 - (β7 - β5))
-0.643
(0.001)
-0.658
(0.033)
0.003
(0.768)
0.005
(0.604)
1A negative coefficient in this comparison indicates an increase in the disclosure proxy of interest when
moving from the pre-fraud to the fraud period.
The incremental changes of interest are presented in bold when they are significant at the 0.10 level
using a two-tailed test.
39
Table 4 (continued)
All continuous variables are winsorized at the first and 99th percentiles to alleviate the effects of outliers on
the analysis. T-statistics are calculated using White's (1980) heteroscedasticity robust standard errors clustered
by firm and year to control for dependency in the error terms.
Variable Definitions: Frequency = average # of forecasts issued per quarter during the period; BadNewsD = 1
if (forecast - consensus analyst forecast) < 0, 0 otherwise; Bias = (forecast - actual EPS) / stock price two days
before forecast; F_AbsError = absolute value of Bias; Fraud = 1 for fraud firms, 0 otherwise; Match = 1 for
matched firms, 0 otherwise; Pre-Fraud Period = 1 if forecast is issued during 12 months before beginning of
fraud; FraudPeriod = 1 if forecast is issued during the fraud; PostFraudPeriod = 1 if forecast is issued after
the fraud period but before the fraud becomes public knowledge; PublicPeriod = 1 if forecast is issued during
the 12 months after the fraud becomes public knowledge; Size = natural log of the market value of equity;
BTM = book value of common equity divided by market value of common equity; Analyst Following = 1 + the
natural log of the number of analysts following the firm prior to the forecast; Industry fixed effects not
reported.
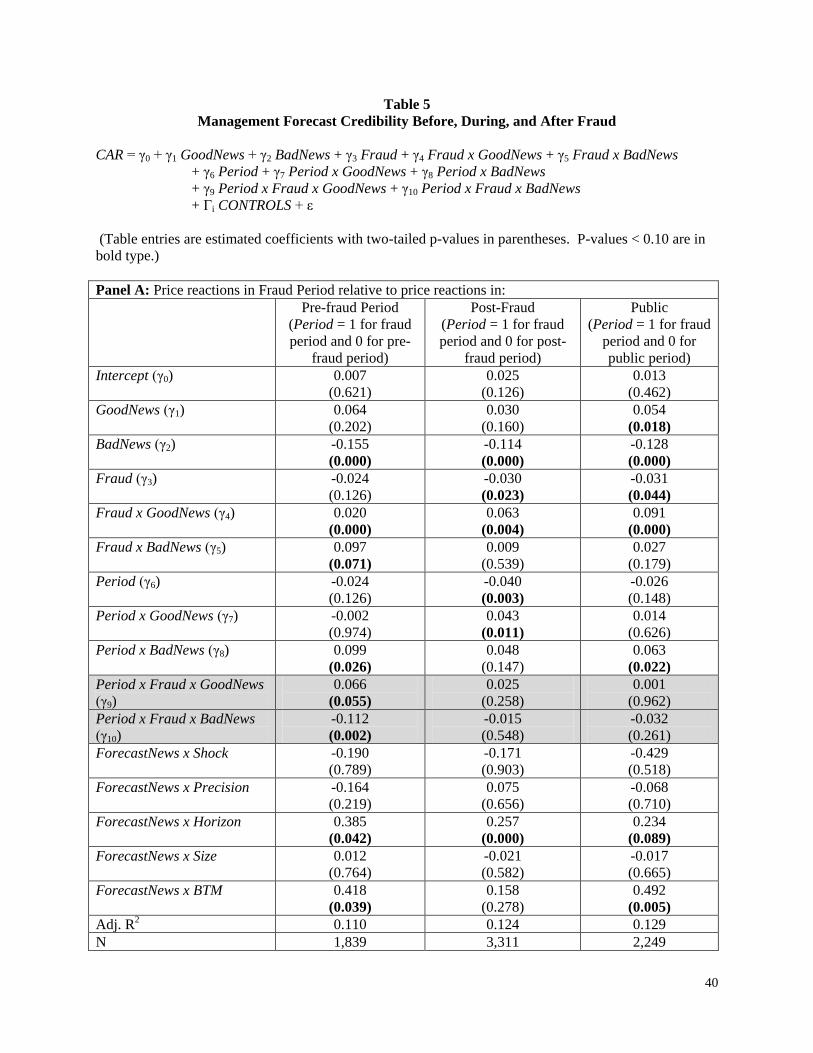
40
Table 5
Management Forecast Credibility Before, During, and After Fraud
CAR = γ0 + γ1 GoodNews + γ2 BadNews + γ3 Fraud + γ4 Fraud x GoodNews + γ5 Fraud x BadNews
+ γ6 Period + γ7 Period x GoodNews + γ8 Period x BadNews
+ γ9 Period x Fraud x GoodNews + γ10 Period x Fraud x BadNews
+ Гi CONTROLS + ε
(Table entries are estimated coefficients with two-tailed p-values in parentheses. P-values < 0.10 are in
bold type.)
Panel A: Price reactions in Fraud Period relative to price reactions in:
Pre-fraud Period
(Period = 1 for fraud
period and 0 for pre-
fraud period)
Post-Fraud
(Period = 1 for fraud
period and 0 for post-
fraud period)
Public
(Period = 1 for fraud
period and 0 for
public period)
Intercept (γ0) 0.007
(0.621)
0.025
(0.126)
0.013
(0.462)
GoodNews (γ1) 0.064
(0.202)
0.030
(0.160)
0.054
(0.018)
BadNews (γ2) -0.155
(0.000)
-0.114
(0.000)
-0.128
(0.000)
Fraud (γ3) -0.024
(0.126)
-0.030
(0.023)
-0.031
(0.044)
Fraud x GoodNews (γ4) 0.020
(0.000)
0.063
(0.004)
0.091
(0.000)
Fraud x BadNews (γ5) 0.097
(0.071)
0.009
(0.539)
0.027
(0.179)
Period (γ6) -0.024
(0.126)
-0.040
(0.003)
-0.026
(0.148)
Period x GoodNews (γ7) -0.002
(0.974)
0.043
(0.011)
0.014
(0.626)
Period x BadNews (γ8) 0.099
(0.026)
0.048
(0.147)
0.063
(0.022)
Period x Fraud x GoodNews
(γ9)
0.066
(0.055)
0.025
(0.258)
0.001
(0.962)
Period x Fraud x BadNews
(γ10)
-0.112
(0.002)
-0.015
(0.548)
-0.032
(0.261)
ForecastNews x Shock -0.190
(0.789)
-0.171
(0.903)
-0.429
(0.518)
ForecastNews x Precision -0.164
(0.219)
0.075
(0.656)
-0.068
(0.710)
ForecastNews x Horizon 0.385
(0.042)
0.257
(0.000)
0.234
(0.089)
ForecastNews x Size 0.012
(0.764)
-0.021
(0.582)
-0.017
(0.665)
ForecastNews x BTM 0.418
(0.039)
0.158
(0.278)
0.492
(0.005)
Adj. R2
0.110 0.124 0.129
N 1,839 3,311 2,249
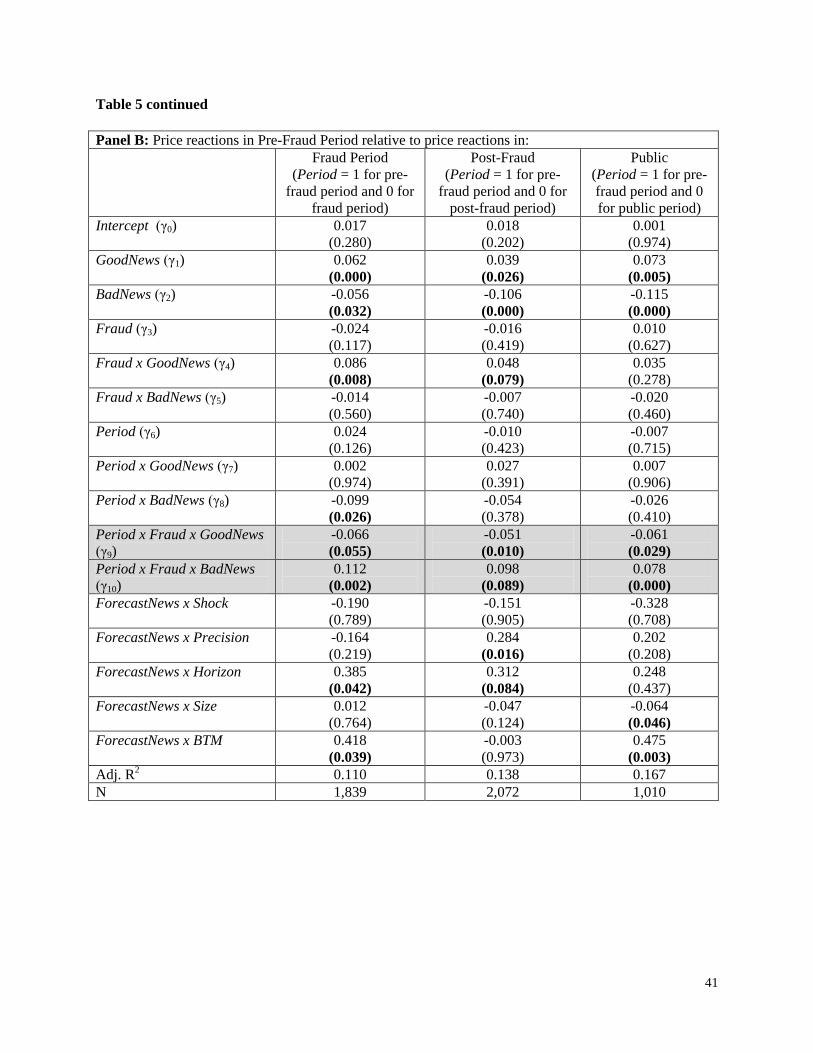
41
Table 5 continued
Panel B: Price reactions in Pre-Fraud Period relative to price reactions in:
Fraud Period
(Period = 1 for pre-
fraud period and 0 for
fraud period)
Post-Fraud
(Period = 1 for pre-
fraud period and 0 for
post-fraud period)
Public
(Period = 1 for pre-
fraud period and 0
for public period)
Intercept (γ0) 0.017
(0.280)
0.018
(0.202)
0.001
(0.974)
GoodNews (γ1) 0.062
(0.000)
0.039
(0.026)
0.073
(0.005)
BadNews (γ2) -0.056
(0.032)
-0.106
(0.000)
-0.115
(0.000)
Fraud (γ3) -0.024
(0.117)
-0.016
(0.419)
0.010
(0.627)
Fraud x GoodNews (γ4) 0.086
(0.008)
0.048
(0.079)
0.035
(0.278)
Fraud x BadNews (γ5) -0.014
(0.560)
-0.007
(0.740)
-0.020
(0.460)
Period (γ6) 0.024
(0.126)
-0.010
(0.423)
-0.007
(0.715)
Period x GoodNews (γ7) 0.002
(0.974)
0.027
(0.391)
0.007
(0.906)
Period x BadNews (γ8) -0.099
(0.026)
-0.054
(0.378)
-0.026
(0.410)
Period x Fraud x GoodNews
(γ9)
-0.066
(0.055)
-0.051
(0.010)
-0.061
(0.029)
Period x Fraud x BadNews
(γ10)
0.112
(0.002)
0.098
(0.089)
0.078
(0.000)
ForecastNews x Shock -0.190
(0.789)
-0.151
(0.905)
-0.328
(0.708)
ForecastNews x Precision -0.164
(0.219)
0.284
(0.016)
0.202
(0.208)
ForecastNews x Horizon 0.385
(0.042)
0.312
(0.084)
0.248
(0.437)
ForecastNews x Size 0.012
(0.764)
-0.047
(0.124)
-0.064
(0.046)
ForecastNews x BTM 0.418
(0.039)
-0.003
(0.973)
0.475
(0.003)
Adj. R2 0.110 0.138 0.167
N 1,839 2,072 1,010
42
Table 5 continued
All continuous variables are winsorized at the first and 99th percentiles to alleviate the effects of outliers on the
analysis. T-statistics are calculated using White's (1980) heteroscedasticity robust standard errors clustered by firm
and year to control for dependency in the error terms. The pre-fraud period consists of the 12 month period ending
the first day of the fraud period. The post-fraud period begins the day the fraud period ends and continues until the
fraud is made public. The public period consists of the 12 month period beginning the day the fraud is made public.
CAR = cumulative, size-adjusted security return on days -1, 0, and +1; ForecastNews = (forecast - consensus analyst
forecast) / stock price two days before forecast; GoodNews = ForecastNews when ForecastNews > 0, and zero
otherwise, ranked by year and scaled to range between 0 and 1; BadNews = Absolute value of ForecastNews when
Forecast News < 0, and zero otherwise, ranked by year and scaled to range between 0 and 1; Fraud = 1 for fraud
firms and zero for match firms; Shock = the absolute value of ForecastNews; Precision = 2 if forecast is a point
estimate, 1 if a range estimate, and 0 if open-ended; Horizon = 1 for quarterly forecasts and 0 for annual forecasts;
Size = natural log of the market value of equity; BTM = book value of common equity divided by market value of
common equity.