
To Our Shareholders
192
Transcript of To Our Shareholders


To Our Shareholders: Fiscal 2011 was a year in which we continued to generate strong financial results, achieved record library revenue and filmed entertainment backlog, maintained our growth momentum in our core businesses and made rapid and accelerating progress in the critical transition from traditional to new digital businesses, both domestically and internationally. We reported revenue of $1.58 billion, EBITDA of $68.3 million and adjusted EBITDA of $106.5 million, as we returned to positive free cash flow for the fiscal year. Our filmed entertainment library achieved its sixth consecutive record year, generating revenue of $374 million (including syndicated TV product). Our filmed entertainment backlog, the amount of future revenue not yet recorded from contracts for the licensing of films and television product to television exhibition and in international markets, reached a record $532.0 million at March 31, 2011, and it continued to grow in the first quarter of fiscal 2012. Translating Demand for Content into Long-term Growth Demand for content continues to grow worldwide as viewing of television content reached record levels and consumption of content on mobile and other digital platforms skyrocketed. Content creators and distributors are connecting with consumers across new platforms, in new windows and through new alliances across the entertainment spectrum. During the year, we continued to capitalize on emerging opportunities in a dynamic and fast-changing marketplace with progress in three key areas --
• Building new film and television franchises and extending our existing brands, • Growing our high-margin digital operations and establishing ourselves as a leader
in monetizing our content in the digital space, and • Simplifying our business and monetizing our noncore assets.
Building Our Film and TV Brands and Franchises Our fiscal 2011 film slate generated more than a half billion dollars at the North American box office, fueled by such hits as THE EXPENDABLES, THE LINCOLN LAWYER, THE LAST EXORCISM and SAW 3D. We continued to build our brands as we assembled upcoming theatrical slates that will be driven by branded and targeted properties that have strong franchise potential, led by THE HUNGER GAMES, slated for release on March 23, 2012, WHAT TO EXPECT WHEN YOU'RE EXPECTING, featuring an all-star cast of Cameron Diaz, Jennifer Lopez, Chris Rock, Elizabeth Banks and Dennis Quaid, THE EXPENDABLES 2 and TEXAS CHAINSAW in 3D. At the same time, we're cultivating new brands that have franchise potential such as ABDUCTION, starring Taylor Lautner, Sam Raimi's THE POSSESSION, CABIN IN THE WOODS from Joss Whedon, DREDD, with Carl Urban reprising Sylvester Stallone's iconic character, THE BIG WEDDING, starring Robert DeNiro, Diane Keaton, Susan Sarandon, Katherine Heigl and Robin Williams, and THE LAST STAND, starring Arnold Schwarzenegger. We also continued to grow our strong existing brands during the year. Tyler Perry's next film, GOOD DEEDS, opens in his traditional slot on February 24, 2012, and his third TV series, “ For Better Or Worse”, debuts on TBS in November, positioned to follow in the footsteps of his hit sitcoms “House of Payne” and “Meet The Browns”, which together have generated 352 episodes. DIRTY DANCING is one of our most enduring brands and best-selling library titles, and we're

bringing it back to the big screen under the direction of its original choreographer, Kenny Ortega. We will also leverage the brand into exciting new platforms by launching a DIRTY DANCING social game this fall. We've been equally focused on building our television franchises. “Mad Men” was recently renewed for three seasons on AMC, and we have licensed all seven seasons into syndication on Netflix. “Weeds” recently debuted to strong ratings in its seventh season on Showtime and “Nurse Jackie”, entering its fourth season on Showtime, and “Blue Mountain State”, entering its third season on Spike TV, represent the next wave of shows in our pipeline of syndicatable programming. “Mad Men” and “Weeds” each continue to generate more than $10 million annually in home entertainment sales, and a “Weeds” social game will launch this fall utilizing the Facebook platform. Our prime time series, talk shows like “Wendy Williams” and syndicated series like Tyler Perry's shows and “Are We There Yet?” will have an increasingly significant impact on our bottom line as they mature and enter their syndication windows and as new digital buyers extend and expand their long-term value. Growing Our Digital Businesses, Attracting New Buyers and Reaching New Audiences Our stockpile of premium branded content continues to drive the growth of our digital operations as we capitalize on new digital buyers for our existing content, both domestically and internationally, create new content specifically for digital platforms and explore new windows for customizing our product offerings for our audiences. Our digital and on demand businesses contributed $140 million in revenue during fiscal 2011, a 69% increase from the prior year, and we have recently forged new alliances with Netflix, Hulu and others in the digital space that will generate tens of millions of dollars in incremental EBITDA each year for years to come. As we predicted several years ago, digital pennies have become millions of digital dollars. Our EPIX multiplatform channel, operated with partners Viacom and MGM, is available in 32 million homes, has nine million subscribers and has become profitable and cash flow positive in its second year of operation, and it has emerged as a leader in streaming content and offering other technological innovations to today's generation of "anytime, anywhere" consumers. Our FEARnet branded horror/thriller channel with partners Sony and Comcast is leveraging its Internet and VOD leadership into the linear channel space. It has 26 million Internet and VOD users and we're projecting 10 million linear subscribers by yearend. Simplifying Our Business We have also made progress in simplifying our business by finding ways to monetize noncore assets that don't meet our long-term EBITDA and free cash flow targets or our strategic growth trajectory. As evidenced by our recent sale of Maple Pictures, we continue to explore options for monetizing our noncore assets. Growing Our Business While Continuing To Cut Costs and Reduce Overhead Even as we maintain our long-term growth trajectory, we continue to reduce the cost of doing business and streamline the infrastructure required to support our operations. Our prints and advertising costs for our fiscal 2012 theatrical slate are projected to decrease approximately $60

million compared to those for last year’s slate and, even with all of our potential franchises, our film slate still averages approximately $15 million of production capital at risk per title before marketing spend. Our G&A expenses in fiscal 2011 were $116.1 million, excluding stock-based compensation and corporate defense costs related to shareholder activism. G&A as a percentage of revenue, excluding stock-based compensation and corporate defense costs, declined to 7.3% in fiscal 2011 compared to 7.5% in the prior year, one of the lowest G&A-to-revenue percentages in our industry. We plan to reduce G&A expenses again this year. With steady library growth, an increasing filmed entertainment backlog, new buyers for our content worldwide and a growing proportion of branded franchises on our film and television slates, we believe that our business is becoming more focused, consistent and predictable. We also believe that growing demand for content across multiple platforms worldwide adds significant new upside potential to all of our core businesses, and we will continue to identify ways to translate this demand into long-term profitable growth for our Company and exceptional value for all of our shareholders. Sincerely,
Jon Feltheimer Michael Burns Co-Chairman and Chief Executive Officer Vice Chairman


UNITED STATESSECURITIES AND EXCHANGE COMMISSION
Washington, DC 20549
Form 10-K(Mark One)
Í ANNUAL REPORT PURSUANT TO SECTION 13 OR 15(d) OF THE SECURITIES EXCHANGEACT OF 1934For the fiscal year ended March 31, 2011
OR
‘ TRANSITION REPORT PURSUANT TO SECTION 13 OR 15(d) OF THE SECURITIESEXCHANGE ACT OF 1934
For the transition period from toCommission File No. 1-14880
LIONS GATE ENTERTAINMENT CORP.(Exact Name of Registrant as Specified in Its Charter)
British Columbia, Canada N/A(State or Other Jurisdiction of (I.R.S. EmployerIncorporation or Organization) Identification No.)
1055 West Hastings Street, Suite 2200 2700 Colorado Avenue, Suite 200Vancouver, British Columbia V6E 2E9 Santa Monica, California 90404
(877) 848-3866 (310) 449-9200(Address of Principal Executive Offices, Zip Code)Registrant’s telephone number, including area code:
(877) 848-3866Securities registered pursuant to Section 12(b) of the Act:
Title of Each Class Name of Each Exchange on Which Registered
Common Shares, without par value New York Stock ExchangeSecurities registered pursuant to Section 12(g) of the Act:
None
Indicate by check mark if the registrant is a well-known seasoned issuer, as defined in Rule 405 of the Securities Act. Yes ‘ No Í
Indicate by check mark if the registrant is not required to file reports pursuant to Section 13 or Section 15(d) of the Securities ExchangeAct of 1934. Yes ‘ No Í
Indicate by check mark whether the registrant (1) has filed all reports required to be filed by Section 13 or Section 15(d) of the SecuritiesExchange Act of 1934 during the preceding 12 months (or for such shorter period that the registrant was required to file such reports), and(2) has been subject to such filing requirements for the past 90 days. Yes Í No ‘
Indicate by check mark whether the registrant has submitted electronically and posted on its corporate Website, if any, every InteractiveData File required to be submitted and posted pursuant to Rule 405 of Regulation S-T during the preceding 12 months (or for such shorterperiod that the registrant was required to submit and post such files). Yes Í No ‘
Indicate by check mark if disclosure of delinquent filers pursuant to Item 405 of Regulation S-K is not contained herein, and will not becontained, to the best of registrant’s knowledge, in definitive proxy or information statements incorporated by reference in Part III of thisForm 10-K or any amendment to this Form 10-K.‘
Indicate by check mark whether the registrant is a large accelerated filer, an accelerated filer, a non-accelerated filer, or a smallerreporting company. See the definitions of “large accelerated filer,” “accelerated filer” and “smaller reporting company” in Rule 12b-2 of theExchange Act. (Check one):Large accelerated filerÍ Accelerated filer‘ Non accelerated filer‘ Smaller reporting company‘
(Do not check if a smaller reporting company)
Indicate by check mark whether the registrant is a shell company (as defined in Rule 12b-2 of the Act). Yes ‘ No Í
The aggregate market value of the voting stock held by non-affiliates of the registrant as of September 30, 2010 (the last business day ofthe registrant’s most recently completed second fiscal quarter) was approximately $681,521,451, based on the closing sale price as reportedon the New York Stock Exchange.
As of May 20, 2011, 137,003,312 shares of the registrant’s no par value common shares were outstanding.
DOCUMENTS INCORPORATED BY REFERENCE
Portions of the registrant’s definitive proxy statement to be filed with the Securities and Exchange Commission pursuant toRegulation 14A and relating to the registrant’s 2011 annual meeting of shareholders are incorporated by reference into Part III.

Page
PART IItem 1. Business . . . . . . . . . . . . . . . . . . . . . . . . . . . . . . . . . . . . . . . . . . . . . . . . . . . . . . . . . . . . . . . . . . . . . . . . 4Item 1A. Risk Factors . . . . . . . . . . . . . . . . . . . . . . . . . . . . . . . . . . . . . . . . . . . . . . . . . . . . . . . . . . . . . . . . . . . . 27Item 1B. Unresolved Staff Comments . . . . . . . . . . . . . . . . . . . . . . . . . . . . . . . . . . . . . . . . . . . . . . . . . . . . . . . 43Item 2. Properties . . . . . . . . . . . . . . . . . . . . . . . . . . . . . . . . . . . . . . . . . . . . . . . . . . . . . . . . . . . . . . . . . . . . . . . 43Item 3. Legal Proceedings . . . . . . . . . . . . . . . . . . . . . . . . . . . . . . . . . . . . . . . . . . . . . . . . . . . . . . . . . . . . . . . . 43Item 4. Removed and Reserved . . . . . . . . . . . . . . . . . . . . . . . . . . . . . . . . . . . . . . . . . . . . . . . . . . . . . . . . . . . . 45
PART IIItem 5. Market for Registrant’s Common Equity, Related Stockholder Matters and Issuer Purchases ofEquity Securities . . . . . . . . . . . . . . . . . . . . . . . . . . . . . . . . . . . . . . . . . . . . . . . . . . . . . . . . . . . . . . . . . . . . . . 46
Item 6. Selected Financial Data . . . . . . . . . . . . . . . . . . . . . . . . . . . . . . . . . . . . . . . . . . . . . . . . . . . . . . . . . . . . 51Item 7. Management’s Discussion and Analysis of Financial Condition and Results of Operations . . . . . . . 53Item 7A. Quantitative and Qualitative Disclosures About Market Risk . . . . . . . . . . . . . . . . . . . . . . . . . . . . . 98Item 8. Financial Statements and Supplementary Data . . . . . . . . . . . . . . . . . . . . . . . . . . . . . . . . . . . . . . . . . . 100Item 9. Changes In and Disagreements with Accountants on Accounting and Financial Disclosure . . . . . . . 100Item 9A. Controls and Procedures . . . . . . . . . . . . . . . . . . . . . . . . . . . . . . . . . . . . . . . . . . . . . . . . . . . . . . . . . . 100Item 9B. Other Information . . . . . . . . . . . . . . . . . . . . . . . . . . . . . . . . . . . . . . . . . . . . . . . . . . . . . . . . . . . . . . . 103
PART IIIItem 10. Directors, Executive Officers and Corporate Governance . . . . . . . . . . . . . . . . . . . . . . . . . . . . . . . . . 103Item 11. Executive Compensation . . . . . . . . . . . . . . . . . . . . . . . . . . . . . . . . . . . . . . . . . . . . . . . . . . . . . . . . . . 103Item 12. Security Ownership of Certain Beneficial Owners and Management and Related StockholderMatters . . . . . . . . . . . . . . . . . . . . . . . . . . . . . . . . . . . . . . . . . . . . . . . . . . . . . . . . . . . . . . . . . . . . . . . . . . . . . 103
Item 13. Certain Relationships and Related Transactions, and Director Independence . . . . . . . . . . . . . . . . . 103Item 14. Principal Accounting Fees and Services . . . . . . . . . . . . . . . . . . . . . . . . . . . . . . . . . . . . . . . . . . . . . . 103
PART IVItem 15. Exhibits, Financial Statement Schedules . . . . . . . . . . . . . . . . . . . . . . . . . . . . . . . . . . . . . . . . . . . . . . 103
FORWARD-LOOKING STATEMENTS
This report includes statements that are, or may deemed to be, “forward looking statements” within the meaningof Section 27A of the Securities Act, as amended (the “Securities Act”), and Section 21E of the Exchange Act, asamended (the “Exchange Act”). These forward-looking statements can be identified by the use of forward-looking terminology, including the terms “believes,” “estimates,” “potential,” “anticipates,” “expects,” “intends,”“plans,” “projects,” “forecasts,” “may,” “will,” “could,” “would” or “should” or, in each case, their negative orother variations or comparable terminology. These forward-looking statements include all matters that are nothistorical facts. They appear in a number of places throughout this report and include statements regarding ourintentions, beliefs or current expectations concerning, among other things, our results of operations, financialcondition, liquidity, prospects, growth, strategies and the industry in which we operate.
By their nature, forward-looking statements involve risks and uncertainties because they relate to events anddepend on circumstances that may or may not occur in the future. We believe that these risks and uncertaintiesinclude, but are not limited to, those discussed under Part I, Item 1A. “Risk factors”. These factors should not beconstrued as exhaustive and should be read with the other cautionary statements and information in the report.
2

We caution you that forward-looking statements made in this report or anywhere else are not guarantees of futureperformance and that our actual results of operations, financial condition and liquidity, and the development ofthe industry in which we operate may differ materially and adversely from those made in or suggested by theforward looking statements contained in this report as a result of various important factors, including, but notlimited to, the substantial investment of capital required to produce and market films and television series,increased costs for producing and marketing feature films and television series, budget overruns, limitationsimposed by our credit facilities and notes, unpredictability of the commercial success of our motion pictures andtelevision programming, risks related to our acquisition strategy and integration of acquired businesses, theeffects of dispositions of businesses or assets, including individual films or libraries, the cost of defending ourintellectual property, difficulties in integrating acquired businesses, technological changes and other trendsaffecting the entertainment industry, and the other risks and uncertainties discussed under Part I, Item 1.A. “RiskFactors”. In addition, even if our results of operations, financial condition and liquidity, and the development ofthe industry in which we operate are consistent with the forward looking statements contained in this report,those results or developments may not be indicative of results or developments in subsequent periods.
Any forward-looking statements, which we make in this report, speak only as of the date of such statement, andwe undertake no obligation to update such statements. Comparisons of results for current and any prior periodsare not intended to express any future trends or indications of future performance, unless expressed as such, andshould only be viewed as historical data.
Unless otherwise indicated, all references to the “Company,” “Lionsgate,” “we,” “us,” and “our” includereference to our subsidiaries as well.
3

PART I
ITEM 1. BUSINESS.
Overview
Lions Gate Entertainment Corp. (“Lionsgate,” the “Company,” “we,” “us” or “our”) is a leading globalentertainment company with a strong and diversified presence in motion picture production and distribution,television programming and syndication, home entertainment, family entertainment, digital distribution and newchannel platforms.
We released approximately 14 motion pictures theatrically per year for the last three fiscal years, which includedfilms that we developed and produced in-house, films that we developed and produced with our partners andfilms that we acquired from third parties. In fiscal 2012 (i.e., the twelve-month period ending March 31, 2012),we currently intend to release approximately 11 to 13 motion pictures theatrically.
We have also delivered, on average, approximately 76 hours of original television programming for the last threefiscal years, which include primarily prime time television series for the cable and broadcast networks. In fiscal2012, we currently intend to deliver approximately 56 hours of television programming.
We distribute our library of approximately 13,000 motion picture titles and television episodes and programsdirectly to retailers, rental kiosks, and pay and free television channels in the United States (the “U.S.”), Canada,the United Kingdom (the “U.K.”) and Ireland, through various digital media platforms, and indirectly to otherinternational markets through our subsidiaries and various third parties. We also distribute our library through thefollowing joint ventures:
• TV Guide Network, TV Guide Network On Demand and TV Guide Online (www.tvguide.com)(collectively, “TV Guide Network”), our joint ventures with One Equity Partners (“OEP”), the globalprivate equity investment arm of JPMorgan Chase & Co.;
• Studio 3 Partners LLC (“EPIX”), our joint venture with Viacom Inc. (“Viacom”), Paramount PicturesCorporation (“Paramount Pictures”) and Metro-Goldwyn-Mayer Studios Inc. (“MGM”);
• Tiger Gate Entertainment Limited (“Tiger Gate”), our joint venture with Saban Capital Group, Inc.(“SCG”); and
• Horror Entertainment, LLC (“FEARnet”), our joint venture with Sony Pictures Television (“Sony”)and Comcast Corporation (“Comcast”).
In order to maximize our profit, we attempt to maintain a disciplined approach to acquisition, production anddistribution of projects, including films and television programs, by balancing our financial risks against theprobability of commercial success for each project. We also attempt to maintain the same disciplined approach toinvestments in, or acquisitions of, libraries or other assets complementary to our business, entertainment studiosand companies that we believe will enhance our competitive position in the industry, generate significant long-term returns, represent an optimal use of our capital and build a diversified foundation for future growth.Historically, we have made numerous acquisitions that are significant to our business and we may continue tomake such acquisitions in the future. For example, we have acquired, integrated and/or consolidated into ourbusiness the following:
• Mandate Pictures LLC (“Mandate Pictures”), a worldwide independent film producer, financier anddistributor (acquired in September 2007);
• Maple Pictures Corp. (“Maple Pictures”), a Canadian film, television and home video distributor(consolidated effective July 2007);
• Debmar-Mercury, LLC (“Debmar-Mercury”), a leading media company specializing in syndication,network, cable and ancillary markets (acquired in July 2006);
4

• Redbus Film Distribution Ltd. and Redbus Pictures (collectively, “Redbus” and currently, Lions GateUK Limited (“Lionsgate UK”), an independent film distributor, which provides us the ability to self-distribute our motion pictures in the U.K. and Ireland and included the acquisition of the Redbuslibrary of approximately 130 films (acquired in October 2005);
• Certain of the film assets and accounts receivable of Modern Entertainment, Ltd., a licensor of filmrights to DVD distributors, broadcasters and cable networks (acquired in August 2005);
• Artisan Entertainment, Inc. (“Artisan Entertainment”), a diversified motion picture, family and homeentertainment company (acquired in December 2003); and
• Trimark Holdings, Inc., a worldwide distributor of entertainment content (acquired in October 2000).
As part of this strategy, we also have ownership interests in the following:
• Pantelion Films (a 49% interest), a joint venture designed to produce and distribute a slate of Englishand Spanish language feature films to target Hispanic moviegoers in the U.S. (entered into inJuly 2010);
• Tiger Gate (a 45.5% interest), an operator of pay television channels and a distributor of televisionprogramming and action and horror films across Asia (entered into in April 2010);
• TV Guide Network (acquired in February 2009 and a 49% interest sold to OEP in May 2009);
• EPIX (a 31.2% interest), a joint venture entered into to create a premium television channel andsubscription video-on-demand (“VOD”) service (entered into in April 2008);
• Elevation Sales Limited (“Elevation”) (a 50% interest), a U.K. based home entertainment distributor(interest acquired in July 2007);
• Roadside Attractions, LLC (“Roadside”) (a 43.0% interest), an independent theatrical distributioncompany (interest acquired in July 2007);
• NextPoint, Inc. (“Break Media”) (a 42.0% interest), an online video entertainment service provider(interest acquired in June 2007); and
• FEARnet (a 34.5% interest), a multiplatform programming and content service provider (interestacquired in October 2006).
Our investments and acquisitions support our strategy of diversifying our company in an attempt to create amultiplatform global industry leader in entertainment. As a corollary to the disciplined approach that we apply toour investments and acquisitions, we are also constantly evaluating our existing properties, libraries and otherassets and businesses in order to determine whether they continue to enhance our competitive position in theindustry, have the potential to generate significant long-term returns, represent an optimal use of our capital andare aligned with our goal to create a multiplatform global industry leader in entertainment. Consequently, onoccasion, we discuss potential strategic transactions with third parties for purchase of our properties, libraries orother assets or businesses that we factor into these evaluations. As a result of our evaluations, we may, from timeto time, determine to sell individual properties, libraries or other assets or businesses. From time to time, we mayalso enter into additional joint ventures, strategic transactions and similar arrangements for individual properties,libraries or other assets or businesses.
As of May 20, 2011, three of our shareholders, Carl C. Icahn, Mark H. Rachesky, M.D. and Capital ResearchGlobal Investors and their respective affiliates, beneficially owned approximately 32.7%, 29.4% and 9.2%,respectively, of our outstanding common shares. From time to time, we may consider significant transactionsproposed to us by these shareholders and their affiliates and we may undertake such transactions if we believethem to be in our best interests and in the best interests of our shareholders.
5

Our Industry
Motion Pictures
General. According to the Motion Picture Association of America’s U.S. Theatrical Market Statistics 2010,domestic box office (which includes the U.S. and Canada) repeated its peak 2009 performance, reaching$10.6 billion in 2010, up 15% over the past five years. As in 2009, the 3-D market was again a key growth driver— 21% of 2010 box office, or $2.2 billion, came from 3-D showings, nearly double the 2009 total. Worldwidebox office also reached an all time high of approximately $31.8 billion in 2010, compared to approximately$29.4 billion in 2009, an 8% increase. International box office ($21.2 billion) made up 67% of the 2010worldwide total, while domestic box office ($10.6 billion) made up 33% of the 2010 worldwide total, aproportion consistent with the last several years. As a result of significant growth in Asia Pacific (21%), in 2010,for the first time, Europe, the Middle East and Africa represented less than half (49%) of total international boxoffice value. Domestic theatrical admissions, or tickets sold, however, declined 5% to 1.3 billion in 2010, whichwas equivalent to the 2008 level.
Competition. Major studios have historically dominated the motion picture industry. The term “major studios” isgenerally regarded in the entertainment industry to mean Paramount Pictures, Sony, Twentieth Century Fox FilmCorp., Universal Pictures, Walt Disney Studios Motion Pictures and Warner Bros. Entertainment, Inc. All ofthese companies are owned by media conglomerates with a variety of operations, including studios, televisionnetworks, cable channels and distribution divisions, including the major studios and independent productioncompanies. These studios have historically produced and distributed the majority of theatrical motion picturesreleased annually in the U.S.
Competitors less diversified than the “major studios” include DreamWorks Animation SKG, Inc., SummitEntertainment, LLC, The Weinstein Company and MGM. These “independent” motion picture productioncompanies, including many smaller production companies, have also played an important role in the worldwidefeature film market. Independent films have gained wider market approval and increased share of overall boxoffice receipts in recent years. Lionsgate is a leading global entertainment company that competes directly withboth major studios and independents in its various businesses, although it operates with a different businessmodel and cost structure than the major studios.
Product life cycle. In general, the economic life of a motion picture consists of its exploitation in theaters and inancillary markets such as home entertainment, pay-per-view, VOD, electronic-sell-through (“EST”), digitalrentals, pay television, broadcast television, foreign and other markets. Successful motion pictures may continueto play in theaters for more than three months following their initial release. Concurrent with their release in theU.S., motion pictures are generally released in Canada and may also be released in one or more other foreignmarkets. After the initial theatrical release, distributors seek to maximize revenues by releasing movies insequential release date windows, which are generally exclusive against other non-theatrical distribution channels:
Typical Film Release Windows*
Release PeriodMonths AfterInitial Release
Theatrical —Premium VOD 2-3 monthsHome entertainment (DVD/Blu-ray/EST), VOD,pay-per-view 4-7 months
Pay television 9-15 months**Subscription VOD 9-15 monthsNetwork (free and basic) 27-30 monthsLicensing and merchandising ConcurrentAll international releasing Concurrent
* These patterns may not be applicable to every film, and may change based on release patterns, newtechnologies and product flow.
** First pay television window.
6

International theatrical distribution (outside of the U.S. and Canada) generally follows the same cycle asdomestic theatrical distribution. Historically, the international distribution cycle begins a few months after thestart of the domestic distribution cycle. However, the increasing sophistication of film piracy operations ininternational markets, as well as the ease with which the DVD format can be copied has resulted in a muchhigher percentage of films being released simultaneously to the U.S. and international markets.
Home Entertainment
Home entertainment distribution involves the marketing, promotion and sale and/or lease of DVDs and Blu-raydiscs to wholesalers and retailers who then sell or rent the DVDs and Blu-ray discs to consumers for privateviewing, and increasingly through a broad range of various digital media platforms.
Although calendar 2010 marked a year of declining consumer spend for home entertainment, the decline wassmaller than that in 2009 due to increased Blu-ray penetration, growth in on-demand platforms and growth indigital distribution, which partially offset the decline in packaged media. Generally, weakness in the overalleconomy and the anticipated maturation of the North American DVD market have been cited as reasons for thecontinued decline in, as well as continued migration towards, lower priced rental formats. According to theDigital Entertainment Group (the “DEG”), home entertainment spend, including on-demand, declined by about3.3% in 2010 to about $18.8 billion. Specifically, the industry has been experiencing a decline in DVD sales bothdomestically and internationally as a result of several factors, including advances in technologies and newmethods of product delivery and storage.
Past growth in the home entertainment sector has been driven in part, by increased Blu-ray penetration.Similarly, the 2010 home entertainment market continued to be bolstered by the steady growth of Blu-ray, assales rose 68% in 2010 compared to 2009. Moreover, on the rental front, despite challenging market conditions,Blu-ray was up 34% in brick and mortar outlets. Indeed, according to the NPD Group’s recent “EntertainmentTrends in America” report, while digital home video options are gaining in popularity, more than three quartersof U.S. consumers continue to view movies on DVD and Blu-ray. Additionally, the DEG estimates that thenumber of Blu-ray playback devices in U.S. households soared to 27.5 million in 2010, up 62% from theprevious year.
Recently, digital distribution (which includes EST and VOD) has become a growing factor in the homeentertainment market. Indeed, consumer spending on digital distribution grew 19% in 2010, making a notablecontribution to the overall home entertainment mix. Growth in digital distribution is expected in the future aswell and continued growth of higher-margin digital businesses will tend to exert pressure on home entertainmentgrowth margins.
Digital Media
Digital distribution typically involves delivering content by streaming or downloading to consumer devices suchas televisions, personal computers and mobile devices. Indeed, digital media is beginning to gain scale asconsumers are watching less traditional television and, instead, are watching content on personal computers andmobile devices, and hooking devices to their televisions and streaming video directly to their television.According to the DEG, digital distribution contributed materially to the home entertainment sector in 2010, withconsumer spending on VOD and EST up a combined 19% to $2.5 billion. Specifically, VOD brought in$1.8 billion, up 20.8% for the year, while broadband EST grew 15.7% to $683 million. Further, VODsignificantly offset the decline of the entire rental category in 2010. Without VOD, rental was down 2% for theyear — with VOD, the category was back to growth, up 2% to $7.8 billion. For the first quarter of calendar year2011, EST spending was up nearly 11% percent and consumer spending on VOD up 9%. In total, digital movietransactions were up approximately 10% percent over the same period last year. Such growth in digitaldistribution is expected in the future as well.
7

Television Programming
The market for television programming is composed primarily of the broadcast television networks (such asABC, CBS, CW, Fox and NBC), pay and basic cable networks (such as AMC, HBO, MTV, Showtime, Starz, TVGuide Network, VH1 and USA Network) and syndicators of first-run programming (such as Sony PicturesTelevision, CBS Paramount Distribution and ABC Studios) which license programs on a station-by-station basis.Continued growth in the cable and satellite television markets has driven increased demand for nearly all genresof television programming. We expect key drivers to include the success of the cable industry’s bundled services,increased average revenue per user and accelerated advertising spend growth. Additionally, increased capacityfor channels on upgraded digital cable systems and satellite television has led to the launch of new networksseeking programming to compete with traditional broadcast networks as well as other existing networks.
Cable and Satellite Television Distribution
The cable and satellite television industry is comprised primarily of cable and satellite multi system operatorsthat provide cable and satellite television service to their subscribers, and cable and satellite channels that provideprogramming content to the system operators for distribution to their subscribers. The operators generally pay aper subscriber carriage fee for the right to distribute a channel to their systems with the highest fees going tothose channels with the most viewers. Operators seek to create a mix of channels that will be attractive to theirsubscriber base to gain new subscribers and to reduce subscriber turnover. Cable and satellite channels aregenerally more clearly branded than broadcast networks and provide content that reflects those brands. Brandinghelps the channels target a more specific demographic so that they can better attract advertisers seeking to reachthat audience.
According to In-Stat, the total number of paid television subscribers around the world was up over 6% in 2010,compared to 2009. The total U.S. pay television subscribers remained flat during 2010, growing by only some148,000, a 0.15% annual growth rate (indeed, cable operators lost 2.5 million subscribers, but satellite and telcomoperators made up the difference). However, according to SNL Kagan, total U.S. multi-channel television,satellite and telecom subscribers have increased over the past five years, from approximately 93.7 million in2005 to 101.8 million in 2010, and is expected to grow approximately 5% by 2015.
The Company
Production
Motion pictures. The motion picture industry is generally composed of two major business segments: productionand distribution. Production consists of “greenlighting” and financing motion pictures, as well as thedevelopment of a screenplay, the actual filming activities and post-filming editing/post-production process. Wetake a disciplined approach to film production with the goal of producing content that we can distribute totheatrical and ancillary markets, which include home video, pay and free television, on-demand services anddigital media platforms, both domestically and internationally. We have historically produced motion pictureswith production budgets of $35 million or less. Films intended for theatrical release are generally budgetedbetween $10 million and $35 million. From time to time, we consider smaller or larger budgets. In March 2011,we announced a microbudget production initiative, which is focused exclusively on producing up to ten films peryear with budgets under $2 million. Additionally, films intended for release directly to video or cable televisionare generally budgeted between $1 million and $5 million.
In fiscal 2011, we produced, participated in the production of, completed or substantially completed principalphotography (the phase of film production during which most of the filming takes place) of the following motionpictures:
• For Colored Girls —Based on the 1974, Ntozake Shange’s choreopoem “For Colored Girls Who HaveConsidered Suicide When The Rainbow Is Enuf,” the film weaves together the stories of nine differentwomen — Jo, Tangie, Crystal, Gilda, Kelly, Juanita, Yasmine, Nyla and Alice — as they move into
8

and out of one another’s existences; some are well known to one another, others are as yet strangers.Crises, heartbreaks and crimes will ultimately bring these nine women fully into the same orbit wherethey will find commonality and understanding. Each will speak her truth as never before. And each willknow that she is complete as a human being, glorious and divine in all her colors (released inNovember 2010).
• Tyler Perry’s Madea’s Big Happy Family — Madea, everyone’s favorite wise-cracking,take-no-prisoners grandma, jumps into action when her niece, Shirley, receives distressing news abouther health. All Shirley wants is to gather her three adult children around her and share the news as afamily. But Tammy, Kimberly and Byron are too distracted by their own problems: Tammy can’tmanage her unruly children or her broken marriage; Kimberly is gripped with anger and takes it out onher husband; and Byron, after spending two years in jail, is under pressure to deal drugs again. It’s upto Madea, with the help of the equally rambunctious Aunt Bam, to gather the clan together and makethings right the only way she knows how: with a lot of tough love, laughter.and the revelation of along-buried family secret (released in April 2011).
• Conan The Barbarian — The most legendary Barbarian of all time is back. Having thrived and evolvedfor eight consecutive decades in the public imagination — in prose and graphics, on the big screen andsmall, in games and properties of all kinds — Conan’s exploits in the Hyborian Age now come alivelike never before in a colossal 3-D action-adventure film. A quest that begins as a personal vendetta forthe fierce Cimmerian warrior soon turns into an epic battle against hulking rivals, horrific monsters,and impossible odds, as Conan realizes he is the only hope of saving the great nations of Hyboria froman encroaching reign of supernatural evil.
• Abduction — For as long as he can remember, Nathan Harper has had the uneasy feeling that he’sliving someone else’s life. When he stumbles upon an image of himself as a little boy on a missingpersons website, all of Nathan’s darkest fears come true: he realizes his parents are not his own and hislife is a lie, carefully fabricated to hide something more mysterious and dangerous than he could haveever imagined. Just as he begins to piece together his true identity, Nathan is targeted by a team oftrained killers, forcing him on the run with the only person he can trust, his neighbor, Karen. Everysecond counts as Nathan and Karen race to evade an army of assassins and federal operatives. But ashis opponents close in, Nathan realizes that the only way he’ll survive — and solve the mystery of hiselusive biological father — is to stop running and take matters into his own hands.
• Norm of the North —A 3-D animated film about a polar bear who comes to New York and becomes awildly successful mascot for a multinational corporation. He makes appearances on talk shows, doespublicity stunts at iconic New York locations, stars in commercials and, of course, has all the amenitiesone would expect for someone of his stature. However, he soon discovers that without the naturalbeauty of his arctic ice, being an entertainment icon isn’t all that it’s cracked up to be.
The following motion pictures, of which we are producing or participating in the production of, are currently inor slated for production in fiscal 2012:
• The Possession — Inspired by true events, this is the terrifying story of how one family must unite inorder to survive the wrath of an unspeakable evil. Clyde and Stephanie Brenek see little cause for alarmwhen their youngest daughter, Em, becomes oddly obsessed with an antique wooden box she purchasedat a yard sale. But as Em’s behavior becomes increasingly erratic, the couple fears the presence of amalevolent force in their midst, only to discover that the box was built to contain a dibbuk — adislocated spirit that inhabits and ultimately devours its human host.
• Hunger Games — Every year in the ruins of what was once North America, the nation of Panem forceseach of its twelve districts to send a teenage boy and girl to compete in the Hunger Games. Part twistedentertainment, part government intimidation tactic, the Hunger Games are a nationally televised eventin which “Tributes” must fight with one another until one survivor remains. Pitted against highly-trained Tributes who have prepared for these Games their entire lives, Katniss is forced to rely upon
9

her sharp instincts as well as the mentorship of drunken former victor Haymitch Abernathy. If she’sever to return home to District 12, Katniss must make impossible choices in the arena that weighsurvival against humanity and life against love.
• Good Deeds —Wesley Deeds, a successful, soon-to-be-married businessman, begins to question hispredictable life when he offers help to — and eventually falls in love with — a down-on-her-lucksingle mother struggling to make ends meet.
• Pride and Prejudice and Zombies —An expanded edition of the beloved Jane Austen classic retells thetimeless story of love and independence amidst the ghastly threat of the undead. A mysterious plaguehas fallen upon England, and the dead are returning to life. Feisty heroine Elizabeth Bennetcourageously battles the zombie menace, but is distracted in her efforts to preserve England by thearrival of the arrogant Mr. Darcy. As the feelings between Elizabeth and Darcy erupt in sharp barbs andcivilized sparring, it is the blood-soaked combat with zombies on the battlefield that unites them.
• What To Expect (When You’re Expecting) —Based on the best-selling book, this wildly originalromantic comedy follows the relationships of seven couples as they experience the thrills, terrors,surprises, aches, and pains of preparing to embark on life’s biggest journey: parenthood.
Our production team attempts to produce films with disciplined budgets that have commercial potential. First,our production division reviews hundreds of scripts, looking for material that will attract top talent (primarilyactors and directors). We then actively develop such scripts, working with the major talent agencies andproducers to recruit talent that appeals to the film’s target audience. We believe the commercial and/or criticalsuccess of our films should enhance our reputation and continue to give us access to top talent, scripts andprojects. We often develop films in targeted niche markets in which we can achieve a sustainable competitiveadvantage, as evidenced by the successes of our horror films, including the Saw franchise, and our urban films,including the Tyler Perry franchise.
The decision whether to “greenlight” (or proceed with production of) a film is a diligent process that involvesmany of our key executives. Generally, the production division presents projects to a committee comprised of theheads of our production, theatrical distribution, home entertainment, international distribution, legal and financedepartments. In this process, scripts are evaluated for both artistic merit and commercial viability. The committeeconsiders the entire package, including the script, the talent that may be attached or pursued and the productiondivision’s initial budget. They also discuss talent and story elements that could make the project more successful.Next, the heads of domestic and international distribution prepare estimates of projected revenues and the costsof marketing and distributing the film. Our finance and legal professionals then review the projections andfinancing options, and the committee decides whether the picture is worth pursuing by balancing the risk of aproduction against its potential for financial success or failure. The final “greenlight” decision is made by ourcorporate senior management team, headed by the President of our Motion Picture Group and our ChiefExecutive Officer.
We typically seek to mitigate the financial risk associated with film production by negotiating co-productionagreements (which provide for joint efforts and cost-sharing between us and one or more third-party productioncompanies) and pre-selling international distribution rights on a selective basis (which refers to licensing therights to distribute a film in one or more media, in one or more specific territories prior to completion of thefilm). We often attempt to minimize our production exposure by structuring agreements with talent that providefor them to participate in the financial success of the motion picture in exchange for reducing guaranteedamounts to be paid, regardless of the film’s success (which we refer to as “up-front payments”).
In addition, many states and foreign countries have implemented incentive programs designed to attract filmproduction to their jurisdiction as a means of economic development. Government incentives typically take theform of sales tax refunds, transferable tax credits, refundable tax credits, low interest loans, direct subsidies orcash rebates, which are calculated based on the amount of money spent in the particular jurisdiction inconnection with the production. Each jurisdiction determines the regulations that must be complied with, as well
10

as the conditions that must be satisfied, in order for a production to qualify for the rebate. We use certainCanadian tax credits, German tax structures, U.K. subsidy programs, domestic state tax incentives and/orprograms (in such states as Georgia, New Mexico, Massachusetts and Pennsylvania) and other structures thatmay help reduce our financial risk.
Television. Our television business consists of the development, production and worldwide distribution oftelevision productions including television series, television movies and mini-series and non-fictionprogramming. Television revenues are primarily derived from the licensing of our productions and acquiredfilms to the domestic cable, free and pay television markets. As with film production, we use similar tax credits,structures, subsidies, incentives and programs for television production in order to employ fiscally responsibledeal structures.
Since 2000, our television programming has earned 77 Emmy® Award nominations, has won 17 Emmy®
Awards, and has been nominated and won numerous Golden Globe® Awards and Screen Actors Guild Awards®.We currently have 15 shows on more than 10 networks spanning our prime time production, distribution andsyndication businesses.
Series. Domestic television programming may include one-hour and half-hour dramas, mini-series,animated series and reality and non-fiction programming. In fiscal 2011, we delivered the followingepisodes of domestic television programming:
• 13 episodes of the fourth season of the award-winning series Mad Men, a one-hour drama for AMC;
• 13 episodes of the sixth season of the award-winning series Weeds, a half-hour comedy for Showtime;
• 12 episodes of the third season of the award-winning series Nurse Jackie, a half-hour comedy forShowtime;
• 13 episodes of the second season of Blue Mountain State, a half-hour comedy for Spike TV;
• 13 episodes of the first season of Running Wilde, a half-hour comedy for Fox; and
• 8 episodes of Scream Queens Season 2, a one-hour reality competition show for VH1.
In fiscal 2012, we expect to deliver the following episodes of domestic television programming:
• 13 episodes of the fifth season of Mad Men;
• 13 episodes of the seventh season of Weeds;
• 12 episodes of the fourth season of Nurse Jackie;
• 13 episodes of the third season of Blue Mountain State;
• 8 episodes of the first season of Boss for Starz Entertainment; and
• Other various proposed pilots and television series that may be delivered in the fiscal year.
Animation. We are involved in the development, acquisition, production and distribution of a number ofanimation projects for full theatrical release, television and DVD release.
DVD production — In the past several years, we have released several direct-to-video animated movies withMarvel Entertainment Inc. (“Marvel”) including Ultimate Avengers, Ultimate Avengers 2, The InvincibleIron Man, Doctor Strange, Next Avengers: Heroes of Tomorrow, Hulk vs. Thor/ Wolverine and Planet Hulk.We also released Thor, Tales of Asgard in May 2012.
Television production — In 2009, we delivered 26 half-hours and five films of a comedic action adventureseries titled Speed Racer: The Next Generation (based on the well-known franchise Speed Racer) toNickelodeon Networks, which was produced by Animation Collective of New York City. All 26 episodes
11

aired in fiscal 2009. A second 26 half-hour season of the adventure series was ordered, six episodes ofwhich were delivered in fourth quarter fiscal 2011, and the balance of which are expected to be delivered infiscal 2012. The second season is being produced by Toonz Entertainment, Kick Start Productions andAnimation Collective, and has already begun airing on Nickelodeon Networks Nick Toons. Additionally,the first DVD of Speed Racer, The Next Generation was released in the first quarter of fiscal 2009, thesecond DVD was released in the third quarter of 2009 and the third DVD was released in the second quarterof fiscal 2010. We are overseeing merchandising and licensing as well as distributing this adventure serieson DVD.
Theatrical films — In September 2010, we released Alpha and Omega, a 3-D animated film starring JustinLong, Hayden Panettiere, Christina Ricci, Danny Glover and Dennis Hopper, with our partner, CrestAnimation. The film is the first picture developed under a co-finance deal with Crest Animation and is fromthe creator of Open Season, a Sony Pictures Animation CGI film. Building on our relationship with CrestAnimation, in February 2010, we announced our second production in a multi-picture deal, Norm of theNorth. We anticipate delivery of this 3-D animated movie by the end of 2012, which we will be distributingdomestically.
Television movies, mini-series and specials. From time to time, we also are involved in the development,acquisition, production and distribution of television content in the movie-of-the week, mini-series and realityspecial formats.
Music. Our music department creatively oversees music for our theatrical and television slate, as well as themusic needs of other areas within our company. Our music strategy is to service the creative division’s musicneeds, while building a business that focuses on healthy growth areas of the music business, specifically, musicpublishing assets and improving soundtrack distribution. Unlike music publishers, whose revenue has historicallybeen dependent upon royalties generated by record sales, our publishing revenue derives primarily fromperformance royalties generated by the theatrical exhibition of our films and the television broadcast of ourproductions.
Music released for our theatrical slate includes overseeing scores and soundtracks for all of our productions,co-productions and acquisitions. In fiscal 2011, we released Danny Elfman’s score to The Next Three Days,soundtracks to Rabbit Hole, For Colored Girls Who and The Expendables, and the song/score soundtrack to ourfirst animated feature, Alpha & Omega. In fiscal 2012, we expect to release soundtracks for Abduction, TheDevil’s Double, Conan the Barbarian and Warrior, and will continue our artist outreach by hosting a musiccomponent of the Sundance Film Festival, “A Celebration of Music in Film.”
Music released for our television slate in fiscal 2011 included Mad Men After Dark, our best-selling score-onlyalbum to date, and Nurse Jackie’s opening music, which garnered a 2010 Emmy® Award for Best Main TitleTheme Music. Additionally, we implemented musical logos for Debmar-Mercury and our other televisionprogramming that is heard during the closing credits of such broadcasts, which help define our brands and earnperformance royalties from The American Society of Composers, Authors and Publishers and Broadcast Music,Inc. In fiscal 2012, we intend to release new soundtracks for Mad Men, Nurse Jackie, and Blue Mountain State,as well as develop a music destination for horror-themed music for FEARnet.com.
12

Distribution
Domestic theatrical distribution. “Distribution” refers to the marketing and commercial or retail exploitation ofmotion pictures. We distribute motion pictures directly to U.S. movie theaters. Generally, distributors andexhibitors (theater owners) will enter into agreements whereby the exhibitor retains a portion of the “gross boxoffice receipts,” which are the admissions paid at the box office. The balance (i.e., gross film rentals) is remittedto the distributor.
Over the past 13 years, our releases have included the following in-house productions or co-productions:
Title Principal Actors
Akeelah and the Bee Keke Palmer, Laurence Fishburne, Angela BassettCrank Jason Statham, Amy SmartCrank: High Voltage Jason Statham, Amy Smart, Bai LingEmployee of the Month Dane Cook, Jessica Simpson, Dax ShepherdFor Colored Girls Janet Jackson, Loretta Devine, Kimberly Elise, Thandie
Newton, Phylicia Rashad, Anika Noni Rose, TessaThompson, Kerry Washington, Whoopi Goldberg
Godsend Robert DeNiro, Greg Kinnear, Rebecca Romijn StamosGood Luck Chuck Jessica Alba, Dane CookGrizzly Man DocumentaryKillers Katherine Heigl, Ashton Kutcher, Tom Selleck,
Catherine O’HaraMonster’s Ball Halle Berry, Billy Bob ThorntonMy Best Friend’s Girl Kate Hudson, Dane CookMy Bloody Valentine 3-D Jensen Ackles, Jamie KingPride Bernie Mac, Terrence HowardPunisher: War Zone Ray Stevenson, Julie Benz, Dominic WestThe Eye Jessica AlbaThe Next Three Days Russell Crowe, Elizabeth Banks, Liam NeesonThe Punisher John Travolta, Thomas JaneThe Spirit Gabriel Macht, Samuel Jackson, Scarlett Johansson, Eva
MendesThe U.S. vs. John Lennon DocumentarySaw II Donnie Wahlberg, Tobin Bell, Shawnee SmithSaw III Tobin Bell, Shawnee Smith, Bahar Soomekh, Angus
MacFaydenSaw IV Tobin BellSaw V Tobin Bell, Scott PattersonSaw VI Tobin Bell, Betsy Russell, Costas Mandylor, Shawnee
SmithSaw 3-D Tobin Bell, Cary Elwes, Costas MandylorTyler Perry’s Daddy’s Little Girls Gabrielle Union, Idris Elba, Tracee Ellis Ross, Malinda
Williams, Terri Vaughn, Lou Gossett Jr.Tyler Perry’s Diary of a Mad Black Woman Tyler Perry, Steve Harris, Shemar MooreTyler Perry’s I Can Do Bad All By Myself Taraji P. Henson, Janet Jackson, Louis Gossett Jr.Tyler Perry’s Madea’s Big Happy Family Tyler PerryTyler Perry’s Madea’s Family Reunion Tyler PerryTyler Perry’s Madea Goes To Jail Tyler Perry, Keke Palmer, Keisha Knight Pulliam,
Derek LukeTyler Perry’s Meet The Browns Tyler Perry, Angela BassettTyler Perry’s Why Did I Get Married? Tyler Perry, Janet JacksonTyler Perry’s Why Did I Get Married Too? Tyler Perry, Janet Jackson, Tasha SmithTyler Perry’s The Family That Preys Tyler Perry, Alfre Woodard, Kathie BatesWar Jet Li, Jason Statham
13

Motion pictures that we have acquired and distributed in this same time period include the following:
Title Principal Actors
3:10 to Yuma Russell Crowe, Christian BaleBangkok Dangerous Nicolas CageBrothers Jake Gyllenhaal, Natalie Portman, Tobey MaguireCrash Don Cheadle, Sandra Bullock, Matt Dillon, Brendan
FraserDaybreakers Ethan Hawke, Willem Dafoe, Sam NeillDogma Ben Affleck, Matt Damon, Chris RockFahrenheit 9/11 DocumentaryFrom Paris With Love John Travolta, Jonathan Rhys MeyersGamer Gerard Butler, John Leguizamo, Milo Ventimiglia,
Kyra SedgwickGirl With A Pearl Earring Scarlett Johannson, Colin FirthHard Candy Patrick Wilson, Ellen PageKick-Ass Nicolas Cage, Christopher Mintz-Plasse, Aaron
Johnson, Chloe MoretzLord of War Nicolas Cage, Ethan Hawke, Jared Leto, Bridget
MoynahanMore Than A Game LeBron JamesNew In Town Renee Zellwegger, Harry Connick Jr.The Bank Job Jason StathamThe Cooler Alec Baldwin, William H. Macy, Maria BelloThe Descent Shauna Macdonald, Natalie Jackson Mendoza, Alex
Reid, Saskia MulderThe Expendables Sylvester Stallone, Jet Li and Jason StathamThe Lincoln Lawyer Matthew McConaughey, Marisa TomeiThe Last Exorcism Patrick Fabian, Ashley BellThe Forbidden Kingdom Jet Li, Jackie ChanThe Haunting In Connecticut Virginia MadsenO Julia Stiles, Mekhi PhiferOpen Water Blanchard Ryan, Daniel TravisPrecious Gabourey Sidibe, Mo’Nique, Paula Patton, Maria
CareyRambo Sylvester StalloneReligulous Bill MaherSaw Danny Glover, Monica Potter, Cary ElwesSicko DocumentaryThe Spy Next Door Jackie Chan, George Lopez, Billy Ray CyrusTransporter 3 Jason StathamW Josh Brolin, Elizabeth Banks, Ellen Burstyn, James
Cromwell, Thandie Newton
In the last 13 years, films we have distributed have earned 53 Academy Award® nominations and 16 AcademyAwards®, and have been nominated and won numerous Golden Globe® Awards, Screen Actors Guild Awards®,BAFTA Awards and Film Independent Spirit Awards.
14

We have released approximately 14 motion pictures theatrically per year for the last three years, which includefilms we develop and produce in-house, films that we develop and produce with our partners and films that weacquire from third parties. In fiscal 2012, we currently intend to release approximately 11 to 13 motion picturestheatrically. Our approach to acquiring films for theatrical release is similar to our approach to film production.We generally seek to limit our financial exposure while adding films of quality and commercial viability to ourrelease schedule and our video library. The decision to acquire a motion picture for theatrical release entails aprocess involving our key executives from the releasing, home entertainment and acquisitions departments, aswell as corporate senior management. The team meets to discuss a film’s expected critical reaction,marketability, and potential for commercial success, as well as the cost to acquire the picture, the estimateddistribution and marketing expenses (typically called “P&A” or “prints and advertising”) required to maximizethe targeted audience and ancillary market potential after its theatrical release. Generally, we release films on awide basis to more than 2,000 screens nationwide.
We construct release schedules taking into account moviegoer attendance patterns and competition from otherstudios’ scheduled theatrical releases. We use either wide or limited initial releases, depending on the film. Wegenerally spend significantly less on P&A for a given film than a major studio and we design our marketingplans to cost-effectively reach a large audience.
For fiscal 2012, our proposed theatrical release schedule may include, among others, the following titles:
Title Summary Principal Actors
Producedor
Acquired*ApproximateRelease Date
Tyler Perry’sMadea’s Big HappyFamily
See summary above. Tyler Perry,LorettaDevine, Shad“Bow Wow”Moss, DavidMann
Produced April 2011
The Devil’s Double The year is 1987 and Baghdad isthe playground for the rich andinfamous- where anything can bebought, for a price. When armylieutenant, Latif Yahia issummoned from the frontline toSaddam’s palace, he is faced withan impossible request — to beIraq’s notorious Black Prince UdayHussein’s ‘fiday,’ his body double.With his family’s lives as well ashis own on the line, his fate isdecided. Latif begins his journeyas Uday Hussein, a man as widelyhated as he is powerful. As helearns to walk, talk and act likeUday, he experiences theextravagance of a world filled withfast cars, endless money, easywomen, and deeply depravedviolence. Knowing who to trustbecomes a matter of life or death,as he battles to escape from hisforced existence alongside Sarrab,Uday’s notorious concubine.
DominicCooper,LudivineSangier
Acquired July 2011
15

Title Summary Principal Actors
Producedor
Acquired*ApproximateRelease Date
Conan The Barbarian See summary above. JasonMomoa, RonPerlman,RachelNichols,StephenLang, RoseMcGowan
Produced August 2011
Warrior See summary above. JoelEdgerton,Tom Hardy,JenniferMorrison,Nick Nolte
Produced September 2011
Abduction See summary above. TaylorLautner, LilyCollins,AlfredMolina,Jason Issacs,Maria Bello,SigourneyWeaver
Produced September 2011
Safe A former elite agent encountersand rescues a twelve-year-oldChinese girl who’s been abductedby the Triads. Armed with a safe-cracking combination, they findthemselves in the middle of astand-off between Triads, theRussian Mafia and high-levelcorrupt New York City politiciansand police.
JasonStatham,CatherineChan
Acquired October 2011
The Possession See summary above. Jeffrey DeanMorgan,KyraSedgwick
Produced January 2012
One For The Money See summary above. KatherineHeigl
Acquired January 2012
16

Title Summary Principal Actors
Producedor
Acquired*Approximate Release
Date
The Hunger Games See summaryabove.
Jennifer Lawrence,Stanley Tucci, WesBentley, ElizabethBanks, WoodyHarrelson, JoshHutcherson, LiamHemsworth, LennyKravitz
Produced March 2012
* Includes significant participation in production.
We may revise the release date of a motion picture as the production schedule changes or in such a manner as webelieve is likely to maximize revenues or for other business reasons. Additionally, there can be no assurance thatany of the motion pictures scheduled for release will be completed, that completion will occur in accordance withthe anticipated schedule or budget, that the film will ever be released, or that the motion pictures will necessarilyinvolve any of the creative talent listed above.
Mandate Pictures. Our wholly-owned subsidiary, Mandate Pictures, is a full-service production and financingcompany that continues to operate as an independent brand delivering acclaimed commercial and independentfilms worldwide. In fiscal 2011, Mandate produced The Switch, starring Jennifer Aniston and Jason Bateman,which was released in North America by Miramax in August 2010.
Mandate Pictures’ upcoming film slate includes the following titles:
Title Summary Principal Actors
ApproximateRelease
Date/Distributor
50/50 Inspired by personal experiences, this is an original storyabout friendship, love, survival and finding humor inunlikely places. Joseph Gordon-Levitt and Seth Rogen staras best friends whose lives are changed by a cancerdiagnosis.
Joseph Gordon-Levitt, SethRogen, AnnaKendrick, BryceDallas Howardand AnjelicaHuston
September 2011(SummitEntertainment)
YoungAdult
Mavis Gary, a writer of teen literature, returns to her smallhometown to relive her glory days and attempt to reclaimher happily married high school sweetheart. When returninghome proves more difficult than she thought, Mavis formsan unusual bond with a former classmate who hasn’t quitegotten over high school, either.
Charlize Theron,Patton Oswalt,Patrick Wilson
Fiscal 2012(ParamountPictures)
Harold &Kumar 3
The new comedy picks up six years after the duo’s lastadventure. After years of growing apart, Harold Lee andKumar Patel have replaced each other with new best friendsand are preparing for their respective Christmascelebrations. But when a mysterious package arrives atKumar’s door, his attempt to deliver it to Harold’s houseends with him inadvertently burning down Harold’s father-in-law’s prize Christmas tree. With his in-laws out of thehouse for less than a day, Harold decides to cover his tracksrather than come clean, and reluctantly embarks on anotherill-advised but hilarious journey with Kumar, taking themthrough New York City on Christmas Eve in search of theperfect Christmas tree.
John Cho, KalPenn, Neil PatrickHarris, TomLennon, DannyTrejo, PattonOswalt, PaulaGarces, DaneelHarris
November 2011(Warner Bros.Pictures)
17

Title Summary Principal Actors
ApproximateReleaseDate/
Distributor
LOL In a world connected by YouTube, iTunes and Facebook, Lolaand her friends navigate the peer pressures of high schoolromance and friendship while dodging their sometimesoverbearing and confused parents. When Lola’s mom, Anne,“accidentally” reads her teenage daughter’s racy journal, sherealizes just how wide their communication gap has grown.Through hilarious and heartfelt moments between mother anddaughter, LOL is an authentic coming-of-age story thatperfectly captures today’s zeitgeist.
Miley Cyrus,Demi Moore,Ashley Greene,Thomas Jane,Douglas Booth,George Finn,Ashley Hinshaw,Adam Sevani,Lina Esco, TanzWatson, MarloThomas
Fiscal 2012(Lionsgate)
Mandate Pictures’ current development and production slate includes, among others: Seeking A Friend For TheEnd Of The World, starring Steve Carell and Keira Knightley; Great Hope Springs, a comedy starring MerylStreep and Steve Carell; a romantic actioner starring Zac Efron; Dogs of Babel, Jamie Linden’s adaptation of thebest-selling novel, starring Steve Carell; Dream On, a teen dance movie; The Low Self Esteem of Lizzie Gillespie,a romantic comedy to be written by Brent Forrester and Mindy Kaling; My Dinner with Hervé, written anddirected by Sacha Gervasi, a former journalist who conducted the last interview with French actor HerveVillechaize; an untitled comedy to be written by D.V. DeVincentis based on the book “You Are a MiserableExcuse for a Hero” by Bob Powers; and a remake of the highly-acclaimed South Korean action-adventure/epic,Old Boy.
Mandate Pictures also maintains a partnership with Ghost House Pictures (“Ghost House”), formed withfilmmakers Sam Raimi (Spider-Man and Evil Dead Franchises) and Rob Tapert as a production label dedicatedto the financing, development and production of films in the horror/thriller genre. Under this partnership,Mandate Pictures has produced 30 Days of Night: Dark Days, Drag Me To Hell, along with such titles as 30Days of Night, The Grudge I and II, The Messengers and Boogeyman. Ghost House’s current development andproduction slate includes, among others, The Possession, which is expected to be released by us in NorthAmerica in October 2011, Burst 3-D, a horror/thriller project, and Panic Attack, an original idea with YouTubeand Uruguayan filmmaker Federico Alvarez. In October 2009, Ghost House established Spooky Pictures, aproduction label under the Ghost House banner dedicated to the financing, development, production anddistribution of scary movies made for the family audience. The first project under the new label will be TheSubstitute, in collaboration with Sony Pictures and Stars Road Entertainment’s Joshua Donen.
Mandate Pictures continues to foster talent relationships by inking exclusive production deals with top writersand directors. Mandate Pictures recently signed a first-look deal with David Gordon Green, Jody Hill and DannyMcBride to produce high concept comedies under the label Rough House Pictures (“Rough House”). Combiningtheir creative filmmaking with Mandate Pictures’ financing and producing expertise, Rough House isestablishing itself as a hub for exciting and bold comedic voices. Projects in development through RoughHouse’s agreement with Mandate Pictures include, among others, Bullies, an action-comedy starring DannyMcBride, and an untitled comedy set around the Olympics co-starring Aziz Ansari and Danny MacBride, writtenby Park & Recreation writer Harris Wittels from an idea by Primetime Emmy® Award-winning 30 Rock writerMatt Hubbard.
Ancillary markets. In addition to the distribution described above, we also license the right to non-theatrical usesof our films to distributors who, in turn, make a motion picture available to airlines, hotels, schools, oil rigs,public libraries, prisons, community groups, the armed forces, ships at sea and others.
18

International sales and distribution. The primary components of our international business are, on a territory byterritory basis through third parties or directly through our international divisions: (i) the licensing and sale ofrights in all media of our in-house product; (ii) the licensing and sale of third party product on an agency basis;(iii) the licensing and sale of in-house catalog product or libraries of acquired titles (such as those of Miramax,Artisan Entertainment and Modern Times Group); and (iv) direct distribution.
Lionsgate International — We sell or license rights in all media on a territory by territory basis (other thanthe territories in which Lionsgate UK and Maple Pictures sell and distribute) of (i) our in-house Lionsgateproduct, as well as titles from Mandate Pictures and Ghost House, (ii) our catalog product or libraries ofacquired titles, and (iii) product produced by third parties such as Relativity Media, Gold Circle Films, LLCand other independent producers. We often pre-sell international territories to cover a significant portion ofthe production budget or acquisition cost on new releases. We also leverage our infrastructure to generaterevenue through a sales agency business for third party product. Recent films sold by us include suchin-house productions as Abduction, The Next Three Days, starring Russell Crowe, Saw 3-D, 50/50, starringSeth Rogen and Joseph Gordon Levitt, The Possession and The Hunger Games. Recent third party filmssold by us include Limitless, starring Bradley Cooper and Robert DeNiro, and the upcoming Immortals 3-D,starring Henry Cavill, Freida Pinto and Mickey Rourke. In fiscal 2011, we had record-breaking sales of over$100 million at the November 2010 American Film Market, driven by upcoming in-house productions ofThe Hunger Games and The Possession.
Lionsgate UK—We self-distribute our motion pictures in the U.K. and Ireland through our subsidiary,Lionsgate UK. Lionsgate UK’s fiscal 2011 theatrical slate included such titles as The Expendables, Saw 3-Dand The Mechanic, starring Jason Statham. In fiscal 2011, Lionsgate UK also financed and produced itssecond feature, Salmon Fishing in the Yemen, starring Ewan McGregor and Emily Blunt. International saleswere handled by Lionsgate International. In the last three years, Lionsgate UK has also successfully built upa strong third party acquisitions business. Lionsgate UK releases over 40 direct-to-video titles per year, themajority of which are acquired in the open market. Elevation, our joint venture with Optimum Releasing/StudioCanal, handles the joint sales and distribution of DVD product for Lionsgate UK. In fiscal 2012,Lionsgate UK expects to release titles such as Conan The Barbarian, Warrior, and Ralph Fiennes’directorial debut, Coriolanus, and will begin production on The Professionals, based on the popular 1970sBritish television series of the same name.
Television —We continue to expand our television business internationally through sales and distribution oforiginal Lionsgate television series, third party television programming and format acquisitions.
Canada—We distribute our motion picture, television and home video product in Canada through MaplePictures, one of the largest independent distributors in Canada. Maple Pictures also acquires and distributesthird party films, including, in fiscal 2010, Academy Award® winners The Hurt Locker, which won sixawards including Best Picture, and The Cove, which won Best Documentary. In fiscal 2011, Maple Picturesdistributed acquired films including Winter’s Bone, nominated for several Academy Awards® includingBest Picture, and Biutiful, starring Javier Bardem, nominated for an Academy Award® for Best ForeignLanguage Film. Maple Pictures’ fiscal 2012 slate includes Our Idiot Brother, starring Paul Rudd, whichplayed at the 2011 Sundance Film Festival, and Drive, starring Ryan Gosling and Carey Mulligan, whichwas included in competition at the 2011 Cannes Film Festival. Maple Pictures is supportive of Canadianproductions as well which, in fiscal 2011, included Man On The Train, starring Donald Sutherland, andServitude, produced through the Canadian Film Centre Comedy Lab.
Home video distribution. Home video distribution includes distribution of films to the home entertainmentmarket, including home video, DVD, Blu-ray, VOD, and digital/electronic distribution. Our U.S. videodistribution operation aims to exploit our filmed and television content library of approximately 13,000 motionpicture titles and television episodes and programs.
19

In fiscal 2011, we continued to achieve one of the highest box office-to-DVD conversion rates in the industry,maintaining a rate of approximately 26% above that of the normalized industry average. Box office-to-DVDconversion rate is calculated as the ratio of the total first cycle DVD release revenues for such theatrical releasecompared to the total box-office revenues from a theatrical release. We also achieved a box office-to-VODconversion rate of approximately 5% to 10% above the industry normalized average in fiscal 2011. Boxoffice-to-VOD conversion rate is calculated as the ratio of total first cycle VOD revenues for such theatricalrelease compared to the total box-office revenues from a theatrical release.
For calendar year 2010, Blu-ray represented over 22% of new theatrical DVD release revenue from our newtheatrical releases. According to data from industry sources, in calendar year 2010, we held an approximately 5%market share of the Blu-ray theatrical feature film market based on revenue. We also maintained our overallmarket share of combined sell-through and rental consumer spend at approximately 7% for calendar year 2010,compared to calendar year 2009 (and approximately 8% for the first quarter of calendar year 2011).
We distribute or sell our titles directly to mass merchandisers such as Wal-Mart Stores, Inc. (“Wal-Mart”),K-Mart, Best Buy Co. Inc. (“Best Buy”), Target Corporation and Costco Wholesale Corporation, and others whobuy large volumes of our DVDs and Blu-ray discs to sell directly to consumers. Sales to Wal-Mart accounted forapproximately 35% of net home entertainment packaged media revenue in fiscal 2011. No other customeraccounted for more than 10% of our revenues in fiscal 2011.
We also directly distribute our titles to the rental market through Netflix, Inc. (“Netflix”), Redbox AutomatedRetail, LLC (“Redbox”), Blockbuster, Inc. (“Blockbuster”), and Rentrak Corporation. In April 2011, weannounced an exclusive multiyear syndication deal in which we licensed the first four seasons of Mad Men to bewatched instantly by Netflix members starting July 27, 2011, with additional seasons (five through seven) to beadded annually after they complete airing on their respective seasons on AMC.
In fiscal 2011, we had four theatrical releases on DVD debut at number one with Tyler Perry’s Why Did I GetMarried Too?, Kick-Ass, Killers and For Colored Girls. Additionally, in fiscal 2011, we had six titles thatdebuted at either number one or number two on the Rentrak On-Demand VOD charts with Next Three Days,Expendables, Killers, Tyler Perry’s Why Did I Get Married Too?, Kick-Ass and From Paris with Love.Additionally, our Saw franchise continued as the number one horror franchise in DVD history.
In addition to our theatrical releases each year, we also acquire approximately 65 titles annually that havecommercial potential in video and ancillary markets, adding a total of approximately 75 to 80 films to our libraryeach year. We also distribute television product on video, including certain Saturday Night Live product currentlyin our library (which distribution rights were extended through 2014), the first, second, third and fourth seasonsof the Primetime Emmy® Award-winning AMC series Mad Men, the first, second, third, fourth, fifth and sixthseasons of the Primetime Emmy® Award-winning Showtime series Weeds, the first season of Blue MountainState, the first and second seasons of Nurse Jackie, the first season of the Showtime series Secret Diary of A CallGirl, the entire catalog of the comedy series Moonlighting, the entire catalog of the comedy series Will andGrace, the entire catalog of Little House on the Prairie, and certain Disney-ABC Domestic Television series andComcast series.
In fiscal 2011, we also released several direct-to-video titles including Madea’s Big Happy Family-The Play,Peacock, Burning Bright, The Descent Part 2, Fred the Movie, Tenderness, The Least Among You, The WayHome and The Last Play at Shea, as well as several Spanish language direct-to-video titles including Amor LetraPor Letra, Bluff, Amor Dolor y Viceversa, Crimenes de Lujuria and Oscura Seduccion.
We continue our direct-to-video horror genre with our arrangement with Ghost House Underground, the filmacquisitions company that extends the Ghost House brand to home entertainment. In fiscal 2011, we released twotitles including Psych 9 and Stag Night.
20

We remain a leader in distribution of fitness product. For calendar year 2010, we had an approximate 30%market-share in fitness and ranked number two among all studios. We are currently ranked number one amongall studios for calendar year 2011 to date, with an approximate 25% market share. Our fitness lineup includespopular series such as Denise Austin, Jillian Michaels, The Biggest Loser and Dancing With The Stars, as well astitles from Billy Blanks Jr., and Jane Fonda. We had the top five fitness releases of the year in fiscal 2011,including 30 Day Shred (the top selling fitness title in the DVD era), Yoga Meltdown, No More Trouble Zones,Banish Fat Boost Metabolism and 6 Week Six Pack.
Our relationship with Tyler Perry, which has been the filmmaker’s home since his breakthrough theatrical boxoffice hit Diary of a Mad Black Woman in February 2005, continues. In fiscal 2010, we released on DVD thetheatrical releases of Madea Goes To Jail and I Can Do Bad All By Myself. In fiscal 2011, we released on DVDthe theatrical releases of Why Did I Get Married Too?, For Colored Girls, and the direct-to-video release ofTyler Perry’s play, Madea’s Big Happy Family. To date, we have also released on DVD the first through sixthvolumes of the TBS television series Tyler Perry’s House of Payne, and expect to release the seventh and eightvolumes in fiscal 2012, as well as the first volume of the TBS television series Tyler Perry’s Meet The Browns.InMarch 2011, we announced that our first look partnership with Tyler Perry was extended through a new multi-year arrangement for films and home entertainment in which we will continue to distribute DVD’s based on hishit films and from his catalog of plays and other material.
Our domestic family entertainment division has established itself as a major home entertainment distributor ofchildren’s product. According to Nielsen Media Research, in calendar year 2010, our children’s non-theatricalDVD share, 18%, was the second highest market-share of all studios. This share was driven by our continueddistribution of product from HIT Entertainment, Inc. (“HIT Entertainment”), Aardman Animations Ltd(“Aardman Animations”), LeapFrog Enterprises, Inc. (“LeapFrog”), the Jim Henson Company (“Jim Henson”),Marvell and our catalog of premiere children’s brands including Barbie, Bratz, Care Bears, Clifford the Big RedDog, Speed Racer and Teenage Mutant Ninja Turtles. HIT Entertainment’s extensive portfolio of award-winningchildren’s programming distributed by us includes the children’s DVD preschool franchises Thomas & Friends,Barney, Bob the Builder and Fireman Sam, as well as, beginning in fiscal 2011, Angelina Ballerina, theCGI-animated television series broadcasting on PBS, and Timmy Time, the Shaun the Sheep spin-off preschooltelevision series broadcast on Disney Junior. Additionally, in fiscal 2011, we continued to produce and distributedirect-to-video family-oriented feature films for educational toy maker LeapFrog and distributed new DVDpremiere animated movies for Care Bears and Bratz. We also added and relaunched Jim Henson’s WubbulousWorld of Dr. Seuss television series on DVD and distributed YouTube star Fred Figglehorn’s first movie, Fred:The Movie.
We continue our distribution agreement with Disney-ABC Domestic Television under which we obtained thehome entertainment distribution rights to select prime time series and library titles from ABC Studios, includingAccording to Jim, starring Jim Belushi and Courtney Thorne- Smith, Reaper, Hope & Faith, starring Kelly Ripaand Faith Ford, 8 Simple Rules.for Dating My Teenage Daughter, starring John Ritter and Katey Sagal, BoyMeets World, starring Ben Savage and Rider Strong, My Wife & Kids, starring Damon Wayans and TishaCampbell, and Dirt Season starring Courtney Cox.
Our first-look partnership continues with Comcast, which operates Comcast’s West Coast entertainmentproperties, under which we obtained the home entertainment distribution rights to series airing on E!Entertainment Television, The Style Network and G4 including Keeping Up with the Kardashians, Kourtney andKhloe Take Miami, Sunset Tan, Snoop Dogg’s Father Hood, and Kimora: Life In The Fab Lane. We alsomaintain distribution rights for SyFy’s (formerly known as the Sci-Fi Channel) Alice mini-series.
Recent Developments. In February 2011, we entered into a worldwide home entertainment distributionagreement with Miramax pursuant to which we will distribute more than 550 titles from the Miramax filmlibrary via DVD, Blu-ray, EST and internet VOD, in addition to cable VOD internationally. We will partnerwith leading international distributor Studiocanal to distribute Miramax titles in the U.K. and Europe.
21

In November 2010, we entered into a home entertainment distribution agreement with Wrekin HillEntertainment (“Wrekin Hill”) pursuant to which we became the exclusive home entertainment distributor(including DVD, Blu-ray, digital delivery, and VOD) for all Wrekin Hill theatrical releases in the U.S.
In July 2010, we entered into a multi-year home entertainment distribution agreement with Francis FordCoppola’s Zoetrope Corporation. Under the terms of the arrangement, we obtained the North AmericanDVD, Blu-ray, EST, VOD and broadcast television distribution rights to films including Apocalypse Now,Apocalypse Now Redux and others, as well as the North American DVD, Blu-ray, EST and VOD rights toThe Conversation.
In May 2010, we entered into a home entertainment distribution agreement including DVD, Blu-ray, digitaldelivery, television and VOD for all Exclusive Media Group’s (Exclusive) Newmarket Films theatrical titlesin the U.S., as well as its library of 250 titles.
Television syndication. We distribute television programming through our subsidiary, Debmar-Mercury. In fiscal2011, Debmar-Mercury distributed approximately 1,200 hours and produced approximately 195 hours oftelevision programming. In fiscal 2012, Debmar-Mercury currently intends to distribute approximately 1,400hours and produce approximately 345 hours of television programming.
Currently, Debmar-Mercury produces and distributes The Wendy Williams Show, distributes Tyler Perry’s Houseof Payne and its spinoff Meet the Browns, and the strips Hell’s Kitchen, Family Feud, South Park and TrueHollywood Story. Debmar-Mercury also distributes Are We There Yet, which premiered on TBS in June 2010(and is expected to air in syndication beginning in the fall of 2012), as well as a movie library featuring our titlesas well as those from Revolution Studios.
In April 2011, Debmar-Mercury announced that TBS ordered ten episodes of the new series Tyler Perry’s ForBetter or Worse, a sitcom based on Tyler Perry’s hit Why Did I Get Married? films, which is expected to launchin December 2011. For Better or Worse is Debmar-Mercury’s third syndicated sitcom with Tyler Perry. 362episodes of Debmar-Mercury’s syndicated sitcoms with Tyler Perry have been ordered to-date.
Moreover, beginning in the fall of 2011, a U.S. version of The Jeremy Kyle Show, a successful talk series in theU.K., will be produced in conjunction with ITV Studios America and distributed by Debmar-Mercury fordaytime stripping on television stations across the country. In fiscal 2012, Debmar-Mercury will also be testing atalk show starring Father Albert Cutie in a joint venture with certain Fox television stations.
Pay and free television distribution. We currently have approximately 800 titles in active distribution in thedomestic cable, free and pay television markets. Pay television rights include rights granted to cable, directbroadcast satellite and other services paid for by subscribers. We sell our library titles and new product to majorcable channels such as Showtime, USA Network, FX, Turner Networks, Starz Entertainment, Family Channel,Disney Channel, Cartoon Network, SyFy, Lifetime, MTV, Comedy Central, OWN and BET. Recently, inMay 2010, we licensed 139 of our most prestigious and successful theatrical titles to Rainbow Media, for airingon its IFC, Sundance, AMC and WE networks. We also directly distribute to pay-per-view and VOD to cable,satellite and internet providers such as Comcast, Time Warner Inc., Cox Communications, Inc. thru iN DemandL.L.C., Charter Communications, Inc., AT&T Uverse and Verizon FIOS thru Avail-TVN, Cablevision SystemsCorp., DirecTV, Inc. and DISH Network L.L.C. Additionally, in April 2008, we formed a joint venture withViacom, Paramount Pictures, and MGM and created EPIX. EPIX, which launched in October 2009, provides uswith an additional platform to distribute our library of motion picture titles and television episodes and programs.
Electronic distribution. We also deliver our content through a broad spectrum of digital media platforms. Wehave digital delivery arrangements for first run theatrical films, television series, our movie library, third partyproduct and product not available on DVD. Distribution outlets include, among others, Apple iTunes,Amazon.com, Inc., Microsoft Inc.’s Zune/X-BOX, Sony’s Playstation Network, Netflix, Roxio, Best Buy/CinemaNow, Hulu LLC (“Hulu”), YouTube, mSpot, Inc. and Wal-Mart/Vudu. We currently have over 900 filmsand television episodes in active distribution through these digital channels.
22

Through our partnership with EPIX, we offer product via the internet and to multiple devices for consumption“anytime/anywhere” by EPIX subscribers. Recently, in August 2010, EPIX announced an agreement throughwhich Netflix members can instantly watch an array of new releases and library titles from EPIX streamed overthe internet from Netflix beginning September 1, 2010. EPIX has subscription pay television rights to newreleases and movies from the libraries of its partners and will make these movies available to Netflix 90 daysafter their premium pay television and subscription on demand debuts. Historically, the rights to distribute thesefilms are pre-sold to pay television for as long as nine years after their theatrical release.
We also operate FEARnet, a branded multiplatform programming and content service provider of horror genrefilms, in connection with partners Comcast and Sony, and own an interest in Break Media, a leading viralmarketing company that creates new opportunities for showcasing our feature films and television programming.Additionally, we have partnered with YouTube to create new branded “Lionsgate” channels which enable us topost full length films and television episodes and to post promotional scenes from our film and televisionlibraries. In addition to sharing advertising revenue from the channel, a banner on the page leads to our onlineshop, where our films and shows highlighted in the promotional scenes are available for purchase as DVDs orBlu-ray discs in digital form.
Joint Ventures and Partnerships
Pantelion Films. In July 2010, we announced the launch of Pantelion Films, a joint venture with Grupo Televisa,S.A.B., designed to produce and distribute a slate of English and Spanish language feature films to targetHispanic moviegoers in the U.S., one of the fastest-growing segments of the U.S. moviegoer population. Indeed,according to the Motion Picture Association of America’s U.S. Theatrical Market Statistics 2010, althoughCaucasians currently make up the majority of the U.S. population and moviegoers (141 million), they represent alower proportion of ticket sales, down to 56% of tickets in 2010, compared to 60% in 2009. In 2010, 43 millionHispanic moviegoers purchased 351 million movie tickets, up from 37 million moviegoers and 300 milliontickets in 2009. Moreover, in 2010, Hispanics had the highest moviegoing per capita, attending movies onaverage seven times per year, compared to closer to four times a year for other ethnicities.
Pantelion Films will release a theatrical slate of eight to ten films per year and will also distribute a steady streamof films through ancillary platforms over the next five years. Of such films, four to five will be producedin-house each year, and others will be acquired. Pantelion Films’ current theatrical slate includes the followingtitles:
• From Prada To Nada—A whimsical fish-out-of-water story of two spoiled sisters whose lives arechanged forever when their father unexpectedly dies. Now penniless, Nora and Mary Dominguez movecross-town, but worlds away, to East LA and the home of their estranged Aunt Aurelia. Here theydiscover that when they embrace their cultural roots they are richer than ever before (released inJanuary 2011);
• No Eres Tu Soy Yo—A romantic comedy that tells the hilarious story of Javier, a man who refuses toaccept the loss of the woman he loves. In his journey to recovery, he rides an emotional rollercoasterthat eventually leads him to his true love (released in April 2011);
• Go For It! —An inspirational drama follows Carmen, a young woman living in Chicago, whostruggles to overcome her fears and follow her dream to be a dancer (released in May 2011);
• Saving Private Perez — In this comedy, a ruthless Mexican crime lord undertakes the most dangerousmission of his life in order to redeem himself with the only authority figure he fears: his mother. Withthe help of his rag-tag gang of thugs, Julian Perez must travel to Iraq and ensure the safe homecomingof his younger brother, a private fighting for the US army (expected September 2011 release); and
• See If I Care— The story of a thirteen year old girl who decides to “play out” every teenage rebellioncliché in an effort to jumpstart herself into adulthood while her young mother does everything possibleto avoid growing up (expected calendar year 2011 release).
23

Tiger Gate. In April 2010, we announced that we had formed a partnership with SCG to operate and manageTiger Gate, an operator of pay television channels and an originator/distributor of action and horror televisionprogramming and films across Asia. Tiger Gate operates KIX, a world-class action channel, and Thrill, a thriller/suspense/horror movie channel, tailor-made for audiences in Asia. Thrill showcases high-end local Asian thrillerand horror films and hit television series and also leverages our vast stockpile of horror/thriller content, as well asother studio hits. KIX is a fast-paced, action-packed channel featuring a mix of blockbuster motion pictures, hittelevision series, cutting-edge reality series, action game shows, anime, extreme sports, mixed martial arts andfight events, and classic martial arts masterpieces, bringing together a broad spectrum of Asian content, as wellas international content with an Asian influence. Tiger Gate also operates a production business, focused oncontent in genres that complement its channels business. Tiger Gate’s strategy looks beyond linear televisionwith plans for additional content-based activities including live events and next generation media/distribution.Tiger Gate’s channels have launched in Indonesia, Hong Kong and Singapore, and are expected to launch in thePhilippines and other key Asian territories in 2011.
TV Guide Network. In January 2009, we acquired TV Guide Network, and sold a 49% interest to OEP inMay 2009. Committed to buzz-worthy, breakout programming and a rich, multi-platform viewing experience,TV Guide Network is seen in more than 80 million homes nationwide and online at TVGuide.com, a one-stopfan destination reaching more than 21 million unique users per month. TV Guide Network is home to seriesincluding Curb Your Enthusiasm, Weeds and Ugly Betty. The network also takes fans behind-the-scenes ofHollywood with original programming that delivers the latest news on entertainment and pop culture, as well aslive coverage of the industry’s biggest events such as the red carpet at the Academy Awards® and PrimetimeEmmy® Awards.
EPIX. In April 2008, we formed a joint venture with Viacom, Paramount Pictures, and MGM and created EPIX,a next-generation multiplatform premium entertainment channel, VOD, and online service. Launching withVerizon FiOS in October 2009 and with other distribution partners in subsequent months, EPIX boasts access tomore than 15,000 motion pictures spanning the vast libraries of the partner studios. EPIX delivers films fromParamount Pictures, Paramount Vantage, MTV Films and Nickelodeon Movies released theatrically on or afterJanuary 1, 2008 and MGM, United Artists and our titles released theatrically on or after January 1, 2009, whichis available exclusively to its subscribers. In August 2010, EPIX announced an agreement through which Netflixmembers can instantly watch an array of new releases and library titles from EPIX streamed over the internetfrom Netflix beginning September 1, 2010. To date, EPIX has concluded carriage agreements with eightdistributors, and is now available to consumers in over 30 million homes.
Break Media. In June 2007, we acquired an interest in Break Media, a leading creator, publisher, and distributorof digital entertainment content including video, editorial, and games. The company’s properties include one ofthe largest humor sites online, Break.com, as well as MadeMan, GameFront, HolyTaco, ScreenJunkies,CagePotato, AllLeftTurns, Chickipedia, and TuVez. Break Media’s creative lab is an in-house production studiocreating original videos that range from award-winning branded entertainment to celebrity-driven web shorts toviral one-offs, and represents hundreds of publishers as one of the largest video advertising networks online.According to comScore Video Metrix, the network operated the third largest video ad network in March 2011.
FEARnet. In October 2006, we formed FEARnet, a branded multiplatform programming and content serviceprovider of thriller-suspence and horror genre films and programming. FEARnet is a premier destination forhorror, thriller and suspense, and is a cutting-edge, multi-platform movie network available on linear, on demandand online, 24 hours per day, seven days per week. FEARnet has generated over 550 million on-demand moviesviews since inception, is the number one free movie VOD network, and is consistently one of the top genrewebsites. FEARnet launched its traditional cable channel in high definition on October 31, 2010 and is currentlyavailable on-demand or linear on AT&T U-Verse, Bresnan, Comcast, Cox Communications, Guadalupe ValleySystems, Insight Communications, Verizon FiOS and Time Warner Cable. According to Rentrak Corporation,FEARnet is the number one free VOD movie service, has been a top 10 VOD network for 49 consecutive monthsand has been named among “The 15 Best Websites for Movie Fans.”
24

Intellectual Property
We are currently using a number of trademarks including “LIONS GATE HOME ENTERTAINMENT,”“ARTISAN HOME ENTERTAINMENT,” “FAMILY HOME ENTERTAINMENT,” “DIRTY DANCING,”“THE BLAIR WITCH PROJECT,” “RESERVOIR DOGS” and “MAD MEN” in connection with our domestichome video distribution, “LIONS GATE FILMS,” “LGF FILMS,” “ARTISAN ENTERTAINMENT,”“TRIMARK PICTURES,” “GHOST HOUSE PICTURES,” “GRINDSTONE ENTERTAINMENT GROUP” and“MANDATE PICTURES” in connection with films distributed domestically and licensed internationally and“LIONS GATE TELEVISION,” “TRIMARK TELEVISION” and “DEBMAR/MERCURY” in connection withlicenses to free, pay and cable television.
The trademarks “LIONSGATE,” “LIONS GATE HOME ENTERTAINMENT,” “TV GUIDE,” “TV GUIDENETWORK,” “LIONS GATE SIGNATURE SERIES,” “ARTISAN ENTERTAINMENT,” “FAMILY HOMEENTERTAINMENT,” “TRIMARK PICTURES,” “DIRTY DANCING,” “THE BLAIR WITCH PROJECT,”“RESERVOIR DOGS,” “SAW” and “MAD MEN” among others, are registered with the U.S. Patent andTrademark Office. We regard our trademarks as valuable assets and believe that our trademarks are an importantfactor in marketing our products.
Copyright protection is a serious problem in the DVD and Blu-ray distribution industry because of the ease withwhich DVDs and Blu-ray discs may be duplicated. In the past, certain countries permitted video pirating to suchan extent that we did not consider these markets viable for distribution. Video piracy continues to be prevalentacross the entertainment industry. We and other video distributors have taken legal actions to enforce copyrightprotection when necessary.
We also hold various domain names relating to our trademarks and service marks including lionsgate.com andtvguide.com.
Competition
Television and motion picture production and distribution are highly competitive businesses. We facecompetition from companies within the entertainment business and from alternative forms of leisureentertainment, such as travel, sporting events, outdoor recreation, video games, the internet and other cultural andcomputer-related activities. We compete with the major studios, numerous independent motion picture andtelevision production companies, television networks and pay television systems for the acquisition of literaryand film properties, the services of performing artists, directors, producers and other creative and technicalpersonnel and production financing, all of which are essential to the success of our entertainment businesses. Inaddition, our motion pictures compete for audience acceptance and exhibition outlets with motion picturesproduced and distributed by other companies.
Likewise, our television product faces significant competition from independent distributors as well as majorstudios. As a result, the success of any of our motion pictures and television product is dependent not only on thequality and acceptance of a particular film or program, but also on the quality and acceptance of other competingmotion pictures or television programs released into the marketplace at or near the same time.
Legislative and Regulatory Actions
The satellite transmission, cable and telecommunications industries are subject to pervasive federal regulation,including Federal Communications Commission (“FCC”) licensing and other requirements. The industries arealso often subject to extensive regulation by local and state authorities. Although most cable andtelecommunication industry regulations do not apply directly to TV Guide Network, they affect programmingdistributors, a primary customer for its products and services. TV Guide Network monitors pending legislationand administrative proceedings to ascertain their relevance, analyze their impact and develop strategic directionrelating to regulatory trends and developments within the industry.
25

Employees
As of May 20, 2011, we had 486 full-time employees in our worldwide operations. We also utilize manyconsultants in the ordinary course of our business and hire additional employees on a project-by-project basis inconnection with the production of our motion pictures and television programming. We believe that ouremployee and labor relations are good.
Corporate History
We are a corporation organized under the laws of the Province of British Columbia, resulting from the merger ofLions Gate Entertainment Corp. and Beringer Gold Corp. on November 13, 1997. Beringer Gold Corp. wasincorporated under the Business Corporation Act (British Columbia) on May 26, 1986 as IMI Computer Corp.Lions Gate Entertainment Corp. was incorporated under the Canada Business Corporations Act using the name3369382 Canada Limited on April 28, 1997, amended its articles on July 3, 1997 to change its name to LionsGate Entertainment Corp., and on September 24, 1997, continued under the Business Corporation Act (BritishColumbia).
Financial Information About Segments and Foreign and Domestic Operations
Financial and other information by reporting segment and geographic area as of March 31, 2011 and 2010 andfor each of the three years in the period ended March 31, 2011 is set forth in Note 21 to our audited consolidatedfinancial statements.
Available Information
Our Annual Report on Form 10-K, Quarterly Reports on Form 10-Q, Current Reports on Form 8-K, proxystatements and amendments to those reports filed or furnished pursuant to Sections 13(a) and 15(d) of ExchangeAct, are available, free of charge, on our website at www.lionsgate.com as soon as reasonably practicable afterwe electronically file such material with, or furnish it to, the Securities and Exchange Commission (the “SEC”).The Company’s Disclosure Policy, Corporate Governance Guidelines, Standards for Director Independence,Code of Business Conduct and Ethics for Directors, Officers and Employees, Code of Ethics for Senior FinancialOfficers, Policy on Shareholder Communications, Related Person Transaction Policy, Charter of the AuditCommittee, Charter of the Compensation Committee and Charter of the Nominating and Corporate GovernanceCommittee and any amendments thereto are also available on the Company’s website, as well as in print to anystockholder who requests them. The information posted on our website is not incorporated into this AnnualReport on Form 10-K.
We are filing as exhibits to this Annual Report on Form 10-K certifications required pursuant to Section 302 ofthe Sarbanes-Oxley Act of 2002. We have also filed with the New York Stock Exchange (the “NYSE”) theannual certification of our Chief Executive Officer for fiscal 2011, confirming that we were in compliance withNYSE corporate governance listing standards.
The SEC maintains an internet site that contains reports, proxy and information statements and other informationregarding issuers that file electronically with the SEC at www.sec.gov. The public may read and copy anymaterials we file with the SEC at the SEC’s Public Reference Room at 100 F Street, NE, Washington, D.C.20549. The public may obtain information on the operation of the Public Reference Room by calling the SEC at1-800-SEC-0330.
26

ITEM 1A. RISK FACTORS
You should carefully consider the risks described below as well as other information included in, or incorporatedby reference into in this Form 10-K before making an investment decision. The following risks and uncertaintiescould materially adversely affect our business, results of operations and financial condition. The risks describedbelow are not the only ones facing the Company. Additional risks that we are not presently aware of or that wecurrently believe are immaterial may also impair our business operations.
We have had losses, and we cannot assure future profitability.
We have reported operating income for fiscal years 2007, 2010 and 2011 and operating losses for fiscal years2008 and 2009. We have reported net income for fiscal year 2007 and net losses for the fiscal years 2008, 2009,2010 and 2011. Our accumulated deficit was $514.2 million at March 31, 2011 and $560.4 million atDecember 31, 2010. We cannot assure you that we will operate profitably in future periods and, if we do not, wemay not be able to meet our debt service requirements, working capital requirements, capital expenditure plans,production slate, acquisition and releasing plans or other cash needs. Our inability to meet those needs couldhave a material adverse effect on our business, financial condition, operating results, liquidity and prospects.
We face substantial capital requirements and financial risks.
Our business requires a substantial investment of capital. The production, acquisition and distribution of motionpictures and television programs require a significant amount of capital. A significant amount of time may elapsebetween our expenditure of funds and the receipt of commercial revenues from or government contributions toour motion pictures or television programs. This time lapse requires us to fund a significant portion of our capitalrequirements from our senior secured credit facility, our revolving film credit facility entered into on October 6,2009, as amended effective December 31, 2009 and June 22, 2010 (the “Film Credit Facility”), and from otherfinancing sources. Although we intend to continue to reduce the risks of our production exposure throughfinancial contributions from broadcasters and distributors, tax credit programs, government and industryprograms, other studios and other sources, we cannot assure you that we will continue to implement successfullythese arrangements or that we will not be subject to substantial financial risks relating to the production,acquisition, completion and release of future motion pictures and television programs. In addition, if we increase(through internal growth or acquisition) our production slate or our production budgets, we may be required toincrease overhead and/or make larger up-front payments to talent and, consequently, bear greater financial risks.Any of the foregoing could have a material adverse effect on our business, financial condition, operating results,liquidity and prospects.
The costs of producing and marketing feature films have steadily increased and may further increase in thefuture, which may make it more difficult for a film to generate a profit or compete against other films. The costsof producing and marketing feature films have generally increased from year to year. These costs may continueto increase in the future, which may make it more difficult for our films to generate a profit or compete againstother films. Historically, production costs and marketing costs have risen at a higher rate than increases in eitherthe number of domestic admissions to movie theaters or admission ticket prices. A continuation of this trendwould leave us more dependent on other media, such as home video, television, international markets and newmedia for revenue, and the revenues from such sources may not be sufficient to offset an increase in the cost ofmotion picture production. If we cannot successfully exploit these other media, it could have a material adverseeffect on our business, financial condition, operating results, liquidity and prospects.
Budget overruns may adversely affect our business. Our business model requires that we be efficient in theproduction of our motion pictures and television programs. Actual motion picture and television production costsoften exceed their budgets, sometimes significantly. The production, completion and distribution of motionpictures and television productions are subject to a number of uncertainties, including delays and increasedexpenditures due to creative differences among key cast members and other key creative personnel or other
27

disruptions or events beyond our control. Risks such as death or disability of star performers, technicalcomplications with special effects or other aspects of production, shortages of necessary equipment, damage tofilm negatives, master tapes and recordings or adverse weather conditions may cause cost overruns and delay orfrustrate completion of a production. If a motion picture or television production incurs substantial budgetoverruns, we may have to seek additional financing from outside sources to complete production. We cannotmake assurances regarding the availability of such financing on terms acceptable to us, and the lack of suchfinancing could have a material adverse effect on our business, financial condition, operating results, liquidityand prospects.
In addition, if a motion picture or television production incurs substantial budget overruns, we cannot assure youthat we will recoup these costs, which could have a material adverse effect on our business, financial condition,operating results, liquidity and prospects. Increased costs incurred with respect to a particular film may result inany such film not being ready for release at the intended time and the postponement to a potentially lessfavorable time, all of which could cause a decline in box office performance, and, thus, the overall financialsuccess of such film. Budget overruns could also prevent a picture from being completed or released. Any of theforegoing could have a material adverse effect on our business, financial condition, operating results, liquidityand prospects.
We may not be able to generate sufficient cash to service all of our indebtedness, and we may be forced totake other actions to satisfy our obligations under our indebtedness, which may not be successful.
Our ability to make scheduled payments or to refinance our debt obligations depends on our financial andoperating performance, which is subject to prevailing economic and competitive conditions and to certainfinancial, business and other factors beyond our control. We cannot assure you that we will maintain a level ofcash flows from operating activities sufficient to permit us to pay the principal, premium, if any, and interest onour indebtedness.
If our cash flows and capital resources are insufficient to fund our debt service obligations, we may be forced toreduce or delay capital expenditures, sell assets or operations, seek additional capital or restructure or refinanceour indebtedness. We cannot assure you that we would be able to take any of these actions, that these actionswould be successful and permit us to meet our scheduled debt service obligations or that these actions would bepermitted under the terms of our existing or future debt agreements, including the senior secured credit facilityand the indenture governing our senior secured notes. In the absence of such cash flows or capital resources, wecould face substantial liquidity problems and might be required to dispose of material assets or operations tomeet our debt service and other obligations. Our senior secured credit facility and the indenture governing oursenior secured notes restrict our ability to dispose of assets and use the proceeds from such dispositions. We maynot be able to consummate those dispositions or to obtain the proceeds which we could realize from them andthese proceeds may not be adequate to meet any debt service obligations then due.
If we cannot make scheduled payments on our debt, we will be in default and, as a result:
• our debt holders could declare all outstanding principal and interest to be due and payable;
• the lenders under our senior secured credit facility could terminate their commitments to lend usmoney;
• the holders of our secured debt could foreclose against the assets securing their borrowings; and
• we could be forced into bankruptcy or liquidation.
28

Our level of indebtedness could adversely affect our ability to raise additional capital to fund ouroperations, require us to dedicate substantial capital to servicing our debt obligations, expose us to interestrate risk, limit our ability to pursue strategic business opportunities, react to changes in the economy orour industry and prevent us from meeting our debt obligations.
Historically, we have been highly leveraged and may be highly leveraged in the future. As of March 31, 2011,our consolidated total indebtedness was $713.6 million (carrying value — $674.8 million). Our substantialdegree of leverage could have important consequences, including the following:
• it may limit our ability to obtain additional debt or equity financing for working capital, capitalexpenditures, motion picture and television development, production and distribution, debt servicerequirements, acquisitions or general corporate or other purposes, or limit our ability to obtain suchfinancing on terms acceptable to us;
• a substantial portion of our cash flows from operations will be dedicated to the payment of principaland interest on our indebtedness and will not be available for other purposes, including funding motionpicture and television production, development and distribution and other operating expenses, capitalexpenditures and future business opportunities;
• the debt service requirements of our indebtedness could make it more difficult for us to satisfy ourfinancial obligations;
• certain of our borrowings, including borrowings under our senior secured credit facility, are at variablerates of interest, exposing us to the risk of increased interest rates;
• it may limit our ability to adjust to changing market conditions and place us at a competitivedisadvantage compared to our competitors that have less debt;
• it may limit our ability to pursue strategic acquisitions and other business opportunities that may be inour best interests; and
• we may be vulnerable to a downturn in general economic conditions or in our business, or
• we may be unable to carry out capital spending that is important to our growth.
Despite our current indebtedness levels we and our subsidiaries may incur additional debt in the future,which could further exacerbate the risks described above in the foregoing risk factors.
Despite our current indebtedness levels, we and our subsidiaries may be able to incur substantial additionalindebtedness in the future. Although each of our senior secured credit facility and the indenture governing oursenior secured notes contains covenants that, among other things, limit our ability to incur additionalindebtedness, including guarantees, make restricted payments and investments, and grant liens on our assets, thecovenants contained in such debt documents provide a number of important exceptions and thus do not prohibitus or our subsidiaries from doing so. Such exceptions will provide us substantial flexibility to incur indebtedness,grant liens and expend funds to operate our business. For example, under the terms of the indenture governingour senior secured notes (i) with few restrictions, we may incur indebtedness in connection with certain film andtelevision financing arrangements, including without limitation, purchasing or acquiring rights in film ortelevision productions or financing print and advertising expenses, and such indebtedness may be secured byliens senior to the liens in respect of our senior secured notes, and (ii) in limited circumstances, we may makeinvestments in assets that are not included in the borrowing base supporting our senior secured notes, in eachcase, without having to meet the leverage ratio tests for debt incurrence or to fit such investments within therestricted payments “build-up basket” or within other categories of funds applicable to making investments andother restricted payments under the indenture governing our senior secured notes.
In addition, we may incur additional indebtedness through our $340.0 million senior secured credit facility. AtMarch 31, 2011, we have borrowed approximately $69.8 million under our senior secured credit facility and have
29

approximately $15.0 million in letters of credit outstanding. We could borrow some or all of the remainingpermitted amount in the future. The amount we have available to borrow under this facility depends upon ourborrowing base, which in turn depends on the value of our existing library of films and television programs, aswell as accounts receivable and cash held in collateral accounts.
If new debt is added to our and our subsidiaries’ existing high debt levels, this has the potential to magnify therisks discussed above relating to our ability to service our indebtedness and the potential adverse impact our highlevel of indebtedness could have on us. See “—We may not be able to generate sufficient cash to service all ofour indebtedness, and we may be forced to take other actions to satisfy our obligations under our indebtedness,which may not be successful” and “—Our level of indebtedness could adversely affect our ability to raiseadditional capital to fund our operations, require us to dedicate substantial capital to servicing our debtobligations, expose us to interest rate risk, limit our ability to pursue strategic business opportunities, react tochanges in the economy or our industry and prevent us from meeting our debt obligations.”
An increase in the ownership of our common shares by certain shareholders could trigger a change incontrol under the agreements governing our long-term indebtedness.
The agreements governing certain of our long-term indebtedness contain change in control provisions that aretriggered when any of our shareholders, directly or indirectly, acquires ownership or control in excess of a certainpercentage of our common shares. As of May 20 2011, three of our shareholders, Carl C. Icahn, Mark H.Rachesky, M.D. and Capital Research Global Investors and their respective affiliates, beneficially ownedapproximately 32.7%, 29.4% and 9.2%, respectively, of our outstanding common shares.
Under certain circumstances, including the acquisition of ownership or control by a person or group in excess of50% of our common shares, the holders of our senior secured notes and our convertible senior subordinated notesmay require us to repurchase all or a portion of such notes upon a change in control and the holders of ourconvertible senior subordinated notes may be entitled to receive a make whole premium based on the price of ourcommon shares on the change in control date. We may not be able to repurchase these notes upon a change incontrol because we may not have sufficient funds. Further, we may be contractually restricted under the terms ofour senior secured credit facility and the Film Credit Facility, from repurchasing all of the notes tendered byholders upon a change in control. Our failure to repurchase our senior secured notes upon a change in controlwould cause a default under the indentures governing the senior secured notes and the convertible seniorsubordinated notes and a cross-default under the senior secured credit facility and the Film Credit Facility.
Our senior secured credit facility and the Film Credit Facility also provide that a change in control, whichincludes a person or group acquiring ownership or control in excess of 50% of our outstanding common shares,will be an event of default that permits lenders to accelerate the maturity of borrowings thereunder and to enforcesecurity interests in the collateral securing such debt, thereby limiting our ability to raise cash to purchase ouroutstanding senior secured note and convertible senior subordinated notes s. Any of our future debt agreementsmay contain similar provisions.
Restrictive covenants may adversely affect our operations.
Our senior secured credit facility and the indenture governing our senior secured notes contain various covenantsthat, subject to certain exceptions, limit our ability to, among other things:
• incur or assume additional debt or provide guarantees in respect of obligations of other persons;
• issue redeemable stock and preferred stock;
• pay dividends or distributions or redeem or repurchase capital stock;
• prepay, redeem or repurchase debt that is junior in right of payment to our senior secured notes;
• make loans, investments and capital expenditures;
30

• incur liens;
• engage in sale/leaseback transactions;
• restrict dividends, loans or asset transfers from our subsidiaries;
• sell or otherwise dispose of assets, including capital stock of subsidiaries;
• consolidate or merge with or into, or sell substantially all of our assets to, another person;
• enter into transactions with affiliates; and
• enter into new lines of business.
These covenants may prevent us from raising additional financing, competing effectively or taking advantage ofnew business opportunities. In addition, the restrictive covenants in our senior secured credit facility require us tomaintain specified financial ratios and satisfy other financial condition tests and the indenture governing oursenior secured notes, outside of specified exceptions, require us to satisfy certain financial tests in order toengage in activities such as incurring debt or making restricted payments. Our ability to comply with thesecovenants or meet those financial ratios and tests can be affected by events beyond our control (such as a changeof control event), and we cannot assure you that we will meet them. See “—An increase in the ownership of ourcommon shares by certain shareholders could trigger a change in control under the agreements governing ourlong-term indebtedness.”
Upon the occurrence of an event of default under our senior secured credit facility, the indenture governing oursenior secured notes or the agreements governing our other financing arrangements, the holders of such debtcould elect to declare all amounts outstanding to be immediately due and payable and the lenders under oursenior secured credit facility could terminate all commitments to extend further credit. Further, the holders of oursecured debt that is secured by a first-priority or other senior lien, could proceed against the collateral granted tothem to secure that indebtedness, which collateral represents substantially all of our assets. If the holders of ourdebt accelerate the repayment of borrowings, we cannot assure you that we will have sufficient cash flow orassets to repay our debt, or borrow sufficient funds to refinance such indebtedness. Even if we are able to obtainnew financing, it may not be on commercially reasonable terms, or terms that are acceptable to us.
Variable rate indebtedness subjects us to interest rate risk, which could cause our debt service obligationsto increase significantly.
Certain of our borrowings, primarily borrowings under our senior secured credit facility, are, and are expected tocontinue to be, at variable rates of interest and expose us to interest rate risk. If interest rates increase, our debtservice obligations on the variable rate indebtedness would increase even though the amount borrowed remainedthe same, and our net income would decrease. The applicable margin with respect to loans under the seniorsecured credit facility is a percentage per annum equal to 2.50% plus an adjusted rate based on LIBOR. Theapplicable margin with respect to loans under the Film Credit Facility is a percentage per annum equal to 3.25%over the “LIBO” rate (as defined in the Film Credit Facility). Assuming the senior secured credit facility and theFilm Credit Facility are fully drawn, based on the applicable LIBOR in effect as of March 31, 2011, each quarterpoint change in interest rates would result in a $0.9 million change in annual interest expense on the seniorsecured credit facility and $0.3 million change in annual interest expense on the Film Credit Facility. In thefuture, we may enter into interest rate swaps, involving the exchange of floating for fixed rate interest payments,to reduce interest rate volatility.
Our revenues and results of operations may fluctuate significantly.
Revenues and results of operations are difficult to predict and depend on a variety of factors. Our revenues andresults of operations depend significantly upon the commercial success of the motion pictures and televisionprogramming that we distribute, which cannot be predicted with certainty. Accordingly, our revenues and results
31

of operations may fluctuate significantly from period to period, and the results of any one period may not beindicative of the results for any future periods. Furthermore, largely as a result of these predictive difficulties,among other things, we may not be able to achieve our projected earnings. We have, in the past, revised ourprojected earnings downward. Future revisions to projected earnings could cause investors to lose confidence inus, which in turn could materially and adversely affect our business, our financial condition and the market valueof our securities.
In addition, our revenues and results of operations may be impacted by the success of critically acclaimed andaward winning films, including Academy Award® winners and nominees. We cannot assure you that we willmanage the production, acquisition and distribution of future motion pictures as successfully as we have donewith these recent critically acclaimed, award winning and/or commercially popular films or that we will produceor acquire motion pictures that will receive similar critical acclaim or perform as well commercially. Anyinability to achieve such commercial success could have a material adverse effect on our business, financialcondition, operating results, liquidity and prospects.
We have few output agreements with cable and broadcast channels. In February 2009, we acquired certain assetsrelated to the business of TV Guide Network. Also, certain broadcast channels, including TV Guide Network,exhibit our films, but they license such rights on a film-by-film, rather than an output basis. In April 2008, weformed EPIX, a premium television channel and VOD service, for our theatrical releases after January 1, 2009.EPIX, which launched in October 2009, provides us with an additional platform to distribute our library ofmotion picture titles and television episodes and programs. To date, EPIX has concluded carriage agreementswith eight distributors, including with Verizon FiOS, Cox Communications, Charter Communications, Inc.,Mediacom Communications, the National Cable, Telecommunications Cooperative, DISH Network L.L.C., andSuddenlink Communications, and, in August 2010, with Netflix. We cannot assure you that EPIX will enter intoadditional carriage agreements or that it will be successful altogether. We also cannot assure you that we will beable to secure other output agreements on acceptable terms, if at all. Without multiple output agreements thattypically contain guaranteed minimum payments, our revenues may be subject to greater volatility, which couldhave a material adverse effect on our business, financial condition, operating results, liquidity and prospects.
We do not have long-term arrangements with many of our production partners. We typically do not enter intolong-term distribution contracts with the creative producers of the films we produce, acquire or distribute. Forexample, we have a “first-look” arrangement with Tyler Perry that gives us a right to negotiate for the purchaseof distribution rights to films if certain criteria are met. However, even if we negotiate for such purchase, thisdoes not guarantee that we will obtain such distribution rights. Further, we have an agreement with the creatorsof the Saw franchise that gives us the right to compel production through Saw IX under certain contractualconditions and, thereafter, the right to “opt in” under certain economic terms for future Saw films if our partnerelects to produce such pictures. Moreover, we generally have certain derivative rights that provide us withdistribution rights to, for example, prequels, sequels and remakes of certain films we produce, acquire ordistribute. However, there is no guarantee that we will produce, acquire or distribute future films by any creativeproducer, and a failure to do so could adversely affect our business, financial condition, operating results,liquidity and prospects.
We rely on a few major retailers and distributors for a material portion of our business and the loss of any ofthose retailers or distributors could reduce our revenues and operating results. Wal-Mart representedapproximately 13% of our revenues in fiscal 2011. In addition, a small number of other retailers and distributorsaccount for a significant percentage of our revenues. We do not have long-term agreements with retailers. Wecannot assure you that we will continue to maintain favorable relationships with our retailers and distributors orthat they will not be adversely affected by economic conditions. If any of these retailers or distributors reduces orcancels a significant order, it could have a material adverse effect on our business, financial condition, operatingresults, liquidity and prospects.
32

Our revenues and results of operations are vulnerable to currency fluctuations. We report our revenues andresults of operations in U.S. dollars, but a significant portion of our revenues is earned outside of the U.S. Ourprincipal currency exposure is between Canadian dollars, pounds sterling and U.S. dollars. We cannot accuratelypredict the impact of future exchange rate fluctuations on revenues and operating margins, and fluctuations couldhave a material adverse effect on our business, financial condition, operating results, liquidity and prospects.From time to time, we may experience currency exposure on distribution and production revenues and expensesfrom foreign countries, which could have a material adverse effect on our business, financial condition, operatingresults, liquidity and prospects.
Accounting practices used in our industry may accentuate fluctuations in operating results. In addition to thecyclical nature of the entertainment industry, our accounting practices (which are standard for the industry) mayaccentuate fluctuations in our operating results. In accordance with U.S. generally accepted accounting principles(“GAAP”), we amortize film and television programming costs using the “individual-film-forecast” method.Under this accounting method, we amortize film and television programming costs for each film or televisionprogram based on the following ratio:
Revenue earned by title in the current periodEstimated total future revenues by title as of the beginning of the year
We regularly review, and revise when necessary, our total revenue estimates on a title-by-title basis. This reviewmay result in a change in the rate of amortization and/or a write-down of the film or television asset to itsestimated fair value. Results of operations in future years depend upon our amortization of our film andtelevision costs. Periodic adjustments in amortization rates may significantly affect these results. In addition, weare required to expense film advertising costs as incurred, but are also required to recognize the revenue from anymotion picture or television program over the entire revenue stream expected to be generated by the individualpicture or television program. Accordingly, our revenues and results of operations may fluctuate significantlyfrom period to period, and the results of any one period may not be indicative of the results for any future period.
Failure to manage future growth may adversely affect our business.
We are subject to risks associated with possible acquisitions, business combinations, or joint ventures. From timeto time, we engage in discussions and activities with respect to possible acquisitions, sale of assets, businesscombinations, or joint ventures intended to complement or expand our business, some of which may besignificant transactions for us. For instance, in July 2010, we formed Pantelion Films, in April 2010, we formedTiger Gate, in February 2009, we acquired TV Guide Network and related assets, and in April 2008, we formedEPIX. We may not realize the anticipated benefit from any of the transactions we pursue. Regardless of whetherwe consummate any such transaction, the negotiation of a potential transaction (including associated litigationand proxy contests), as well as the integration of the acquired business, could require us to incur significant costsand cause diversion of management’s time and resources. Any such transaction could also result in impairmentof goodwill and other intangibles, development write-offs and other related expenses. Any of the foregoing couldhave a material adverse effect on our business, financial condition, operating results, liquidity and prospects.
We may be unable to integrate any business that we acquire or have acquired or with which we combine or havecombined. Integrating any business that we acquire or have acquired or with which we combine or havecombined is distracting to our management and disruptive to our business and may result in significant costs tous. We could face challenges in consolidating functions and integrating procedures, information technology andaccounting systems, personnel and operations in a timely and efficient manner. If any such integration isunsuccessful, or if the integration takes longer than anticipated, there could be a material adverse effect on ourbusiness, financial condition, operating results, liquidity and prospects. We may have difficulty managing thecombined entity in the short term if we experience a significant loss of management personnel during thetransition period after the significant acquisition.
33

Claims against us relating to any acquisition or business combination may necessitate our seeking claims againstthe seller for which the seller may not indemnify us or that may exceed the seller’s indemnification obligations.There may be liabilities assumed in any acquisition or business combination that we did not discover or that weunderestimated in the course of performing our due diligence investigation. Although a seller generally will haveindemnification obligations to us under an acquisition or merger agreement, these obligations usually will besubject to financial limitations, such as general deductibles and maximum recovery amounts, as well as timelimitations. We cannot assure you that our right to indemnification from any seller will be enforceable,collectible or sufficient in amount, scope or duration to fully offset the amount of any undiscovered orunderestimated liabilities that we may incur. Any such liabilities, individually or in the aggregate, could have amaterial adverse effect on our business, financial condition, operating results, liquidity and prospects.
We may not be able to obtain additional funding to meet our requirements. Our ability to grow throughacquisitions, business combinations and joint ventures, to maintain and expand our development, production anddistribution of motion pictures and television programs, and to fund our operating expenses depends upon ourability to obtain funds through equity financing, debt financing (including credit facilities) or the sale orsyndication of some or all of our interests in certain projects or other assets or businesses. If we do not haveaccess to such financing arrangements, and if other funds do not become available on terms acceptable to us,there could be a material adverse effect on our business, financial condition, operating results, liquidity andprospects.
Our dispositions may not aid our future growth. If we determine to sell individual properties, libraries or otherassets or businesses, we will benefit from the net proceeds realized from such sales. However, our revenues maysuffer in the long term due to the disposition of a revenue-generating asset, which may diminish our ability toservice our indebtedness and repay our notes and our other indebtedness at maturity. In addition, the timing ofsuch dispositions may be poor, causing us to fail to realize the full value of the disposed asset, which also maydiminish our ability to service our indebtedness and repay our notes and our other indebtedness at maturity.Furthermore, our goal of building a diversified platform for future growth may be inhibited if the disposed assetcontributed in a significant way to the diversification of our business platform.
A significant portion of our filmed and television content library revenues comes from a small number oftitles.
We depend on a limited number of titles in any given fiscal quarter for the majority of the revenues generated byour filmed and television content library. In addition, many of the titles in our library are not presently distributedand generate substantially no revenue. If we cannot acquire new product and the rights to popular titles throughproduction, distribution agreements, acquisitions, mergers, joint ventures or other strategic alliances, it couldhave a material adverse effect on our business, financial condition, operating results, liquidity and prospects.
We are limited in our ability to exploit a portion of our filmed and television content library.
Our rights to the titles in our filmed and television content library vary; in some cases, we have only the right todistribute titles in certain media and territories for a limited term. We cannot assure you that we will be able torenew expiring rights on acceptable terms and that any failure to renew titles generating a significant portion ofour revenue would not have a material adverse effect on our business, financial condition, operating results,liquidity and prospects.
Our success depends on external factors in the motion picture and television industry.
Our success depends on the commercial success of motion pictures and television programs, which isunpredictable. Operating in the motion picture and television industry involves a substantial degree of risk. Eachmotion picture and television program is an individual artistic work, and inherently unpredictable audiencereactions primarily determine commercial success. Generally, the popularity of our motion pictures or programs
34

depends on many factors, including the critical acclaim they receive, the format of their initial release, forexample, theatrical or direct-to-video, the actors and other key talent, their genre and their specific subject matter.The commercial success of our motion pictures or television programs also depends upon the quality andacceptance of motion pictures or programs that our competitors release into the marketplace at or near the sametime, critical reviews, the availability of alternative forms of entertainment and leisure activities, generaleconomic conditions and other tangible and intangible factors, many of which we do not control and all of whichmay change. We cannot predict the future effects of these factors with certainty, any of which could have amaterial adverse effect on our business, financial condition, operating results, liquidity and prospects.
In addition, because a motion picture’s or television program’s performance in ancillary markets, such as homevideo and pay and free television, is often directly related to its box office performance or television ratings, poorbox office results or poor television ratings may negatively affect future revenue streams. Our success willdepend on the experience and judgment of our management to select and develop new investment and productionopportunities. We cannot make assurances that our motion pictures and television programs will obtain favorablereviews or ratings, that our motion pictures will perform well at the box office or in ancillary markets or thatbroadcasters will license the rights to broadcast any of our television programs in development or renew licensesto broadcast programs in our library. The failure to achieve any of the foregoing could have a material adverseeffect on our business, financial condition, operating results, liquidity and prospects.
Global economic turmoil and regional economic conditions in the U.S. could adversely affect our business. Theglobal economic turmoil of recent years has caused a general tightening in the credit markets, lower levels ofliquidity, increases in the rates of default and bankruptcy, an unprecedented level of intervention from the U.S.federal government and other foreign governments, decreased consumer confidence, overall slower economicactivity and extreme volatility in credit, equity and fixed income markets. While the ultimate outcome of theseevents cannot be predicted, a decrease in economic activity in the U.S. or in other regions of the world in whichwe do business could adversely affect demand for our films, thus reducing our revenue and earnings. A decline ineconomic conditions could reduce performance of our theatrical, television and home entertainment releases. Inaddition, an increase in price levels generally, could result in a shift in consumer demand away from theentertainment we offer, which could also adversely affect our revenues and, at the same time, increase our costs.Moreover, financial institution failures may cause us to incur increased expenses or make it more difficult eitherto utilize our existing debt capacity or otherwise obtain financing for our operations, investing activities(including the financing of any future acquisitions), or financing activities. We cannot predict the timing or theduration of this or any other downturn in the economy and we are not immune to the effects of generalworldwide economic conditions.
Licensed distributors’ failure to promote our programs may adversely affect our business. Licensed distributors’decisions regarding the timing of release and promotional support of our motion pictures, television programsand related products are important in determining the success of these pictures, programs and products. We donot control the timing and manner in which our licensed distributors distribute our motion pictures or televisionprograms. Any decision by those distributors not to distribute or promote one of our motion pictures, televisionprograms or related products or to promote our competitors’ motion pictures, television programs or relatedproducts to a greater extent than they promote ours could have a material adverse effect on our business,financial condition, operating results, liquidity and prospects.
We could be adversely affected by strikes or other union job actions. We are directly or indirectly dependentupon highly specialized union members who are essential to the production of motion pictures and televisionprograms. A strike by, or a lockout of, one or more of the unions that provide personnel essential to theproduction of motion pictures or television programs could delay or halt our ongoing production activities. Sucha halt or delay, depending on the length of time, could cause a delay or interruption in our release of new motionpictures and television programs, which could have a material adverse effect on our business, financial condition,operating results, liquidity and prospects.
35

We face substantial competition in all aspects of our business.
We are smaller and less diversified than many of our competitors. As an independent distributor and producer,we constantly compete with major U.S. and international studios. Most of the major U.S. studios are part of largediversified corporate groups with a variety of other operations, including television networks and cable channelsthat can provide both the means of distributing their products and stable sources of earnings that may allow thembetter to offset fluctuations in the financial performance of their motion picture and television operations. Inaddition, the major studios have more resources with which to compete for ideas, storylines and scripts createdby third parties as well as for actors, directors and other personnel required for production. The resources of themajor studios may also give them an advantage in acquiring other businesses or assets, including film libraries,that we might also be interested in acquiring. Additionally, TV Guide Network faces competition from otherentertainment sources. TV Guide Network competes with general entertainment channels for televisionviewership and carriage on cable and satellite systems. TV Guide Online competes for visitors with generalentertainment websites and online search providers, including sites that provide television listings, television-specific information and/or that enable users to locate and view video on the internet. Moreover, each of TVGuide Network and TV Guide Online competes for marketers’ advertising spending with other media outlets.Our inability to compete successfully could have a material adverse effect on our business, financial condition,operating results, liquidity and prospects.
The motion picture industry is highly competitive and at times may create an oversupply of motion pictures in themarket. The number of motion pictures released by our competitors, particularly the major studios, may create anoversupply of product in the market, reduce our share of box office receipts and make it more difficult for ourfilms to succeed commercially. Oversupply may become most pronounced during peak release times, such asschool holidays and national holidays, when theater attendance is expected to be highest. For this reason, andbecause of our more limited production and advertising budgets, we typically do not release our films duringpeak release times, which may also reduce our potential revenues for a particular release. Moreover, we cannotguarantee that we can release all of our films when they are otherwise scheduled. In addition to production orother delays that might cause us to alter our release schedule, a change in the schedule of a major studio mayforce us to alter the release date of a film because we cannot always compete with a major studio’s largerpromotion campaign. Any such change could adversely impact a film’s financial performance. In addition, if wecannot change our schedule after such a change by a major studio because we are too close to the release date,the major studio’s release and its typically larger promotion budget may adversely impact the financialperformance of our film. The foregoing could have a material adverse effect on our business, financial condition,operating results, liquidity and prospects.
The limited supply of motion picture screens compounds this product oversupply problem. Currently, asubstantial majority of the motion picture screens in the U.S. typically are committed at any one time toapproximately 10 to 15 films distributed nationally by major studio distributors. In addition, as a result ofchanges in the theatrical exhibition industry, including reorganizations and consolidations and the fact that majorstudio releases occupy more screens, the number of screens available to us when we want to release a picturemay decrease. If the number of motion picture screens decreases, box office receipts, and the correlating futurerevenue streams, such as from home video and pay and free television, of our motion pictures may also decrease,which could have a material adverse effect on our business, financial condition, operating results, liquidity andprospects.
We must successfully respond to rapid technological changes and alternative forms of delivery or storage toremain competitive.
The entertainment industry in general and the motion picture and television industries in particular continue toundergo significant technological developments. Advances in technologies or new methods of product deliveryor storage or certain changes in consumer behavior driven by these or other technologies and methods of deliveryand storage could have a negative effect on our business. For example, the industry has been experiencing a
36

decline in DVD sales both domestically and internationally as a result of several factors, including advances intechnologies and new methods of product delivery and storage. Examples of such advances in technologiesinclude VOD, new video formats, including release of titles in high-definition Blu-ray format, and downloadingand streaming from the internet. An increase in VOD could decrease home video rentals and DVD sales. Inaddition, technologies that enable users to fast-forward or skip advertisements, such as digital video recorders,may cause changes in consumer behavior that could affect the attractiveness of our products to advertisers, andcould therefore adversely affect our revenues. Similarly, further increases in the use of portable digital devicesthat allow users to view content of their own choosing while avoiding traditional commercial advertisementscould adversely affect our revenues. Other larger entertainment distribution companies will have larger budgetsto exploit these growing trends. We cannot predict how we will financially participate in the exploitation of ourmotion pictures and television programs through these emerging technologies, or whether we have the right to doso for certain of our library titles or whether the revenues we generate through these emerging technologies willoffset any future decline in DVD sales. If we cannot successfully exploit these and other emerging technologies,it could have a material adverse effect on our business, financial condition, operating results, liquidity andprospects.
If TV Guide Network experiences a decline in the distribution of its network or its viewership ratings or itsaffiliation agreements are terminated or not renewed, its operating results may be materially adverselyaffected.
Revenues at TV Guide Network consist of affiliate fees and advertising revenues; however since the majority ofTV Guide Network’s affiliates are contracted under long-term agreements with only cost-of-living increasesavailable under certain contracts, we do not expect significant growth in affiliate revenues in the future.Accordingly, the results at TV Guide Network are highly dependent upon advertising revenue. Advertising salesare primarily dependent on the extent of distribution of the network, viewership ratings, and the strength of themarket for advertising. TV Guide Network’s viewers primarily come from analog cable homes where scroll datais still used for guidance. As multi system operators reclaim analog bandwidth to launch more digital servicesand government regulations change resulting in less bandwidth for programming services such as TV GuideNetwork, there may be a decline in the distribution of the analog TV Guide Network and its viewership ratings,which could adversely affect advertising sales. Affiliate fees are dependent on TV Guide Network’s affiliationagreements with cable and satellite operators which in turn distribute it to consumers. These agreementsgenerally provide for the level of carriage that TV Guide Network will receive and for payment of a license fee toTV Guide Network based on the numbers of subscribers that receive the network. If TV Guide Network is unableto renew these affiliation agreements or renew them on terms that are as favorable as those in effect, or ifconsolidation of the cable and satellite broadcasting industry results in the termination of some of theseaffiliation agreements, TV Guide Network may experience a decline in affiliate fees. If TV Guide Networkexperiences a decline in advertising sales or affiliate fees, this may have a material adverse effect on its operatingresults and our share of TV Guide Network’s operating results.
Limitations on control of joint ventures may adversely impact our operations.
We hold our interests in certain businesses as a joint venture or in partnership with non-affiliated third parties. Asa result of such arrangements, we may be unable to control the operations, strategies and financial decisions ofsuch joint venture or partnership entities which could in turn result in limitations on our ability to implementstrategies that we may favor. In addition, our ability to transfer our interests in businesses owned with thirdparties is limited under certain joint venture, partnership or similar agreements.
We face risks from doing business internationally.
We distribute motion picture and television productions outside the U.S., in the U.K. and Ireland throughLionsgate UK, and through third party licensees elsewhere, and derive revenues from these sources. As a result,
37

our business is subject to certain risks inherent in international business, many of which are beyond our control.These risks include:
• laws and policies affecting trade, investment and taxes, including laws and policies relating to therepatriation of funds and withholding taxes, and changes in these laws;
• changes in local regulatory requirements, including restrictions on content;
• differing cultural tastes and attitudes;
• differing degrees of protection for intellectual property;
• financial instability and increased market concentration of buyers in foreign television markets,including in European pay television markets;
• the instability of foreign economies and governments;
• fluctuating foreign exchange rates;
• the spread of communicable diseases in such jurisdictions, which may impact business in suchjurisdictions; and
• war and acts of terrorism.
Events or developments related to these and other risks associated with international trade could adversely affectour revenues from non-U.S. sources, which could have a material adverse effect on our business, financialcondition, operating results, liquidity and prospects.
Protecting and defending against intellectual property claims may have a material adverse effect on ourbusiness.
Our ability to compete depends, in part, upon successful protection of our intellectual property. We do not havethe financial resources to protect our rights to the same extent as major studios. We attempt to protect proprietaryand intellectual property rights to our productions through available copyright and trademark laws and licensingand distribution arrangements with reputable international companies in specific territories and media for limiteddurations. Despite these precautions, existing copyright and trademark laws afford only limited practicalprotection in certain countries. We also distribute our products in other countries in which there is no copyrightor trademark protection. As a result, it may be possible for unauthorized third parties to copy and distribute ourproductions or certain portions or applications of our intended productions, which could have a material adverseeffect on our business, financial condition, operating results, liquidity and prospects.
Litigation may also be necessary in the future to enforce our intellectual property rights, to protect our tradesecrets, or to determine the validity and scope of the proprietary rights of others or to defend against claims ofinfringement or invalidity. Any such litigation could result in substantial costs and the diversion of resources andcould have a material adverse effect on our business, financial condition, operating results, liquidity andprospects. We cannot assure you that infringement or invalidity claims will not materially adversely affect ourbusiness, financial condition, operating results, liquidity and prospects. Regardless of the validity or the successof the assertion of these claims, we could incur significant costs and diversion of resources in enforcing ourintellectual property rights or in defending against such claims, which could have a material adverse effect on ourbusiness, financial condition, operating results, liquidity and prospects.
Others may assert intellectual property infringement claims against us.
One of the risks of the film production business is the possibility that others may claim that our productions andproduction techniques misappropriate or infringe the intellectual property rights of third parties with respect totheir previously developed films, stories, characters, other entertainment or intellectual property. We are likely toreceive in the future claims of infringement or misappropriation of other parties’ proprietary rights. Any suchassertions or claims may materially adversely affect our business, financial condition, operating results, liquidityand prospects. Irrespective of the validity or the successful assertion of such claims, we could incur significant
38

costs and diversion of resources in defending against them, which could have a material adverse effect on ourbusiness, financial condition, operating results, liquidity and prospects. If any claims or actions are assertedagainst us, we may seek to settle such claim by obtaining a license from the plaintiff covering the disputedintellectual property rights. We cannot provide any assurances, however, that under such circumstances a license,or any other form of settlement, would be available on reasonable terms or at all.
Our business involves risks of liability claims for media content, which could adversely affect our business,results of operations and financial condition.
As a distributor of media content, we may face potential liability for:
• defamation;
• invasion of privacy;
• negligence;
• copyright or trademark infringement (as discussed above); and
• other claims based on the nature and content of the materials distributed.
These types of claims have been brought, sometimes successfully, against producers and distributors of mediacontent. Any imposition of liability that is not covered by insurance or is in excess of insurance coverage couldhave a material adverse effect on our business, financial condition, operating results, liquidity and prospects.
Piracy of motion pictures, including digital and internet piracy, may reduce the gross receipts from theexploitation of our films.
Motion picture piracy is extensive in many parts of the world, including South America, Asia, and formerEastern bloc countries, and is made easier by technological advances and the conversion of motion pictures intodigital formats. This trend facilitates the creation, transmission and sharing of high quality unauthorized copies ofmotion pictures in theatrical release on DVDs, Blu-ray discs, from pay-per-view through set top boxes and otherdevices and through unlicensed broadcasts on free television and the internet. The proliferation of unauthorizedcopies of these products has had and will likely continue to have an adverse effect on our business, because theseproducts reduce the revenue we receive from our products. Additionally, in order to contain this problem, wemay have to implement elaborate and costly security and anti-piracy measures, which could result in significantexpenses and losses of revenue. We cannot assure you that even the highest levels of security and anti-piracymeasures will prevent piracy.
In particular, unauthorized copying and piracy are prevalent in countries outside of the U.S., Canada and WesternEurope, whose legal systems may make it difficult for us to enforce our intellectual property rights. While theU.S. government has publicly considered implementing trade sanctions against specific countries that, in itsopinion, do not make appropriate efforts to prevent copyright infringements of U.S. produced motion pictures,there can be no assurance that any such sanctions will be enacted or, if enacted, will be effective. In addition, ifenacted, such sanctions could impact the amount of revenue that we realize from the international exploitation ofmotion pictures. If no embargoes or sanctions are enacted, or if other measures are not taken, we may loserevenue as a result of motion picture piracy.
An investment by non-Canadians in our business is potentially reviewable under the ICA, which couldadversely affect our results.
The Investment Canada Act (the “ICA”) is administered by the Minister of Industry of Canada and, in the case ofinvestments in a Canadian business that is a “cultural business”, by the Minister of Canadian Heritage (bothreferred to herein as the “Minister”). A “cultural business” is a business activity relating to Canada’s culturalheritage or national identity and includes a business engaged in the production, distribution, sale or exhibition offilm or video products.
39

The ICA contains rules, the application of which determines whether an entity (as the term is defined in the ICA)is Canadian-controlled and whether it carries on a Canadian business, including a Canadian business that is acultural business. An entity that we consolidate operates a Canadian business that is a cultural business for thepurposes of the ICA. Under the ICA, the Minister has discretion to determine, after considering any informationor evidence submitted by the entity or otherwise made available to the Minister or to the Director of Investmentsappointed under the ICA (the “Director of Investments”), that an investment by a non-Canadian in a Canadianbusiness that is a cultural business may constitute an acquisition of control by that non-Canadian,notwithstanding the provisions in the ICA that state that certain investments do not or may not constitute anacquisition of control that would require notification or review under the ICA.
If the Minister exercises such discretion and deems an investment by a non-Canadian in a cultural business to bean acquisition of control, the investment is potentially subject to notification and/or review. If the investment issubject to review, the Minister must be satisfied that the investment is likely to be of net benefit to Canada. Sucha determination is often accompanied by requests that the non-Canadian provide undertakings supportive ofCanadian cultural policy. These undertakings may, in some circumstances, include a request for financial supportof certain initiatives. The determination by the Minister of whether a proposed investment is of net benefit toCanada also includes consideration of sector specific policies of the Canadian federal government, some ofwhich restrict or prohibit investments by non-Canadians in certain types of Canadian cultural businesses,including certain types of businesses in the Canadian film industry.
An acquisition of control may also arise under the ICA if a non-Canadian acquires all or substantially all of theassets used in carrying on a Canadian business, although there is an exemption from the ICA if the acquisition ofcontrol is in connection with the realization of security granted for a loan or other financial assistance. However,a subsequent disposition following such realization of security may be subject to the ICA.
Although we believe we are currently a Canadian-controlled entity under the ICA, there can be no assurance thatthe Minister will not determine that we are not a Canadian-controlled entity under the ICA, or that events beyondour control will not result in our ceasing to be Canadian-controlled pursuant to the ICA. There are currently notransfer restrictions on our common shares as a class, and we accordingly may not be able to prevent anacquisition of control by non-Canadians. In addition, the ICA provides the Minister with discretion to make adetermination that an entity engaged in a cultural business is not a Canadian-controlled entity, if the Minister issatisfied, after considering any information or evidence submitted by the entity or otherwise made available tothe Minister or the Director of Investments, that the entity is controlled in fact by one or more non-Canadians.The assessment of control in fact may take into account many considerations, including the extent ofnon-Canadians’ financing and rights or conditions associated with such financing. If we cease to be Canadian-controlled under the ICA, we and the entities that we consolidate, may no longer qualify for or be entitled toaccess refundable tax credits and other Canadian government and private motion picture industry incentives thatare restricted to Canadian-controlled corporations. Such a change in status could also cause us or the entities thatwe consolidate to be required to repay certain tax credits and other government incentives previously receivedand default on certain distribution obligations, thereby affecting our financial results since we are required toconsolidate the results of operations in our financial statements.
Our success depends on certain key employees.
Our success depends to a significant extent on the performance of a number of senior management personnel andother key employees, including production and creative personnel. We do not currently have significant “keyperson” life insurance policies for any of our employees. We have entered into employment agreements with ourtop executive officers and production executives. However, although it is standard in the motion picture industryto rely on employment agreements as a method of retaining the services of key employees, these agreementscannot assure us of the continued services of such employees. In addition, competition for the limited number ofbusiness, production and creative personnel necessary to create and distribute our entertainment content isintense and may grow in the future. Our inability to retain or successfully replace where necessary members of
40

our senior management and other key employees could have a material adverse effect on our business, financialcondition, operating results, liquidity and prospects.
To be successful, we need to attract and retain qualified personnel.
Our success continues to depend to a significant extent on our ability to identify, attract, hire, train and retainqualified professional, creative, technical and managerial personnel. Competition for the caliber of talent requiredto produce our motion pictures and television programs continues to increase. We cannot assure you that we willbe successful in identifying, attracting, hiring, training and retaining such personnel in the future. If we wereunable to hire, assimilate and retain qualified personnel in the future, such inability would have a materialadverse effect on our business, financial condition, operating results, liquidity and prospects.
While we believe we currently have adequate internal control over financial reporting, we are required toassess our internal control over financial reporting on an annual basis and any future adverse results fromsuch assessment could result in a loss of investor confidence in our financial reports and have an adverseeffect on our securities.
Section 404 of the Sarbanes-Oxley Act of 2002 and the accompanying rules and regulations promulgated by theSEC to implement it require us to include in our Annual Report on Form 10-K an annual report by ourmanagement regarding the effectiveness of our internal control over financial reporting. The report includes,among other things, an assessment of the effectiveness of our internal control over financial reporting as of theend of our fiscal year. This assessment must include disclosure of any material weaknesses in our internal controlover financial reporting identified by management. During this process, if our management identifies one ormore material weaknesses in our internal control over financial reporting that cannot be remediated in a timelymanner, we will be unable to assert such internal control is effective. While we currently believe our internalcontrol over financial reporting is effective, the effectiveness of our internal controls in future periods is subjectto the risk that our controls may become inadequate because of changes in conditions, and, as a result, the degreeof compliance of our internal control over financial reporting with the applicable policies or procedures maydeteriorate. If we are unable to conclude that our internal control over financial reporting is effective (or if ourindependent auditors disagree with our conclusion), we could lose investor confidence in the accuracy andcompleteness of our financial reports, which would have an adverse effect on our securities.
Changes in, or interpretations of, tax rules and regulations, and changes in geographic operating results, mayadversely affect our effective tax rates.
We are subject to income taxes in the U.S. and foreign tax jurisdictions. Our future effective tax rates could beaffected by changes in tax laws or the interpretation of tax laws, by changes in the amount of revenue or earningsthat we derive from international sources in countries with high or low statutory tax rates, or by changes in thevaluation of our deferred tax assets and liabilities. Unanticipated changes in our tax rates could affect our futureresults of operations.
In addition, we may be subject to examination of our income tax returns by federal, state, and foreign taxjurisdictions. We regularly assess the likelihood of outcomes resulting from possible examinations to determinethe adequacy of our provision for income taxes. In making such assessments, we exercise judgment in estimatingour provision for income taxes. While we believe our estimates are reasonable, we cannot assure you that finaldeterminations from any examinations will not be materially different from that reflected in our historical incometax provisions and accruals. Any adverse outcome from any examinations may have an adverse effect on ourbusiness and operating results, which could cause the market price of our securities to decline.
We incur costs and demands upon management as a result of complying with the laws and regulationsaffecting public companies, which could affect our operating results.
We have incurred, and will continue to incur, significant legal, accounting and other expenses associated withcorporate governance and public company reporting requirements, including requirements under the Sarbanes-Oxley Act of 2002, as well as rules implemented by the SEC and the NYSE. As long as the SEC requires the
41

current level of compliance for public companies of our size, we expect these rules and regulations to requiresignificant legal and financial compliance costs and to make some activities time-consuming and costly. Theserules and regulations may make it more expensive for us to obtain director and officer liability insurance, and wemay be required to accept reduced policy limits and coverage or incur substantially higher costs to obtain thesame or similar coverage than was previously available. As a result, it may be more difficult for us to attract andretain qualified individuals to serve on our Board of Directors or as our executive officers.
Certain shareholders own a majority of our outstanding common shares.
As of May 20, 2011, three of our shareholders beneficially owned an aggregate of 97,562,201 of our commonshares, or approximately 71.3% of the outstanding shares. In addition, one of these shareholders, Mark H.Rachesky, M.D., the beneficial owner of approximately 29.4% of our outstanding common shares, currentlyserves on our Board of Directors. Accordingly, these three shareholders, collectively, have the power to exercisesubstantial influence over us and on matters requiring approval by our shareholders, including the election ofdirectors, the approval of mergers and other significant corporate transactions. This concentration of ownershipmay make it more difficult for other shareholders to effect substantial changes in our company and may also havethe effect of delaying, preventing or expediting, as the case may be, a change in control of our company.
Sales of a substantial number of shares of our common shares, or the perception that such sales might occur,could have an adverse effect on the price of our common shares, and therefore our ability to raise additionalcapital to fund our operations.
As of May 20, 2011, over 70% of our common shares were held beneficially by certain individuals andinstitutional investors who each had ownership of greater than 5% of our common shares. Sales by suchindividuals and institutional investors of a substantial number of shares of our common shares into the publicmarket, or the perception that such sales might occur, could have an adverse effect on the price of our commonshares, which could materially impair our ability to raise capital through the sale of common shares or debt that isconvertible into our common shares.
We have been named in, or brought, three lawsuits related to the 2010 refinancing exchange, and we may benamed in or bring, additional lawsuits in the future. This litigation could become time consuming andexpensive and could harm our business.
We and members of our Board of Directors were named in two lawsuits brought by Icahn Partners LP, a limitedpartnership governed by the laws of Delaware and certain entities affiliated with Icahn Partners LP (“IcahnPartners”), one in the Supreme Court of British Columbia (“BC Court”) and one in the New York SupremeCourt. In the action brought in the BC Court, Icahn Partners alleged, among other things, that a July 20, 2010refinancing exchange (as discussed under “Item 7. Management’s discussion and analysis of financial conditionsand results of operations—Liquidity and Capital Resources — July 20, 2010 Refinancing ExchangeAgreement”), was oppressive to Icahn Partners under British Columbia law. In the action brought in the NewYork Supreme Court, Icahn Partners alleged, among other things, that the 2010 refinancing exchange and thesubsequent issuance of our common shares to Dr. Rachesky’s fund through the conversion of the notesexchanged pursuant to the 2010 refinancing exchange constituted a breach of contract, tortious interference witha contract and tortious interference with prospective business relations. Both lawsuits sought damages andequitable relief, including an order to rescind the 2010 refinancing exchange and the subsequent issuance of ourcommon shares to Dr. Rachesky’s fund through the conversion of the notes exchanged pursuant to the 2010refinancing exchange. In addition, we filed an action in the U.S. District Court for the Southern District of NewYork against Carl Icahn, Brett Icahn and various investment vehicles controlled by Carl Icahn alleging violationsof the Exchange Act, and certain rules promulgated thereunder, and tortious interference with prospectivebusiness relations and seeking damages and injunctive relief. These actions are discussed separately and in moredetail in “Item 3. Legal Proceedings.” We have obligations under certain circumstances to indemnify each of thedefendant directors against liabilities or obligations of the defendant directors and expenses in relation to claims,actions, proceedings, investigations, or orders by reason of the defendant directors being or having been ourdirectors or any action or omission of the defendant directors acting as our directors. We cannot predict the
42

outcome of these lawsuits, nor can we predict the amount of time and expense that will be required to resolvethese lawsuits. If these lawsuits or any future lawsuits become time consuming and expensive, or if there areunfavorable outcomes in any of these cases, our business could be harmed.
An unsolicited offer for our shares could have a material and adverse effect on our business.
In March 2010 and July 2010, Icahn Partners launched unsolicited tender offers, pursuant to which IcahnPartners offered to acquire all of our outstanding shares of common stock, subject to certain conditions. Anunsolicited offer for shares of our common shares is, among other things, a distraction for our management andemployees, requires the expenditure of significant time and resources by us, could cause our stock price tofluctuate significantly and impair our access to the equity markets and, if it results in the acquisition of ownershipor control by a person or group in excess of 50% of our common shares and thus triggers a change in control,could result in a significant change in our business. In addition, if the unsolicited offer results in such a change incontrol under our senior secured credit facility, the Film Credit Facility, the indentures governing our convertiblesenior subordinated notes, the indenture governing our senior secured notes and the agreements governing ourother indebtedness, we may be required to repurchase our senior secured notes and the outstanding convertiblesenior subordinated notes, and the maturity of our senior secured credit facility, the Film Credit Facility and ourother outstanding indebtedness may be accelerated. We may not have the funds necessary to repurchase or repaysuch indebtedness and in fact we may be contractually prohibited under the terms of our senior secured creditfacility and Film Credit Facility from repurchasing our senior secured notes and the convertible seniorsubordinated notes. Any unsolicited offer, whether from the Icahn Partners or another party, could subject us toany of the aforementioned concerns, which could harm our business and have a material and adverse effect onour business and our results of operations. Any unsolicited offer also could cause Lions Gate’s stock price tofluctuate significantly and impair our access to the equity markets.
ITEM 1B.UNRESOLVED STAFF COMMENTS.
Not applicable.
ITEM 2. PROPERTIES.
Our corporate head office is located at 1055 West Hastings Street, Suite 2200, Vancouver, British Columbia V6E2E9. Our principal executive offices are located at 1055 West Hastings Street, Suite 2200 and 2700 ColoradoAvenue, Suite 200, Santa Monica, California, 90404. At the Santa Monica address, we occupy approximately125,000 square feet, including an approximately 4,000 square foot screening room. Our lease expires inAugust 2015. We also lease a 6,697 square foot space in New York, New York (which leases expire inJuly 2014) and a 4,389 square foot space in Santa Monica, California (which lease expires in March 2011).
We believe that our current facilities are adequate to conduct our business operations for the foreseeable future.We believe that we will be able to renew these leases on similar terms upon expiration. If we cannot renew, webelieve that we could find other suitable premises without any material adverse impact on our operations.
ITEM 3. LEGAL PROCEEDINGS.
On July 23, 2010, Icahn Partners filed a petition in the BC Court against us, Dr. Rachesky, MHR FundManagement LLC and MHR Institutional Partners III LP (the “MHR Fund”) and Kornitzer Capital Management,Inc. (the “BC Action”). Icahn Partners filed an amended petition on July 26, 2010. Dr. Rachesky is the managingmember of MHR Institutional Partners III LP’s general partner. Among other things, Icahn Partners claimed thata July 20, 2010 refinancing exchange (as discussed under “Item 7. Management’s discussion and analysis offinancial conditions and results of operations—Liquidity and Capital Resources — July 20, 2010 RefinancingExchange Agreement”) between us and Kornitzer Capital Management, Inc. to exchange certain convertiblesenior subordinated notes of LGEI (the “Exchange”), as well as the Note Sale (as defined below) and Conversion
43

(as defined below), were “oppressive” to Icahn Partners under British Columbia law. Icahn Partners soughtorders that would, among other things, (1) declare that the Company is oppressing its shareholders, (2) prohibitMHR Institutional Partners III LP from transferring or voting its new shares, (3) prohibit us from issuing anysecurities, (4) unwind the July 20 transactions between the MHR Fund, us, and Kornitzer Capital Management,Inc. (which includes the Exchange, the Note Sale and the Conversion) and (5) compensate the petitioners. TheBC Court heard argument during the week of October 11, 2010. On November 1, 2010, the BC Court issued afinal order and decision dismissing Icahn Partners’ claims in their entirety and awarding costs to us. OnNovember 2, 2010, Icahn Partners announced its intent to appeal the decision. On November 5, 2010, a singleJustice of the British Columbia Court of Appeal denied Icahn Partners’ application for an expedited appeal or, inthe alternative, an order prohibiting us from scheduling our 2010 annual general meeting of shareholders beforeJanuary 21, 2011. Icahn Partners’ application to vary this order was denied by a panel of the British ColumbiaCourt of Appeal on December 7, 2010. The British Columbia Court of Appeal heard oral argument on the IcahnPartners’ appeal from the final order and decision of the BC Court on March 24, 2011. The appeal was dismissedon May 10, 2011. For purposes herein, the “Note Sale” means the July 20, 2010 entry into a Purchase Agreementand subsequent sale of certain convertible notes received by Kornitzer Capital Management, Inc. in the Exchangeto MHR Institutional Partners III LP. Additionally, the “Conversion” means, after the consummation of the NoteSale, the July 20, 2010 exercise by MHR Institutional Partners III LP of conversion rights under certainconvertible notes whereby those notes were converted in full into 16,236,305 of our common shares.
Icahn Partners also sought an order from the British Columbia Securities Commission (the “BCSC”) on July 22,2010 requiring, among other things, that Dr. Rachesky, the MHR Fund, and their respective affiliates ceasetrading in any of our securities until further order of the BCSC and that we and each of our directors ceasetrading in any of our securities until further order of the BCSC. Icahn Partners alleged that the Exchange was,among other things, an unlawful defensive tactic, and that the disclosures concerning the transactions violatedapplicable securities laws. A hearing on the request for a temporary cease trade order was held on July 28, 2010,and the BCSC determined to dismiss Icahn Partners’ application for a temporary cease trade order against us andthe MHR Fund.
On July 26, 2010, Icahn Partners filed suit in New York Supreme Court against us, our Board of Directors, LGEI,Dr. Rachesky, the MHR Fund, MHR Institutional Advisors II LLC, MHR Institutional Advisors III LLC, andKornitzer Capital Management, Inc. and its principal John C. Kornitzer (the “New York Action”). Icahn Partnersclaimed, among other things, that the Exchange and subsequent issuance of our common shares toDr. Rachesky’s fund through the Conversion constituted (1) a breach of a certain July 9, 2010 letter agreementbetween us and Icahn Partners; (2) tortious interference with the same July 9 letter agreement; and (3) tortiousinterference with prospective business relationships. The complaint sought, among other things, a preliminaryand permanent injunction rescinding the Exchange and share issuance; a preliminary injunction prohibiting alldefendants from voting their shares in any election of directors or any other shareholder vote; and an award ofcompensatory and punitive damages. On August 26, 2010, the defendants moved to dismiss or stay the NewYork Action. On November 15, 2010, Icahn Partners filed a motion for a preliminary injunction. Icahn Partners’motion for a preliminary injunction was denied on December 9, 2010. On March 30, 2011, defendants’ motion todismiss the complaint was granted in its entirety and the complaint was dismissed. Icahn Partners filed a noticeof appeal on April 4, 2011.
On October 28, 2010, we filed an action in the United States District Court for the Southern District of New Yorkagainst Carl Icahn, Brett Icahn, and various investment vehicles controlled by Carl Icahn. The complaint, filed asExhibit (a)(8) to our Amendment No. 7 to the Schedule 14D-9, filed with the SEC on October 29, 2010, allegesviolations of Sections 13(d), 14(a), 14(d), and 14(e) of the Exchange Act, and certain rules promulgatedthereunder, and tortious interference with prospective business relations under state law. The complaint seeksdamages and injunctive relief, including an order requiring the defendants to make corrective disclosures beforeour 2010 annual general meeting of shareholders. On November 22, 2010, Icahn Partners moved to dismiss thecomplaint. We amended our complaint on December 3, 2010. Icahn Partners moved to dismiss the amendedcomplaint on December 17, 2010. Following oral argument on March 18, 2011, the Court granted in part and
44

denied in part Icahn Partners’ motion to dismiss. The Court granted Icahn Partners’ motion to dismiss withrespect to our claims alleging that Icahn Partners violated Sections 13(d), 14(a), 14(d) (except forSection 14(d)(7) as discussed below) and 14(e) of the Exchange Act, and certain rules promulgated thereunder,and tortuous interference with prospective business relations under state law. The Court denied Icahn Partners’motion to dismiss with respect to our claim alleging that Icahn Partners violated Section 14(d)(7) of theExchange Act, and Rule 14d-10(a)(2) promulgated thereunder, by offering special consideration to a particularshareholder in the course of its tender offer when it was required to offer all shareholders the highestconsideration paid to any single shareholder, and the suit is ongoing with respect to that remaining claim. IcahnPartners has since moved for reconsideration of the Court’s ruling on the motion to dismiss.
From time to time, we are involved in certain claims and legal proceedings arising in the normal course ofbusiness. While the resolution of these matters cannot be predicted with certainty, we do not believe, based oncurrent knowledge, that the outcome of any currently pending claims or legal proceedings in which the Companyis currently involved will have a material adverse effect on the Company’s consolidated financial position, resultsof operations or cash flow.
ITEM 4. REMOVED AND RESERVED.
45

PART II
ITEM 5. MARKET FOR REGISTRANT’S COMMON EQUITY, RELATED STOCKHOLDER MATTERSAND ISSUER PURCHASES OF EQUITY SECURITIES.
Market Information
Our common shares are listed on the NYSE under the symbol “LGF.”
On May 20, 2011, the closing sales price of our common shares on the NYSE was $5.97.
The following table sets forth the range of high and low closing sale prices for our common shares, asreported by the NYSE in U.S. dollars, for our two most recent fiscal years:
High Low
Year ended March 31, 2012First Quarter (through May 20, 2011) . . . . . . . . . . . . . . . . . . . . . . $6.72 $5.95
Year ended March 31, 2011Fourth Quarter . . . . . . . . . . . . . . . . . . . . . . . . . . . . . . . . . . . . . . . . $6.79 $5.76Third Quarter . . . . . . . . . . . . . . . . . . . . . . . . . . . . . . . . . . . . . . . . . 7.65 6.47Second Quarter . . . . . . . . . . . . . . . . . . . . . . . . . . . . . . . . . . . . . . . 7.38 6.03First Quarter . . . . . . . . . . . . . . . . . . . . . . . . . . . . . . . . . . . . . . . . . 7.27 6.14Year ended March 31, 2010Fourth Quarter . . . . . . . . . . . . . . . . . . . . . . . . . . . . . . . . . . . . . . . . $6.30 $4.85Third Quarter . . . . . . . . . . . . . . . . . . . . . . . . . . . . . . . . . . . . . . . . . 6.07 4.89Second Quarter . . . . . . . . . . . . . . . . . . . . . . . . . . . . . . . . . . . . . . . 6.66 5.40First Quarter . . . . . . . . . . . . . . . . . . . . . . . . . . . . . . . . . . . . . . . . . 6.26 4.55
Holders
As of May 20, 2011, there were 899 registered holders of our common shares.
Dividend Policy
We have not paid any dividends on our outstanding common shares since our inception and do notanticipate doing so in the foreseeable future. The declaration of dividends on our common shares is restricted byour senior revolving credit facility and is within the discretion of our Board of Directors and will depend uponthe assessment of, among other things, our earnings, financial requirements and operating and financialcondition. At the present time, given our anticipated capital requirements, we intend to follow a policy ofretaining earnings in order to finance further development of our business. We may be limited in our ability topay dividends on our common shares by restrictions under the Business Corporations Act (British Columbia)relating to the satisfaction of solvency tests.
Securities Authorized for Issuance Under Equity Compensation Plans
We currently maintain two equity compensation plans: the Lions Gate Entertainment Corp. 2004Performance Incentive Plan (the “2004 Plan”) and the Lionsgate Employees’ and Directors’ Equity IncentivePlan (the “Equity Incentive Plan”), each of which has been approved by our shareholders. In addition, asdescribed below, we granted certain equity-based awards that were not under shareholder-approved plans inconnection with our acquisition of Mandate Pictures in 2007.
46

The following table sets forth, for each of our equity compensation plans, the number of common sharessubject to outstanding options and rights, the weighted-average exercise price of outstanding options, and thenumber of shares remaining available for future award grants as of March 31, 2011.
Plan Category
Number of CommonShares to be IssuedUpon Exercise of
Outstanding Options,Warrants and Rights
Weighted-AverageExercise Price of
Outstanding Options,Warrants and Rights
Number of Common SharesRemaining Available for
Future Issuance Under EquityCompensation Plans(Excluding Shares
Reflected inthe First Column)
Equity compensation plansapproved byshareholders . . . . . . . . . . 5,304,090(1) $9.87(2) 3,682,606(3)
Equity compensation plansnot approved byshareholders . . . . . . . . . . 600,000(4) $9.22(4) —
Total . . . . . . . . . . . . . . . . . . 5,904,090 $9.75 3,682,606
(1) Of these shares, 2,710,000 were subject to options then outstanding under the 2004 Plan. In addition, thisnumber includes 2,594,090 shares that were subject to outstanding stock unit awards granted under the 2004Plan. Of these stock unit awards, 793,032 represent units subject to satisfaction of certain performancetargets.
(2) This number does not reflect the 2,594,090 shares that were subject to outstanding stock unit awards grantedunder the 2004 Plan.
(3) All of these shares were available for award grant purposes under the 2004 Plan. The shares available underthe 2004 Plan are, subject to certain other limits under that plan, generally available for any type of awardauthorized under the 2004 Plan including options, stock appreciation rights, restricted stock, restricted shareunits, stock bonuses and performance shares. No new awards may be granted under the Equity IncentivePlan.
(4) On September 10, 2007, pursuant to the acquisition of Mandate Pictures, Joseph Drake entered into anemployment agreement with Lions Gate Films, Inc. (“LGF”), our wholly-owned subsidiary, to serve as itsCo-Chief Operating Officer and President of the Motion Picture Group, and Nathan Kahane entered into anemployment agreement with LGF to serve as the President of Mandate Pictures. Pursuant to the terms of hisemployment agreement, Mr. Drake was granted 525,000 restricted share units (payable upon vesting in anequal number of shares of our common stock) all of which have vested, and options to purchase 500,000shares of our common stock, all of which have vested. Pursuant to the terms of his employment agreement,Mr. Kahane was granted 25,000 restricted share units (payable upon vesting in an equal number of shares ofour common stock) and options to purchase 100,000 shares of our common stock, all of which have vested.The per share exercise price of each option is the closing price of our common stock on September 10, 2007,the date of grant of the options.
Taxation
The following is a general summary of certain Canadian income tax consequences to U.S. Holders (who, atall relevant times, deal at arm’s length and are not affiliated with the Company) of the purchase, ownership anddisposition of common shares. For the purposes of this Canadian income tax discussion, a “U.S. Holder” means aholder of common shares who (1) for the purposes of the Income Tax Act (Canada) is not, has not, and will notbe, or deemed to be, resident in Canada at any time while he, she or it holds common shares, (2) at all relevanttimes is a resident of the United States under the Canada-United States Income Tax Convention (1980) (the“Convention”) and is eligible for benefits under the Convention, and (3) does not and will not use or be deemedto use the common shares in carrying on a business or part of a business in Canada. This summary does not applyto U.S. Holders who are insurers or “authorized foreign banks” within the meaning of the Income Tax Act(Canada). Such U.S. Holders should seek tax advice from their advisors.
47

This summary is not intended to be, and should not be construed to be, legal or tax advice to any prospectiveinvestor and no representation with respect to the tax consequences to any particular investor is made. Thesummary does not address any aspect of any provincial, state or local tax laws or the tax laws of any jurisdictionother than Canada or the tax considerations applicable to non-U.S. Holders. Accordingly, prospective investorsshould consult with their own tax advisors for advice with respect to the income tax consequences to them havingregard to their own particular circumstances, including any consequences of an investment in common sharesarising under any provincial, state or local tax laws or the tax laws of any jurisdiction other than Canada.
This summary is based upon the current provisions of the Income Tax Act (Canada), the regulationsthereunder and the proposed amendments thereto publicly announced by the Department of Finance, Canadabefore the date hereof (the “Tax Proposals”) and our understanding of the current published administrative andassessing practices of the Canada Revenue Agency. No assurance may be given that any proposed amendmentwill be enacted in the form proposed, if at all. This summary does not otherwise take into account or anticipateany changes in law, whether by legislative, governmental or judicial action.
The following summary applies only to U.S. Holders who hold their common shares as capital property. Ingeneral, common shares will be considered capital property of a holder where the holder is neither a trader nordealer in securities, does not hold the common shares in the course of carrying on a business and is not engagedin an adventure in the nature of trade in respect thereof. : (a) holders who are “financial institutions” within themeaning of the mark-to-market rules contained in the Income Tax Act (Canada) ; (b) a holder, an interest inwhich would be a “tax shelter investment” as defined in the Income Tax Act (Canada); (c) a holder that is a“specified financial institution” as defined in the Income Tax Act (Canada); or (d) a holder that is a corporationwhich has elected to use functional currency tax reporting as set out in the Income Tax Act (Canada). Such U.S.Holders should consult their own tax advisors.
Amounts in respect of common shares paid or credited or deemed to be paid or credited as, on account or inlieu of payment of, or in satisfaction of, dividends to a shareholder who is not a resident of Canada within themeaning of the Income Tax Act (Canada) will generally be subject to Canadian non-resident withholding tax.Canadian withholding tax applies to dividends that are formally declared and paid by the Company and also todeemed dividends that may be triggered by a cancellation of common shares if the cancellation occurs otherwisethan as a result of a simple open market transaction. For either deemed or actual dividends, withholding tax islevied at a basic rate of 25%, which may be reduced pursuant to the terms of an applicable tax treaty betweenCanada and the country of residence of the non-resident shareholder. Under the Convention, the rate of Canadiannon-resident withholding tax on the gross amount of dividends received by a U.S. Holder, which is the beneficialowner of such dividends, is generally 15%. However, where such beneficial owner is a company that owns atleast 10% of the voting shares of the company paying the dividends, the rate of such withholding is 5%.
In addition to the Canadian withholding tax on actual or deemed dividends, a U.S. Holder also needs toconsider the potential application of Canadian capital gains tax. A U.S. Holder will generally not be subject to taxunder the Income Tax Act (Canada) in respect of any capital gain arising on a disposition of common shares(including, generally, on a purchase by the Company on the open market) unless at the time of disposition suchshares constitute taxable Canadian property of the holder for purposes of the Income Tax Act (Canada) and suchU.S. Holder is not entitled to relief under the Convention. If the common shares are listed on a designated stockexchange (which includes the NYSE) at the time they are disposed of, they will generally not constitute taxableCanadian property of a U.S. Holder unless, at any time during the 60-month period immediately preceding thedisposition of the common shares, the U.S. Holder, persons with whom he, she or it does not deal at arm’s length,or the U.S. Holder together with such non-arm’s length persons, owned 25% or more of the issued shares of anyclass or series of the capital stock of the Company. Furthermore, pursuant to the Tax Proposals, shares ofcorporations that did not, at any time during the immediately preceding 60-month period, derive their valueprincipally from one or any combination of (i) real or immovable property situated in Canada, (ii) Canadianresource properties, (iii) timber resource properties, and (iv) options in respect of, or interests in, such properties,
48

no longer constitute taxable Canadian property. In any event, under the Convention, gains derived by a U.S.Holder from the disposition of common shares will generally not be subject to tax in Canada unless the value ofthe company’s shares is derived principally from real property or certain other immovable property situated inCanada.
Issuer Purchases of Equity Securities
On May 31, 2007, our Board of Directors authorized the repurchase of up to $50 million of our commonshares. Thereafter, on each of May 29, 2008 and November 6, 2008, as part of its regularly scheduled meetings,our Board of Directors authorized the repurchase up to an additional $50 million of our common shares, subjectto market conditions. The additional resolutions increased the total authorization to $150 million. The commonshares may be purchased, from time to time, at the Company’s discretion, including the quantity, timing andprice thereof. Such purchases will be structured as permitted by securities laws and other legal requirements.During the period from the authorization date through March 31, 2011, 6,787,310 shares have been repurchasedat a cost of approximately $65.2 million (including commission costs). The share repurchase program has noexpiration date.
There were no purchases of shares of our common stock by us during the three months ended March 31,2011.
ISSUER PURCHASES OF EQUITY SECURITIES
Period
(a) TotalNumber ofShares
Purchased
(b) AveragePrice
Paid per Share
(c) Total Number ofShares Purchasedas Part of PubliclyAnnounced Plans
or Programs
(d) ApproximateDollar Value ofShares that MayYet Be PurchasedUnder the Plansor Programs
January 1, 2011 — January 31,2011 . . . . . . . . . . . . . . . . . . . . . . . . — — — —
February 1, 2011 — February 29,2011 . . . . . . . . . . . . . . . . . . . . . . . . — — — —
March 1, 2011 — March 31, 2011 . . . — — — —Total . . . . . . . . . . . . . . . . . . . . . . . . . . — — — $85,080,000
49

Stock Performance Graph
The following graph compares our cumulative total shareholder return with those of the NYSE CompositeIndex and the S&P Movies & Entertainment Index for the period commencing March 31, 2006 and endingMarch 31, 2011. All values assume that $100 was invested on March 31, 2006 in our common shares and eachapplicable index and all dividends were reinvested.
The comparisons shown in the graph below are based on historical data and we caution that the stock priceperformance shown in the graph below is not indicative of, and is not intended to forecast, the potential futureperformance of our common shares.
COMPARISON OF 5 YEAR CUMULATIVE TOTAL RETURN*Among Lions Gate Entertainment Corporation, the NYSE Composite Index
and the S&P Movies & Entertainment Index
3/06 3/07 3/08 3/09 3/10 3/11
$0
$20
$40
$60
$80
$100
$120
$140
NYSE Composite
S&P Movies & Entertainment
Lions Gate Entertainment Corporation
* $100 invested on March 31, 2006 in stock or index, including reinvestment of dividends. Fiscal year endingMarch 31.
3/06 3/07 3/08 3/09 3/10 3/11
Lions Gate Entertainment Corporation 100.00 112.51 96.06 49.75 61.48 61.58NYSE Composite 100.00 114.95 111.67 65.07 99.79 115.19S&P Movies & Entertainment 100.00 122.79 102.96 53.79 105.17 130.98
The graph and related information are being furnished solely to accompany this Form 10-K pursuant toItem 201(e) of Regulation S-K. They shall not be deemed “soliciting materials” or to be “filed” with the SEC(other than as provided in Item 201), nor shall such information be incorporated by reference into any futurefiling under the Securities Act or the Exchange Act, except to the extent that we specifically incorporate it byreference into such filing.
50

ITEM 6. SELECTED FINANCIAL DATA.
The consolidated financial statements for all periods presented in this Form 10-K are prepared in conformitywith U.S. GAAP.
The Selected Consolidated Financial Data below includes the results of Lionsgate UK, Debmar-Mercury andMandate Pictures from their acquisition dates of October 17, 2005, July 3, 2006 and September 10, 2007,respectively, onwards. The Selected Consolidated Financial Data below also includes the results of MaplePictures from the date of consolidation of July 18, 2007, onwards. In addition, the selected consolidated historicalfinancial data below includes the results of TV Guide Network from the acquisition date of February 28, 2009until its deconsolidation on May 28, 2009, as explained below. The selected consolidated historical financial databelow has been adjusted for the adoption of a new accounting standard pertaining to consolidation accounting forvariable interest entities. This new accounting standard applied to our investment in TV Guide Network. Uponadoption, we applied the provisions of the new accounting standard retrospectively and accordingly, wedeconsolidated TV Guide Network on May 28, 2009, the date on which we sold a 49% interest in TV GuideNetwork to OEP, and retrospectively adjusted the financial statements to account for TV Guide Network underthe equity method of accounting since that date. See Note 7 and Note 17 to our audited consolidated financialstatements. Due to the acquisitions and the consolidation of Maple Pictures and the deconsolidation of TV GuideNetwork, the Company’s results of operations for the years ended March 31, 2011, 2010, 2009, 2008, and 2007
51

and financial positions as at March 31, 2011, 2010, 2009, 2008, and 2007 are not directly comparable to priorreporting periods.
Year Ended March 31,
2011 2010 2009 2008 2007
(Amounts in thousands, except per share amounts)
Statement of Operations Data:Revenues . . . . . . . . . . . . . . . . . . . . . . . . . . . . . . $1,582,720 $1,489,506 $1,466,374 $1,361,039 $ 976,740Expenses:
Direct operating . . . . . . . . . . . . . . . . . . . . . . . . . . . . . . 795,746 777,969 793,816 660,924 435,934Distribution and marketing . . . . . . . . . . . . . . . . . . . . . . 547,226 506,141 669,557 635,666 404,410General and administration . . . . . . . . . . . . . . . . . . . . . . 171,407 143,060 136,563 119,080 90,782
Depreciation and amortization . . . . . . . . . 5,811 12,455 7,657 5,500 3,670
Total expenses . . . . . . . . . . . . . . . . . . 1,520,190 1,439,625 1,607,593 1,421,170 934,796
Operating income (loss) . . . . . . . . . . . . . . . . . . 62,530 49,881 (141,219) (60,131) 41,944
Other expenses (income):Interest expense . . . . . . . . . . . . . . . . . . . . .
Contractual cash based interest . . . . . . . . . . . . . . 38,879 27,461 15,131 12,851 14,056
Amortization of debt discount anddeferred financing costs . . . . . . . . 16,301 19,701 19,144 17,048 15,783
Total interest expense . . . . . . . . 55,180 47,162 34,275 29,899 29,839Interest and other income . . . . . . . . . . . . . . . . . . . . . . . (1,742) (1,547) (5,785) (11,276) (11,930)Gain on sale of equity securities . . . . . . . . . . . . . . . . . . — — — (2,909) (1,722)
Loss (gain) on extinguishment of debt . . . 14,505 (5,675) (3,023) — —
Total other expenses, net . . . . . . . . . . 67,943 39,940 25,467 15,714 16,187
Income (loss) before equity interests and income taxes . . . . (5,413) 9,941 (166,686) (75,845) 25,757Equity interests loss . . . . . . . . . . . . . . . . . . . . . . . . . . . . . . . (43,930) (28,201) (9,044) (7,559) (2,605)
Income (loss) before income taxes . . . . . . . . . . . . . . . . . . . . (49,343) (18,260) (175,730) (83,404) 23,152
Income tax provision . . . . . . . . . . . . . . . . . . . . . 4,256 1,218 2,724 4,031 7,680
Net income (loss) $ (53,599) $ (19,478) $ (178,454) $ (87,435) $ 15,472
Basic Net Income (Loss) Per Common Share $ (0.41) $ (0.17) $ (1.53) $ (0.74) $ 0.14
Diluted Net Income (Loss) Per CommonShare $ (0.41) $ (0.17) $ (1.53) $ (0.74) $ 0.14
Weighted average number of commonshares outstanding:Basic . . . . . . . . . . . . . . . . . . . . . . . . . . . . . 131,176 117,510 116,795 118,427 108,398Diluted . . . . . . . . . . . . . . . . . . . . . . . . . . . . 131,176 117,510 116,795 118,427 111,164
Balance Sheet Data (at end of period):Cash and cash equivalents . . . . . . . . . . . . . . . . . . . . . . . . . . 86,419 69,242 138,475 371,589 51,497
Investments — auction rate securities . . . . . . . . — — — — 237,379Investment in films and television programs . . 621,288 661,105 702,767 608,942 493,140Total assets . . . . . . . . . . . . . . . . . . . . . . . . . . . . 1,557,844 1,527,155 1,667,250 1,536,927 1,135,598Senior revolving credit facility . . . . . . . . . . . . . 69,750 17,000 255,000 — —Senior secured second-priority notes . . . . . . . . 226,331 225,155 — — —Convertible senior subordinated notes andother financing obligations . . . . . . . . . . . . . . 110,973 192,036 281,521 261,519 243,675
Total liabilities . . . . . . . . . . . . . . . . . . . . . . . . . 1,430,298 1,473,233 1,625,557 1,282,328 807,880Total shareholders’ equity . . . . . . . . . . . . . . . . . 127,546 53,922 41,693 254,599 327,718
52

ITEM 7. MANAGEMENT’S DISCUSSION AND ANALYSIS OF FINANCIAL CONDITION ANDRESULTS OF OPERATIONS.
Overview
Lions Gate Entertainment Corp. (“Lionsgate,” the “Company,” “we,” “us” or “our”) is a leading globalentertainment company with a strong and diversified presence in motion picture production and distribution,television programming and syndication, home entertainment, family entertainment, digital distribution and newchannel platforms.
We released approximately 14 motion pictures theatrically per year for the last three fiscal years, whichincluded films that we developed and produced in-house, films that we developed and produced with our partnersand films that we acquired from third parties. In fiscal 2012, we currently intend to release approximately 11 to13 motion pictures theatrically.
We have also delivered, on average, approximately 76 hours of original television programming for the lastthree fiscal years, which include primarily prime time television series for the cable and broadcast networks. Infiscal 2012, we currently intend to deliver approximately 56 hours of television programming.
We distribute our library of approximately 13,000 motion picture titles and television episodes andprograms directly to retailers, rental kiosks, and pay and free television channels in the United States (the“U.S.”), Canada, the United Kingdom (the “UK”) and Ireland, through various digital media platforms, andindirectly to other international markets through our subsidiaries and various third parties. We also distribute ourlibrary through the following joint ventures::
• TV Guide Network, TV Guide Network On Demand and TV Guide Online (www.tvguide.com)(collectively, “TV Guide Network”), our joint ventures with One Equity Partners (“OEP”), the globalprivate equity investment arm of JPMorgan Chase, N.A.;
• Studio 3 Partners LLC (“EPIX”), our joint venture with Viacom Inc. (“Viacom”), Paramount PicturesCorporation (“Paramount Pictures”) and Metro-Goldwyn-Mayer Studios Inc. (“MGM”);
• Tiger Gate Entertainment Limited (“Tiger Gate”), our joint venture with Saban Capital Group, Inc.(“SCG”); and
• Horror Entertainment, LLC (“FEARnet”), our joint venture with Sony Pictures Television (“Sony”)and Comcast Corporation (“Comcast”).
In order to maximize our profit, we attempt to maintain a disciplined approach to acquisition, productionand distribution of projects, including films and television programs, by balancing our financial risks against theprobability of commercial success for each project. We also attempt to maintain the same disciplined approach toinvestments in, or acquisitions of, libraries or other assets complementary to our business, entertainment studiosand companies that we believe will enhance our competitive position in the industry, generate significant long-term returns, represent an optimal use of our capital and build a diversified foundation for future growth.Historically, we have made numerous acquisitions that are significant to our business and we may continue tomake such acquisitions in the future. For example, we have acquired, integrated and/or consolidated into ourbusiness the following:
• Mandate Pictures, LLC (“Mandate Pictures”), a worldwide independent film producer, financier anddistributor (acquired in September 2007);
• Maple Pictures Corp. (“Maple Pictures”), a Canadian film, television and home video distributor(consolidated effective July 2007);
• Debmar-Mercury, LLC (“Debmar-Mercury”), a leading independent media company specializing insyndication, network, cable and ancillary markets (acquired in July 2006);
53

• Redbus Film Distribution Ltd. and Redbus Pictures (collectively, “Redbus” and currently, Lions GateUK Ltd. (“Lionsgate UK”)), an independent film distributor, which provides us the ability to self-distribute our motion pictures in the UK and Ireland and included the acquisition of the Redbus libraryof approximately 130 films (acquired in October 2005);
• Certain of the film assets and accounts receivable of Modern Entertainment, Ltd., a licensor of filmrights to DVD distributors, broadcasters and cable networks (acquired in August 2005);
• Artisan Entertainment, Inc. (“Artisan Entertainment”), a diversified motion picture, family and homeentertainment company (acquired in December 2003); and
• Trimark Holdings, Inc., a worldwide distributor of entertainment content (acquired in October 2000).
As part of this strategy, we also have ownership interests in the following:
• Pantelion Films, a joint venture designed to produce and distribute a slate of English and Spanishlanguage feature films to target Hispanic moviegoers in the U.S. (entered into in July 2010);
• Tiger Gate, an operator of pay television channels and a distributor of television programming andaction and horror films across Asia (entered into in April 2010);
• TV Guide Network (acquired in February 2009 and sold a 49% interest to OEP in May 2009);
• EPIX, a joint venture entered into to create a premium television channel and subscriptionvideo-on-demand service (entered into in April 2008);
• Elevation Sales Limited (“Elevation”), a U.K. based home entertainment distributor (interest acquiredin July 2007);
• Roadside Attractions, LLC (“Roadside”), an independent theatrical distribution company (interestacquired in July 2007);
• NextPoint, Inc. (“Break Media”), an online video entertainment service provider (interest acquired inJune 2007); and
• FEARnet, a multiplatform programming and content service provider (interest acquired inOctober 2006).
Revenues
Our revenues are derived from the Motion Pictures and Television Production segments, as describedbelow. Our revenues are derived from the U.S., Canada, the U.K., Australia and other foreign countries; none ofthe non-U.S. countries individually comprised greater than 10% of total revenues. See Note 21 to our auditedconsolidated financial statements.
Motion Pictures. Motion Pictures includes “Theatrical,” “Home Entertainment,” “Television,”“International,” “Lionsgate UK,” and “Mandate Pictures” revenue.
Theatrical revenues are derived from the theatrical release of motion pictures in the U.S. and Canada whichare distributed to theatrical exhibitors on a picture by picture basis. The financial terms that we negotiate with ourtheatrical exhibitors generally provide that we receive a percentage of the box office results and are negotiated ona picture by picture basis.
Home Entertainment revenues includes revenues from our own film and television productions and acquiredor licensed films, including theatrical and direct-to-video releases, generated from the sale to retail stores andthrough digital media platforms. In addition, we have revenue sharing arrangements with certain rental stores
54
which generally provide that in exchange for a nominal or no upfront sales price, we share in the rental revenuesgenerated by each such store on a title by title basis. We categorized our Home Entertainment revenue asfollows:
• Packaged media revenue: Package media revenue consists of the sale or rental of DVD’s and Blu-raydevices.
• Electronic media revenue: Electronic media revenue consists of revenues generated from electronic-sell through or “EST”, digital rental, pay-per-view and video-on-demand platforms.
Television revenues are primarily derived from the licensing of our productions and acquired films to thedomestic cable, satellite, and free and pay television markets.
International revenues include revenues from our international subsidiaries from the licensing and sale ofour productions, acquired films, our catalog product or libraries of acquired titles and revenues from ourdistribution to international sub-distributors, on a territory-by-territory basis.
Lionsgate UK revenues include revenues from the licensing and sale of our productions, acquired films, ourcatalog product or libraries of acquired titles from our subsidiary located in the U.K.
Mandate Pictures revenues include revenues from the sales and licensing of domestic and worldwide rightsof titles developed or acquired by Mandate Pictures to third-party distributors and to internationalsub-distributors.
Television Production. Television Production includes the licensing and syndication to domestic andinternational markets of one-hour and half-hour drama series, television movies and mini-series and non-fictionprogramming, and home entertainment revenues consisting of television production movies or series.
Media Networks. Media Networks consists of TV Guide Network, including TV Guide Network OnDemand, and TV Guide Online (www.tvguide.com), from the acquisition date of February 28, 2009 until itsdeconsolidation on May 28, 2009. We adopted the new accounting standard pertaining to consolidationaccounting for variable interest entities on April 1, 2010 and applied the provisions of the new accountingstandard retrospectively. Accordingly, we deconsolidated TV Guide Network on May 28, 2009, the date onwhich we sold a 49% interest in TV Guide Network to OEP, and retrospectively adjusted our financial statementsto account for TV Guide Network under the equity method of accounting since that date. Media Networksrevenue includes distribution revenue from multi-system cable operators and digital broadcast satellite providers(distributors generally pay a per subscriber fee for the right to distribute programming) and advertising revenuefrom the sale of advertising on its television channel and related online media platforms.
Expenses
Our primary operating expenses include direct operating expenses, distribution and marketing expenses andgeneral and administration expenses.
Direct operating expenses include amortization of film and television production or acquisition costs,participation and residual expenses, provision for doubtful accounts, and foreign exchange gains and losses.Participation costs represent contingent consideration payable based on the performance of the film to partiesassociated with the film, including producers, writers, directors or actors, etc. Residuals represent amountspayable to various unions or “guilds” such as the Screen Actors Guild, Directors Guild of America, and WritersGuild of America, based on the performance of the film in certain ancillary markets or based on the individual’s(i.e., actor, director, writer) salary level in the television market.
Distribution and marketing expenses primarily include the costs of theatrical “prints and advertising”(“P&A”) and of DVD/Blu-ray duplication and marketing. Theatrical P&A includes the costs of the theatricalprints delivered to theatrical exhibitors and the advertising and marketing cost associated with the theatrical
55

release of the picture. DVD/Blu-ray duplication represents the cost of the DVD/Blu-ray product and themanufacturing costs associated with creating the physical products. DVD/Blu-ray marketing costs represent thecost of advertising the product at or near the time of its release or special promotional advertising.
General and administration expenses include salaries and other overhead.
Recent Developments
Additional Issuance of Senior Secured Second-Priority Notes. On May 13, 2011, Lions Gate EntertainmentInc. (“LGEI”), our wholly-owned subsidiary, issued approximately $200.0 million aggregate principal amount ofsenior secured second priority notes due 2016 (the “Additional Senior Notes”) in a private offering conductedpursuant to Rule 144A and Regulation S under the Securities Act of 1933, as amended (the “Securities Act”).The Additional Senior Notes were issued pursuant to a supplemental indenture dated as of May 13, 2011 (the“Supplemental Indenture”) to the indenture dated as of October 21, 2009 (the “Indenture”), among LGEI, theCompany, the subsidiary guarantors party thereto, and U.S. Bank National Association, as trustee. LGEI hadissued $236.0 million aggregate principal amount of 10.25% senior secured second priority notes due 2016 (the“Senior Notes”) under the Indenture on October 21, 2009. The Supplemental Indenture amended the Indentureto, among other things, enable the Issuer to issue additional notes having the same terms as the Senior Notes,except for the issue date, issue price and first interest payment, in an aggregate principal amount of up to$200.0 million. The Additional Senior Notes were sold at 102.219% of the principal amount plus accrued interestthereon from May 1, 2011, resulting in gross proceeds of approximately $204.4 million and net proceeds ofapproximately $197.2 million after certain transaction costs, and approximately $191.6 million after $5.6 millionpaid in connection with the consent solicitation of holders of the Senior Notes. A portion of the proceeds wereused to pay down amounts outstanding under our senior secured credit facility. The Additional Senior Notesaccrue interest at a rate of 10.25% per annum from May 1, 2011 and will be payable semiannually on May 1 andNovember 1 of each year, commencing on November 1, 2011. The Additional Senior Notes will mature onNovember 1, 2016.
CRITICAL ACCOUNTING POLICIES
The preparation of our financial statements in conformity with accounting principles generally accepted inthe United States requires management to make estimates, judgments and assumptions that affect the amountsreported in the consolidated financial statements and accompanying notes. The application of the followingaccounting policies, which are important to our financial position and results of operations, requires significantjudgments and estimates on the part of management. As described more fully below, these estimates bear the riskof change due to the inherent uncertainty attached to the estimate. In some cases, changes in the accountingestimates are reasonably likely to occur from period to period. Accordingly, actual results could differ materiallyfrom our estimates. For example, accounting for films and television programs requires us to estimate futurerevenue and expense amounts which, due to the inherent uncertainties involved in making such estimates, arelikely to differ to some extent from actual results. To the extent that there are material differences between theseestimates and actual results, our financial condition or results of operations will be affected. We base ourestimates on past experience and other assumptions that we believe are reasonable under the circumstances, andwe evaluate these estimates on an ongoing basis. For a summary of all of our accounting policies, including theaccounting policies discussed below, see Note 2 to our audited consolidated financial statements.
Accounting for Films and Television Programs.We capitalize costs of production and acquisition, includingfinancing costs and production overhead, to investment in films and television programs. These costs for anindividual film or television program are amortized and participation and residual costs are accrued to directoperating expenses in the proportion that current year’s revenues bear to management’s estimates of the ultimaterevenue at the beginning of the year expected to be recognized from exploitation, exhibition or sale of such filmor television program over a period not to exceed ten years from the date of initial release. For previouslyreleased film or television programs acquired as part of a library, ultimate revenue includes estimates over aperiod not to exceed 20 years from the date of acquisition.
56
Due to the inherent uncertainties involved in making such estimates of ultimate revenues and expenses,these estimates have differed in the past from actual results and are likely to differ to some extent in the futurefrom actual results. In addition, in the normal course of our business, some films and titles are more successfulthan anticipated and some are less successful than anticipated. The Company’s management regularly reviewsand revises when necessary its ultimate revenue and cost estimates, which may result in a change in the rate ofamortization of film costs and participations and residuals and/or write-down of all or a portion of theunamortized costs of the film or television program to its estimated fair value. The Company’s managementestimates the ultimate revenue based on experience with similar titles or title genre, the general public appeal ofthe cast, actual performance (when available) at the box office or in markets currently being exploited, and otherfactors such as the quality and acceptance of motion pictures or programs that our competitors release into themarketplace at or near the same time, critical reviews, general economic conditions and other tangible andintangible factors, many of which we do not control and which may change.
An increase in the estimate of ultimate revenue will generally result in a lower amortization rate and,therefore, less film and television program amortization expense, while a decrease in the estimate of ultimaterevenue will generally result in a higher amortization rate and, therefore, higher film and television programamortization expense, and also periodically results in an impairment requiring a write-down of the film cost tothe title’s fair value. These write-downs are included in amortization expense within direct operating expenses inour consolidated statements of operations.
Revenue Recognition. Revenue from the theatrical release of feature films is recognized at the time ofexhibition based on our participation in box office receipts. Revenue from the sale of DVDs/Blu-ray discs in theretail market, net of an allowance for estimated returns and other allowances, is recognized on the later of receiptby the customer or “street date” (when it is available for sale by the customer). Under revenue sharingarrangements, rental revenue is recognized when we are entitled to receipts and such receipts are determinable.Revenues from television licensing are recognized when the feature film or television program is available to thelicensee for telecast. For television licenses that include separate availability “windows” during the licenseperiod, revenue is allocated over the “windows.” Revenue from sales to international territories are recognizedwhen access to the feature film or television program has been granted or delivery has occurred, as requiredunder the sales contract, and the right to exploit the feature film or television program has commenced. Formultiple media rights contracts with a fee for a single film or television program where the contract provides formedia holdbacks (defined as contractual media release restrictions), the fee is allocated to the various mediabased on our assessment of the relative fair value of the rights to exploit each media and is recognized as eachholdback is released. For multiple-title contracts with a fee, the fee is allocated on a title-by-title basis, based onour assessment of the relative fair value of each title. The primary estimate requiring the most subjectivity andjudgment involving revenue recognition is the estimate of sales returns associated with our revenue from the saleof DVD’s/Blu-ray discs in the retail market which is discussed separately below under the caption “Sales ReturnsAllowance.”
Sales Returns Allowance. Revenues are recorded net of estimated returns and other allowances. We estimatereserves for DVD/Blu-ray returns based on previous returns experience, point-of-sale data available from certainretailers, current economic trends, and projected future sales of the title to the consumer based on the actualperformance of similar titles on a title-by-title basis in each of the DVD/Blu-ray businesses. Factors affectingactual returns include, among other factors, limited retail shelf space at various times of the year, success ofadvertising or other sales promotions, and the near term release of competing titles. We believe that our estimateshave been materially accurate in the past; however, due to the judgment involved in establishing reserves, wemay have adjustments to our historical estimates in the future. Our estimate of future returns affects reportedrevenue and operating income. If we underestimate the impact of future returns in a particular period, then wemay record less revenue in later periods when returns exceed the estimated amounts. If we overestimate theimpact of future returns in a particular period, then we may record additional revenue in later periods whenreturns are less than estimated. An incremental change of 1% in our estimated sales returns rate(i.e., provisions for returns divided by gross sales of related product) for home entertainment products wouldhave had an approximately $8.1 million impact on our total revenue in the fiscal year ended March 31, 2011.
57

Provisions for Accounts Receivable. We estimate provisions for accounts receivable based on historicalexperience and relevant facts and information regarding the collectability of the accounts receivable. Inperforming this evaluation, significant judgments and estimates are involved, including an analysis of specificrisks on a customer-by-customer basis for our larger customers and an analysis of the length of time receivableshave been past due. The financial condition of a given customer and its ability to pay may change over time orcould be better or worse than anticipated and could result in an increase or decrease to our allowance for doubtfulaccounts, which, when the impact of such change is material, is disclosed in our discussion on direct operatingexpenses elsewhere in “Management’s Discussion and Analysis of Financial Condition and Results ofOperations.”
Income Taxes. We are subject to federal and state income taxes in the U.S., and in several foreignjurisdictions. We record deferred tax assets, net of applicable reserves, related to net operating loss carryforwardsand certain temporary differences. We recognize a future tax benefit to the extent that realization of such benefitis more likely than not or a valuation allowance is applied. In order to realize the benefit of our deferred taxassets we will need to generate sufficient taxable income in the future. Because of our historical operating losses,we have provided a full valuation allowance against our net deferred tax assets. However, the assessment as towhether there will be sufficient taxable income to realize our net deferred tax assets is an estimate which couldchange in the future depending primarily upon the actual performance of our Company. When we have a historyof profitable operations sufficient to demonstrate that it is more likely than not that our deferred tax assets will berealized, the valuation allowance or a portion of the valuation allowance will be reversed and reflected as abenefit in the income tax provision. After that we will be required to continually evaluate the more likely than notassessment that our net deferred tax assets will be realized and if operating results deteriorate we may need toreestablish all or a portion of the valuation allowance through a charge to our income tax provision.
Goodwill. Goodwill is reviewed annually for impairment within each fiscal year or between the annual testsif an event occurs or circumstances change that indicate it is more likely than not that the fair value of a reportingunit is less than its carrying value. We perform our annual impairment test as of January 1 in each fiscal year. Weperformed our last annual impairment test on our goodwill as of January 1, 2011. No goodwill impairment wasidentified in any of our reporting units. Determining the fair value of reporting units requires various assumptionsand estimates. The estimates of fair value include consideration of the future projected operating results and cashflows of the reporting unit. Such projections could be different than actual results. Should actual results besignificantly less than estimates, the value of our goodwill could be impaired in the future.
Convertible Senior Subordinated Notes. We account for our convertible senior subordinated notes byseparating the liability and equity components. The liability component is recorded at the date of issuance basedon its fair value which is generally determined in a manner that will reflect an interest cost equal to ournonconvertible debt borrowing rate at the convertible senior subordinated notes issuance date. The amount of theproceeds less the amount recorded as the liability component is recorded as an addition to shareholders’ equityreflecting the equity component (i.e., conversion feature). The difference between the principal amount and theamount recorded as the liability component represents the debt discount. The carrying amount of the liability isaccreted up to the principal amount through the amortization of the discount, using the effective interest method,to interest expense over the expected life of the note. The determination of the fair value of the liabilitycomponent is an estimate dependent on a number of factors including estimates of market rates for similar nonconvertible debt instruments at the date of issuance. A higher value attributable to the liability component resultsin a lower value attributed to the equity component and therefore a smaller discount amount and lower interestcost as a result of amortization of the smaller discount. A lower value attributable to the liability componentresults in a higher value attributed to the equity component and therefore a larger discount amount and higherinterest cost as a result of amortization of the larger discount.
58

Business Acquisitions. The Company accounts for its business acquisitions as a purchase, whereby thepurchase price is allocated to the assets acquired and liabilities assumed based on their estimated fair value. Theexcess of the purchase price over estimated fair value of the net identifiable assets is allocated to goodwill.Determining the fair value of assets and liabilities requires various assumptions and estimates. These estimatesand assumptions are refined with adjustments recorded to goodwill as information is gathered and finalappraisals are completed over a one-year allocation period. The changes in these estimates or differentassumptions used in determining these estimates could impact the amount of assets, including goodwill andliabilities, ultimately recorded in our balance sheet and could impact our operating results subsequent to suchacquisition. We believe that our assumptions and estimates have been materially accurate in the past.
Recent Accounting Pronouncements
Consolidation accounting for variable interest entities. This new accounting guidance modifies the previousguidance in relation to the identification of controlling financial interests in a variable interest entity (“VIE”).Under this new guidance, the primary beneficiary of a VIE is the enterprise that has both of the followingcharacteristics, among others: (a) the power to direct the activities of a VIE that most significantly impact theentity’s economic performance; and (b) the obligation to absorb losses of the entity, or the right to receivebenefits from the entity, that could potentially be significant to the VIE. If an enterprise determines that power isshared among multiple unrelated parties such that no one party has the power to direct the activities of a VIE thatmost significantly impact the VIE’s economic performance, then no party is the primary beneficiary. Power isshared if each of the parties sharing power are required to consent to the decisions relating to the activities thatmost significantly impact the VIE’s performance. The provisions of this standard became effective for usbeginning in fiscal 2011.
Upon adoption of the new accounting standard, on April 1, 2010, we determined that we are no longer theprimary beneficiary of TV Guide Network because the power to direct the activities that most significantlyimpact the economic performance of TV Guide Network are shared with the 49% owner of TV Guide Network,OEP. Although we own a 51% interest in TV Guide Network, the power to direct the activities that mostsignificantly impact the economic performance of TV Guide Network are held by the board of managerspursuant to the operating agreement of TV Guide Entertainment Group LLC. Accordingly, upon adoption of thenew accounting standard, we are no longer consolidating TV Guide Network and instead are accounting for TVGuide Network under the equity method of accounting.
We have applied the provisions of the new accounting standard retrospectively and, accordingly, wedeconsolidated TV Guide Network from May 28, 2009, the date we sold a 49% interest to OEP, andretrospectively adjusted the financial statements to reflect TV Guide Network as if it were accounted for underthe equity method of accounting since that date. The deconsolidation of TV Guide network resulted in thereclassification of $305.4 million of assets, $147.3 million of liabilities and $30.0 million of non-controllinginterest amounts from each of their respective consolidated balance sheet captions to the investment in equitymethod investee’s account as of March 31, 2010, reflecting the carrying amount of the Company’s interest in themandatorily redeemable preferred and common stock units of TV Guide Network as of March 31, 2010. Inaddition, under the equity method of accounting, our share of the revenues, expenses of TV Guide Network andincome for the accretion of the dividend and discount of the mandatorily redeemable preferred stock are recordednet in the equity interest line item in the consolidated statements of operations. The adoption of the newaccounting standard did not impact the Company’s net loss. See Note 7 and Note 17 to our audited consolidatedfinancial statements for further detail regarding TV Guide Network.
59

RESULTS OF OPERATIONS
Fiscal 2011 Compared to Fiscal 2010
The following table sets forth the components of consolidated revenue for the fiscal years ended March 31,2011 and 2010:
YearEnded
March 31,2011
YearEnded
March 31,2010
Increase (Decrease)
Amount Percent
(Amounts in millions)Consolidated Revenue
Motion Pictures . . . . . . . . . . . . . . . . . . . . . . . . . . . . . $1,229.5 $1,119.3 $110.2 9.8%Television Production . . . . . . . . . . . . . . . . . . . . . . . . 353.2 350.9 2.3 0.7%Media Networks . . . . . . . . . . . . . . . . . . . . . . . . . . . . — 19.3 (19.3) NM
$1,582.7 $1,489.5 $ 93.2 6.3%
NM— Percentage not meaningful
Our largest component of revenue comes from home entertainment. The following table sets forth totalhome entertainment revenue for both the Motion Pictures and Television Production reporting segments for thefiscal years ended March 31, 2011 and 2010:
YearEnded
March 31,2011
YearEnded
March 31,2010
Increase (Decrease)
Amount Percent
(Amounts in millions)Home Entertainment Revenue (1)
Motion Pictures . . . . . . . . . . . . . . . . . . . . . . . . . . . . . $635.6 $591.4 $ 44.2 7.5%Television Production . . . . . . . . . . . . . . . . . . . . . . . . 54.4 67.8 (13.4) (19.8%)
$690.0 $659.2 $ 30.8 4.7%
(1) See reclassification footnote under the table in the Motion Pictures Revenue discussion below.
Motion Pictures Revenue
The following table sets forth the components of revenue and the changes in these components for themotion pictures reporting segment for the years ended March 31, 2011 and 2010:
YearEnded
March 31,2011
YearEnded
March 31,2010
Increase (Decrease)
Amount Percent
(Amounts in millions)Motion Pictures
Theatrical . . . . . . . . . . . . . . . . . . . . . . . . . . . . . . . . . . $ 205.9 $ 139.4 $ 66.5 47.7%Home Entertainment (1) . . . . . . . . . . . . . . . . . . . . . . 635.6 591.4 44.2 7.5%Television (1) . . . . . . . . . . . . . . . . . . . . . . . . . . . . . . . 139.8 135.8 4.0 2.9%International . . . . . . . . . . . . . . . . . . . . . . . . . . . . . . . . 126.5 73.4 53.1 72.3%Lionsgate UK . . . . . . . . . . . . . . . . . . . . . . . . . . . . . . . 79.2 74.3 4.9 6.6%Mandate Pictures . . . . . . . . . . . . . . . . . . . . . . . . . . . . 38.7 99.1 (60.4) (60.9%)Other . . . . . . . . . . . . . . . . . . . . . . . . . . . . . . . . . . . . . 3.8 5.9 (2.1) (35.6%)
$1,229.5 $1,119.3 $110.2 9.8%
(1) For the year ended March 31, 2011, pay-per-view and video-on-demand revenue is included in HomeEntertainment revenue rather than Television revenue in order to be consistent with the way managementcurrently categorizes and analyzes those media types. For the year ended March 31, 2010, $51.0 million ofpay-per-view and video-on-demand revenue was reclassified from Television revenue to HomeEntertainment revenue to be consistent with the current year presentation.
60

Motion Pictures — Theatrical Revenue
The following table sets forth the titles contributing significant theatrical revenue by fiscal years theatricalslate and the month of their release for the fiscal years ended March 31, 2011 and 2010:
Year Ended March 31,
2011 2010
Theatrical Release Date Theatrical Release Date
Fiscal 2011 TheatricalSlate:
Fiscal 2010 TheatricalSlate:
For Colored Girls November 2010 From Paris WithLove
February 2010
Saw 3D October 2010 Daybreakers January 2010Alpha and Omega September 2010 Spy Next Door January 2010The Expendables August 2010 Brothers December 2009The Last Exorcism August 2010 Precious November 2009Killers June 2010 Saw VI October 2009Why Did I Get MarriedToo?
April 2010 Gamer September 2009
Kick-Ass April 2010 I Can Do Bad AllBy Myself
September 2009
Fiscal 2009 TheatricalSlate:
The Haunting inConnecticut
March 2009
Theatrical revenue of $205.9 million increased $66.5 million, or 47.7%, in fiscal 2011 as compared to fiscal2010. The increase in theatrical revenue in fiscal 2011 as compared to the prior year is primarily due to higherbox office receipts earned during fiscal 2011 as compared to fiscal 2010 on the theatrical releases listed in thetable above. The contribution of theatrical revenue from the titles listed above was $188.8 million in fiscal 2011compared to $126.4 million in fiscal 2010, representing an increase of $62.4 million in revenue from titlesindividually contributing greater than 5% of theatrical revenue.
61

Motion Pictures — Home Entertainment Revenue
The following table sets forth the titles contributing significant motion pictures home entertainment revenuefor the fiscal years ended March 31, 2011 and 2010:
Year Ended March 31,
2011 2010
DVD Release Date DVD Release Date
Fiscal 2011 TheatricalSlate:
Fiscal 2010Theatrical Slate:
The Next Three Days March 2011 Brothers March 2010
For Colored Girls February 2011 Precious March 2010
Saw 3D January 2011 Gamer January 2010
Alpha and Omega January 2011 I Can Do Bad AllBy Myself
January 2010
The Expendables November 2010 Saw VI January 2010Killers September 2010 Crank: High
VoltageSeptember 2009
Kick-Ass August 2010
Why Did I Get MarriedToo?
August 2010
Fiscal 2010 TheatricalSlate:
Fiscal 2009Theatrical Slate:
From Paris With Love June 2010 The Haunting InConnecticut
July 2009
Daybreakers May 2010 Madea Goes toJail
June 2009
The Spy Next Door May 2010 My BloodyValentine 3-D
May 2009
Precious March 2010 New In Town May 2009
Direct-to-DVD, acquiredand licensed brands,acquired library &other:
The Spirit April 2009
The Switch March 2011
62

The following table sets forth the components of home entertainment revenue by product category for thefiscal years ended March 31, 2011 and 2010:
Year Ended March 31,
2011 2010
PackagedMedia
ElectronicMedia Total
PackagedMedia
ElectronicMedia Total
(Amounts in millions)
Home entertainment revenues (1)Fiscal 2011 Theatrical Slate . . . . . . . . . . . . . . $192.9 $ 38.7 $231.6 $ — $ — $ —Fiscal 2010 Theatrical Slate . . . . . . . . . . . . . . 74.4 42.3 116.7 113.1 5.8 118.9Fiscal 2009 Theatrical Slate . . . . . . . . . . . . . . 10.0 1.2 11.2 129.9 41.2 171.1Fiscal 2008 & Prior Theatrical Slate . . . . . . . . 22.8 4.2 27.0 35.8 4.0 39.8Direct-to-DVD, acquired and licensed brands,acquired library & other . . . . . . . . . . . . . . . 201.2 32.7 233.9 225.2 14.8 240.0
Other . . . . . . . . . . . . . . . . . . . . . . . . . . . . . . . . 12.0 3.2 15.2 19.5 2.1 21.6
$513.3 $122.3 $635.6 $523.5 $67.9 $591.4
(1) See reclassification footnote (1) under the table in the Motion Pictures Revenue discussion above.
Home entertainment revenue of $635.6 million increased $44.2 million, or 7.5%, in fiscal 2011 as comparedto fiscal 2010. The increase in home entertainment revenue is primarily due to an increase in revenue fromelectronic media from $67.9 million in fiscal 2010 to $122.3 million in fiscal 2011, offset by a slight decrease inrevenue from packaged media. The increase in electronic media is primarily driven by an increase in revenuegenerated from the product categories listed in the table above. The slight decrease in revenue from packagedmedia results from a decrease in direct-to-DVD, acquired and licensed brands, acquired library and otherproducts, partially offset by an increase in revenue from the theatrical slates and other products. The increase inrevenue contributed by the theatrical slates is primarily due to higher box office receipts and the timing oftheatrical releases. The decrease in direct-to-DVD, acquired and licensed brands, acquired library and otherproducts is largely due to a decrease in packaged media revenue from fitness and family entertainment titles, aswell as a decline in revenue from one previously acquired library.
Motion Pictures — Television Revenue
The following table sets forth the titles contributing significant motion pictures television revenue for thefiscal years ended March 31, 2011 and 2010:
Year Ended March 31,
2011 2010
Fiscal 2011 Theatrical Slate: Fiscal 2009 Theatrical Slate:
Kick-Ass Madea Goes to Jail
Killers My Bloody Valentine 3-D
Why Did I Get Married Too? Saw VFiscal 2010 Theatrical Slate: The Family That Preys
Brothers The Haunting In Connecticut
Daybreakers Transporter 3
From Paris With Love W.I Can Do Bad All By Myself Fiscal 2008 Theatrical Slate:
Precious Why Did I Get Married? — Feature
Saw VI
The Spy Next DoorFiscal 2009 Theatrical Slate:
The Forbidden Kingdom
63

The following table sets forth the components of television revenue by product category for the fiscal yearsended March 31, 2011 and 2010:
Year EndedMarch 31,
2011 2010
(Amounts inmillions)
Television revenues (1)Fiscal 2011 Theatrical Slate . . . . . . . . . . . . . . . . . . . . . . . $ 29.4 $ —Fiscal 2010 Theatrical Slate . . . . . . . . . . . . . . . . . . . . . . . 56.3 3.5Fiscal 2009 Theatrical Slate . . . . . . . . . . . . . . . . . . . . . . . 13.2 89.0Fiscal 2008 & Prior Theatrical Slate . . . . . . . . . . . . . . . . . 22.6 26.8Direct-to-DVD, acquired and licensed brands, acquiredlibrary & other . . . . . . . . . . . . . . . . . . . . . . . . . . . . . . . . 16.2 13.5
Other . . . . . . . . . . . . . . . . . . . . . . . . . . . . . . . . . . . . . . . . . 2.1 3.0
$139.8 $135.8
(1) See reclassification footnote (1) under the table in the Motion Pictures Revenue discussion above.
Television revenue included in motion pictures revenue of $139.8 million increased $4.0 million, or 2.9%,in fiscal 2011 as compared to fiscal 2010. The increase in television revenue in fiscal 2011 compared to fiscal2010 is mainly due to the revenue generated by the product categories listed above. The contribution of televisionrevenue from the titles listed above was $85.0 million in fiscal 2011 compared to $68.1 million in fiscal 2010,and the contribution of television revenue from titles not listed above was $54.8 million in fiscal 2011 comparedto $67.7 million in fiscal 2010.
Motion Pictures — International Revenue
The following table sets forth the titles contributing significant motion pictures international revenue for thefiscal years ended March 31, 2011 and 2010:
Year Ended March 31,
2011 2010
Fiscal 2011 Theatrical Slate: Fiscal 2010 Theatrical Slate:
Alpha and Omega Brothers
Kick-Ass Saw VI
Killers Fiscal 2009 Theatrical Slate:
Saw 3D My Bloody Valentine 3-D
The Next Three Days Saw V
64

The following table sets forth the components of international revenue by product category for the fiscalyears ended March 31, 2011 and 2010:
Year EndedMarch 31,
2011 2010
(Amounts inmillions)
International revenuesFiscal 2011 Theatrical Slate . . . . . . . . . . . . . . . . . . . . . . . . $ 86.8 $ 0.3Fiscal 2010 Theatrical Slate . . . . . . . . . . . . . . . . . . . . . . . . 14.4 21.9Fiscal 2009 Theatrical Slate . . . . . . . . . . . . . . . . . . . . . . . . 4.7 16.0Fiscal 2008 & Prior Theatrical Slate . . . . . . . . . . . . . . . . . . 7.4 11.3Direct-to-DVD, acquired and licensed brands, acquiredlibrary & other . . . . . . . . . . . . . . . . . . . . . . . . . . . . . . . . . 10.3 17.9
Other . . . . . . . . . . . . . . . . . . . . . . . . . . . . . . . . . . . . . . . . . . 2.9 6.0
$126.5 $73.4
International revenue included in motion pictures revenue of $126.5 million increased $53.1 million, or72.3%, in fiscal 2011 as compared to fiscal 2010. The increase in international revenue in fiscal 2011 comparedto fiscal 2010 is mainly due to the revenues generated by the titles and product categories listed above.
Motion Pictures — Lionsgate UK Revenue
The following table sets forth the titles contributing significant Lionsgate UK revenue for the fiscal yearsended March 31, 2011 and 2010:
Year Ended March 31,
2011 2010
Fiscal 2011 Theatrical Slate: Fiscal 2010 Theatrical Slate:
Saw 3D Saw VI
The Expendables Fiscal 2009 Theatrical Slate:
Fiscal 2010 Theatrical Slate: My Bloody Valentine 3-D
Daybreakers LGUK Theatrical Slate:
LGUK Theatrical Slate: Harry Brown
Harry Brown The Hurt Locker
The Hurt Locker Other:
Drag Me To Hell
65

The following table sets forth the components of Lionsgate UK revenue by product category for the fiscalyears ended March 31, 2011 and 2010:
Year EndedMarch 31,
2011 2010
(Amounts inmillions)
Lionsgate UK revenuesFiscal 2011 Theatrical Slate . . . . . . . . . . . . . . . . . . . . . . . . . . . . . . . . . . . . . . . . . . . . . . . . . . . $32.2 $ —Fiscal 2010 Theatrical Slate . . . . . . . . . . . . . . . . . . . . . . . . . . . . . . . . . . . . . . . . . . . . . . . . . . . 8.2 10.4Fiscal 2009 Theatrical Slate . . . . . . . . . . . . . . . . . . . . . . . . . . . . . . . . . . . . . . . . . . . . . . . . . . . 1.0 10.0Fiscal 2008 & Prior Theatrical Slate . . . . . . . . . . . . . . . . . . . . . . . . . . . . . . . . . . . . . . . . . . . . . 2.5 8.9Lionsgate UK and third party product . . . . . . . . . . . . . . . . . . . . . . . . . . . . . . . . . . . . . . . . . . . . 22.1 25.2Direct-to-DVD, acquired and licensed brands, acquired library & other . . . . . . . . . . . . . . . . . 10.4 12.3Other . . . . . . . . . . . . . . . . . . . . . . . . . . . . . . . . . . . . . . . . . . . . . . . . . . . . . . . . . . . . . . . . . . . . . 2.8 7.5
$79.2 $74.3
Lionsgate UK revenue of $79.2 million increased $4.9 million, or 6.6%, in fiscal 2011 as compared to fiscal2010. The increase in Lionsgate UK revenue in fiscal 2011 compared to fiscal 2010 is mainly due to the revenuegenerated by the titles and product categories listed above.
Motion Pictures — Mandate Pictures Revenue
The following table sets forth the titles contributing significant Mandate Pictures revenue for the fiscal yearsended March 31, 2011 and 2010:
Year Ended March 31,
2011 2010
Drag Me To Hell Drag Me To Hell
Juno Horsemen
Peacock Juno
The Switch Passengers
Whip It Whip It
Mandate Pictures revenue includes revenue from the sales and licensing of domestic and worldwide rightsof titles developed or acquired by Mandate Pictures to third-party distributors or international sub-distributors.Mandate Pictures revenue of $38.7 million decreased $60.4 million, or 60.9%, in fiscal 2011 as compared tofiscal 2010. The decrease in Mandate Pictures revenue in fiscal 2011 compared to fiscal 2010 is mainly due tothe revenue from Drag Me To Hell in fiscal 2010 as compared to fiscal 2011.
66

Television Production Revenue
Television production revenue of $353.2 million increased $2.3 million, or 0.7%, in fiscal 2011 as comparedto fiscal 2010. The following table sets forth the components and the changes in the components of revenue thatmake up television production revenue for the fiscal years ended March 31, 2011 and 2010:
YearEnded
March 31,
YearEnded
March 31, Increase (Decrease)
2011 2010 Amount Percent
(Amounts in millions)
Television ProductionDomestic series licensing . . . . . . . . . . . . . . . . . . . . .
Lionsgate Television . . . . . . . . . . . . . . . . . . . . . $123.0 $128.8 $ (5.8) (4.5%)Debmar-Mercury . . . . . . . . . . . . . . . . . . . . . . . . 136.5 92.2 44.3 48.0%Ish Entertainment . . . . . . . . . . . . . . . . . . . . . . . . — 19.0 (19.0) (100.0%)
Total domestic series licensing . . . . . . . . . . . . . . . . . 259.5 240.0 19.5 8.1%International . . . . . . . . . . . . . . . . . . . . . . . . . . . . . . . . 37.1 42.3 (5.2) (12.3%)Home entertainment releases of televisionproduction . . . . . . . . . . . . . . . . . . . . . . . . . . . . . . . 54.4 67.8 (13.4) (19.8%)
Other . . . . . . . . . . . . . . . . . . . . . . . . . . . . . . . . . . . . . 2.2 0.8 1.4 175.0%
$353.2 $350.9 $ 2.3 0.7%
Revenues included in domestic series licensing increased in fiscal 2011 mainly due to higher revenuegenerated from Debmar-Mercury in fiscal 2011 as compared to fiscal 2010, partially offset by no revenuegenerated from our former collaboration with Ish Entertainment Inc. (“Ish”) in fiscal 2011 compared to fiscal2010 due to the collaboration ending in fiscal 2010, and slightly lower revenue generated from LionsgateTelevision in fiscal 2011 compared to fiscal 2010.
The following table sets forth the number of television episodes and hours included in Lionsgate Televisiondomestic series licensing revenue in the fiscal years ended March 31, 2011 and 2010, respectively:
Year EndedMarch 31, 2011
Episodes Hours
Weeds Season 6 . . . . . . . . . . . . . . . . . . . . . . . . . . . . . . . . . 1/2hr 13 6.5Blue Mountain State Season 2 . . . . . . . . . . . . . . . . . . . . . 1/2hr 13 6.5Running Wilde Season 1 . . . . . . . . . . . . . . . . . . . . . . . . . . 1/2hr 13 6.5Nurse Jackie Season 3 . . . . . . . . . . . . . . . . . . . . . . . . . . . 1/2hr 12 6.0Mad Men Season 4 . . . . . . . . . . . . . . . . . . . . . . . . . . . . . . 1hr 13 13.0Scream Queens Season 2 . . . . . . . . . . . . . . . . . . . . . . . . . 1hr 8 8.0Pilots . . . . . . . . . . . . . . . . . . . . . . . . . . . . . . . . . . . . . . . . . 1/2hr & 1hr 3 2.0
75 48.5
Year EndedMarch 31, 2010
Episodes Hours
Nurse Jackie Season 2 . . . . . . . . . . . . . . . . . . . . . . . . . . . . . . . . . 1/2hr 12 6.0Nurse Jackie Season 1 . . . . . . . . . . . . . . . . . . . . . . . . . . . . . . . . . 1/2hr 12 6.0Blue Mountain State Season 1 . . . . . . . . . . . . . . . . . . . . . . . . . . . 1/2hr 13 6.5Weeds Season 5 . . . . . . . . . . . . . . . . . . . . . . . . . . . . . . . . . . . . . . 1/2hr 13 6.5Crash TV Series Season 2 . . . . . . . . . . . . . . . . . . . . . . . . . . . . . . 1hr 13 13.0Mad Men Season 3 . . . . . . . . . . . . . . . . . . . . . . . . . . . . . . . . . . . 1hr 13 13.0
76 51.0
67

Revenues included in domestic series licensing from Debmar-Mercury increased in fiscal 2011 due toincreased revenue from the deliveries of the television series Meet the Browns, Are We There Yet?, Big Lake andThe Wendy Williams Show.
Our reality television collaboration with Ish ended in fiscal 2010, resulting in no revenue generated in thecurrent fiscal year. Revenue generated in fiscal 2010 resulted primarily from the production of the domesticseries Paris Hilton’s My New BFF and My Antonio.
International revenue decreased in fiscal 2011 due to a decrease in episodes of programming deliveredinternationally and no international revenue generated from our former collaboration with Ish. Internationalrevenue in fiscal 2011 included revenue from Blue Mountain State Season 1, Crash Season 2, and Mad MenSeasons 1, 2, 3 and 4. International revenue in fiscal 2010 included revenue from Mad Men Seasons 1, 2 and 3,Crash Season 1, Dead Zone Season 1, and Fear Itself.
The decrease in revenue from home entertainment releases of television production is primarily driven by adecrease in revenue from Weeds Seasons 4 and 5 (released June 2009 and January 2010, respectively) and MadMen Seasons 1 and 2 (released July 2008 and July 2009, respectively) in fiscal 2011 as compared to fiscal 2010,offset slightly by increases in revenue from the releases of Mad Men Season 4 (released March 2011) and WeedsSeason 6 (released February 2011) in fiscal 2011.
Media Networks Revenue
Media Networks revenue for the fiscal years ended March 31, 2011 and 2010 are nil and $19.3 million,respectively. The acquisition of TV Guide Network occurred on February 28, 2009. The results of operations ofTV Guide Network are included in the Company’s consolidated results from February 28, 2009 through May 27,2009. A portion of the entity was sold on May 28, 2009. Subsequent to the sale of TV Guide Network, andpursuant to the new accounting guidance for accounting for variable interest entities effective April 1, 2010,which the Company has retrospectively applied, the Company’s interest in TV Guide Network is beingaccounted for under the equity method of accounting.
Direct Operating Expenses
The following table sets forth direct operating expenses by segment for the fiscal years ended March 31,2011 and 2010:
Year EndedMarch 31, 2011
Year EndedMarch 31, 2010
MotionPictures
TelevisionProduction Total
MotionPictures
TelevisionProduction
MediaNetworks Total
(Amounts in millions)
Direct operating expensesAmortization of films andtelevision programs . . . . . . . . . . . $354.4 $175.0 $529.4 $302.0 $202.4 $ 7.3 $511.7
Participation and residualexpense . . . . . . . . . . . . . . . . . . . . 170.3 95.0 265.3 188.8 75.9 0.2 264.9
Other expenses . . . . . . . . . . . . . . . . 1.2 (0.2) 1.0 0.8 0.7 (0.1) 1.4
$525.9 $269.8 $795.7 $491.6 $279.0 $ 7.4 $778.0
Direct operating expenses as apercentage of segment revenues . . . . . 42.8% 76.4% 50.3% 43.9% 79.5% 38.3% 52.2%
Direct operating expenses of the motion pictures segment of $525.9 million for fiscal 2011 were 42.8% ofmotion pictures revenue, compared to $491.6 million, or 43.9%, of motion pictures revenue for fiscal 2010. Thedecrease in direct operating expenses of the motion pictures segment in fiscal 2011 as a percent of revenue isprimarily due to the change in the mix of product generating revenue in fiscal 2011 as compared to fiscal 2010.Investment in film write-downs of the motion picture segment during fiscal 2011 totaled approximately
68

$6.6 million compared to $12.5 million for fiscal 2010. In fiscal 2011, there was one write-down thatindividually exceeded $1.0 million. In fiscal 2010, there were two write-downs that individually exceeded$1.0 million, which totaled $7.4 million in the aggregate.
Direct operating expenses of the television production segment of $269.8 million for fiscal 2011 were76.4% of television revenue, compared to $279.0 million, or 79.5%, of television revenue for fiscal 2010. Thedecrease in direct operating expenses as a percent of television revenue is primarily due to the change in the mixof titles generating revenue compared to fiscal 2010, including the success of the Mad Men and Weeds seriesfranchises relative to total television revenue. In fiscal 2011, $11.6 million of charges for costs incurred in excessof contracted revenues for episodic television series or write-downs of television film costs were included in theamortization of television programs, compared to $12.6 million in fiscal 2010. The fiscal 2011 write-downsincluded write-downs on three titles over $1.0 million, which aggregated $7.9 million, of which $5.3 millionrelated to one television series. The fiscal 2010 write-downs included write-downs on four titles over$1.0 million, which aggregated $10.5 million, of which $4.9 million related to one television series.
Direct operating expenses of the Media Networks segment of $7.4 million for fiscal 2010 consists primarilyof programming expenses associated with the production of such programs as Idol Tonight and Hollywood 411from April 1, 2009 to May 27, 2009.
Distribution and Marketing Expenses
The following table sets forth distribution and marketing expenses by segment for the fiscal years endedMarch 31, 2011 and 2010:
Year EndedMarch 31, 2011
Year EndedMarch 31, 2010
MotionPictures
TelevisionProduction Total
MotionPictures
TelevisionProduction
MediaNetworks Total
(Amounts in millions)
Distribution and marketing expensesTheatrical . . . . . . . . . . . . . . . . . . . . . $267.1 $ — $267.1 $237.6 $ 0.2 $— $237.8Home Entertainment (1) . . . . . . . . . 191.2 12.6 203.8 195.7 18.7 — 214.4Television (1) . . . . . . . . . . . . . . . . . 1.6 14.8 16.4 0.9 8.5 — 9.4International . . . . . . . . . . . . . . . . . . 5.3 5.3 10.6 4.7 3.7 — 8.4Lionsgate UK . . . . . . . . . . . . . . . . . 45.1 2.5 47.6 31.1 1.1 — 32.2Media Networks . . . . . . . . . . . . . . . — — — — — 2.0 2.0Other . . . . . . . . . . . . . . . . . . . . . . . . 1.5 0.2 1.7 1.7 0.3 — 2.0
$511.8 $35.4 $547.2 $471.7 $32.5 $ 2.0 $506.2
(1) For the year ended March 31, 2011, pay-per-view and video-on-demand distribution and marketingexpenses is included in Home Entertainment rather than Television distribution and marketing expenses inorder to be consistent with the way management currently categorizes and analyzes those media types. Forthe year ended March 31, 2010, $3.0 million of pay-per-view and video-on-demand distribution andmarketing expenses were reclassified from Television to Home Entertainment distribution and marketingexpenses to be consistent with the current year presentation.
The majority of distribution and marketing expenses relate to the motion pictures segment. Theatrical P&Ain the motion pictures segment in fiscal 2011 of $267.1 million increased $29.5 million, compared to$237.6 million in fiscal 2010. The increase is primarily driven by a higher average P&A expense for titles
69

contributing greater than 5% of distribution and marketing expenses in fiscal 2011 as compared to fiscal 2010, aswell as a higher number of theatrical releases in fiscal 2011 as compared to fiscal 2010. Domestic theatrical P&Afrom the motion pictures segment in fiscal 2011 included P&A incurred on the release of Alpha and Omega,Buried, For Colored Girls, Kick-Ass, Killers, The Expendables, Saw 3-D, The Last Exorcism, The Next ThreeDays, and Why Did I Get Married Too?, which individually represented between 2% and 16% of total theatricalP&A and, in the aggregate, accounted for 93% of the total theatrical P&A. Approximately $58.7 million of P&Awas incurred on titles that generated less than 5% of theatrical revenue in the current period, of which$7.6 million was P&A incurred in advance for films to be released in subsequent quarters. Domestic theatricalP&A from the motion pictures segment in fiscal 2010 included P&A incurred on the release of Brothers,Daybreakers, From Paris With Love, Gamer, I Can Do Bad All By Myself, Saw VI, Precious, and Spy Next Door,which individually represented between 5% and 13% of total theatrical P&A and, in the aggregate, accounted forapproximately 79% of the total theatrical P&A. Approximately $48.0 million of P&A was incurred on titles thatdid not contribute significant revenue in fiscal 2010, of which $31.9 million was P&A related to titles released infiscal 2011 such as Kick-Ass, Killers, The Expendables, and Why Did I Get Married Too?.
Home entertainment distribution and marketing costs on motion pictures and television product in fiscal2011 of $203.8 million decreased $10.6 million, or 4.9%, compared to $214.4 million in fiscal 2010. Homeentertainment distribution and marketing costs as a percentage of home entertainment revenues was 29.5% and32.5% in fiscal 2011 and fiscal 2010, respectively. The decrease in home entertainment distribution andmarketing costs as a percentage of home entertainment revenues was primarily due to an increase in homeentertainment revenue from electronic media in fiscal 2011 as compared to fiscal 2010. In addition, the decreasewas also in part due to an increase in revenue associated with new releases in fiscal 2011, such as TheExpendables, which generated higher revenues in relation to marketing expense, as compared to fiscal 2010.
Lionsgate UK distribution and marketing expenses in the motion pictures segment in fiscal 2011 of$45.1 million increased from $31.1 million in fiscal 2010, primarily due to a higher number of theatrical releasesin fiscal 2011 as compared to fiscal 2010.
Media Networks includes transmission and marketing and promotion expenses from April 1, 2009 toMay 27, 2009.
70

General and Administrative Expenses
The following table sets forth general and administrative expenses by segment for the fiscal years endedMarch 31, 2011 and 2010:
YearEnded
March 31,2011
YearEnded
March 31,2010
Increase (Decrease)
Amount Percent
(Amounts in millions)
General and administrative expensesMotion Pictures . . . . . . . . . . . . . . . . . . . . . . . . . . . . . $ 48.4 $ 47.3 $ 1.1 2.3%Television Production . . . . . . . . . . . . . . . . . . . . . . . . 11.5 9.7 1.8 18.6%Shared services and corporate expenses, excludingitems below . . . . . . . . . . . . . . . . . . . . . . . . . . . . . . 56.2 55.3 0.9 1.6%
Total general and administrative expenses before stock-based compensation expense, shareholder activistmatter expenses, and Media Networks . . . . . . . . . . . . . 116.1 112.3 3.8 3.4%
Stock-based compensation expense . . . . . . . . . . . . . 32.4 18.8 13.6 72.3%Shareholder activist matter . . . . . . . . . . . . . . . . . . . . 22.9 5.8 17.1 294.8%Media Networks . . . . . . . . . . . . . . . . . . . . . . . . . . . . — 6.2 (6.2) (100.0%)
55.3 30.8 24.5 79.5%
Total general and administrative expenses . . . . . . . . . . . . $171.4 $143.1 $28.3 19.8%
Total general and administrative expenses as apercentage of revenue . . . . . . . . . . . . . . . . . . . . . . . . . . 10.8% 9.6%
General and administrative expenses excluding stock-based compensation expense, shareholder activistmatter expenses, and Media Networks, as a percentageof revenue . . . . . . . . . . . . . . . . . . . . . . . . . . . . . . . . . . . 7.3% 7.5%
Total General and Administrative Expenses
General and administrative expenses increased by $28.3 million, or 19.8%, as reflected in the table aboveand further discussed below.
Motion Pictures
General and administrative expenses of the motion pictures segment increased $1.1 million, or 2.3%, mainlydue to an increase in salary and related expenses. In fiscal 2011, $9.0 million of motion pictures productionoverhead was capitalized compared to $7.9 million in fiscal 2010.
Television Production
General and administrative expenses of the television production segment increased $1.8 million, or 18.6%,mainly due to an increase in salary and related expenses primarily associated with Debmar-Mercury. In fiscal2011, $4.3 million of television production overhead was capitalized compared to $5.0 million in fiscal 2010.
71

Shared Services and Corporate Expenses
Shared services and corporate expenses increased $31.6 million, or 39.5%, mainly due to an increase of$13.6 million of stock-based compensation, which includes $21.9 million associated with the immediate vestingof equity awards of certain executive officers triggered by the “change in control” provisions in their respectiveemployment agreements, an increase of $17.1 million of legal and professional fees associated with a shareholderactivist matter, and an increase of $0.9 million associated with other shared services and corporate expenses.
Stock-Based Compensation Expense. The following table sets forth stock-based compensation expenseincluded in our corporate segment for the fiscal years ended March 31, 2011 and 2010:
YearEnded
March 31,2011
YearEnded
March 31,2010
Increase (Decrease)
Amount Percent
(Amounts in millions)
Stock-Based Compensation Expense:Stock options . . . . . . . . . . . . . . . . . . . . . . . . . . . . . . . $ 2.6 $ 3.2 $ (0.6) (18.8%)Restricted share units and other share-basedcompensation . . . . . . . . . . . . . . . . . . . . . . . . . . . . . 26.0 14.4 11.6 80.6%
Stock appreciation rights . . . . . . . . . . . . . . . . . . . . . . 3.8 1.2 2.6 216.7%
$32.4 $18.8 $13.6 72.3%
At March 31, 2011, as disclosed in Note 16 to the audited consolidated financial statements, there wereunrecognized compensation costs of approximately $7.8 million related to stock options and restricted share unitspreviously granted, including annual installments of share grants that were subject to performance targets, whichwill be expensed over the remaining vesting periods. At March 31, 2011, 458,037 shares of restricted share unitshave been awarded to two key executive officers, the vesting of which will be subject to performance targets tobe set annually by the Compensation Committee of the Board of Directors of the Company. These restrictedshare units will vest in two annual installments assuming annual performance targets have been met. The fairvalue of the 458,037 shares, whose future annual performance targets have not been set, was $2.9 million, basedon the market price of the Company’s common shares as of March 31, 2011. The market value will bere-measured when the annual performance criteria are set and the value will be expensed over the remainingvesting periods once it becomes probable that the performance targets will be satisfied.
Depreciation, Amortization and Other Expenses (Income)
Depreciation and amortization of $5.8 million this period decreased $6.7 million from $12.5 million in fiscal2010, primarily associated with $3.2 million of depreciation and amortization recorded in fiscal 2010 from theMedia Networks segment prior to its deconsolidation.
72

Interest expense of $55.2 million in fiscal 2011 increased $8.0 million, or 16.9%, from $47.2 million infiscal 2010. The following table sets forth the components of interest expense for the fiscal years endedMarch 31, 2011 and 2010:
YearEnded
March 31,2011
YearEnded
March 31,2010
(Amounts in millions)
Interest ExpenseCash Based:
Senior revolving credit facility . . . . . . . . . . . . . . $ 6.8 $ 5.8Convertible senior subordinated notes . . . . . . . . 5.6 9.1Senior secured second priority notes . . . . . . . . . . 24.2 10.8Other . . . . . . . . . . . . . . . . . . . . . . . . . . . . . . . . . . 2.3 1.8
38.9 27.5
Non-Cash Based:Amortization of discount on liability componentof convertible senior subordinated notes . . . . 10.1 16.1
Amortization of discount on senior securedsecond priority notes . . . . . . . . . . . . . . . . . . . . 1.2 0.4
Amortization of deferred financing costs . . . . . . 5.0 3.2
16.3 19.7
$55.2 $47.2
Interest and other income was $1.7 million in fiscal 2011, compared to $1.5 million in fiscal 2010.
Loss on extinguishment of debt was $14.5 million in fiscal 2011, resulting from the July 2010 exchange andrelated conversion of approximately $36.0 million in aggregate principal amount of 3.625% Convertible SeniorSubordinated Notes (the “February 2005 3.625% Notes”) and approximately $63.7 million in aggregate principalamount of 2.9375% Convertible Senior Subordinated Notes (the “October 2004 2.9375% Notes”). This comparesto a gain of $5.7 million in fiscal 2010 resulting from the April 2009 exchange of $66.6 million of ourFebruary 2005 3.625% convertible senior subordinated notes, partially offset by a loss from the December 2009repurchase of a portion of the October 2004 2.9375% Notes and February 2005 3.625% Notes.
The following table represents our portion of the income or (loss) of our equity method investees based onour percentage ownership for the fiscal years ended March 31, 2011 and 2010:
March 31,2011
OwnershipPercentage
YearEnded
March 31,2011
YearEnded
March 31,2010
(Amounts in millions)
Horror Entertainment, LLC (“FEARnet”) . . . . . . . . . . 34.5% $ 0.7 $ (0.6)NextPoint, Inc. (“Break Media”) . . . . . . . . . . . . . . . . . . 42.0% (2.4) (0.8)Roadside Attractions, LLC . . . . . . . . . . . . . . . . . . . . . . 43.0% 0.8 (0.1)Studio 3 Partners, LLC (“EPIX”) (1) . . . . . . . . . . . . . . 31.2% (38.2) (26.6)TV Guide Network (2) . . . . . . . . . . . . . . . . . . . . . . . . . 51.0% (3.0) (0.1)Tiger Gate . . . . . . . . . . . . . . . . . . . . . . . . . . . . . . . . . . . 45.5% (1.8) —
$(43.9) $(28.2)
73

(1) We license certain of our theatrical releases and other films and television programs to EPIX. A portion ofthe profits of these licenses reflecting our ownership share in the venture are eliminated through anadjustment to the equity interest loss of the venture. These profits are recognized as they are realized by theventure. For the year ended March 31, 2011, the Company recognized $89.4 million of revenue and$48.8 million of gross profit on the licensing of films to EPIX. The equity interest loss for EPIX for the yearended March 31, 2011 includes $30.5 million, which represents our share of the EPIX losses of$98.0 million for the year ended December 31, 2010, and $15.2 million representing the elimination of ourshare of profits on sales to EPIX, reduced by the realization of a portion of the profits previously eliminatedon licenses to the venture of $7.5 million. EPIX expects to report net income of approximately $24 millionfor its quarter ended March 31, 2011, of which our pro rata share will be recorded in the quarter endedJune 30, 2011.
(2) We license certain films and/or television programs to TV Guide Network. A portion of the profits of theselicenses reflecting our ownership share in the venture are eliminated through an adjustment to the equityinterest loss of the venture. These profits are recognized as they are realized by the venture. For the yearended March 31, 2011, we recognized $14.9 million of revenue and $5.3 million of gross profit on thelicensing of television programs to TV Guide Network. The equity interest loss for TV Guide Network forthe year ended March 31, 2011 includes $14.6 million, which represents our share of the TV Guide Networklosses of $28.5 million for the year ended March 31, 2011, and $2.7 million representing the elimination ofour share of profits on sales to TV Guide Network, reduced by the realization of a portion of the profitspreviously eliminated on licenses to TV Guide Network of $0.2 million and our share of income from theaccretion of the dividend and discount on TV Guide Network’s redeemable preferred stock units of$14.1 million.
Income Tax Provision
We had an income tax expense of $4.3 million, or (8.6%), of loss before income taxes in fiscal 2011,compared to an expense of $1.2 million, or (6.7%), of loss before income taxes in fiscal 2010. The tax expensereflected in the current period is primarily attributable to deferred U.S. income taxes and foreign withholdingtaxes. Our actual annual effective tax rate will differ from the statutory federal rate as a result of several factors,including changes in the valuation allowance against net deferred tax assets, non-temporary differences, foreignincome taxed at different rates, and state and local income taxes. Income tax loss carryforwards, subject tocertain limitations that may prevent us from fully utilizing them, amount to approximately $179.0 million forU.S. federal income tax purposes available to reduce income taxes over twenty years, $123.5 million for U.S.state income tax purposes available to reduce income taxes over future years with varying expirations,$31.7 million for Canadian income tax purposes available to reduce income taxes over 20 years with varyingexpirations, and $6.8 million for UK income tax purposes available indefinitely to reduce future income taxes.
Net Loss
Net loss for the fiscal year ended March 31, 2011 was $53.6 million, or basic and diluted net loss percommon share of $0.41 on 131.2 million weighted average common shares outstanding. This compares to netloss for the fiscal year ended March 31, 2010 of $19.5 million, or basic and diluted net loss per common share of$0.17 on 117.5 million weighted average common shares outstanding.
74

Fiscal 2010 Compared to Fiscal 2009
The following table sets forth the components of consolidated revenue by segment for the fiscal years endedMarch 31, 2010 and 2009:
YearEnded
March 31,2010
YearEnded
March 31,2009
Increase (Decrease)
Amount Percent
(Amounts in millions)
Consolidated RevenueMotion Pictures . . . . . . . . . . . . $1,119.3 $1,233.9 $(114.6) (9.3%)Television Production . . . . . . . . 350.9 222.2 128.7 57.9%Media Networks . . . . . . . . . . . . 19.3 10.3 9.0 87.4%
$1,489.5 $1,466.4 $ 23.1 1.6%
Our largest component of revenue comes from home entertainment. The following table sets forth totalhome entertainment revenue for both the Motion Pictures and Television Production reporting segments for thefiscal years ended March 31, 2010 and 2009:
YearEnded
March 31,2010
YearEnded
March 31,2009
Increase (Decrease)
Amount Percent
(Amounts in millions)
Home Entertainment Revenue (1)Motion Pictures . . . . . . . . . . . . $591.4 $694.2 $(102.8) (14.8%)Television Production . . . . . . . . 67.8 34.9 32.9 94.3%
$659.2 $729.1 $ (69.9) (9.6%)
(1) See reclassification footnote under the table in the Motion Pictures Revenue discussion below.
Motion Pictures Revenue
The following table sets forth the components of revenue and the changes in these components for themotion pictures reporting segment for the fiscal years ended March 31, 2010 and 2009:
Year YearEnded Ended
March 31, March 31, Increase (Decrease)
2010 2009 Amount Percent
(Amounts in millions)
Motion PicturesTheatrical . . . . . . . . . . . . . . . . . . . . . . . . . . . . . . . . . . . . . . . . . . . . . $ 139.4 $ 223.3 $ (83.9) (37.6%)Home Entertainment (1) . . . . . . . . . . . . . . . . . . . . . . . . . . . . . . . . . . 591.4 694.2 (102.8) (14.8%)Television (1) . . . . . . . . . . . . . . . . . . . . . . . . . . . . . . . . . . . . . . . . . . 135.8 116.8 19.0 16.3%International . . . . . . . . . . . . . . . . . . . . . . . . . . . . . . . . . . . . . . . . . . . 73.4 81.6 (8.2) (10.0%)Lionsgate UK . . . . . . . . . . . . . . . . . . . . . . . . . . . . . . . . . . . . . . . . . . 74.3 60.7 13.6 22.4%Mandate Pictures . . . . . . . . . . . . . . . . . . . . . . . . . . . . . . . . . . . . . . . 99.1 45.5 53.6 117.8%Other . . . . . . . . . . . . . . . . . . . . . . . . . . . . . . . . . . . . . . . . . . . . . . . . . 5.9 11.8 (5.9) (50.0%)
$1,119.3 $1,233.9 $(114.6) (9.3%)
75

(1) For the years ended March 31, 2010 and 2009, $51.0 million and $53.5 million, respectively, ofpay-per-view and video-on-demand revenue was reclassified from Television revenue to HomeEntertainment revenue in order to be consistent with the current year presentation.
Motion Pictures — Theatrical Revenue
The following table sets forth the titles contributing significant motion pictures theatrical revenue by fiscalyears theatrical slate and the month of their release for the fiscal years ended March 31, 2010 and 2009:
Year Ended March 31,2010 2009
Theatrical Release Date Theatrical Release Date
Fiscal 2010 Theatrical Slate: Fiscal 2009 Theatrical Slate:From Paris With Love February 2010 The Haunting in Connecticut March 2009Daybreakers January 2010 Madea Goes to Jail February 2009Spy Next Door January 2010 My Bloody Valentine 3-D January 2009Brothers December 2009 Transporter 3 November 2008Precious November 2009 Saw V October 2008Saw VI October 2009 W. October 2008Gamer September 2009 The Family That Preys September 2008I Can Do Bad All By Myself September 2009 The Forbidden Kingdom April 2008
Fiscal 2009 Theatrical Slate:The Haunting in Connecticut March 2009
Theatrical revenue of $139.4 million decreased $83.9 million, or 37.6%, in fiscal 2010 as compared to fiscal2009. The decrease in theatrical revenue in fiscal 2010 as compared to fiscal 2009 is due to only 10 theatricalreleases in the current fiscal year compared to 16 in the prior fiscal year.
Motion Pictures — Home Entertainment Revenue
The following table sets forth the titles contributing significant motion pictures home entertainment revenuefor the fiscal year ended March 31, 2010 and 2009:
Year Ended March 31,2010 2009
DVD Release Date DVD Release Date
Fiscal 2010 Theatrical Slate: Fiscal 2009 Theatrical Slate:Brothers March 2010 Punisher: War Zone March 2009Precious March 2010 Transporter 3 March 2009Gamer January 2010 Bangkok Dangerous January 2009I Can Do Bad All By Myself January 2010 My Best Friend’s Girl January 2009Saw VI January 2010 Saw V January 2009Crank: High Voltage September 2009 The Family That Preys January 2009
The Forbidden Kingdom September 2008Fiscal 2009 Theatrical Slate:
The Haunting In Connecticut July 2009 Fiscal 2008 Theatrical Slate:Madea Goes to Jail June 2009 Meet the Browns July 2008My Bloody Valentine 3-D May 2009 The Bank Job July 2008New In Town May 2009 The Eye June 2008The Spirit April 2009 Witless Protection June 2008
Rambo May 2008
76

The following table sets forth the components of home entertainment revenue by product category for thefiscal years ended March 31, 2010 and 2009:
Year Ended March 31,
2010 2009
PackagedMedia
ElectronicMedia Total
PackagedMedia
ElectronicMedia Total
(Amounts in millions)
Home entertainment revenues (1)Fiscal 2010 Theatrical Slate . . . . . . . . . . . . . . $113.1 $ 5.8 $118.9 $ — $ — $ —Fiscal 2009 Theatrical Slate . . . . . . . . . . . . . . 129.9 41.2 171.1 173.6 5.0 178.6Fiscal 2008 & Prior Theatrical Slate . . . . . . . . 35.8 4.0 39.8 198.4 38.9 237.3Direct-to-DVD, acquired and licensed brands,acquired library & other . . . . . . . . . . . . . . . 225.2 14.8 240.0 254.4 14.1 268.5
Other . . . . . . . . . . . . . . . . . . . . . . . . . . . . . . . . 19.5 2.1 21.6 8.5 1.3 9.8
$523.5 $67.9 $591.4 $634.9 $59.3 $694.2
(1) See reclassification footnote (1) under the table in the Motion Pictures Revenue discussion above.
Home entertainment revenue of $591.4 million decreased $102.8 million, or 14.8%, in fiscal 2010 ascompared to fiscal 2009. The decrease in home entertainment revenue in fiscal 2010 compared to fiscal 2009 isprimarily due to fewer theatrical releases in fiscal 2010 as compared to fiscal 2009, resulting in lower revenuesfrom theatrical slates, and the impact of the overall reduction of consumer spending on home entertainmentproducts.
Motion Pictures — Television Revenue
The following table sets forth the titles contributing significant motion pictures television revenue for thefiscal years ended March 31, 2010 and 2009:
Year Ended March 31,
2010 2009
Fiscal 2009 Theatrical Slate: Fiscal 2009 Theatrical Slate:Madea Goes to Jail The Forbidden KingdomMy Bloody Valentine 3-D Fiscal 2008 Theatrical Slate:Saw V 3:10 to YumaThe Family That Preys Good Luck ChuckThe Haunting In Connecticut Meet the BrownsTransporter 3 RamboW. Saw IV
Fiscal 2008 Theatrical Slate: The Bank JobWhy Did I Get Married? — Feature The Eye
Why Did I Get Married? — Feature
77

The following table sets forth the components of television revenue by product category for the fiscal yearsended March 31, 2010 and 2009:
Year EndedMarch 31, 2010
2010 2009
(Amounts in millions)
Television revenues (1)Fiscal 2010 Theatrical Slate . . . . . . . . . . . . . . . . . . . . . . . $ 3.5 $ —Fiscal 2009 Theatrical Slate . . . . . . . . . . . . . . . . . . . . . . . 89.0 9.6Fiscal 2008 & Prior Theatrical Slate . . . . . . . . . . . . . . . . . 26.8 92.7Direct-to-DVD, acquired and licensed brands, acquiredlibrary & other . . . . . . . . . . . . . . . . . . . . . . . . . . . . . . . . 13.5 12.8
Other . . . . . . . . . . . . . . . . . . . . . . . . . . . . . . . . . . . . . . . . . 3.0 1.7$135.8 $116.8
(1) See reclassification footnote (1) under the table in the Motion Pictures Revenue discussion above.
Television revenue included in motion pictures revenue of $135.8 million increased $19.0 million, or 16.3%in fiscal 2010 as compared to fiscal 2009. The contribution of television revenue from the titles listed abovedecreased $9.9 million in fiscal 2010 compared to fiscal 2009, and the contribution of television revenue fromthe titles not listed above increased $28.8 million in fiscal 2010 compared to fiscal 2009.
Motion Pictures — International Revenue
The following table sets forth the titles contributing significant motion pictures international revenue for thefiscal year ended March 31, 2010 and 2009:
Year Ended March 31,
2010 2009
Fiscal 2010 Theatrical Slate: Fiscal 2009 Theatrical Slate:Brothers My Best Friend’s GirlSaw VI Punisher: War Zone
Fiscal 2009 Theatrical Slate: Saw VMy Bloody Valentine 3-D Fiscal 2008 Theatrical Slate:Saw V The Eye
Saw IV
The following table sets forth the components of international revenue by product category for the fiscalyears ended March 31, 2010 and 2009:
Year EndedMarch 31, 2010
2010 2009
(Amounts in millions)
International revenues . . . . . . . . . . . . . . . . . . . . . . . . . . . . . . . . . .Fiscal 2011 Theatrical Slate . . . . . . . . . . . . . . . . . . . . . . . . . $ 0.3 $ —Fiscal 2010 Theatrical Slate . . . . . . . . . . . . . . . . . . . . . . . . . 21.9 —Fiscal 2009 Theatrical Slate . . . . . . . . . . . . . . . . . . . . . . . . . 16.0 27.8Fiscal 2008 & Prior Theatrical Slate . . . . . . . . . . . . . . . . . . . 11.3 29.3Direct-to-DVD, acquired and licensed brands, acquiredlibrary & other . . . . . . . . . . . . . . . . . . . . . . . . . . . . . . . . . 17.9 18.3
Other . . . . . . . . . . . . . . . . . . . . . . . . . . . . . . . . . . . . . . . . . . . 6.0 6.2
$73.4 $81.6
78

International revenue included in motion pictures revenue of $73.4 million decreased $8.2 million, or10.0%, in fiscal 2010 as compared to fiscal 2009. The decrease in international revenue in fiscal 2010 comparedto fiscal 2009 is mainly due to a decrease in revenues from the theatrical slates, and a decrease in revenues fromdirect-to-DVD, acquired and licensed brands, acquired library and other products in fiscal 2010 compared tofiscal 2009.
Motion Pictures — Lionsgate UK Revenue
The following table sets forth the titles contributing significant Lionsgate UK revenue for the fiscal yearended March 31, 2010 and 2009:
Year Ended March 31,
2010 2009
Fiscal 2010 Theatrical Slate: Fiscal 2009 Theatrical Slate:Saw VI My Bloody Valentine 3-D
Fiscal 2009 Theatrical Slate: Saw VMy Bloody Valentine 3-D Fiscal 2008 Theatrical Slate:
LGUK Theatrical Slate: Saw IVHarry Brown The Bank JobThe Hurt Locker LGUK Theatrical Slate:
Other: Righteous KillDrag Me To Hell
The following table sets forth the components of Lionsgate UK revenue by product category for the fiscalyears ended March 31, 2010 and 2009:
Year EndedMarch 31, 2010
2010 2009
(Amounts in millions)
Lionsgate UK revenues . . . . . . . . . . . . . . . . . . . . . . . . . . . . . . . . .Fiscal 2010 Theatrical Slate . . . . . . . . . . . . . . . . . . . . . . . . . $10.4 $ —Fiscal 2009 Theatrical Slate . . . . . . . . . . . . . . . . . . . . . . . . . 10.0 17.4Fiscal 2008 & Prior Theatrical Slate . . . . . . . . . . . . . . . . . . . 8.9 21.3Lionsgate UK and third party product . . . . . . . . . . . . . . . . . 25.2 15.9Direct-to-DVD, acquired and licensed brands, acquiredlibrary & other . . . . . . . . . . . . . . . . . . . . . . . . . . . . . . . . . 12.3 5.1
Other . . . . . . . . . . . . . . . . . . . . . . . . . . . . . . . . . . . . . . . . . . . 7.5 1.0
$74.3 $60.7
Lionsgate UK revenue of $74.3 million increased $13.6 million, or 22.4%, in fiscal 2010 as compared tofiscal 2009. The increase in Lionsgate UK revenue in fiscal 2010 compared to fiscal 2009 is mainly due tostronger performance of theatrical releases in the United Kingdom for titles such as Hurt Locker and Drag Me ToHell in fiscal 2010 as compared to fiscal 2009. The contribution of Lionsgate UK revenue from the titles listedabove increased $5.4 million in fiscal 2010 compared to fiscal 2009, and the contribution of Lionsgate UKrevenue from the titles not listed in the table above increased $8.2 million in fiscal 2010 compared to fiscal 2009.
79

Motion Pictures — Mandate Pictures Revenue
The following table sets forth the titles contributing significant Mandate Pictures revenue for the fiscal yearsended March 31, 2010 and 2009:
Year Ended March 31,
2010 2009
Drag Me To Hell 30 Days of NightHorsemen Harold and Kumar Escape from Guantanamo BayJuno JunoPassengers Nick and Norah’s Infinite PlaylistWhip It Passengers
Mandate Pictures revenue includes revenue from the sales and licensing of domestic and worldwide rightsof titles developed or acquired by Mandate Pictures to third-party distributors or international sub-distributors.Mandate Pictures revenue of $99.1 million increased $53.6 million, or 117.8%, in fiscal 2010 as compared tofiscal 2009. The increase in Mandate Pictures revenue in fiscal 2010 compared to fiscal 2009 is mainly due to thehigher contribution of Mandate Pictures revenue from titles listed above, in particular from Drag Me To Hell infiscal 2010 as compared to fiscal 2009.
Television Production Revenue
Television production revenue of $350.9 million, increased $128.7 million, or 57.9%, in fiscal 2010 ascompared to fiscal 2009. The following table sets forth the components and the changes in the components ofrevenue that make up television production revenue for the fiscal year ended March 31, 2010 and 2009:
YearEnded
March 31,
YearEnded
March 31, Increase (Decrease)
2010 2009 Amount Percent
(Amounts in millions)
Television ProductionDomestic series licensing . . . . . . . . . . . . . . . . . . . . .
Lionsgate Television . . . . . . . . . . . . . . . . . . . . . $128.8 $ 79.2 $ 49.6 62.6%Debmar-Mercury . . . . . . . . . . . . . . . . . . . . . . . . 92.2 59.1 33.1 56.0%Ish Entertainment . . . . . . . . . . . . . . . . . . . . . . . . 19.0 23.4 (4.4) (18.8%)
Total domestic series licensing . . . . . . . . . . . . . . . . . 240.0 161.7 78.3 48.4%International . . . . . . . . . . . . . . . . . . . . . . . . . . . . . . . . 42.3 24.9 17.4 69.9%Home entertainment releases of televisionproduction . . . . . . . . . . . . . . . . . . . . . . . . . . . . . . . 67.8 34.9 32.9 94.3%
Other . . . . . . . . . . . . . . . . . . . . . . . . . . . . . . . . . . . . . 0.8 0.7 0.1 14.3%
$350.9 $222.2 $128.7 57.9%
Revenues included in domestic series licensing from Lionsgate Television increased in fiscal 2010 due to anincrease in episodes of programming delivered, and higher revenue generated per episode delivered in fiscal2010 compared to fiscal 2009.
80

The following table sets forth the number of television episodes and hours delivered included in LionsgateTelevision domestic series licensing revenue in the fiscal year ended March 31, 2010 and 2009, respectively:
Year EndedMarch 31, 2010
Episodes Hours
Nurse Jackie Season 2 . . . . . . . . . . . . . . . . . . . . . . . . . . . . . . . . . 1/2hr 12 6.0Nurse Jackie Season 1 . . . . . . . . . . . . . . . . . . . . . . . . . . . . . . . . . 1/2hr 12 6.0Blue Mountain State Season 1 . . . . . . . . . . . . . . . . . . . . . . . . . . . 1/2hr 13 6.5Weeds Season 5 . . . . . . . . . . . . . . . . . . . . . . . . . . . . . . . . . . . . . . 1/2hr 13 6.5Crash TV Series Season 2 . . . . . . . . . . . . . . . . . . . . . . . . . . . . . . 1hr 13 13.0Mad Men Season 3 . . . . . . . . . . . . . . . . . . . . . . . . . . . . . . . . . . . . 1hr 13 13.0
76 51.0
Year EndedMarch 31, 2009
Episodes Hours
Weeds Season 4 . . . . . . . . . . . . . . . . . . . . . . . . . . . . . . . . . . . . . . 1/2hr 13 6.5Fear Itself . . . . . . . . . . . . . . . . . . . . . . . . . . . . . . . . . . . . . . . . . . 1hr 13 13.0Crash TV Series Season 1 . . . . . . . . . . . . . . . . . . . . . . . . . . . . . . 1hr 13 13.0Mad Men Season 2 . . . . . . . . . . . . . . . . . . . . . . . . . . . . . . . . . . . 1hr 13 13.0Scream Queens . . . . . . . . . . . . . . . . . . . . . . . . . . . . . . . . . . . . . . 1hr 8 8.0Pilots . . . . . . . . . . . . . . . . . . . . . . . . . . . . . . . . . . . . . . . . . . . . . . 1/2hr 2 1.0
62 54.5
Revenues included in domestic series licensing from Debmar-Mercury increased in fiscal 2010 due toincreased revenue from the television series House of Payne, Meet the Browns, The Wendy Williams Show, andFamily Feud.
Revenues included in domestic series licensing from our reality television collaboration with IshEntertainment Inc. (“Ish”), resulted primarily from the production of the domestic series Paris Hilton’s My NewBFF, and My Antonio.
International revenue increased in fiscal 2010 due to revenue from Mad Men Season 3, Crash Season 1,Dead Zone Season 1, and Fear Itself, and international revenue in fiscal 2009 includes revenue from Mad MenSeason 1 and Season 2, Paris Hilton’s British Best Friend, Weeds Season 3 and Season 4, Wildfire Season 4, andThe Kill Point.
The increase in revenue from home entertainment releases of television production is primarily driven byDVD/Blu-ray revenue from Weeds Season 4 and Season 5 (released June 2009 and January 2010, respectively),and Mad Men Season 2 and Season 3 (released July 2009 and March 2010, respectively).
Media Networks Revenue
Media Networks revenue was $19.3 million in fiscal 2010 for the period from April 1, 2009 to May 27,2009 compared to $10.3 million in fiscal 2009 for the period from the acquisition date of February 28, 2009 toMarch 31, 2009. The results of operations of TV Guide Network are included in the Company’s consolidatedresults from February 28, 2009 through May 27, 2009. A portion of the entity was sold on May 28, 2009.Subsequent to the sale of TV Guide Network, and pursuant to the new accounting guidance for accounting forvariable interest entities, effective April 1, 2010 which the Company has retrospectively applied, the Company’sinterest in TV Guide Network is being accounted for under the equity method of accounting.
81

Direct Operating Expenses
The following table sets forth direct operating expenses by segment for the fiscal year ended March 31,2010 and 2009:
Year EndedMarch 31, 2010
Year EndedMarch 31, 2009
MotionPictures
TelevisionProduction
MediaNetworks Total
MotionPictures
TelevisionProduction
MediaNetworks Total
(Amounts in millions)
Direct operating expensesAmortization of filmsand televisionprograms . . . . . . . . . . . $302.0 $202.4 $ 7.3 $511.7 $329.2 $125.7 $ 3.8 $458.7
Participation and residualexpense . . . . . . . . . . . . 188.8 75.9 0.2 264.9 279.0 49.3 — 328.3
Other expenses . . . . . . . . 0.8 0.7 (0.1) 1.4 5.1 1.8 (0.1) 6.8
$491.6 $279.0 $ 7.4 $778.0 $613.3 $176.8 $ 3.7 $793.8
Direct operating expenses as apercentage of segmentrevenues . . . . . . . . . . . . . . . 43.9% 79.5% 38.3% 52.2% 49.7% 79.6% 35.9% 54.1%
Direct operating expenses of the motion pictures segment of $491.6 million for fiscal 2010 were 43.9% ofmotion pictures revenue, compared to $613.3 million, or 49.7%, of motion pictures revenue for fiscal 2009. Thedecrease in direct operating expense of the motion pictures segment in fiscal 2010 as a percent of revenue is dueprimarily to a fiscal 2009 charge for a home entertainment library distribution contract of family entertainmenttitles, and a decrease in investment in film write-downs for fiscal 2010, partially offset by an increase in directoperating expenses as a percentage of revenue attributed to Mandate Pictures in fiscal 2010. Direct operatingexpenses of Mandate Pictures are higher in relation to revenue as compared to the rest of the motion picturessegment, however, Mandate Pictures does not incur significant distribution and marketing expenses. Investmentin film write-downs of the motion picture segment totaled approximately $12.5 million for fiscal 2010, comparedto $37.3 million for 2009. Also, in fiscal 2009, we recorded a charge of $36.1 million for a participation reservein connection with a home entertainment library distribution contract of family entertainment titles entered intoin fiscal 2009 due to the actual and expected future underperformance of the titles in this library. The fiscal 2010write-downs included write-downs on two titles over $1.0 million which aggregated $7.4 million. The fiscal 2009write-downs included write-downs on six titles over $1.0 million which aggregated $26.9 million of the totalcharges due to the lower than anticipated performance of six titles and $5.1 million of write-downs of filmlibraries acquired due to the underperformance of those libraries. Other expenses consist of the provision fordoubtful accounts and foreign exchange gains and losses. The provision for doubtful accounts decreased from$3.7 million in fiscal 2009 to $1.4 million in fiscal 2010. Foreign exchange gains and losses included a loss of$3.1 million in fiscal 2009 to a gain of less than $0.1 million in fiscal 2010 due to changes in exchange rates.
Direct operating expenses of the television production segment of $279.0 million for fiscal 2010 were79.5% of television revenue, compared to $176.8 million, or 79.6%, of television revenue for fiscal 2009. Theincrease in direct operating expense of the television production segment in fiscal 2010 is due to the increase intelevision production revenue in fiscal 2010 as compared to fiscal 2009. In fiscal 2010, $12.6 million of chargesfor costs incurred in excess of contracted revenues for episodic television series or write-downs of television filmcosts were included in the amortization of television programs, compared to $9.1 million in fiscal 2009. Thefiscal 2010 write-downs included write-downs on five titles over $1.0 million which aggregated $10.5 million, ofwhich $4.9 million related to one television series. The fiscal 2009 write-downs included write-downs on fourtitles over $1.0 million which aggregated $7.7 million.
82

Direct operating expenses of the media networks segment in fiscal 2010 were for the period from April 1,2009 to May 27, 2009, and in fiscal 2009 were for the period from the acquisition date of February 28, 2009 toMarch 31, 2009. Direct operating expenses of $7.4 million for fiscal 2010 consists primarily of programmingexpenses associated with the production of such programs as Idol Tonight and Hollywood 411.
Distribution and Marketing Expenses
The following table sets forth distribution and marketing expenses by segment for the fiscal year endedMarch 31, 2010 and 2009:
Year EndedMarch 31, 2010
Year EndedMarch 31, 2009
MotionPictures
TelevisionProduction
MediaNetworks Total
MotionPictures
TelevisionProduction
MediaNetworks Total
(Amounts in millions)
Distribution and marketingexpensesTheatrical . . . . . . . . . . . . . . . $237.6 $ 0.2 $— $237.8 $330.5 $ — $— $330.5Home Entertainment (1) . . . . 195.7 18.7 — 214.4 258.6 10.5 — 269.1Television (1) . . . . . . . . . . . . 0.9 8.5 — 9.4 1.8 10.4 — 12.2International . . . . . . . . . . . . . 4.7 3.7 — 8.4 6.3 3.8 — 10.1Lionsgate UK . . . . . . . . . . . . 31.1 1.1 — 32.2 42.4 0.5 — 42.9Media Networks . . . . . . . . . . — — 2.0 2.0 — — 1.9 1.9Other . . . . . . . . . . . . . . . . . . . 1.7 0.3 — 2.0 2.1 0.8 — 2.9
$471.7 $32.5 $ 2.0 $506.2 $641.7 $26.0 $ 1.9 $669.6
(1) For the years ended March 31, 2010 and 2009, $3.0 million and $3.2 million, respectively, of pay-per-viewand video-on-demand distribution and marketing expenses were reclassified from Television to HomeEntertainment distribution and marketing expenses in order to be consistent with the current yearpresentation.
The majority of distribution and marketing expenses relate to the motion pictures segment. Theatrical P&Ain the motion pictures segment in fiscal 2010 of $237.6 million decreased $92.9 million, or 28.1%, compared to$330.5 million in fiscal 2009. The decrease is driven by the lower number of theatrical releases in fiscal 2010 ascompared to fiscal 2009. Domestic theatrical P&A from the motion pictures segment in fiscal 2010 includedP&A incurred on the release of Brothers, Daybreakers, From Paris With Love, Gamer, I Can Do Bad All ByMyself, Saw VI, Precious, and Spy Next Door, which individually represented between 5% and 13% of totaltheatrical P&A and, in the aggregate, accounted for approximately 79% of the total theatrical P&A.Approximately $48.0 million of P&A was incurred on titles that did not contribute significant revenue in fiscal2010, of which $31.9 million was P&A related to titles to be released in the future such as Kick-Ass, Killers, TheExpendables, and Why Did I Get Married Too?. Domestic theatrical P&A from the motion pictures segment infiscal 2009 included P&A incurred on the release of Bangkok Dangerous, Disaster Movie, Madea Goes to Jail,My Best Friend’s Girl, My Bloody Valentine 3-D, New In Town, Punisher: War Zone, Saw V, The Family ThatPreys, The Haunting in Connecticut, The Spirit and Transporter 3, which individually represented between 5%and 9% of total theatrical P&A and, in the aggregate, accounted for 89% of the total theatrical P&A.Approximately $167.1 million of P&A was incurred on titles that did not contribute significant revenue in fiscal2009, of which $4.6 million was P&A related to titles to be released in the future, such as Crank: High Voltageand Precious.
83

Home entertainment distribution and marketing costs on motion pictures and television production in fiscal2010 of $214.4 million decreased $54.7 million, or 20.3%, compared to $269.1 million in fiscal 2009. Thedecrease in home entertainment distribution and marketing costs is mainly due to the decrease in revenue infiscal 2010 as compared to fiscal 2009. Home entertainment distribution and marketing costs as a percentage ofhome entertainment revenues was 32.5% and 36.9% in fiscal 2010 and fiscal 2009, respectively. The decrease indistribution and marketing costs as a percentage of home entertainment revenues was mainly due to lowermarketing expenses as a percentage of revenue incurred in fiscal 2010 as compared to 2009.
Lionsgate UK distribution and marketing expenses in the motion pictures segment in fiscal 2010 of$31.1 million decreased from $42.4 million in fiscal 2009, due to fewer theatrical releases in fiscal 2010 ascompared to fiscal 2009.
Media Networks distribution and marketing expenses in fiscal 2010 were for the period from April 1, 2009to May 27, 2009 and in fiscal 2009 were for the period from the acquisition date of February 28, 2009 toMarch 31, 2009, and include transmission marketing and promotion expenses.
General and Administrative Expenses
The following table sets forth general and administrative expenses by segment for the fiscal years endedMarch 31, 2010 and 2009:
YearEnded
March 31,2010
YearEnded
March 312009
Increase (Decrease)
Amount Percent
(Amounts in millions)
General and administrative expensesMotion Pictures . . . . . . . . . . . . . . . . . . . . . . . . . . . . . $ 47.3 $ 49.6 $ (2.3) (4.6%)Television Production . . . . . . . . . . . . . . . . . . . . . . . . 9.7 13.1 (3.4) (26.0%)Shared services and corporate expenses, excludingitems below . . . . . . . . . . . . . . . . . . . . . . . . . . . . . . 55.3 59.3 (4.0) (6.7%)
Total general and administrative expenses beforestock-based compensation expense, shareholderactivist matter expenses, and Media Networks . . . . . . . 112.3 122.0 (9.7) (8.0%)
Stock-based compensation expense . . . . . . . . . . . . . 18.8 9.8 9.0 91.8%Shareholder activist matter . . . . . . . . . . . . . . . . . . . . 5.8 1.0 4.8 NMMedia Networks . . . . . . . . . . . . . . . . . . . . . . . . . . . . 6.2 3.8 2.4 63.2%
30.8 14.6 16.2 111.0%
Total general and administrative expenses . . . . . . . . . . . . $143.1 $136.6 $ 6.5 4.8%
Total general and administrative expenses as apercentage of revenue . . . . . . . . . . . . . . . . . . . . . . . . . . 9.6% 9.3%
General and administrative expenses excluding stock-based compensation expense, shareholder activistmatter expenses, and Media Networks, as a percentageof revenue . . . . . . . . . . . . . . . . . . . . . . . . . . . . . . . . . . . 7.5% 8.3%
NM— Percentage not meaningful
Total General and Administrative Expenses
General and administrative expenses increased by $6.5 million, or 4.8%, as reflected in the table above andfurther discussed below.
84

Motion Pictures
General and administrative expenses of the motion pictures segment decreased $2.3 million, or 4.6%,mainly due to a decrease in other general overhead such as travel and entertainment expenses and facilityexpenses. In fiscal 2010, $7.9 million of motion pictures overhead was capitalized compared to $7.7 million infiscal 2009.
Television Production
General and administrative expenses of the television production segment decreased $3.4 million, or 26.0%,mainly due to decreases in professional and consulting fees associated with Tiger Gate, our Asian televisionchannel joint venture, and to other general overhead decreases. In fiscal 2010, $5.0 million of televisionproduction overhead was capitalized compared to $5.8 million in fiscal 2009.
Media Networks
Media Networks general and administrative expenses in fiscal 2010 were for the period from April 1, 2009to May 27, 2009 and in fiscal 2009 were for the period from the acquisition date of February 28, 2009 toMarch 31, 2009.
Shared Services and Corporate Expenses
Shared services and corporate expenses increased $9.8 million, or 14.0%, mainly due to $4.8 million oflegal and professional fees associated with a shareholder activist matter and increases in stock-basedcompensation, partially offset by decreases in other professional fees, rent and facility expenses, andcompensation expenses.
Stock-Based Compensation Expense. The following table sets forth stock-based compensation expense(benefit) included in unallocated shared services and corporate expenses for the years ended March 31, 2010 and2009:
YearEnded
March 31,2010
YearEnded
March 312009
Increase (Decrease)
Amount Percent
(Amounts in millions)
Stock-Based Compensation Expense:Stock options . . . . . . . . . . . . . . . . . . . . . . . . . . . . . . . $ 3.2 $ 3.2 $— 0.0%Restricted share units and other share-basedcompensation . . . . . . . . . . . . . . . . . . . . . . . . . . . . . 14.4 10.1 4.3 42.6%
Stock appreciation rights . . . . . . . . . . . . . . . . . . . . . . 1.2 (3.5) 4.7 (134.3%)
$18.8 $ 9.8 $ 9.0 91.8%
At March 31, 2010, there were unrecognized compensation costs of approximately $16.8 million related tostock options and restricted share units previously granted, including annual installments of share grants thatwere subject to performance targets, which will be expensed over the remaining vesting periods. At March 31,2010, 894,554 shares of restricted share units have been awarded to four key executive officers, the vesting ofwhich will be subject to performance targets to be set annually by the Compensation Committee of the Board ofDirectors of the Company. These restricted share units will vest in three, four, and five annual installmentsassuming annual performance targets have been met. The fair value of the 894,554 shares, whose future annualperformance targets have not been set, was $5.6 million, based on the market price of the Company’s commonshares as of March 31, 2010. The market value will be re-measured when the annual performance criteria are setand the value will be expensed over the remaining vesting periods once it becomes probable that the performancetargets will be satisfied.
85

Depreciation, Amortization and Other Expenses (Income)
Depreciation and amortization of $12.5 million in fiscal 2010 increased $4.8 million, or 62.3%, from$7.7 million in fiscal 2009, primarily associated with $3.2 million of depreciation and amortization recorded infiscal 2010 from the Media Networks segment prior to its deconsolidation.
Interest expense of $47.2 million in fiscal 2010 increased $12.9 million, or 37.6%, from $34.3 million infiscal 2009. The following table sets forth the components of interest expense for the years ended March 31,2010 and 2009:
YearEnded
March 31,2010
YearEnded
March 312009
(Amounts in millions)
Interest ExpenseCash Based:
Senior revolving credit facility . . . . . . . . . . . . . . $ 5.8 $ 2.9Convertible senior subordinated notes . . . . . . . . . 9.1 10.6Senior secured second priority notes . . . . . . . . . . 10.8 —Other . . . . . . . . . . . . . . . . . . . . . . . . . . . . . . . . . . . 1.8 1.6
27.5 15.1
Non-Cash Based:Amortization of discount on liability componentof convertible senior subordinated notes . . . . . 16.1 15.5
Amortization of discount on senior securedsecond priority notes . . . . . . . . . . . . . . . . . . . . 0.4 —
Amortization of deferred financing costs . . . . . . 3.2 3.7
19.7 19.2
$47.2 $34.3
Interest expense increased in fiscal 2010 due to additional interest expense related to the Senior Notes issuedin fiscal 2010, and higher average outstanding balances under our senior revolving credit facility, as compared tothe average outstanding balance of fiscal 2009.
Interest and other income was $1.5 million in fiscal 2010, compared to $5.8 million in fiscal 2009. Interestand other income in fiscal 2010 was earned on the cash balance and restricted investments held during the fiscalyear ended March 31, 2010.
Gain on extinguishment of debt was $5.7 million for fiscal 2010, resulting primarily from the April 2009gain on the exchange of $66.6 million of the Company’s 3.625% convertible senior subordinated notes offsetslightly by losses resulting from the December 2009 repurchase of $40.0 million of the October 2004 2.9375%Notes and $39.9 million of the February 2005 3.625% Notes. This compares to a gain on extinguishment of debtof $3.0 million in fiscal 2009, resulting from the December 2008 repurchase of $9.0 million of the Company’s3.625% convertible senior subordinated notes.
86

The following table represents our portion of the income or (loss) of our equity method investees based onour percentage ownership for the years ended March 31, 2010 and 2009:
March 31,2010
OwnershipPercentage
YearEnded
March 312010
YearEnded
March 312009
(Amounts in millions)
Horror Entertainment, LLC (“FEARnet”) . . . . . . . . . . . 33.3% $ (0.6) $(5.3)NextPoint, Inc. (“Break Media”) . . . . . . . . . . . . . . . . . . 42.0% (0.8) (2.6)Roadside Attractions, LLC . . . . . . . . . . . . . . . . . . . . . . . 43.0% (0.1) (0.1)Studio 3 Partners, LLC (“EPIX”) (1) . . . . . . . . . . . . . . . 31.2% (26.6) (1.0)TV Guide Network (2) . . . . . . . . . . . . . . . . . . . . . . . . . . 51.0% (0.1) —
$(28.2) $(9.0)
(1) We license certain of our theatrical releases and other films and television programs to EPIX. A portion ofthe profits of these licenses reflecting our ownership share in the venture are eliminated through anadjustment to the equity interest loss of the venture. These profits are recognized as they are realized by theventure. For the year ended March 31, 2010, the Company recognized $38.6 million of revenue and$26.3 million of gross profit on the licensing of films to EPIX. The equity interest loss for EPIX for the yearended March 31, 2010 includes $18.8 million, which represents our share of the EPIX losses of$61.5 million for the year ended December 31, 2009, and $8.1 million representing the elimination of ourshare of profits on sales to EPIX, reduced by the realization of a portion of the profits previously eliminatedon licenses to the venture of $0.2 million.
(2) The equity interest loss for TV Guide Network for the year ended March 31, 2010 includes $10.6 million,which represents our share of the TV Guide Network losses of $19.3 million for the year ended March 31,2010, reduced by our share of income from the accretion of dividend and discount on TV Guide Network’sredeemable preferred stock units of $10.5 million.
Income Tax Provision
We had an income tax expense of $1.2 million, or (6.7%), of loss before income taxes in fiscal 2010,compared to an expense of $2.7 million, or (1.6%), of loss before income taxes in fiscal 2009. The tax expensereflected in fiscal 2010 is primarily attributable to U.S. and Canadian income taxes and foreign withholdingtaxes. Our actual annual effective tax rate will differ from the statutory federal rate as a result of several factors,including changes in the valuation allowance against net deferred tax assets, non-temporary differences, foreignincome taxed at different rates, and state and local income taxes. Income tax loss carryforwards, subject tocertain limitations that may prevent us from fully utilizing them, amount to approximately $156.2 million forU.S. federal income tax purposes available to reduce income taxes over twenty years, $131.1 million for U.S.state income tax purposes available to reduce income taxes over future years with varying expirations,$27.3 million for Canadian income tax purposes available to reduce income taxes over 20 years with varyingexpirations, and $15.9 million for UK income tax purposes available indefinitely to reduce future income taxes.
Net Loss
Net loss for the fiscal year ended March 31, 2010 was $19.5 million, or basic and diluted net loss percommon share of $0.17 on 117.5 million weighted average common shares outstanding. This compares to netloss for the fiscal year ended March 31, 2009 of $178.5 million, or basic and diluted net loss per common shareof $1.53 on 116.8 million weighted average common shares outstanding.
87

Liquidity and Capital Resources
Our liquidity and capital resources have been provided principally through cash generated from operations,our senior revolving credit facility, senior secured second-priority notes, issuance of convertible seniorsubordinated notes, the Film Credit Facility (as hereafter defined), borrowings under individual production loans,our Pennsylvania Regional Center credit facility, and certain participation financing arrangements.
Senior Revolving Credit Facility
Outstanding Amount. At March 31, 2011, we had borrowings of $69.8 million (March 31, 2010 —$17.0 million).
Availability of Funds. At March 31, 2011, there was $255.2 million available (March 31, 2010 —$297.4 million). The senior revolving credit facility provides for borrowings and letters of credit up to anaggregate of $340 million. The availability of funds is limited by a borrowing base and also reduced byoutstanding letters of credit which amounted to $15.0 million at March 31, 2011 (March 31, 2010 —$25.6 million).
Maturity Date. The senior revolving credit facility expires July 25, 2013.
Interest. As of March 31, 2011, the senior revolving credit facility bore interest of 2.5% over the “AdjustedLIBOR” rate (effective interest rate of 2.74% and 2.75% as of March 31, 2011 and March 31, 2010,respectively).
Commitment Fee. We are required to pay a quarterly commitment fee based upon 0.375% per annum on thetotal senior revolving credit facility of $340 million less the amount drawn.
Security. Obligations under the senior revolving credit facility are secured by collateral (as defined in thecredit agreement) granted by us and certain of our subsidiaries, as well as a pledge of equity interests in certain ofour subsidiaries.
Covenants. The senior revolving credit facility contains a number of affirmative and negative covenantsthat, among other things, require us to satisfy certain financial covenants and restrict our ability to incuradditional debt, pay dividends and make distributions, make certain investments and acquisitions, repurchase itsstock and prepay certain indebtedness, create liens, enter into agreements with affiliates, modify the nature of itsbusiness, enter into sale-leaseback transactions, transfer and sell material assets and merge or consolidate.
Change in Control. Under the senior revolving credit facility, we may also be subject to an event of defaultupon a change in control (as defined in the senior revolving credit facility) which, among other things, includes aperson or group acquiring ownership or control in excess of 50% (amended from 20% on June 22, 2010) of ourcommon stock.
Senior Secured Second-Priority Notes
On October 21, 2009, LGEI issued $236.0 million aggregate principal amount of the Senior Notes in aprivate offering conducted pursuant to Rule 144A and Regulation S under the Securities Act.
On May 13, 2011, LGEI issued approximately $200.0 million aggregate principal amount of the AdditionalSenior Notes in a private offering conducted pursuant to Rule 144A and Regulation S under the Securities Act.The Additional Senior Notes were issued pursuant the Supplemental Indenture among LGEI, the Company, thesubsidiary guarantors party thereto, and U.S. Bank National Association, as trustee. The Supplemental Indentureamended the Indenture to, among other things, enable the Issuer to issue additional notes having the same termsas the Senior Notes, except for the issue date, issue price and first interest payment, in an aggregate principal
88

amount of up to $200.0 million. The Additional Senior Notes were sold at 102.219% of the principal amount plusaccrued interest thereon from May 1, 2011, resulting in gross proceeds of approximately $204.4 million and netproceeds of approximately $197.2 million after certain transaction costs, and approximately $191.6 million after$5.6 million paid in connection with the consent solicitation of holders of the Senior Notes. A portion of theproceeds were used to pay down amounts outstanding under our senior secured credit facility. The AdditionalSenior Notes accrue interest at a rate of 10.25% per annum from May 1, 2011 and will be payable semiannuallyon May 1 and November 1 of each year, commencing on November 1, 2011. The Additional Senior Notes willmature on November 1, 2016.
Outstanding Amount. The outstanding amount is set forth in the table below:
March 31, March 31,2011 2010
(Amounts in thousands)
Principal amount of Senior Secured Second-PriorityNotes . . . . . . . . . . . . . . . . . . . . . . . . . . . . . . . . . . . . . . . $236,000 $236,000
Unamortized discount (remaining period as of March 31,2011 of 5.6 years ) . . . . . . . . . . . . . . . . . . . . . . . . . . . . . (9,669) (10,845)
Net carrying amount of Senior Secured Second-PriorityNotes . . . . . . . . . . . . . . . . . . . . . . . . . . . . . . . . . . . . . . . $226,331 $225,155
Maturity Date. The Senior Notes are due November 1, 2016.
Original Issue Discount. The Senior Notes were issued by LGEI at an initial price of 95.222% (originalissue discount — 4.778%) of the principal amount.
Interest. The Senior Notes pay interest semi-annually on May 1 and November 1 of each year at a rate of10.25% per year.
Net Proceeds. The net proceeds, after deducting discounts, fees paid to the initial purchaser, and alltransaction costs (including accrued legal, accounting and other professional fees) from the sale of the SeniorNotes was approximately $214.3 million, which was used by LGEI to repay a portion of its outstanding debtunder its senior revolving credit facility. The original issue discount, interest and deferred financing costs arebeing amortized through November 1, 2016 using the effective interest method.
Security. The Senior Notes are guaranteed on a senior secured basis by us, and certain wholly-ownedsubsidiaries of both us and LGEI. The Senior Notes are ranked junior in right of payment to our senior revolvingcredit facility, ranked equally in right of payment to our convertible senior subordinated notes, and ranked seniorto any of our unsecured debt.
Covenants. The Senior Notes contain certain restrictions and covenants that, subject to certain exceptions,limit our ability to incur additional indebtedness, pay dividends or repurchase our common shares, make certainloans or investments, and sell or otherwise dispose of certain assets subject to certain conditions, among otherlimitations.
Under the terms of the Senior Notes and Additional Senior Notes, there are certain covenants which restrictthe Company’s ability to incur certain additional indebtedness, make certain “restricted payments” as defined,and other items. These covenants require certain ratios, such as the Secured Leverage Ratio and ConsolidatedLeverage Ratio (as defined in the indentures), meet certain specified thresholds before such additionalindebtedness, restricted payments or other items are permitted under the terms of the indenture. These ratios are
89

partially based on the net borrowing base amount, as calculated pursuant to the indenture. The following tablesets forth the total gross and net borrowing base and certain components of the borrowing base as prescribed bythe indenture to the Senior Notes and Additional Senior Notes:
BorrowingBase
DefinitionClause (2) Category Name March 31, 2011
Gross(1) Rate Net(1)
(Amounts in millions)
(i) Eligible Major Domestic Receivables $ 201.2 @ 100% $201.2(ii) Eligible Acceptable Domestic Receivables 130.6 @ 90% 117.5(iii) Eligible Acceptable Foreign Receivables 34.7 @ 85% 29.4(iv) Acceptable Tax Credits 53.7 @ 85%/75% 42.7(v) Other Domestic Receivables 16.1 @ 50% 8.1(vi) Other Foreign Receivables 20.1 @ 50% 10.1
Borrowing Base from Receivables $ 456.4 $409.0(vii) Eligible Film Library 594.5 50% 297.2(viii) Eligible Video Cassette Inventory 28.7 50% 10.0(ix) Total Home Video, Pay Television, Free Television
Credits 147.0 Misc. 147.0(xiii) Cash Collateral Accounts 1.3 100% 1.3(xiv) P&A Credit 19.0 50% 9.5
Borrowing Base at March 31, 2011 $1,246.9 $874.0
(1) Gross amount represents the amount as of each applicable category and the net amounts represents theacceptable portion of that amount permitted to be counted in the Borrowing Base (as defined) under theindenture.
(2) The following numbered clauses from the Borrowing Base definition were either not applicable or notmaterial as of March 31, 2011: (x) Direct to Video Credit; (xi) Foreign Rights Credit; (xii) Eligible L/CReceivables.
Convertible Senior Subordinated Notes
As of March 31, 2011 we have convertible senior subordinated notes outstanding of $136.4 million inaggregate principal amount (carrying value — $107.3 million). In October 2011, March 2012 and March 2015$46.3 million, $23.5 million and $66.6 million, respectively, of these convertible senior subordinated notes areredeemable by the holder.
July 20, 2010 Refinancing Exchange Agreement. On July 20, 2010, we entered into a RefinancingExchange Agreement to exchange approximately $36.0 million in aggregate principal amount of theFebruary 2005 3.625% Notes and approximately $63.7 million in aggregate principal amount of theOctober 2004 2.9375% Notes for equal principal amounts, respectively, of new 3.625% Convertible SeniorSubordinated Notes due 2027 (the “New 3.625% Notes”) and new 2.9375% Convertible Senior SubordinatedNotes due 2026 (the “New 2.9375% Notes”, and together with the New 3.625% Notes, the “New Notes”). TheNew Notes took effect immediately and all terms were identical to the February 2005 3.625% Notes andOctober 2004 2.9375% Notes except that the New Notes had an extended maturity date, extended put rights bytwo years, and were immediately convertible at an initial conversion rate of 161.2903 of our common shares per$1,000 principal amount of New Notes (conversion price per share of $6.20), subject to specified contingencies.
On July 20, 2010, the New Notes were converted into 16,236,305 of our common shares. As a result, theNew Notes are no longer outstanding as of July 20, 2010.
90

Key Terms of Convertible Senior Subordinated Notes
October 2004 2.9375% Notes. In October 2004, LGEI sold $150.0 million of the October 2004 2.9375% Notes.
Outstanding Amount: As of March 31, 2011, $46.3 million of aggregate principal amount (carrying value —$44.7 million) of the October 2004 2.9375% Notes remain outstanding.
Interest: Interest on the October 2004 2.9375% Notes is payable semi-annually on April 15 and October 15.
Maturity Date: The October 2004 2.9375% Notes mature on October 15, 2024.
Redeemable by LGEI: From October 15, 2010 to October 14, 2011, LGEI may redeem the October 20042.9375% Notes at 100.420% and thereafter, LGEI may redeem the October 2004 2.9375% Notes at 100%.
Redeemable by Holder: The holder may require LGEI to repurchase the October 2004 2.9375% Notes onOctober 15, 2011, 2014 and 2019 or upon a change in control at a price equal to 100% of the principal amount,together with accrued and unpaid interest through the date of repurchase.
Conversion Features: The holder may convert the October 2004 2.9375% Notes into our common sharesprior to maturity only if the price of our common shares issuable upon conversion of a note reaches or falls belowa certain specific threshold over a specified period, the notes have been called for redemption, a change in controloccurs or certain other corporate transactions occur. Before the close of business on or prior to the trading dayimmediately before the maturity date, the holder may convert the notes into our common shares. The conversionrate is equal to 86.9565 shares per $1,000 principal amount of the October 2004 2.9375% Notes, subject toadjustment in certain circumstances, which represents a conversion price of approximately $11.50 per share.Upon conversion of the October 2004 2.9375% Notes, we have the option to deliver, in lieu of common shares,cash or a combination of cash and our common shares.
Make Whole Premium: Under certain circumstances, if the holder requires LGEI to repurchase all or aportion of our notes or the holder converts the notes upon a change in control, they will be entitled to receive amake whole premium. The amount of the make whole premium, if any, will be based on the price of our commonshares on the effective date of the change in control. No make whole premium will be paid if the price of ourcommon shares at such time is less than $8.79 per share or exceeds $50.00 per share.
February 2005 3.625% Notes. In February 2005, LGEI sold $175.0 million of the February 2005 3.625%Notes.
Outstanding Amount: As of March 31, 2011, $23.5 million of aggregate principal amount (carrying value —$22.1 million) of the February 2005 3.625% Notes remain outstanding.
Interest: Interest on the February 2005 3.625% Notes is payable at 3.625% per annum semi-annually onMarch 15 and September 15 until March 15, 2012 and at 3.125% per annum thereafter until maturity.
Maturity Date: The February 2005 3.625% Notes mature on March 15, 2025.
Redeemable by LGEI: LGEI may redeem all or a portion of the February 2005 3.625% Notes at our optionon or after March 15, 2012 at 100% of their principal amount, together with accrued and unpaid interest throughthe date of redemption.
Redeemable by Holder: The holder may require LGEI to repurchase the February 2005 3.625% Notes onMarch 15, 2012, 2015 and 2020 or upon a change in control at a price equal to 100% of the principal amount,together with accrued and unpaid interest through the date of repurchase.
91

Conversion Features: The February 2005 3.625% Notes are convertible, at the option of the holder, at anytime before the maturity date, if the notes have not been previously redeemed or repurchased, at a conversion rateequal to 70.0133 shares per $1,000 principal amount of the February 2005 3.625% Notes, subject to adjustmentin certain circumstances, which represents a conversion price of approximately $14.28 per share. Uponconversion of the February 2005 3.625% Notes, we have the option to deliver, in lieu of common shares, cash ora combination of cash and our common shares.
Make Whole Premium: Under certain circumstances, if the holder requires LGEI to repurchase all or aportion of our notes upon a change in control, they will be entitled to receive a make whole premium. Theamount of the make whole premium, if any, will be based on the price of our common shares on the effectivedate of the change in control. No make whole premium will be paid if the price of our common shares at suchtime is less than $10.35 per share or exceeds $75.00 per share.
April 2009 3.625% Notes. In April 2009, LGEI issued approximately $66.6 million of 3.625% ConvertibleSenior Subordinated Notes (the “April 2009 3.625% Notes”).
Outstanding Amount: As of March 31, 2011, $66.6 million of aggregate principal amount (carrying value —$40.4 million) of the April 2009 3.625% Notes remain outstanding.
Interest: Interest on the April 2009 3.625% Notes is payable at 3.625% per annum semi-annually onMarch 15 and September 15 of each year.
Maturity Date: The April 2009 3.625% Notes will mature on March 15, 2025.
Redeemable by LGEI: On or after March 15, 2015, LGEI may redeem the April 2009 3.625% Notes, inwhole or in part, at a price equal to 100% of the principal amount of the April 2009 3.625% Notes to beredeemed, plus accrued and unpaid interest through the date of redemption.
Redeemable by Holder: The holder may require LGEI to repurchase the April 2009 3.625% Notes onMarch 15, 2015, 2018 and 2023 or upon a “designated event,” at a price equal to 100% of the principal amountof the April 2009 3.625% Notes to be repurchased plus accrued and unpaid interest.
Conversion Features: The April 2009 3.625% Notes may be converted into our common shares at any timebefore maturity, redemption or repurchase. The initial conversion rate of the April 2009 3.625% Notes is121.2121 common shares per $1,000 principal amount of the April 2009 3.625% Notes, subject to adjustment incertain circumstances, which represents a conversion price of approximately $8.25 per share. Upon conversion ofthe April 2009 3.625% Notes, we have the option to deliver, in lieu of common shares, cash or a combination ofcash and common shares of the Company.
Make Whole Premium: Under certain circumstances, if the holder requires LGEI to repurchase all or aportion of their notes upon a change in control, they will be entitled to receive a make whole premium. Theamount of the make whole premium, if any, will be based on the price of our common shares on the effectivedate of the change in control. No make whole premium will be paid if the price of our common shares at suchtime is less than $5.36 per share or exceeds $50.00 per share.
We may from time to time seek to retire or purchase our outstanding debt through cash purchases and/orexchanges for equity securities, in open market purchases, privately negotiated transactions or otherwise. Suchrepurchases or exchanges, if any, will depend on prevailing market conditions, our liquidity requirements,contractual restrictions and other factors. The amounts involved may be material.
92

Production Loans and Participation Financing Arrangements
Individual Production Loans
As of March 31, 2011 amounts outstanding under individual production loans was $181.8 million.Individual productions loans represent individual loans for the production of film and television programs thatwe produce. Individual production loans have contractual repayment dates either at or near the expectedcompletion date, with the exception of certain loans containing repayment dates on a longer term basis.Individual production loans of $121.9 million incur interest at rates ranging from 3.45% to 4.25%, andapproximately $60.0 million of production loans are non-interest bearing.
Film Credit Facility
On October 6, 2009, we entered into a revolving film credit facility agreement, as amended effectiveDecember 31, 2009 and June 22, 2010 (the “Film Credit Facility”), which provides for borrowings for theacquisition or production of motion pictures.
Outstanding Amount. At March 31, 2011, we had borrowings of $20.4 million (March 31, 2010 —$35.7 million).
Availability of Funds. Currently, the Film Credit Facility provides for total borrowings up to $130 million,subject to a borrowing base, which can vary based on the amount of sales contracts in place on pictures financedunder the facility. The Film Credit Facility can be increased to $200 million if additional qualified lenders orfinancial institutions become a party to and provide a commitment under the facility.
Maturity Date. The Film Credit Facility has a maturity date of April 6, 2013. Borrowings under the FilmCredit Facility are due the earlier of (a) nine months after delivery of each motion picture or (b) April 6, 2013.
Interest. As of March 31, 2011, the Film Credit Facility bore interest of 3.25% over the “LIBO” rate (asdefined in the credit agreement). The weighted average interest rate on borrowings outstanding as of March 31,2011 was 3.49% (March 31, 2010 — 3.50%).
Commitment Fee. We are required to pay a quarterly commitment fee of 0.75% per annum on the unusedcommitment under the Film Credit Facility.
Security. Borrowings under the Film Credit Facility are subject to a borrowing base calculation and aresecured by interests in the related motion pictures, together with certain other receivables from other motionpicture and television productions pledged by us, including a minimum pledge of such receivables of$25 million. Receivables pledged to the Film Credit Facility must be excluded from the borrowing basecalculation under our senior revolving credit facility as described in Note 9 to our audited consolidated financialstatements.
Pennsylvania Regional Center
General. On April 9, 2008, we entered into a loan agreement with the Pennsylvania Regional Center whichprovides for the availability of production loans up to $65,500,000 on a five-year term for use in film andtelevision productions in the State of Pennsylvania. The amount that was borrowed was limited to approximatelyone half of the qualified production costs incurred in the State of Pennsylvania through the two-year period endedApril 2010, and is subject to certain other limitations. Under the terms of the loan, for every dollar borrowed, theCompany’s production companies are required (within a two-year period) to either create a specified number ofjobs, or spend a specified amount in certain geographic regions in the State of Pennsylvania.
Outstanding Amount. At March 31, 2011, we had borrowings of $65.5 million (fair value — $62.0 million)(March 31, 2010 — $65.7 million which includes accrued interest of $0.2 million).
Availability of Funds. At March 31, 2011, there were no amounts available under this agreement (March 31,2010 — nil).
93

Maturity Date. All amounts borrowed under this loan agreement with the Pennsylvania Regional Center aredue April 11, 2013, five years from the date that we began to borrow under this agreement.
Interest. Amounts borrowed under the agreement carry an interest rate of 1.5%, which is payable semi-annually.
Security. The loan is secured by a first priority security interest in our film library pursuant to anintercreditor agreement with our senior lender under our senior revolving credit facility. Pursuant to theterms of our senior revolving credit facility, we are required to maintain certain collateral equal to the loansoutstanding plus 5% under this facility. Such collateral can consist of cash, cash equivalents or debt securities,including our convertible senior subordinated notes repurchased. As of March 31, 2011, $72.8 million principalvalue (fair value — $72.4 million) of our convertible senior subordinated notes repurchased in December 2009(see Note 13 to our consolidated financial statements) was held as collateral under our senior revolving creditfacility (March 31, 2010 — $72.8 million principal value, $69.5 million fair value).
Participation Financing Arrangements
Theatrical Slate Participation. On May 29, 2009, we terminated our theatrical slate participationarrangement with Pride Pictures, LLC (“Pride”), an unrelated entity. The arrangement was evidenced by, amongother documents, that certain Master Covered Picture Purchase Agreement (the “Master Picture PurchaseAgreement”) between us and LG Film Finance I, LLC (“FilmCo”) and that certain Limited Liability CompanyAgreement for FilmCo by and between us and Pride, each dated as of May 25, 2007 and amended on January 30,2008. Under the arrangement, Pride contributed, in general, 50% of our production, acquisition, marketing anddistribution costs of theatrical feature films and participated in a pro rata portion of the pictures’ net profits orlosses similar to a co-production arrangement based on the portion of costs funded. Amounts provided fromPride were reflected as a participation liability. In late 2008, the administrative agent for the senior lenders underPride’s senior credit facility took the position, among others, that the senior lenders did not have an obligation tocontinue to fund under the senior credit facility because the conditions precedent to funding set forth in the seniorcredit facility could not be satisfied. We were not a party to the credit facility. Consequently, Pride did notpurchase the pictures The Spirit, My Bloody Valentine 3-D and Madea Goes To Jail. Thereafter, on April 20,2009, after failed attempts by us to facilitate a resolution, we gave FilmCo and Pride notice that FilmCo, throughPride’s failure to make certain capital contributions, was in default of the Master Picture Purchase Agreement.On May 5, 2009, the representative for the Pride equity and the Pride mezzanine investor responded that therequired amount was fully funded and that it had no further obligations to make any additional capitalcontributions. Consequently, on May 29, 2009, we gave notice of termination of the Master Picture PurchaseAgreement. Since May 29, 2009, there have been no developments with respect to the arrangement. Although wewill no longer receive financing as provided from the participation of Pride in our films, we do not believe thiswill have a material adverse effect to our business.
Société Générale de Financement du Québec. On July 30, 2007, we entered into a four-year filmedentertainment slate participation agreement with Société Générale de Financement du Québec (“SGF”), theQuébec provincial government’s investment arm. SGF will provide up to 35% of production costs of televisionand feature film productions produced in Québec for a four-year period for an aggregate participation of up to$140 million, and we will advance all amounts necessary to fund the remaining budgeted costs. The maximumaggregate of budgeted costs over the four-year period will be $400 million, including our portion, but no morethan $100 million per year. In connection with this agreement, we and SGF will proportionally share in theproceeds derived from the productions after we deduct a distribution fee, recoup all distribution expenses andreleasing costs, and pay all applicable third party participations and residuals. Under the terms of thearrangement, $35 million is available through July 30, 2011. Of the $35 million available through July 30, 2011,$5.3 million was provided through March 31, 2011, with the remaining commitment expiring on July 30, 2011.
94

Filmed Entertainment Backlog
Filmed Entertainment Backlog. Backlog represents the amount of future revenue not yet recorded fromcontracts for the licensing of films and television product for television exhibition and in international markets.Backlog at March 31, 2011 and 2010 is $532.0 million and $448.9 million, respectively.
Discussion of Operating, Investing, Financing Cash Flows
Cash Flows Provided By/Used in Operating Activities. Cash flows provided by operating activities for theyear ended March 31, 2011 were $42.3 million, compared to cash flows used in operating activities for the yearended March 31, 2010 of $135.0 million, and cash flows used in operating activities for the year ended March 31,2009 of $101.9 million. The decrease in cash used in operating activities was primarily due to increases in cashprovided by changes in accounts receivable, accounts payable and accrued liabilities, participations and residuals,film obligations and deferred revenues, increases in non-cash stock-based compensation, loss on extinguishmentof debt and equity interest loss, offset by a higher net loss generated in the year ended March 31, 2011 comparedto the year ended March 31, 2010, and increases in restricted cash and investment in films and televisionprograms. The increase in cash used in operating activities in fiscal 2010 of $135.0 million as compared to$101.9 million in fiscal 2009 was primarily due to increases in accounts receivable, decreases in cash providedby changes in accounts payable and accrued liabilities, participations and residuals, film obligations, and deferredrevenue, offset by decreases in investment in films and television programs, a lower net loss generated in the yearended March 31, 2010, and a higher amortization of films and television programs.
Cash Flows Used in Investing Activities. Cash flows used in investing activities of $28.4 million for the yearended March 31, 2011 consisted of $15.0 million for the buy-out of the earn-out associated with the acquisitionof Debmar-Mercury (see Note 17 to our audited consolidated financial statements), $2.8 million for purchases ofproperty and equipment and $24.7 million of capital contributions to companies accounted as equity methodinvestments, partially offset by $8.1 million repayments on loans made to a third party producer and net proceedsof $7.0 million from the sale of restricted investments. Cash flows used in investing activities of $43.9 millionfor the year ended March 31, 2010 consisted of $3.7 million for purchases of property and equipment,$47.1 million for the investment in equity method investees, offset by $8.3 million of repayments on loans madeto a third party producer. Cash flows used in investing activities of $298.6 million for the year ended March 31,2009 consisted of $243.2 million for the acquisition of TV Guide Network, $8.7 million for purchases ofproperty and equipment, $18.0 million for the investment in equity method investees and $25.0 million forincreases in loans made to a third party producer and $3.8 million for an increase in loans made to Break Media.
Cash Flows Used In/Provided by Financing Activities. Cash flows used in financing activities of$1.5 million for the year ended March 31, 2011 resulted from borrowings of $525.3 million under the seniorrevolving credit facility, $138.0 million under production loans and $3.1 million decrease in restricted cashcollateral requirement under the Film Credit Facility, partially offset by $472.5 million repayment on the seniorrevolving credit facility, $181.9 million repayment of production loans, and $13.5 million paid for taxwithholding requirements associated with our equity awards. Cash flows provided by financing activities of$108.5 million for the year ended March 31, 2010 resulted from the receipt of net proceeds of $214.7 millionfrom the sale of senior secured second-priority notes, borrowings of $302.0 million under the senior revolvingcredit facility, increased production loans of $238.3 million and proceeds of $109.8 million from the issuance ofmandatorily redeemable preferred stock units and common stock units related to the sale of our 49% interest inTV Guide Network, net of unrestricted cash deconsolidated, offset by $540.0 million repayment on the seniorrevolving credit facility, $139.0 million repayment of production loans, $75.2 million repayment on therepurchase of convertible senior subordinated notes, $2.0 million paid for tax withholding requirementsassociated with our equity awards, and $0.1 million repayment of other financing obligations. Cash flowsprovided by financing activities of $171.6 million for the year ended March 31, 2009 resulted from borrowings of$255.0 million under the senior revolving credit facility, increased production loans of $189.9 million and theexercise of stock options of $2.9 million, offset by $222.0 million repayment of production loans, $45.0 millionpaid for the repurchase of our common shares, $3.7 million paid for tax withholding requirements associatedwith our equity awards, and $5.3 million repayment on the repurchase of convertible senior subordinated notes.
95

Anticipated Cash Requirements. The nature of our business is such that significant initial expenditures arerequired to produce, acquire, distribute and market films and television programs, while revenues from thesefilms and television programs are earned over an extended period of time after their completion or acquisition.We believe that cash flow from operations, cash on hand, senior revolving credit facility availability, tax-efficientfinancing, available production financing, and the proceeds from the issuance of our Additional Senior Notes willbe adequate to meet known operational cash requirements for the foreseeable future, including the funding offuture film and television production, film rights acquisitions and theatrical and video release schedules, andfuture equity method investment funding requirements. We monitor our cash flow liquidity, availability, fixedcharge coverage, capital base, film spending and leverage ratios with the long-term goal of maintaining our creditworthiness.
Our current financing strategy is to fund operations and to leverage investment in films and televisionprograms through our cash flow from operations, our senior revolving credit facility, single-purpose productionfinancing, the Film Credit Facility, government incentive programs, film funds, and distribution commitments. Inaddition, we may acquire businesses or assets, including individual films or libraries that are complementary toour business. Any such transaction could be financed through our cash flow from operations, credit facilities,equity or debt financing. If additional financing beyond our existing cash flows from operations and creditfacilities cannot fund such transactions, there is no assurance that such financing will be available on termsacceptable to us.
Table of Debt and Other Financing Obligations and Contractual Commitments
The following table sets forth our future annual repayment of debt and other financing obligations outstanding,and our contractual commitments as of March 31, 2011:
Year Ended March 31,
2012 2013 2014 2015 2016 Thereafter Total
Future annual repayment of debt and otherfinancing obligations recorded as ofMarch 31, 2011Senior revolving credit facility . . . . . . . . . . $ — $ — $ 69,750 $ — $ — $ — $ 69,750Film obligations(1) . . . . . . . . . . . . . . . . . . . 36,370 10,254 7,972 4,691 3,127 — 62,414Production loans(1) . . . . . . . . . . . . . . . . . .
Individual production loans . . . . . . . . 154,225 12,604 15,000 — — — 181,829Pennsylvania Regional Centerproduction loans . . . . . . . . . . . . . . . — — 65,500 — — — 65,500
Film Credit Facility . . . . . . . . . . . . . . 20,430 — — — — — 20,430Principal amounts of convertible seniorsubordinated notes and other financingobligations (2) October 2004 2.9375%Notes (carrying value of $44.7 million atMarch 31, 2011) . . . . . . . . . . . . . . . . . . . 46,326 — — — — — 46,326February 2005 3.625% Notes(carrying value of $22.1 million atMarch 31, 2011) . . . . . . . . . . . . . . . 23,470 — — — — — 23,470
April 2009 3.625% Notes (carryingvalue of $40.4 million at March 31,2011) . . . . . . . . . . . . . . . . . . . . . . . . — — — 66,581 — — 66,581
Other financing obligations . . . . . . . . — 3,718 — — — — 3,718Principal amount of senior secured second-priority notes, due November 2016(carrying value of $226.3 million atMarch 31, 2011)(5) . . . . . . . . . . . . . . . . . — — — — — 236,000 236,000
$280,821 $26,576 $158,222 $71,272 $3,127 $236,000 $776,018
96

Year Ended March 31,
2012 2013 2014 2015 2016 Thereafter Total
Contractual commitments by expectedrepayment dateDistribution and marketingcommitments (3) . . . . . . . . . . . . . . $ 84,456 $ 52,000 $ — $ — $ — $ — $ 136,456
Minimum guarantee commitments(4) . . . . . . . . . . . . . . . . . . . . . . . . . 104,062 37,421 6,093 4,966 3,310 — 155,852
Production loan commitments (4) . . . 15,498 5,049 — — — — 20,547Cash interest payments onsubordinated notes and otherfinancing obligations . . . . . . . . . . . 4,921 2,440 2,414 2,414 — — 12,189
Cash interest payments on seniorsecured second priority notes . . . . 24,190 24,190 24,190 24,190 24,190 24,190 145,140
Operating lease commitments . . . . . . 9,078 9,460 9,523 8,976 4,157 603 41,797Other contractual obligations . . . . . . 524 — — — — — 524Employment and consultingcontracts . . . . . . . . . . . . . . . . . . . . . 35,539 20,752 9,536 2,648 1,890 — 70,365
$278,268 $151,312 $ 51,756 $ 43,194 $33,547 $ 24,793 $ 582,870
Total future commitments undercontractual obligations . . . . . . . . . . . . $559,089 $177,888 $209,978 $114,466 $36,674 $260,793 $1,358,888
(1) Film obligations include minimum guarantees and theatrical marketing obligations. Production loansrepresent loans for the production of film and television programs that we produce. Repayment dates arebased on anticipated delivery or release date of the related film or contractual due dates of the obligation.
(2) The future repayment dates of the convertible senior subordinated notes represent the first possibleredemption date by the holder for each note respectively.
(3) Distribution and marketing commitments represent contractual commitments for future expendituresassociated with distribution and marketing of films which we will distribute. The payment dates of theseamounts are primarily based on the anticipated release date of the film.
(4) Minimum guarantee commitments represent contractual commitments related to the purchase of film rightsfor pictures to be delivered in the future. Production loan commitments represent amounts committed forfuture film production and development to be funded through production financing and recorded as aproduction loan liability when incurred. Future payments under these commitments are based on anticipateddelivery or release dates of the related film or contractual due dates of the commitment. The amountsinclude future interest payments associated with the commitment.
(5) Excludes $200.0 million of additional senior secured second-priority notes, due November 2016 that wereissued on May 13, 2011.
Off-Balance Sheet Arrangements
We do not have any transactions, arrangements and other relationships with unconsolidated entities that willaffect our liquidity or capital resources. We have no special purpose entities that provided off-balance sheetfinancing, liquidity or market or credit risk support, nor do we engage in leasing, hedging or research anddevelopment services, that could expose us to liability that is not reflected on the face of our consolidatedfinancial statements. Our commitments to fund operating leases, minimum guarantees, production loans, equitymethod investment funding requirements and all other contractual commitments not reflected on the face of ouraudited consolidated financial statements are presented in the above table.
97

ITEM 7A. QUANTITATIVE AND QUALITATIVE DISCLOSURES ABOUT MARKET RISK.
Currency and Interest Rate Risk Management
Market risks relating to our operations result primarily from changes in interest rates and changes in foreigncurrency exchange rates. Our exposure to interest rate risk results from the financial debt instruments that arisefrom transactions entered into during the normal course of business. As part of our overall risk managementprogram, we evaluate and manage our exposure to changes in interest rates and currency exchange risks on anongoing basis. Hedges and derivative financial instruments will be used in the future in order to manage ourinterest rate and currency exposure. We have no intention of entering into financial derivative contracts, otherthan to hedge a specific financial risk.
Currency Rate Risk. We enter into forward foreign exchange contracts to hedge our foreign currencyexposures on future production expenses denominated in various foreign currencies. As of March 31, 2011, wehad outstanding forward foreign exchange contracts to sell Canadian $1.1 million in exchange for US$1.1 millionover a period of three months at a weighted average exchange rate of one Canadian dollar equals US$1.00. Wealso had outstanding forward foreign exchange contracts to sell British Pound Sterling £9.4 million in exchangefor US$15.0 million over a period of twelve months at a weighted average exchange rate of one BritishPound Sterling equals US$1.59. Changes in the fair value representing a net unrealized fair value loss on foreignexchange contracts that qualified as effective hedge contracts outstanding during the year ended March 31, 2011amounted to $0.6 million and are included in accumulated other comprehensive loss, a separate component ofshareholders’ equity. These contracts are entered into with a major financial institution as counterparty. We areexposed to credit loss in the event of nonperformance by the counterparty, which is limited to the cost ofreplacing the contracts, at current market rates. We do not require collateral or other security to support thesecontracts.
Interest Rate Risk. Certain of the Company’s borrowings primarily borrowings under its senior revolvingcredit facility, certain production loans and the Film Credit Facility, are, and are expected to continue to be, atvariable rates of interest and expose the Company to interest rate risk. If interest rates increase, the Company’sdebt service obligations on the variable rate indebtedness would increase even though the amount borrowedremained the same, and its net income would decrease. The applicable margin with respect to loans under thesenior revolving credit facility is a percentage per annum equal to 2.50% plus an adjusted rate based on LIBOR.The applicable margin with respect to loans under the Film Credit Facility is a percentage per annum equal to3.25% over the “LIBO” rate (as defined in the Film Credit Facility agreement). Assuming the senior revolvingcredit facility and the Film Credit Facility are fully drawn, based on the applicable LIBOR in effect as ofMarch 31, 2011, each quarter point change in interest rates would result in a $0.9 million change in annualinterest expense on the senior revolving credit facility and $0.3 million change in annual interest expense on theFilm Credit Facility. The variable interest production loans incur interest at rates ranging from approximately3.45% to 4.25% and applicable margins ranging from 3% over LIBOR to 3.25% over the greater of LIBOR or1.0%. A quarter point increase of the interest rates on the outstanding principal amount of our variable rateproduction loans would result in $0.3 million in additional costs capitalized to the respective film or televisionasset.
98

The following table presents the Company’s financial instruments that are sensitive to changes in interestrates. The table also presents the cash flows of the principal amounts of the financial instruments with the relatedweighted-average interest rates by expected maturity dates and the fair value of the instrument as ofMarch 31, 2011:
Year Ended March 31,
2012 2013 2014 2015 2016 Thereafter Total
FairValue
March 31,2011
Variable Rates:Senior Revolving Credit Facility (1) $ — $ — $ 69,750 $ — $— $ — $ 69,750 $ 69,750
Average Interest Rate . . . . . . . . . — — 2.74% — — —Production Loans (2):
Individual production loans . . . . 109,250 12,604 — — — — 121,854 121,854Average Interest Rate . . . . . 3.82% 3.68% — — — —
Film Credit Facility . . . . . . . . . . 20,430 — — — — — 20,430 20,430Average Interest Rate . . . . . 3.49% — — — — —
Fixed Rates:Production Loans (3):
Pennsylvania Regional Centerproduction loans . . . . . . . . . . . — — 65,500 — — — 65,500 61,956
Average Interest Rate . . . . . — — 1.50% — — —Principal Amounts of ConvertibleSenior Subordinated Notes (4):October 2004 2.9375% Notes . . 46,326 — — — — — 46,326 46,713
Average Interest Rate . . . . . 2.94% — — — — —February 2005 3.625% Notes . . . 23,470 — — — — — 23,470 22,926
Average Interest Rate . . . . . 3.63% — — — — —April 2009 3.625% Notes . . . . . . — — — 66,581 — — 66,581 59,205
Average Interest Rate . . . . . — — — 3.63% — —Other Financing Obligations (5) — 3,718 — — — — 3,718 3,718
Average Interest Rate . . . . . . . . . — 8.02% — — — —Principal Amount of SeniorSecured Second-PriorityNotes (6) — — — — — 236,000 236,000 248,685Average Interest Rate . . . . . . . . . — — — — — 10.25%
$199,476 $16,322 $135,250 $66,581 $— $236,000 $653,629 $655,237
(1) Senior revolving credit facility, which expires July 25, 2013 bears interest of 2.50% over the AdjustedLIBOR rate. At March 31, 2011, we had borrowings of $69.8 million under this facility.
(2) Amounts owed to film production entities on anticipated delivery date or release date of the titles or thecontractual due dates of the obligation. Production loans of $121.9 million incur interest at rates rangingfrom approximately 3.45% to 4.25%. Not included in the table above are approximately $60.0 million ofproduction loans which are non-interest bearing.
(3) Long term production loans with a fixed interest rate equal to 1.5%.(4) The future repayment dates of the convertible senior subordinated notes represent the first possible
redemption date by the holder for each note respectively.(5) Other financing obligation with fixed interest rate equal to 8.02%.(6) Senior secured second-priority notes with a fixed interest rate equal to 10.25%. Excludes $200.0 million of
additional senior secured second-priority notes, due November 2016 that were issued on May 13, 2011 (seeNote 29 to our audited consolidated financial statements).
99

ITEM 8. FINANCIAL STATEMENTS AND SUPPLEMENTARY DATA.
The Auditors’ Report and our Consolidated Financial Statements and Notes thereto appear in a separatesection of this report (beginning on page F-1 following Part IV). The index to our Consolidated FinancialStatements is included in Item 15.
ITEM 9. CHANGES IN AND DISAGREEMENTS WITH ACCOUNTANTS ON ACCOUNTING ANDFINANCIAL DISCLOSURE.
Not applicable.
ITEM 9A. CONTROLS AND PROCEDURES.
Disclosure Controls and Procedures
We maintain disclosure controls and procedures that are designed to ensure that information required to bedisclosed in our reports under the Securities Exchange Act of 1934, as amended (the “Exchange Act”), isrecorded, processed, summarized and reported within the time periods specified in the SEC’s rules and forms,and that such information is accumulated and communicated to management, including our Chief ExecutiveOfficer and Chief Financial Officer, as appropriate, to allow timely decisions regarding required disclosure. Weperiodically review the design and effectiveness of our disclosure controls and internal control over financialreporting. We make modifications to improve the design and effectiveness of our disclosure controls and internalcontrol structure, and may take other corrective action, if our reviews identify a need for such modifications oractions.
As of March 31, 2011, the end of the period covered by this report, the Company’s management had carriedout an evaluation under the supervision and with the participation of our Chief Executive Officer and ChiefFinancial Officer of the effectiveness of our disclosure controls and procedures, as defined in Exchange ActRules 13a-15(e). Based on that evaluation, our Chief Executive Officer and Chief Financial Officer haveconcluded that such controls and procedures were effective.
Internal Control Over Financial Reporting
Management’s Report on Internal Control over Financial Reporting
Our management is responsible for establishing and maintaining adequate internal control over financialreporting for the Company. Our internal control over financial reporting is a process designed to providereasonable assurance regarding the reliability of our financial reporting and the preparation of financialstatements for external purposes in accordance with generally accepted accounting principles. Internal controlover financial reporting includes policies and procedures that:
• pertain to the maintenance of records that, in reasonable detail, accurately and fairly reflect thetransactions and dispositions of the assets of the Company;
• provide reasonable assurance that (a) transactions are recorded as necessary to permit preparation offinancial statements in accordance with generally accepted accounting principles, and (b) that ourreceipts and expenditures are being recorded and made only in accordance with management’sauthorizations; and
• provide reasonable assurance regarding prevention or timely detection of unauthorized acquisition, useor disposition of our assets.
A control system, no matter how well designed and operated, can provide only reasonable, not absolute,assurance that the objectives of the control system are met. Because of the inherent limitations, internal controlsover financial reporting may not prevent or detect misstatements. Projections of any evaluation of theeffectiveness of internal control over financial reporting to future periods are subject to the risks that controlsmay become inadequate because of changes in conditions, or that the degree of compliance with the policies orprocedures may deteriorate.
100

Our management has made an assessment of the effectiveness of our internal control over financialreporting as of March 31, 2011. Management based its assessment on criteria established in Internal Control-Integrated Framework issued by the Committee of Sponsoring Organizations of the Treadway Commission(COSO).
Based on this assessment, our management has concluded that, as of March 31, 2011, the Companymaintained effective internal control over financial reporting. The effectiveness of the Company’s internalcontrol over financial reporting has been audited by the Company’s independent auditor, Ernst & Young LLP, aregistered public accounting firm. Their report is included below.
Changes in Internal Control over Financial Reporting
There were no changes in internal control over financial reporting during the fiscal fourth quarter endedMarch 31, 2011, that have materially affected, or are reasonably likely to materially affect, our internal controlover financial reporting.
101

REPORT OF INDEPENDENT REGISTERED PUBLIC ACCOUNTING FIRM
The Board of Directors and Shareholders of Lions Gate Entertainment Corp.
We have audited Lions Gate Entertainment Corp.’s internal control over financial reporting as of March 31,2011, based on criteria established in Internal Control — Integrated Framework issued by the Committee ofSponsoring Organizations of the Treadway Commission (the COSO criteria). Lions Gate Entertainment Corp.’smanagement is responsible for maintaining effective internal control over financial reporting, and for itsassessment of the effectiveness of internal control over financial reporting included in the accompanyingManagement’s Report on Internal Control over Financial Reporting. Our responsibility is to express an opinionon the company’s internal control over financial reporting based on our audit.
We conducted our audit in accordance with the standards of the Public Company Accounting Oversight Board(United States). Those standards require that we plan and perform the audit to obtain reasonable assurance aboutwhether effective internal control over financial reporting was maintained in all material respects. Our auditincluded obtaining an understanding of internal control over financial reporting, assessing the risk that a materialweakness exists, testing and evaluating the design and operating effectiveness of internal control based on theassessed risk, and performing such other procedures as we considered necessary in the circumstances. We believethat our audit provides a reasonable basis for our opinion.
A company’s internal control over financial reporting is a process designed to provide reasonable assuranceregarding the reliability of financial reporting and the preparation of financial statements for external purposes inaccordance with generally accepted accounting principles. A company’s internal control over financial reportingincludes those policies and procedures that (1) pertain to the maintenance of records that, in reasonable detail,accurately and fairly reflect the transactions and dispositions of the assets of the company; (2) provide reasonableassurance that transactions are recorded as necessary to permit preparation of financial statements in accordancewith generally accepted accounting principles, and that receipts and expenditures of the company are being madeonly in accordance with authorizations of management and directors of the company; and (3) provide reasonableassurance regarding prevention or timely detection of unauthorized acquisition, use, or disposition of thecompany’s assets that could have a material effect on the financial statements.
Because of its inherent limitations, internal control over financial reporting may not prevent or detectmisstatements. Also, projections of any evaluation of effectiveness to future periods are subject to the risk thatcontrols may become inadequate because of changes in conditions, or that the degree of compliance with thepolicies or procedures may deteriorate. In our opinion, Lions Gate Entertainment Corp. maintained, in allmaterial respects, effective internal control over financial reporting as of March 31, 2011, based on the COSOcriteria.
We also have audited, in accordance with the standards of the Public Company Accounting Oversight Board(United States), the consolidated balance sheets of Lions Gate Entertainment Corp. as of March 31, 2011 and2010, and the related consolidated statements of operations, shareholders’ equity, and cash flows for each of thethree years in the period ended March 31, 2011 of Lions Gate Entertainment Corp. and our report dated May 31,2011 expressed an unqualified opinion thereon.
/s/ Ernst & Young LLP
Los Angeles, CaliforniaMay 31, 2011
102

ITEM 9B. OTHER INFORMATION
None.
PART III
ITEM 10. DIRECTORS, EXECUTIVE OFFICERS AND CORPORATE GOVERNANCE.
The information required by this item is incorporated by reference to our Proxy Statement for our 2011 AnnualGeneral Meeting of Stockholders to be filed with the SEC within 120 days after the end of the fiscal year endedMarch 31, 2011.
ITEM 11. EXECUTIVE COMPENSATION.
The information required by this item is incorporated by reference to our Proxy Statement for our 2011 AnnualGeneral Meeting of Stockholders to be filed with the SEC within 120 days after the end of the fiscal year endedMarch 31, 2011.
ITEM 12. SECURITY OWNERSHIP OF CERTAIN BENEFICIAL OWNERS AND MANAGEMENT ANDRELATED SHAREHOLDER MATTERS.
The information required by this item is incorporated by reference to our Proxy Statement for our 2011 AnnualGeneral Meeting of Stockholders to be filed with the SEC within 120 days after the end of the fiscal year endedMarch 31, 2011.
ITEM 13. CERTAIN RELATIONSHIPS AND RELATED TRANSACTIONS, AND DIRECTORINDEPENDENCE.
The information required by this item is incorporated by reference to our Proxy Statement for our 2011 AnnualGeneral Meeting of Stockholders to be filed with the SEC within 120 days after the end of the fiscal year endedMarch 31, 2011.
ITEM 14. PRINCIPAL ACCOUNTING FEES AND SERVICES.
The information required by this item is incorporated by reference to our Proxy Statement for our 2011 AnnualGeneral Meeting of Stockholders to be filed with the SEC within 120 days after the end of the fiscal year endedMarch 31, 2011.
PART IV
ITEM 15. EXHIBITS, FINANCIAL STATEMENT SCHEDULES.
(a) The following documents are filed as part of this report:
(1) Financial Statements
The financial statements listed on the accompanying Index to Financial Statements are filed as part ofthis report at pages F-1 to F-64.
(2) Financial Statement Schedules
Schedule II. Valuation and Qualifying Accounts
All other Schedules are omitted since the required information is not present or is not present inamounts sufficient to require submission of the schedule.
(3) and (b) Exhibits
The exhibits listed on the accompanying Index to Exhibits are filed as part of this report.
103

Item 15(a).
Schedule II. Valuation and Qualifying Accounts
Lions Gate Entertainment Corp.
March 31, 2011(In Thousands)
COL. A. COL. B. COL. C. COL. D. COL. E.
Additions
DescriptionBalance at
Beginning of PeriodCharged to Costs and
Expenses (1)Charged to OtherAccounts -Describe
Deductions -Describe
Balance at Endof Period
Year Ended March 31, 2011:
Reserves:
Video returns andallowances . . . . . . . $ 87,978 $203,086 $ 478(2) $(196,345)(3) $ 95,197
Provision for doubtfulaccounts . . . . . . . . 7,676 (922) 93(2) (280)(4) 6,567
Total . . . . . . . . . $ 95,654 $202,164 $ 778 $(196,832) $101,764
Year Ended March 31, 2010:
Reserves:
Video returns andallowances . . . . . . . $ 98,947 $178,865 $1,103(2) $(190,937)(3) $ 87,978
Provision for doubtfulaccounts . . . . . . . . 9,847 1,412 624(2) (4,207)(4) 7,676
Total . . . . . . . . . $108,794 $180,277 $1,727 $(195,144) $ 95,654
Year Ended March 31, 2009:
Reserves:
Video returns andallowances . . . . . . . $ 95,515 $224,855 $7,000(2) $(228,423)(3) $ 98,947
Provision for doubtfulaccounts . . . . . . . . 5,978 3,377 872(2) (380)(4) 9,847
Total . . . . . . . . . $101,493 $228,232 $7,872 $(228,803) $108,794
(1) Charges for video returns and allowances are charges against revenue.(2) Opening balances due to acquisitions and fluctuations in foreign currency exchange rates. Video returns and
allowances for the year ended March 31, 2009 includes an initial returns reserve for the HIT Entertainment,Inc. distribution deal.
(3) Actual video returns and fluctuations in foreign currency exchange rates.(4) Uncollectible accounts written off and fluctuations in foreign currency exchange rates. The year ended
March 31, 2010 includes a reclassification of the provision for doubtful accounts due to the deconsolidationof TVG Network.
104

Item 15(b).
INDEX TO EXHIBITS
ExhibitNumber Description of Documents
3.1(10) Articles
3.2(48) Notice of Articles
3.3(17) Vertical Short Form Amalgamation Application
3.4(17) Certificate of Amalgamation
4.1(1) Indenture dated as of December 3, 2003 among Lions Gate Entertainment Inc., Lions GateEntertainment Corp. and J.P. Morgan Trust Company, National Association
4.2(1) Form of 4.875% Convertible Senior Subordinated Notes Due 2010
4.3(1) Form of Guaranty of 4.875% Convertible Subordinated Notes Due 2010
4.4(2) Indenture dated as of October 4, 2004 among Lions Gate Entertainment Inc., Lions GateEntertainment Corp. and J.P. Morgan Trust Company, National Association
4.5(2) Form of 2.9375% Convertible Senior Subordinated Notes due 2024
4.6(2) Form of Guaranty of 2.9375% Convertible Senior Subordinated Notes due 2024
4.7(3) Indenture dated as of February 24, 2005 among Lions Gate Entertainment Inc., Lions GateEntertainment Corp. and J.P. Morgan Trust Company, National Association
4.8(3) Form of 3.625% Convertible Senior Subordinated Notes due 2025
4.9(3) Form of Guaranty of 3.625% Convertible Senior Subordinated Notes due 2025
4.10(24) Form of Refinancing Exchange Agreement dated April 27, 2009
4.11(24) Form of Indenture dated as of April 27, 2009 among Lions Gate Entertainment Inc., Lions GateEntertainment Corp. and The Bank of New York Mellon Trust Company, N.A.
4.12(24) Form of 3.625% Convertible Senior Subordinated Notes Due 2025 dated as of April 27, 2009
4.13(24) Form of Guaranty of 3.625% Convertible Senior Subordinated Notes due 2025 dated as of April 27,2009
4.14(35) Rights Plan, dated as of March 12, 2010, between Lions Gate Entertainment Corp. and CIBCMellon Trust Company, as amended and restated as of April 22, 2010 between Lions GateEntertainment Corp. and CIBC Mellon Trust Company.
4.15(42) Rights Plan, dated as of July 1, 2010, between Lions Gate Entertainment Corp. and CIBC MellonTrust Company.
4.16(43) Form of Lions Gate Entertainment Inc. 3.625% Convertible Senior Subordinated Note due 2027
4.17(44) Form of Lions Gate Entertainment Inc. 2.9375% Convertible Senior Subordinated Note due 2026
4.16(49) Supplemental Indenture dated May 13, 2011 among Lions Gate Entertainment Inc., Lions GateEntertainment Corp., the subsidiary guarantors named therein and U.S. Bank National Association,as trustee.
10.1(4)* Amended Employees’ and Directors’ Equity Incentive Plan
10.2(5)* Form of Incentive Plan Stock Option Agreement
105

ExhibitNumber Description of Documents
10.3(10)* 2004 Performance Plan Restricted Share Unit Agreement
10.4(14)* 2004 Performance Incentive Plan
10.5(10)* Form of 2004 Performance Incentive Plan Nonqualified Stock Option Agreement
10.6(6) Registration Rights Agreement by and among the Company, Mark Amin and Reza Amin, dated asof June 6, 2000
10.7* Director Compensation Summary
10.8(16)* Employment Agreement between the Company and Jon Feltheimer, dated September 20, 2006
10.9(16)* Employment Agreement between the Company and Michael Burns, dated September 1, 2006
10.10(13)* Employment Agreement between the Company and James Keegan, dated February 21, 2006 andentered into as of April 4, 2006
10.11(13)* Employment Agreement between the Company and Wayne Levin, dated April 1, 2006 and enteredinto as of May 9, 2006
10.12(13)* Employment Agreement between the Company and Marni Wieshofer, dated January 5, 2006 andentered into as of March 7, 2006
10.13(17)* Employment Agreement between the Company and Steve Beeks, dated March 28, 2007 and enteredinto as of March 29, 2007
10.14(7) Amended and Restated Credit, Security, Guaranty and Pledge Agreement, dated as of December 15,2003 among Lions Gate Entertainment Corp., Lions Gate Entertainment Inc., the Guarantorsreferred to therein, the Lenders referred to therein, JP Morgan Chase Bank, JP Morgan Chase Bank(Toronto Branch), Fleet National Bank and BNP Paribas, dated as of December 15, 2003
10.15(1) Amendment No. 1 to the Company’s Amended and Restated Credit, Security, Guaranty and PledgeAgreement, dated as of June 15, 2004, by and among Lions Gate Entertainment Corp., Lions GateEntertainment Inc., the Guarantors referred to therein, the Lenders referred to therein, JP MorganChase Bank, JP Morgan Chase Bank (Toronto Branch), Fleet National Bank and BNP Paribas,dated as of December 15, 2003
10.16(2) Amendment No. 2 to the Amended and Restated Credit, Security, Guaranty and Pledge Agreement,dated as of September 22, 2004, by and among Lions Gate Entertainment Corp., Lions GateEntertainment Inc., the Guarantors referred to therein, the Lenders referred to therein, JP MorganChase Bank, JP Morgan Chase Bank (Toronto Branch), Fleet National Bank and BNP Paribas,dated as of December 15, 2003
10.17(8) Amendment No. 3 to the Amended and Restated Credit, Security, Guaranty and Pledge Agreement,dated as of December 31, 2004, by and among Lions Gate Entertainment Corp., Lions GateEntertainment Inc., the Guarantors referred to therein, the Lenders referred to therein, JP MorganChase Bank, JP Morgan Chase Bank (Toronto Branch), Fleet National Bank and BNP Paribas,dated as of December 15, 2003
10.18(8) Amendment No. 4 to the Amended and Restated Credit, Security, Guaranty and Pledge Agreement,dated as of February 15, 2005, by and among Lions Gate Entertainment Corp., Lions GateEntertainment Inc., the Guarantors referred to therein, the Lenders referred to therein, JP MorganChase Bank, National Association, JP Morgan Chase Bank, National Association (Toronto Branch),Fleet National Bank and BNP Paribas, dated as of December 15, 2003
106

ExhibitNumber Description of Documents
10.19(9) Amendment No. 5 to the Amended and Restated Credit, Security, Guaranty and Pledge Agreement,dated as of March 31, 2005, by and among Lions Gate Entertainment Corp., Lions GateEntertainment Inc., the Guarantors referred to therein, the Lenders referred to therein, JP MorganChase Bank, National Association, JP Morgan Chase Bank, National Association (Toronto Branch),Fleet National Bank and BNP Paribas, dated as of December 15, 2003
10.20(11) Amendment No. 6 to the Amended and Restated Credit, Security, Guaranty and Pledge Agreement,dated as of June 21, 2005, by and among Lions Gate Entertainment Corp., Lions GateEntertainment Inc., the Guarantors referred to therein, the Lenders referred to therein, JP MorganChase Bank, National Association, JP Morgan Chase Bank, National Association (Toronto Branch),Fleet National Bank and BNP Paribas, dated as of December 15, 2003
10.21(11) Amendment No. 7 to the Amended and Restated Credit, Security, Guaranty and Pledge Agreement,dated as of October 17, 2005, by and among Lions Gate Entertainment Corp., Lions GateEntertainment Inc., the Guarantors referred to therein, the Lenders referred to therein, JP MorganChase Bank, National Association, JP Morgan Chase Bank, National Association (Toronto Branch),Fleet National Bank and BNP Paribas, dated as of December 15, 2003
10.22(17) Amendment No. 9 to the Amended and Restated Credit, Security, Guaranty and Pledge Agreement,dated as of April 2, 2007, by and among Lions Gate Entertainment Corp., Lions Gate EntertainmentInc., the Guarantors referred to therein, the Lenders referred to therein, JP Morgan Chase Bank,National Association, JP Morgan Chase Bank, National Association (Toronto Branch), FleetNational Bank and BNP Paribas, dated as of December 15, 2003
10.23(10)* Amendment to January 5, 2000 Incentive Plan Stock Option Agreement between the Company andMichael Burns, dated December 11, 2001
10.24(10)* Amendment to January 5, 2000 Incentive Plan Stock Option Agreement between the Company andJon Feltheimer, dated December 11, 2001
10.25(10)* Share Appreciation Rights Award Agreement between the Company and Steve Beeks, datedFebruary 2, 2004
10.26(10)* Clarification of Stock Appreciation Rights Award Letter for Steve Beeks, dated November 18, 2004
10.27(12) Partnership Interest Purchase Agreement, dated December 22, 2005, by and among Lions GateEntertainment Corp., Lions Gate Films Corp., Bosa Development Corp., and 0742102 B.C. LTD.
10.28(12) Amendment to Partnership Interest Purchase Agreement Amendment and Removal of ConditionsPrecedent, January 23, 2006, by and among Lions Gate Entertainment Corp., Lions Gate FilmsCorp., Bosa Development Corp., and 0742102 B.C. LTD.
10.29(13) Agreement dated as of December 6, 2005 between Lions Gate Film, Inc. and Sobini Films, withrespect to the distribution rights to the motion picture entitled “The Prince and Me II.”
10.30(13) Agreement dated as of March 24, 2005 between Lions Gate Films Inc. and Sobini Films, withrespect to the distribution rights to the motion picture entitled “Streets of Legend.”
10.31(13) Agreement dated as of December 6, 2005 between Lions Gate Films Inc. and Sobini Films, withrespect to the distribution rights to the motion picture entitled “Peaceful Warrior.”
10.32(13) Purchase Agreement dated March 17, 2006 between Lions Gate Entertainment Corp. and IconInternational, Inc.
10.33(13) Vendor Subscription Agreement dated March 17, 2006 between Lions Gate Entertainment Corp.and Icon International, Inc.
107

ExhibitNumber Description of Documents
10.34(13) Agreement, by and between Ignite, LLC and Lions Gate Films Inc., entered into June 13, 2006 anddated and effective as of March 13, 2006
10.35(15) Right of First Refusal Agreement dated as of August 29, 2006 between Lions Gate EntertainmentCorp., Sobini Films and Mark Amin.
10.36(17)+ Master Covered Picture Purchase Agreement, by and between LG Film Finance I, LLC and LionsGate Films Inc., dated as of May 25, 2007
10.37(17)+ Master Distribution Agreement, by and between Lions Gate Films Inc. and LG Film Finance I,LLC, dated as of May 25, 2007
10.38(17)+ Limited Liability Company Agreement for LG Film Finance I, LLC, dated as of May 25, 2007
10.39(18) Amendment No. 10 to the Amended and Restated Credit, Security, Guaranty and PledgeAgreement, dated as of August 8, 2007, by and among Lions Gate Entertainment Corp., Lions GateEntertainment Inc., the Guarantors referred to therein, the Lenders referred to therein, JP MorganChase Bank, National Association, JP Morgan Chase Bank, National Association (Toronto Branch),Fleet National Bank and BNP Paribas, dated as of December 15, 2003.
10.40(19)+ Revenue Participation Purchase Agreement dated as of July 25, 2007 among Lions GateEntertainment Inc., Lions Gate Films Inc., Lions Gate Television Inc., MQP, LLC and SGFEntertainment, Inc.
10.41(19)+ Master Distribution Agreement (Film Productions) dated as of July 25, 2007 between MQP LLCand Lions Gate Films Inc.
10.42(19)+ Master Distribution Agreement (Television Productions) dated as of July 25, 2007 between MQPLLC and Lions Gate Television Inc.
10.43(20) Purchase Agreement by and among the Sellers, Lions Gate Entertainment Corp., Lions GateEntertainment Inc., Mandate Pictures, LLC and Joseph Drake dated September 10, 2007.
10.44(20) Registration Rights Agreement by and among the Sellers and Lions Gate Entertainment Corp. datedSeptember 10, 2007.
10.45(20) Letter Agreement by and among the Sellers, Lions Gate Entertainment Corp., Lions GateEntertainment Inc., Mandate Pictures, LLC and Joseph Drake dated September 10, 2007.
10.46(20)* Employment Agreement by and between Lions Gate Films, Inc. and Joe Drake dated September 10,2007
10.47(21) Amendment No. 1 to Right of First Refusal Agreement dated as of August 29, 2006 by and amongLions Gate Entertainment Corp., Sobini Films and Mark Amin dated December 20, 2007
10.48(22) Amendment No. 8 to the Amended and Restated Credit Facility, Security, Guaranty and PledgeAgreement, dated as of December 5, 2006, by and among Lions Gate Entertainment Corp., LionsGate Entertainment Inc., the Guarantors referred to therein, the Lenders referred to therein, JPMorgan Chase Bank, National Association, JP Morgan Chase Bank, National Association (TorontoBranch), Fleet National Bank and BNP Paribas, dated as of December 15, 2003
10.49(22)+ First Amendment dated January 30, 2008 to Master Covered Picture Purchase Agreement by andbetween LG Film Finance I, LLC and Lions Gate Films, Inc. dated as of May 25, 2007
10.50(23) Amendment No. 11 to the Amended and Restated Credit, Security, Guaranty and PledgeAgreement, dated as of April 10, 2008, by and among Lions Gate Entertainment Corp., Lions GateEntertainment Inc., the Guarantors referred to therein, the Lenders referred to therein, JPMorganChase Bank, National Association (formerly known as JPMorgan Chase Bank), JP Morgan ChaseBank, National Association (Toronto Branch), Bank of America, N.A. (as successor by merger toFleet National Bank) and BNP Paribas, dated as of December 15, 2003
108

ExhibitNumber Description of Documents
10.51(25)+ Second Amended and Restated Credit, Security, Guaranty and Pledge Agreement by and amongLions Gate Entertainment Inc., Lions Gate UK Limited, Lions Gate Australia Pty Limited, theGuarantors referred to therein, the Lenders referred to therein, JPMorgan Chase Bank, N.A. andWachovia Bank, N.A., dated of July 25, 2008
10.52(26)* Amendment of Employment Agreement between the Company and Jon Feltheimer datedSeptember 18, 2008
10.53(26)* Amendment of Employment Agreement between the Company and Michael Burns dated September22, 2008
10.54(27)* Amendment of Employment Agreement between the Company and Jon Feltheimer dated October 8,2008
10.55(28) Equity Purchase Agreement dated January 5, 2009, by and among Lions Gate Entertainment, Inc.,Gemstar-TV Guide International, Inc., TV Guide Entertainment Group, Inc., UV Corporation andMacrovision Solutions Corporation
10.56(29)* Employment Agreement between the Company and James Keegan dated January 14, 2009
10.57(30)* Amended and Restated Employment Agreement between the Company and Jon Feltheimer datedDecember 15, 2008
10.58(30)* Amended and Restated Employment Agreement between the Company and Michael Burns datedDecember 15, 2008
10.59(30)* Amended and Restated Employment Agreement between the Company and Steven Beeks datedDecember 15, 2008
10.60(30)* Amended and Restated Employment Agreement between the Company and James Keegan datedDecember 15, 2008
10.61(30)* Amended and Restated Employment Agreement between the Company and Wayne Levin datedDecember 15, 2008
10.62(30) Form of Director Indemnity Agreement
10.63(31)* Amendment of Employment Agreement between the Company and Steven Beeks dated February 6,2009
10.64(32)* Employment Agreement between Lions Gate Films, Inc. and Wayne Levin dated April 6, 2009
10.65(36)+ Equity Purchase Agreement between TVGN Holdings, LLC, Lionsgate Channels, Inc. and LionsGate Entertainment Inc. dated May 28, 2009
10.66(36)+ Amended and Restated Operating Agreement of TV Guide Entertainment Group, LLC dated as ofMay 28, 2009
10.67(37) Letter Agreement between Mark H. Rachesky and Lions Gate Entertainment Corp. dated July 9,2009
10.68(38) Registration Rights Agreement, dated as of October 22, 2009, by and among Lions GateEntertainment Corp. and the persons listed on the signature pages thereto.
10.69(39)* Amendment of Employment Agreement, dated as of November 2, 2009, by and between theCompany and Michael Burns.
10.70(34)+ Amendment No. 1 to the Second Amended and Restated Credit, Security, Guaranty and PledgeAgreement dated as of July 25, 2008, with the guarantors and lenders referred to therein, JP MorganChaseBank, N.A., as administrative agent and issuing bank, and Wachovia Bank, N.A., assyndication agent.
109

ExhibitNumber Description of Documents
10.71(40) Amendment No. 2 dated as of November 24, 2009 to the Second Amended and Restated Credit,Security, Guaranty and Pledge Agreement dated as of July 25, 2008 among Lions GateEntertainment Inc., Lions Gate UK Limited and Lions Gate Australia Pty Limited, as Borrowers,the guarantors and lenders referred to therein, JPMorgan Chase Bank, N.A., as AdministrativeAgent and as Issuing Bank and Wachovia Bank, N.A., as Syndication Agent.
10.72(41)+ Credit, Security, Guaranty and Pledge Agreement dated as of October 6, 2009, among Lions GateMandate Financing Vehicle Inc., the guarantors and lenders referred to therein, JPMorgan ChaseBank, N.A., as administrative agent and issuing bank, Union Bank, N.A., as co-administrativeagent, syndication agent and joint lead arranger, and Wells Fargo Bank, National Association asdocumentation agent.
10.73(41) Indenture dated as of October 21, 2009 among Lions Gate Entertainment Inc., Lions GateEntertainment Corp., the guarantors referred to therein and U.S. Bank National Association.
10.74(41) Pledge and Security Agreement dated as of October 21, 2009 among Lions Gate Entertainment,Inc., the grantors listed therein and U.S. Bank National Association.
10.75(41) Intercreditor Agreement dated as of October 21, 2009 among JPMorgan Chase Bank, N.A., asadministrative agent, U.S. Bank National Association, as collateral agent, Lions GateEntertainment, Inc. and the loan parties referred to therein.
10.76(41)+ Amendment No. 1, executed on January 22, 2010 and dated as of December 31, 2009, to Credit,Security, Guaranty and Pledge Agreement dated as of October 6, 2009, among Lions Gate MandateFinancing Vehicle Inc., the guarantors and lenders referred to therein, JPMorgan Chase Bank, N.A.,as administrative agent and issuing bank, Union Bank, N.A., as co-administrative agent, syndicationagent and joint lead arranger, and Wells Fargo Bank, National Association as documentation agent.
10.77(45) Amendment No.3 dated as of June 22, 2010 to the Second Amended and Restated Credit, Security,Guaranty and Pledge Agreement dated as of July 25, 2008 among Lions Gate Entertainment Inc.,Lions Gate UK Limited and Lions Gate Australia Pty Limited, as Borrowers, the guarantors andlenders referred to therein, JP Morgan Chase Bank, N.A., as Administrative Agent and as IssuingBank and Wachovia Bank, N.A., as Syndication Agent
10.78(45) Amendment No.2 dated as of June 22, 2010 to the Credit, Security, Guaranty and PledgeAgreement dated as of October 6, 2009, among Lions Gate Mandate Financing Vehicle Inc., theguarantors and lenders referred to therein, JPMorgan Chase Bank, N.A., as administrative agent andissuing bank, Union Bank, N.A., as co-administrative agent, syndication agent and joint leadarranger, and Wells Fargo Bank, National Association as documentation agent
10.79(46) Letter, dated as of July 9, 2010, from Lions Gate Entertainment Corp. to Carl C. Icahn.
10.80(47) Refinancing Exchange Agreement, dated July 20, 2010, by Lions Gate Entertainment Inc. andKornitzer Capital Management, Inc.
18.1(33) Preferability Letter dated May 30, 2008
21.1 Subsidiaries of the Company
23.1 Consent of Ernst & Young LLP, Independent Registered Public Accounting Firm
23.2 Consent of PricewaterhouseCoopers LLP, Independent Registered Public Accounting Firm
24.1 Power of Attorney (Contained on Signature Page)
31.1 Certification of CEO pursuant to Section 302 of Sarbanes-Oxley Act of 2002
31.2 Certification of CFO pursuant to Section 302 of Sarbanes-Oxley Act of 2002
110

ExhibitNumber Description of Documents
32.1 Certification of CEO and CFO pursuant to Section 906 of Sarbanes-Oxley Act of 2002
99.1 Studio 3 Partners L.L.C. Audited Financial Statements for the nine month period endedSeptember 30, 2010 the twelve month period ended December 31, 2009 and the period fromApril 18, 2008 (date of inception) to December 31, 2008
99.2 TV Guide Entertainment Group, LLC Audited Consolidated Financial Statements for the fiscalyears ended March 31, 2011 and 2010
101 The following materials from the Company’s Annual Report on Form 10-K for the quarter endedMarch 31, 2011 formatted in Extensible Business Reporting Language (XBRL): (i) theConsolidated Balance Sheets, (ii) the Consolidated Statements of Operations, (iii) the ConsolidatedStatements of Shareholder’s Equity, (iv) the Consolidated Statements of Cash Flows and (v) relatednotes, tagged as blocks of text.
(1) Incorporated by reference to the Company’s Quarterly Report on Form 10-Q for the period ended June 30,2004.
(2) Incorporated by reference to the Company’s Current Report on Form 8-K as filed on October 4, 2004.(3) Incorporated by reference to the Company’s Current Report on Form 8-K as filed on February 25, 2005.(4) Incorporated by reference to the Company’s Definitive Proxy Statement dated August 13, 2001.(5) Incorporated by reference to the Company’s Registration Statement on Form S-2 under the Securities Act of
1933 dated April 30, 2003.(6) Incorporated by reference to the Company’s Registration Statement on Form F-4 under the Securities Act of
1933 dated August 18, 2000.(7) Incorporated by reference to the Company’s Quarterly Report on Form 10-Q for the period ended
December 31, 2003.(8) Incorporated by reference to the Company’s Current Report on Form 8-K as filed on February 22, 2005.(9) Incorporated by reference to the Company’s Current Report on Form 8-K as filed on April 14, 2005.(10) Incorporated by reference to the Company’s Annual Report on Form 10-K for the fiscal year ended
March 31, 2005 as filed on June 29, 2005.(11) Incorporated by reference to the Company’s Current Report on Form 8-K as filed on October 18, 2005.(12) Incorporated by reference to the Company’s Quarterly Report on Form 10-Q for the period ended
December 31, 2005.(13) Incorporated by reference to the Company’s Annual Report on Form 10-K for the fiscal year ended
March 31, 2006 as filed on June 14, 2006.(14) Incorporated by reference to the Company’s Definitive Proxy Statement dated July 28, 2006.(15) Incorporated by reference to the Company’s Current Report on Form 8-K as filed on September 5, 2006.(16) Incorporated by reference to the Company’s Quarterly Report on Form 10-Q for the period ended
September 30, 2006.(17) Incorporated by reference to the Company’s Annual Report on Form 10-K for the fiscal year ended
March 31, 2007 as filed on May 30, 2007.(18) Incorporated by reference to the Company’s Current Report on Form 8-K as filed on August 9, 2007.(19) Incorporated by reference to the Company’s Quarterly Report on Form 10-Q for the period ended June 30,
2007.(20) Incorporated by reference to the Company’s Current Report on Form 8-K as filed on September 10, 2007.(21) Incorporated by reference to the Company’s Current Report on Form 8-K as filed on December 21, 2007.(22) Incorporated by reference to the Company’s Quarterly Report on Form 10-Q for the period ended
December 31, 2006.(23) Incorporated by reference to the Company’s Current Report on Form 8-K as filed on April 11, 2008.(24) Incorporated by reference to the Company’s Form T-3 filed on April 20, 2009, as amended on April 22,
2009.
111

(25) Incorporated by reference to the Company’s Quarterly Report on Form 10-Q for the period ended June 30,2008.
(26) Incorporated by reference to the Company’s Current Report on Form 8-K filed on September 23, 2008.(27) Incorporated by reference to the Company’s Current Report on Form 8-K filed on October 14, 2008.(28) Incorporated by reference to the Company’s Current Report on Form 8-K filed on January 9, 2009 (filed as
Exhibit 10.54).(29) Incorporated by reference to the Company’s Current Report on Form 8-K filed on January 16, 2009 (filed as
Exhibit 10.55).(30) Incorporated by reference to the Company’s Quarterly Report on Form 10-Q for the period ended
December 31, 2008.(31) Incorporated by reference to the Company’s Current Report on Form 8-K as filed on February 11, 2009.(32) Incorporated by reference to the Company’s Current Report on Form 8-K as filed on April 10, 2009.(33) Incorporated by reference to the Company’s Annual Report on Form 10-K for the fiscal year ended
March 31, 2008 as filed on May 30, 2008.(34) Incorporated by reference to the Company’s Quarterly Report on Form 10-Q for the fiscal quarter ended
September 30, 2009 as filed on November 9, 2009.(35) Incorporated by reference to the Company’s Current Report on Form 8-K as filed on April 23, 2010.(36) Incorporated by reference to the Company’s Quarterly Report on Form 10-Q for the fiscal quarter ended
June 30, 2009 as filed on August 10, 2009.(37) Incorporated by reference as Exhibit 10.65 to the Company’s Current Report on Form 8-K as filed on
July 10, 2009.(38) Incorporated by reference to the Company’s Current Report on Form 8-K as filed on October 23, 2009.(39) Incorporated by reference to the Company’s Current Report on Form 8-K as filed on November 6, 2009.(40) Incorporated by reference to the Company’s Current Report on Form 8-K as filed on December 1, 2009.(41) Incorporated by reference to the Company’s Quarterly Report on Form 10-Q for the fiscal quarter ended
December 31, 2009 as filed on February 9, 2010.(42) Incorporated by reference as Exhibit 4.1 to the Company’s Current Report on Form 8-K as filed on July 2,
2010.(43) Incorporated by reference as Exhibit 4.15 to the Company’s Current Report on Form 8-K as filed on
July 21, 2010.(44) Incorporated by reference as Exhibit 4.16 to the Company’s Current Report on Form 8-K as filed on
July 21, 2010.(45) Incorporated by reference to the Company’s Current Report on Form 8-K as filed on June 25, 2010.(46) Incorporated by reference to the Company’s Current Report on Form 8-K as filed on July 9, 2010.(47) Incorporated by reference to the Company’s Current Report on Form 8-K as filed on July 21, 2010.(48) Incorporated by reference as Exhibit 3.2 to the Company’s Quarterly Report on Form 10-Q for the fiscal
quarter ended December 31, 2010 as filed on February 9, 2011.(49) Incorporated by reference as Exhibit 4.1 to the Company’s Current Report on Form 8-K as filed on May 13,
2011.
* Management contract or compensatory plan or arrangement.+ Confidential treatment has been granted for portions of this exhibit. Portions of this document have been
omitted and submitted separately to the Securities and Exchange Commission.
112

SIGNATURES
Pursuant to the requirements of Section 13 or 15(d) of the Securities Exchange Act of 1934, the registranthas duly caused this report to be signed on its behalf by the undersigned, thereunto duly authorized on May 31,2011.
LIONS GATE ENTERTAINMENT CORP.
BY: /S/ JAMES KEEGAN
James KeeganChief Financial Officer
DATE: May 31, 2011
Pursuant to the requirements of the Securities Exchange Act of 1934, this report has been signed by thefollowing persons in the capacities and on the dates so indicated.
Each person whose signature appears below authorizes each of Jon Feltheimer, Michael Burns, WayneLevin and James Keegan, severally and not jointly, to be his or her true and lawful attorney-in-fact and agent,with full power of substitution and resubstitution, for him or her and in such person’s name, place and stead, inany and all capacities, to sign any amendments to the Company’s Annual Report on Form 10-K for the fiscalyear ended March 31, 2011; granting unto said attorney-in-fact and agent, full power and authority to do andperform each and every act and thing requisite and necessary to be done, as fully for all intents and purposes ashe or she might or could do in person, hereby ratifying and confirming all that said attorney-in-fact and agent, orhis substitute or substitutes, shall lawfully do or cause to be done by virtue hereof.
Signature Title Date
/S/ NORMAN BACAL
Norman Bacal
Director May 31, 2011
/S/ MICHAEL BURNS
Michael Burns
Director May 31, 2011
/S/ ARTHUR EVRENSEL
Arthur Evrensel
Director May 31, 2011
/S/ JON FELTHEIMER
Jon Feltheimer
Chief Executive Officer (PrincipalExecutive Officer) and Co-Chairman of the Board of
Directors
May 31, 2011
/S/ FRANK GIUSTRA
Frank Giustra
Director May 31, 2011
/S/ JAMES KEEGAN
James Keegan
Chief Financial Officer (PrincipalFinancial Officer and Principal
Accounting Officer)
May 31, 2011
/S/ MORLEY KOFFMAN
Morley Koffman
Director May 31, 2011
/S/ HARALD LUDWIG
Harald Ludwig
Co-Chairman of the Board ofDirectors
May 31, 2011
/S/ G. SCOTT PATERSON
G. Scott Paterson
Director May 31, 2011
113

Signature Title Date
/S/ MARK H. RACHESKY, M.D.
Mark H. Rachesky, M.D.
Director May 31, 2011
/S/ DARYL SIMM
Daryl Simm
Director May 31, 2011
/S/ HARDWICK SIMMONS
Hardwick Simmons
Director May 31, 2011
/S/ PHYLLIS YAFFE
Phyllis Yaffe
Director May 31, 2011
114

INDEX TO FINANCIAL STATEMENTS
PageNumber
Audited Financial StatementsReport of Independent Registered Public Accounting Firm — Ernst & Young LLP . . . . . . . . . . . . . . . . . F-2Consolidated Balance Sheets — March 31, 2011 and 2010 . . . . . . . . . . . . . . . . . . . . . . . . . . . . . . . . . . . . F-3Consolidated Statements of Operations — Years Ended March 31, 2011, 2010 and 2009 . . . . . . . . . . . . F-4Consolidated Statements of Shareholders’ Equity — Years Ended March 31, 2011, 2010 and 2009 . . . . F-5Consolidated Statements of Cash Flows — Years Ended March 31, 2011, 2010 and 2009 . . . . . . . . . . . . F-6Notes to Audited Consolidated Financial Statements . . . . . . . . . . . . . . . . . . . . . . . . . . . . . . . . . . . . . . . . . F-7
F-1

REPORT OF INDEPENDENT REGISTERED PUBLIC ACCOUNTING FIRM
The Board of Directors and Shareholders of Lions Gate Entertainment Corp.
We have audited the accompanying consolidated balance sheets of Lions Gate Entertainment Corp. as ofMarch 31, 2011 and 2010, and the related consolidated statements of operations, shareholders’ equity, and cashflows for each of the three years in the period ended March 31, 2011. Our audits also included the financialstatement schedule listed in the Index at Item 15(a). These financial statements and schedule are theresponsibility of the Company’s management. Our responsibility is to express an opinion on these financialstatements and schedule based on our audits.
We conducted our audits in accordance with the standards of the Public Company Accounting Oversight Board(United States). Those standards require that we plan and perform the audit to obtain reasonable assurance aboutwhether the financial statements are free of material misstatement. An audit includes examining, on a test basis,evidence supporting the amounts and disclosures in the financial statements. An audit also includes assessing theaccounting principles used and significant estimates made by management, as well as evaluating the overallfinancial statement presentation. We believe that our audits provide a reasonable basis for our opinion.
In our opinion, the financial statements referred to above present fairly, in all material respects, the consolidatedfinancial position of Lions Gate Entertainment Corp. at March 31, 2011 and 2010, and the consolidated results ofits operations and its cash flows for each of the three years in the period ended March 31, 2011, in conformitywith U.S. generally accepted accounting principles. Also, in our opinion, the related financial statement schedule,when considered in relation to the basic financial statements taken as a whole, presents fairly in all materialrespects the information set forth therein.
We also have audited, in accordance with the standards of the Public Company Accounting Oversight Board(United States), Lions Gate Entertainment Corp.’s internal control over financial reporting as of March 31, 2011,based on criteria established in Internal Control-Integrated Framework issued by the Committee of SponsoringOrganizations of the Treadway Commission and our report dated May 31, 2011 expressed an unqualified opinionthereon.
/s/ Ernst & Young LLP
Los Angeles, CaliforniaMay 31, 2011
F-2

LIONS GATE ENTERTAINMENT CORP.
CONSOLIDATED BALANCE SHEETS
March 31,2011
March 31,2010
(Amounts in thousands,except share amounts)
ASSETSCash and cash equivalents . . . . . . . . . . . . . . . . . . . . . . . . . . . . . . . . . . . . . . . . . . . . . . . . $ 86,419 $ 69,242Restricted cash . . . . . . . . . . . . . . . . . . . . . . . . . . . . . . . . . . . . . . . . . . . . . . . . . . . . . . . . . 43,458 4,123Restricted investments . . . . . . . . . . . . . . . . . . . . . . . . . . . . . . . . . . . . . . . . . . . . . . . . . . — 6,995Accounts receivable, net of reserve for returns and allowances of $95,197 (March 31,2010 — $87,978) and provision for doubtful accounts of $6,567 (March 31,2010 — $7,676) . . . . . . . . . . . . . . . . . . . . . . . . . . . . . . . . . . . . . . . . . . . . . . . . . . . . . . 359,821 292,924
Investment in films and television programs, net . . . . . . . . . . . . . . . . . . . . . . . . . . . . . . 621,288 661,105Property and equipment, net . . . . . . . . . . . . . . . . . . . . . . . . . . . . . . . . . . . . . . . . . . . . . . 10,418 12,414Equity method investments . . . . . . . . . . . . . . . . . . . . . . . . . . . . . . . . . . . . . . . . . . . . . . . 150,585 179,071Goodwill . . . . . . . . . . . . . . . . . . . . . . . . . . . . . . . . . . . . . . . . . . . . . . . . . . . . . . . . . . . . . 239,254 239,254Other assets . . . . . . . . . . . . . . . . . . . . . . . . . . . . . . . . . . . . . . . . . . . . . . . . . . . . . . . . . . . 46,601 62,027
Total assets . . . . . . . . . . . . . . . . . . . . . . . . . . . . . . . . . . . . . . . . . . . . . . . . . . . . . . . $1,557,844 $1,527,155
LIABILITIESSenior revolving credit facility . . . . . . . . . . . . . . . . . . . . . . . . . . . . . . . . . . . . . . . . . . . . $ 69,750 $ 17,000Senior secured second-priority notes . . . . . . . . . . . . . . . . . . . . . . . . . . . . . . . . . . . . . . . 226,331 225,155Accounts payable and accrued liabilities . . . . . . . . . . . . . . . . . . . . . . . . . . . . . . . . . . . . 243,440 253,745Participations and residuals . . . . . . . . . . . . . . . . . . . . . . . . . . . . . . . . . . . . . . . . . . . . . . . 301,386 302,677Film obligations and production loans . . . . . . . . . . . . . . . . . . . . . . . . . . . . . . . . . . . . . . 327,420 351,769Convertible senior subordinated notes and other financing obligations . . . . . . . . . . . . . 110,973 192,036Deferred revenue . . . . . . . . . . . . . . . . . . . . . . . . . . . . . . . . . . . . . . . . . . . . . . . . . . . . . . . 150,998 130,851
Total liabilities . . . . . . . . . . . . . . . . . . . . . . . . . . . . . . . . . . . . . . . . . . . . . . . . . . . . 1,430,298 1,473,233
Commitments and contingencies
SHAREHOLDERS’ EQUITYCommon shares, no par value, 500,000,000 shares authorized, 136,839,445 and117,951,754 shares issued at March 31, 2011 and March 31, 2010, respectively . . . 643,200 521,164
Accumulated deficit . . . . . . . . . . . . . . . . . . . . . . . . . . . . . . . . . . . . . . . . . . . . . . . . . . . . (514,230) (460,631)Accumulated other comprehensive loss . . . . . . . . . . . . . . . . . . . . . . . . . . . . . . . . . . . . . (1,424) (6,611)
Total shareholders’ equity . . . . . . . . . . . . . . . . . . . . . . . . . . . . . . . . . . . . . . . . . . . . . . . . 127,546 53,922
Total liabilities and shareholders’ equity . . . . . . . . . . . . . . . . . . . . . . . . . . . . . . . . $1,557,844 $1,527,155
See accompanying notes.
F-3

LIONS GATE ENTERTAINMENT CORP.
CONSOLIDATED STATEMENTS OF OPERATIONS
YearEnded
March 31,2011
YearEnded
March 31,2010
YearEnded
March 31,2009
(Amounts in thousands, except per share amounts)
Revenues $1,582,720 $1,489,506 $1,466,374Expenses:
Direct operating . . . . . . . . . . . . . . . . . . . . . . . . . . . . . . . . . . . . . . . . . 795,746 777,969 793,816Distribution and marketing . . . . . . . . . . . . . . . . . . . . . . . . . . . . . . . . 547,226 506,141 669,557General and administration . . . . . . . . . . . . . . . . . . . . . . . . . . . . . . . . 171,407 143,060 136,563Depreciation and amortization . . . . . . . . . . . . . . . . . . . . . . . . . . . . . 5,811 12,455 7,657
Total expenses . . . . . . . . . . . . . . . . . . . . . . . . . . . . . . . . . . . . . . 1,520,190 1,439,625 1,607,593
Operating income (loss) . . . . . . . . . . . . . . . . . . . . . . . . . . . . . . . . . . . . . 62,530 49,881 (141,219)
Other expenses (income):Interest expense
Contractual cash based interest . . . . . . . . . . . . . . . . . . . . . . . . . 38,879 27,461 15,131Amortization of debt discount and deferred financing costs . . 16,301 19,701 19,144
Total interest expense . . . . . . . . . . . . . . . . . . . . . . . . . . . . 55,180 47,162 34,275Interest and other income . . . . . . . . . . . . . . . . . . . . . . . . . . . . . . . . . (1,742) (1,547) (5,785)Loss (gain) on extinguishment of debt . . . . . . . . . . . . . . . . . . . . . . . 14,505 (5,675) (3,023)
Total other expenses, net . . . . . . . . . . . . . . . . . . . . . . . . . . . . . . 67,943 39,940 25,467
Income (loss) before equity interests and income taxes . . . . . . . . . . . . (5,413) 9,941 (166,686)Equity interests loss . . . . . . . . . . . . . . . . . . . . . . . . . . . . . . . . . . . . . . . . . . (43,930) (28,201) (9,044)
Loss before income taxes . . . . . . . . . . . . . . . . . . . . . . . . . . . . . . . . . . . . (49,343) (18,260) (175,730)Income tax provision . . . . . . . . . . . . . . . . . . . . . . . . . . . . . . . . . . . . . . . . . 4,256 1,218 2,724
Net loss . . . . . . . . . . . . . . . . . . . . . . . . . . . . . . . . . . . . . . . . . . . . . . . . . . . $ (53,599) $ (19,478) $ (178,454)
Basic Net Loss Per Common Share . . . . . . . . . . . . . . . . . . . . . . . . . . . . $ (0.41) $ (0.17) $ (1.53)
Diluted Net Loss Per Common Share . . . . . . . . . . . . . . . . . . . . . . . . . . $ (0.41) $ (0.17) $ (1.53)
Weighted average number of common shares outstanding:Basic . . . . . . . . . . . . . . . . . . . . . . . . . . . . . . . . . . . . . . . . . . . . . . . . . 131,176 117,510 116,795Diluted . . . . . . . . . . . . . . . . . . . . . . . . . . . . . . . . . . . . . . . . . . . . . . . 131,176 117,510 116,795
See accompanying notes.
F-4

LIONS GATE ENTERTAINMENT CORP.CONSOLIDATED STATEMENTS OF SHAREHOLDERS’ EQUITY
Common SharesSeries B
Preferred SharesAccumulated
Deficit
AccumulatedOther
ComprehensiveLoss
Treasury SharesComprehensive
Loss TotalNumber Amount Number Amount Number Amount
(Amounts in thousands, except share amounts)Balance at March 31, 2008 . . . . . . . . . . 121,081,311 $540,091 10 — $(262,699) $ (533) 2,410,499 (22,260) $ 254,599Exercise of stock options, net ofwithholding tax obligations of$1,192 . . . . . . . . . . . . . . . . . . . . . . . . 878,809 1,702 1,702
Stock based compensation, net ofwithholding tax obligations of$2,542 . . . . . . . . . . . . . . . . . . . . . . . . 833,386 10,500 10,500
Issuance of common shares to directorsfor services . . . . . . . . . . . . . . . . . . . . 43,060 408 408
Issuance of common shares related tothe Mandate acquisition . . . . . . . . . . 1,113,120 10,263 10,263
December 2008 Repurchase —reduction of equity component ofFebruary 2005 3.625% Notesextinguished . . . . . . . . . . . . . . . . . . . (1,012) (1,012)
Repurchase and cancellation ofcommon shares, no par value . . . . . . (6,999,174) (67,228) (2,410,499) 22,260 (44,968)
Redemption of Series B PreferredShares . . . . . . . . . . . . . . . . . . . . . . . . . (10) — —
Comprehensive lossNet loss . . . . . . . . . . . . . . . . . . . . . (178,454) $(178,454) (178,454)Foreign currency translationadjustments . . . . . . . . . . . . . . . . (11,562) (11,562) (11,562)
Net unrealized gain on foreignexchange contracts . . . . . . . . . . 144 144 144
Unrealized gain on investments —available for sale . . . . . . . . . . . . 73 73 73
Comprehensive loss . . . . . . . . . . . $(189,799)
Balance at March 31, 2009 . . . . . . . . . . 116,950,512 494,724 — — (441,153) (11,878) — — 41,693Stock based compensation, net ofwithholding tax obligations of$2,030 . . . . . . . . . . . . . . . . . . . . . . . . 900,577 15,444 15,444
Issuance of common shares to directorsfor services . . . . . . . . . . . . . . . . . . . . 100,665 573 573
Sale of TV Guide Network commonstock units to noncontrollinginterest . . . . . . . . . . . . . . . . . . . . . . . . (167) (167)
April 2009 Exchange Transaction —equity component of April 20093.625% Notes issued, net of $1,324reduction for February 2005 3.625%Notes extinguished . . . . . . . . . . . . . . 14,761 14,761
December 2009 Repurchase — reductionof equity component of October 20042.9375% Notes and February 20053.625% Notes extinguished . . . . . . . . (4,171) (4,171)
Comprehensive lossNet loss . . . . . . . . . . . . . . . . . . . . . (19,478) $ (19,478) (19,478)Foreign currency translationadjustments . . . . . . . . . . . . . . . . 4,849 4,849 4,849
Net unrealized gain on foreignexchange contracts . . . . . . . . . . 418 418 418
Comprehensive loss . . . . . . . . . . . $ (14,211)
Balance at March 31, 2010 . . . . . . . . . . 117,951,754 521,164 — — (460,631) (6,611) — — 53,922Stock based compensation, net ofwithholding tax obligations of$13,476 . . . . . . . . . . . . . . . . . . . . . . . 2,539,603 15,202 15,202
Issuance of common shares to directorsfor services . . . . . . . . . . . . . . . . . . . . 111,783 811 811
Conversion of $63,709 (principal) ofOctober 2004 2.9375% Notes(see Note 13) . . . . . . . . . . . . . . . . . . . 10,355,299 67,620 67,620
Conversion of $36,009 (principal) ofFebruary 2005 3.625% Notes(see Note 13) . . . . . . . . . . . . . . . . . . . 5,881,006 38,403 38,403
Comprehensive lossNet loss . . . . . . . . . . . . . . . . . . . . . (53,599) $ (53,599) (53,599)Foreign currency translationadjustments . . . . . . . . . . . . . . . . 5,756 5,756 5,756
Net unrealized loss on foreignexchange contracts . . . . . . . . . . (569) (569) (569)
Comprehensive loss . . . . . . . . . . . $ (48,412)
Balance at March 31, 2011 . . . . . . . . . . 136,839,445 $643,200 — — $(514,230) $ (1,424) — — $ 127,546
See accompanying notes.
F-5

LIONS GATE ENTERTAINMENT CORP.
CONSOLIDATED STATEMENTS OF CASH FLOWS
Year EndedMarch 31,
2011
Year EndedMarch 31,
2010
Year EndedMarch 31,
2009
(Amounts in thousands)Operating Activities:Net loss . . . . . . . . . . . . . . . . . . . . . . . . . . . . . . . . . . . . . . . . . . . . . . . . . . . . . . . . . . . . . . . . . . $ (53,599) $ (19,478) $ (178,454)Adjustments to reconcile net loss to net cash provided by (used in) operating activities:
Depreciation of property and equipment . . . . . . . . . . . . . . . . . . . . . . . . . . . . . . . . . . . . 4,837 7,526 5,925Amortization of intangible assets . . . . . . . . . . . . . . . . . . . . . . . . . . . . . . . . . . . . . . . . . . 974 4,929 1,732Amortization of films and television programs . . . . . . . . . . . . . . . . . . . . . . . . . . . . . . . 529,428 511,658 458,757Amortization of debt discount and deferred financing costs . . . . . . . . . . . . . . . . . . . . . 16,301 19,701 19,144Accreted interest payment from equity method investee TV Guide . . . . . . . . . . . . . . . 10,200 — —Non-cash stock-based compensation . . . . . . . . . . . . . . . . . . . . . . . . . . . . . . . . . . . . . . . 29,204 17,875 13,438Loss (gain) on extinguishment of debt . . . . . . . . . . . . . . . . . . . . . . . . . . . . . . . . . . . . . . 14,505 (5,675) (3,023)Equity interests loss . . . . . . . . . . . . . . . . . . . . . . . . . . . . . . . . . . . . . . . . . . . . . . . . . . . . 43,930 28,201 9,044
Changes in operating assets and liabilities:Restricted cash . . . . . . . . . . . . . . . . . . . . . . . . . . . . . . . . . . . . . . . . . . . . . . . . . . . . . . . . (43,067) (187) 244Accounts receivable, net . . . . . . . . . . . . . . . . . . . . . . . . . . . . . . . . . . . . . . . . . . . . . . . . (64,203) (79,392) 37,304Investment in films and television programs . . . . . . . . . . . . . . . . . . . . . . . . . . . . . . . . . (487,391) (471,087) (558,277)Other assets . . . . . . . . . . . . . . . . . . . . . . . . . . . . . . . . . . . . . . . . . . . . . . . . . . . . . . . . . . (298) (4,443) (7,363)Accounts payable and accrued liabilities . . . . . . . . . . . . . . . . . . . . . . . . . . . . . . . . . . . . 3,869 (22,769) 30,323Participations and residuals . . . . . . . . . . . . . . . . . . . . . . . . . . . . . . . . . . . . . . . . . . . . . . (1,369) (69,574) (12,781)Film obligations . . . . . . . . . . . . . . . . . . . . . . . . . . . . . . . . . . . . . . . . . . . . . . . . . . . . . . . 19,154 (48,786) 59,376Deferred revenue . . . . . . . . . . . . . . . . . . . . . . . . . . . . . . . . . . . . . . . . . . . . . . . . . . . . . . 19,852 (3,459) 22,705
Net Cash Flows Provided By (Used In) Operating Activities . . . . . . . . . . . 42,327 (134,960) (101,906)Investing Activities:Purchases of restricted investments . . . . . . . . . . . . . . . . . . . . . . . . . . . . . . . . . . . . . . . . . . . . (13,993) (13,994) (13,989)Proceeds from the sale of restricted investments . . . . . . . . . . . . . . . . . . . . . . . . . . . . . . . . . . 20,989 13,985 14,000Buy-out of the earn-out associated with the acquisition of Debmar-Mercury, LLC . . . . . . . (15,000) — —Acquisition of TV Guide, net of unrestricted cash acquired . . . . . . . . . . . . . . . . . . . . . . . . . — — (243,158)Investment in equity method investees . . . . . . . . . . . . . . . . . . . . . . . . . . . . . . . . . . . . . . . . . (24,677) (47,129) (18,031)Increase in loans receivable . . . . . . . . . . . . . . . . . . . . . . . . . . . . . . . . . . . . . . . . . . . . . . . . . . (1,042) (1,418) (28,767)Repayment of loans receivable . . . . . . . . . . . . . . . . . . . . . . . . . . . . . . . . . . . . . . . . . . . . . . . 8,113 8,333 —Purchases of property and equipment . . . . . . . . . . . . . . . . . . . . . . . . . . . . . . . . . . . . . . . . . . (2,756) (3,684) (8,674)
Net Cash Flows Used In Investing Activities . . . . . . . . . . . . . . . . . . . . . . . . (28,366) (43,907) (298,619)Financing Activities:Exercise of stock options . . . . . . . . . . . . . . . . . . . . . . . . . . . . . . . . . . . . . . . . . . . . . . . . . . . . — — 2,894Tax withholding requirements on equity awards . . . . . . . . . . . . . . . . . . . . . . . . . . . . . . . . . . (13,476) (2,030) (3,734)Repurchase and cancellation of common shares . . . . . . . . . . . . . . . . . . . . . . . . . . . . . . . . . . — — (44,968)Proceeds from the issuance of mandatorily redeemable preferred stock units and commonstock units related to the sale of 49% interest in TV Guide Network, net of unrestrictedcash deconsolidated . . . . . . . . . . . . . . . . . . . . . . . . . . . . . . . . . . . . . . . . . . . . . . . . . . . . . . — 109,776 —
Borrowings under senior revolving credit facility . . . . . . . . . . . . . . . . . . . . . . . . . . . . . . . . . 525,250 302,000 255,000Repayments of borrowings under senior revolving credit facility . . . . . . . . . . . . . . . . . . . . . (472,500) (540,000) —Borrowings under individual production loans . . . . . . . . . . . . . . . . . . . . . . . . . . . . . . . . . . . 118,589 144,741 189,858Repayment of individual production loans . . . . . . . . . . . . . . . . . . . . . . . . . . . . . . . . . . . . . . (147,102) (136,261) (222,034)Production loan borrowings under Pennsylvania Regional Center credit facility . . . . . . . . . — 63,133 —Production loan borrowings under film credit facility . . . . . . . . . . . . . . . . . . . . . . . . . . . . . . 19,456 30,469 —Production loan repayments under film credit facility . . . . . . . . . . . . . . . . . . . . . . . . . . . . . . (34,762) (2,718) —Change in restricted cash collateral associated with financing activities . . . . . . . . . . . . . . . . 3,087 — —Proceeds from sale of senior secured second-priority notes . . . . . . . . . . . . . . . . . . . . . . . . . — 214,727 —Repurchase of convertible senior subordinated notes . . . . . . . . . . . . . . . . . . . . . . . . . . . . . . — (75,185) (5,310)Repayment of other financing obligations . . . . . . . . . . . . . . . . . . . . . . . . . . . . . . . . . . . . . . . — (134) (67)
Net Cash Flows Provided By (Used In) Financing Activities . . . . . . . . . . . . . . . . . . . . . . (1,458) 108,518 171,639
Net Change In Cash And Cash Equivalents . . . . . . . . . . . . . . . . . . . . . . . . . . . . . . . . . . . 12,503 (70,349) (228,886)Foreign Exchange Effects on Cash . . . . . . . . . . . . . . . . . . . . . . . . . . . . . . . . . . . . . . . . . . . 4,674 1,116 (4,228)Cash and Cash Equivalents — Beginning Of Period . . . . . . . . . . . . . . . . . . . . . . . . . . . . 69,242 138,475 371,589
Cash and Cash Equivalents — End Of Period . . . . . . . . . . . . . . . . . . . . . . . . . . . . . . . . . $ 86,419 $ 69,242 $ 138,475
See accompanying notes.
F-6

LIONS GATE ENTERTAINMENT CORP.
NOTES TO AUDITED CONSOLIDATED FINANCIAL STATEMENTS
1. Nature of Operations
Lions Gate Entertainment Corp. (the “Company,” “Lionsgate,” “we,” “us” or “our”) is a leading globalentertainment company with a strong and diversified presence in motion picture production and distribution,television programming and syndication, home entertainment, family entertainment, digital distribution and newchannel platforms.
2. Significant Accounting Policies
(a) Generally Accepted Accounting Principles
These consolidated financial statements have been prepared in accordance with United States (the “U.S.”)generally accepted accounting principles (“GAAP”). The Canadian dollar and the U.S. dollar are the functionalcurrencies of the Company’s Canadian and U.S. based businesses, respectively.
(b) Principles of Consolidation
The accompanying consolidated financial statements of the Company include the accounts of Lionsgate andall of its majority-owned and controlled subsidiaries. The Company reviews its relationships with other entities toidentify whether it is the primary beneficiary of a variable interest entity (“VIE”). If the determination is madethat the Company is the primary beneficiary, then the entity is consolidated in accordance with accountingguidance.
Investments in which the Company exercises significant influence, but does not control, are accounted forusing the equity method of accounting. Investments in which there is no significant influence are accounted forusing the cost method of accounting.
All significant intercompany balances and transactions have been eliminated in consolidation.
As a result of a new consolidation accounting standard adopted April 1, 2010 (discussed below under RecentAccounting Pronouncements), prior year amounts presented for fiscal 2010 have been retrospectively adjusted toconform to the fiscal 2011 presentation.
(c) Revenue Recognition
Revenue from the theatrical release of feature films is recognized at the time of exhibition based on ourparticipation in box office receipts. Revenue from the sale of DVDs/Blu-ray discs in the retail market, net of anallowance for estimated returns and other allowances, is recognized on the later of receipt by the customer or“street date” (when it is available for sale by the customer). Under revenue sharing arrangements, rental revenueis recognized when we are entitled to receipts and such receipts are determinable. Revenues from televisionlicensing are recognized when the feature film or television program is available to the licensee for telecast. Fortelevision licenses that include separate availability “windows” during the license period, revenue is allocatedover the “windows.” Revenue from sales to international territories are recognized when access to the featurefilm or television program has been granted or delivery has occurred, as required under the sales contract, and theright to exploit the feature film or television program has commenced. For multiple media rights contracts with afee for a single film or television program where the contract provides for media holdbacks (defined ascontractual media release restrictions), the fee is allocated to the various media based on our assessment of therelative fair value of the rights to exploit each media and is recognized as each holdback is released. Formultiple-title contracts with a fee, the fee is allocated on a title-by-title basis, based on our assessment of therelative fair value of each title.
Distribution revenue from the distribution of TV Guide Network (as defined in Note 17) programming(distributors generally pay a per subscriber fee for the right to distribute programming) was recognized in themonth the services are provided.
F-7

LIONS GATE ENTERTAINMENT CORP.
NOTES TO AUDITED CONSOLIDATED FINANCIAL STATEMENTS— (Continued)
Advertising revenue on TV Guide Network was recognized when the advertising spot was broadcast ordisplayed online. Advertising revenue was recorded net of agency commissions and discounts.
Cash payments received are recorded as deferred revenue until all the conditions of revenue recognitionhave been met. Long-term, non-interest bearing receivables are discounted to present value. At March 31, 2011,$100.2 million of accounts receivable are due beyond one year. The accounts receivable are due as follows:$52.7 million in fiscal 2013, $31.3 million in fiscal 2014, $8.9 million in fiscal 2015, $4.9 million in fiscal 2016,$1.7 million in fiscal 2017, and $0.7 million thereafter.
(d) Cash and Cash Equivalents
Cash and cash equivalents consist of cash deposits at financial institutions and investments in money marketmutual funds.
(e) Restricted Cash
Restricted cash represents amounts held as collateral required under our revolving film credit facility,amounts that are contractually designated for certain theatrical marketing obligations, and amounts held in a trustto fund the Company’s cash severance obligations that would be due to certain executive officers should theiremployment be terminated “without cause” (as defined), in connection with a “change in control” of theCompany (as defined in each of their respective employment contracts).
(f) Restricted Investments
Restricted investments represent amounts held in investments that are contractually designated as collateralfor certain production loans.
(g) Investment in Films and Television Programs
Investment in films and television programs includes the unamortized costs of completed films andtelevision programs which have been produced by the Company or for which the Company has acquireddistribution rights, libraries acquired as part of acquisitions of companies, films and television programs inprogress and in development and home entertainment product inventory.
For films and television programs produced by the Company, capitalized costs include all direct productionand financing costs, capitalized interest and production overhead. For acquired films and television programs,these capitalized costs consist of minimum guarantee payments to acquire the distribution rights.
Costs of acquiring and producing films and television programs and of acquired libraries are amortizedusing the individual-film-forecast method, whereby these costs are amortized and participations and residualscosts are accrued in the proportion that current year’s revenue bears to management’s estimate of ultimaterevenue at the beginning of the current year expected to be recognized from the exploitation, exhibition or sale ofthe films or television programs.
Ultimate revenue includes estimates over a period not to exceed ten years following the date of initialrelease or from the date of delivery of the first episode for episodic television series. For titles included inacquired libraries, ultimate revenue includes estimates over a period not to exceed twenty years following thedate of acquisition.
F-8

LIONS GATE ENTERTAINMENT CORP.
NOTES TO AUDITED CONSOLIDATED FINANCIAL STATEMENTS— (Continued)
Investment in films and television programs is stated at the lower of amortized cost or estimated fair value.The valuation of investment in films and television programs is reviewed on a title-by-title basis, when an eventor change in circumstances indicates that the fair value of a film or television program is less than itsunamortized cost. The fair value of the film or television program is determined using management’s futurerevenue and cost estimates and a discounted cash flow approach. Additional amortization is recorded in the amount by which the unamortized costs exceed the estimated fair value of the film or television program.Estimates of future revenue involve measurement uncertainty and it is therefore possible that reductions in thecarrying value of investment in films and television programs may be required as a consequence of changes inmanagement’s future revenue estimates.
Films and television programs in progress include the accumulated costs of productions which have not yetbeen completed.
Films and television programs in development include costs of acquiring film rights to books, stage plays ororiginal screenplays and costs to adapt such projects. Such costs are capitalized and, upon commencement ofproduction, are transferred to production costs. Projects in development are written off at the earlier of the datethey are determined not to be recoverable or when abandoned, or three years from the date of the initialinvestment.
Home entertainment product inventory consists of DVDs/Blu-ray discs and is stated at the lower of cost ormarket value (first-in, first-out method).
(h) Property and Equipment, net
Property and equipment is carried at cost less accumulated depreciation. Depreciation is provided for usingthe following rates and methods:
Computer equipment and software 2 — 5 years straight-lineFurniture and equipment 2 — 10 years straight-lineLeasehold improvements Over the lease term or the useful life, whichever is
shorterLand Not depreciated
The Company periodically reviews and evaluates the recoverability of property and equipment. Whereapplicable, estimates of net future cash flows, on an undiscounted basis, are calculated based on future revenueestimates. If appropriate and where deemed necessary, a reduction in the carrying amount is recorded.
(i) Equity Method Investments
The Company uses the equity method of accounting for investments in companies in which it has a minorityequity interest and the ability to exert significant influence over operating decisions of the companies. TheCompany’s equity method investees are periodically reviewed to determine whether there has been a loss invalue that is other than a temporary decline.
(j) Goodwill
Goodwill represents the excess of acquisition costs over the tangible and intangible assets acquired andliabilities assumed in various business acquisitions by the Company. The Company has two reporting units withgoodwill within its businesses: Motion Pictures and Television Production. Goodwill is not amortized but is
F-9

LIONS GATE ENTERTAINMENT CORP.
NOTES TO AUDITED CONSOLIDATED FINANCIAL STATEMENTS— (Continued)
reviewed for impairment annually within each fiscal year or between the annual tests if an event occurs orcircumstances change that indicate it is more-likely-than-not that the fair value of a reporting unit is less than itscarrying value. The impairment test follows a two-step approach. The first step determines if the goodwill ispotentially impaired, and the second step measures the amount of the impairment loss, if necessary. Under thefirst step, goodwill is considered potentially impaired if the fair value of the reporting unit is less than thereporting unit’s carrying amount, including goodwill. Under the second step, the impairment loss is thenmeasured as the excess of recorded goodwill over the fair value of the goodwill, as calculated. The fair value ofgoodwill is calculated by allocating the fair value of the reporting unit to all the assets and liabilities of thereporting unit as if the reporting unit was purchased in a business combination and the purchase price was the fairvalue of the reporting unit. The Company performs its annual impairment test as of January 1 in each fiscal year.No goodwill impairment was identified in any of the Company’s reporting units. Determining the fair value ofreporting units requires various assumptions and estimates. The estimates of fair value include consideration ofthe future projected operating results and cash flows of the reporting unit. Such projections could be differentthan actual results. Should actual results be significantly less than estimates, the value of our goodwill could beimpaired in the future.
(k) Other Assets
Other assets include deferred financing costs, loans receivable, and prepaid expenses and other.
Deferred Financing Costs. Amounts incurred in connection with obtaining debt financing are deferred andamortized, as a component of interest expense, over the earlier of the date of the earliest put option or term tomaturity of the related debt obligation.
Loans Receivable. The Company records loans receivable at historical cost, less an allowance foruncollectible amounts.
Prepaid Expenses and Other. Prepaid expenses and other primarily include prepaid expenses and securitydeposits.
(l) Convertible Senior Subordinated Notes
The Company accounts for its convertible senior subordinated notes by separating the liability and equitycomponents. The liability component is recorded at the date of issuance based on its fair value which is generallydetermined in a manner that will reflect an interest cost equal to our nonconvertible debt borrowing rate at theconvertible senior subordinated notes issuance date. The amount of the proceeds less the amount recorded as theliability component is recorded as an addition to shareholders’ equity reflecting the equity component (i.e.,conversion feature). The difference between the principal amount and the amount recorded as the liabilitycomponent represents the debt discount. The carrying amount of the liability is accreted up to the principalamount through the amortization of the discount, using the effective interest method, to interest expense over theexpected life of the note.
(m) Prints, Advertising and Marketing Expenses.
The costs of advertising and marketing expenses are expensed as incurred. Advertising expenses for the yearended March 31, 2011 were $346.3 million (2010 — $297.9 million, 2009 — $423.7 million) which wererecorded as distribution and marketing expenses. The costs of film prints are capitalized as prepaid expenses andexpensed upon theatrical release and are included in distribution and marketing expenses.
F-10

LIONS GATE ENTERTAINMENT CORP.
NOTES TO AUDITED CONSOLIDATED FINANCIAL STATEMENTS— (Continued)
(n) Income Taxes
Income taxes are accounted for using an asset and liability approach for financial accounting and reportingfor income taxes and recognition and measurement of deferred assets are based upon the likelihood of realizationof tax benefits in future years. Under this method, deferred taxes are provided for the net tax effects of temporarydifferences between the carrying amounts of assets and liabilities for financial reporting purposes and theamounts used for income tax purposes. Valuation allowances are established when management determines thatit is more likely than not that some portion or all of the net deferred tax asset will not be realized. The financialeffect of changes in tax laws or rates is accounted for in the period of enactment.
(o) Government Assistance
The Company has access to government programs that are designed to promote film and televisionproduction and distribution in Canada. The Company also has access to similar programs in certain states withinthe U.S. that are designed to promote film and television production in those states.
Tax credits earned with respect to expenditures on qualifying film and television productions are included asan offset to investment in films and television programs when the qualifying expenditures have been incurredprovided that there is reasonable assurance that the credits will be realized (refer to Note 20).
(p) Foreign Currency Translation
Monetary assets and liabilities denominated in currencies other than the functional currency are translated atexchange rates in effect at the balance sheet date. Resulting unrealized translation gains and losses are includedin the consolidated statements of operations.
Foreign company assets and liabilities in foreign currencies are translated into U.S. dollars at the exchangerate in effect at the balance sheet date. Foreign company revenue and expense items are translated at the averagerate of exchange for the fiscal year. Gains or losses arising on the translation of the accounts of foreigncompanies are included in accumulated other comprehensive loss, a separate component of shareholders’ equity.
(q) Derivative Instruments and Hedging Activities
Derivative financial instruments are used by the Company in the management of its foreign currencyexposures. The Company’s policy is not to use derivative financial instruments for trading or speculativepurposes.
The Company enters into forward foreign exchange contracts to hedge its foreign currency exposures onfuture production expenses denominated in various foreign currencies. The Company evaluates whether theforeign exchange contracts qualify for hedge accounting at the inception of the contract. The fair value of theforward exchange contracts is recorded on the consolidated balance sheets. Changes in the fair value of theforeign exchange contracts that are effective hedges are reflected in accumulated other comprehensive loss, aseparate component of shareholders’ equity, and changes in the fair value of foreign exchange contracts that areineffective hedges are reflected in the consolidated statements of operations. Gains and losses realized uponsettlement of the foreign exchange contracts are amortized to the consolidated statements of operations on thesame basis as the production expenses being hedged.
F-11

LIONS GATE ENTERTAINMENT CORP.
NOTES TO AUDITED CONSOLIDATED FINANCIAL STATEMENTS— (Continued)
(r) Stock-Based Compensation
The Company measures the cost of employee services received in exchange for an award of equityinstruments based on the grant date fair value of the award. The fair value received is recognized in earnings overthe period during which an employee is required to provide service. See Note 16 for further discussion of theCompany’s stock-based compensation.
(s) Net Loss Per Share
Basic and diluted net loss per share is calculated based on the weighted average common shares outstandingfor the period. Basic and diluted net loss per share for the years ended March 31, 2011, 2010 and 2009 ispresented below:
YearEnded
March 31,2011
YearEnded
March 31,2010
YearEnded
March 31,2009
(Amounts in thousands)
Basic and Diluted Net Loss Per Common Share:Numerator:
Net loss . . . . . . . . . . . . . . . . . . . . . . . . . . . . . . . . $ (53,599) $ (19,478) $(178,454)
Denominator:Weighted average common sharesoutstanding . . . . . . . . . . . . . . . . . . . . . . . . . . . 131,176 117,510 116,795
Basic and Diluted Net Loss Per Common Share . . . . $ (0.41) $ (0.17) $ (1.53)
For the years ended March 31, 2011, 2010, and 2009, the weighted average incremental common sharescalculated under the “if converted” and treasury stock method presented below were excluded from diluted netloss per common share for the periods because their inclusion would have had an anti-dilutive effect as a result ofthe reported net losses.
YearEnded
March 31,2011
YearEnded
March 31,2010
YearEnded
March 31,2009
(Amounts in thousands)
Incremental sharesConversion of notes . . . . . . . . . . . . . . . . . . . . . . . . . . . . . 16,171 25,907 24,666Share purchase options . . . . . . . . . . . . . . . . . . . . . . . . . . 1 — 340Restricted share units . . . . . . . . . . . . . . . . . . . . . . . . . . . 729 338 365Contingently issuable shares . . . . . . . . . . . . . . . . . . . . . . — — 968
Total incremental shares excluded from Diluted NetLoss Per Common Share . . . . . . . . . . . . . . . . . . . . . . . 16,901 26,245 26,339
Additionally, for the years ended March 31, 2011, 2010, and 2009, the weighted average common sharesissuable presented below were excluded from diluted net loss per common share because their inclusion wouldhave had an anti-dilutive effect due to either their award terms or the market price of common shares.
F-12

LIONS GATE ENTERTAINMENT CORP.
NOTES TO AUDITED CONSOLIDATED FINANCIAL STATEMENTS— (Continued)
YearEnded
March 31,2011
YearEnded
March 31,2010
YearEnded
March 31,2009
(Amounts in thousands)
Anti-dilutive shares issuableShare purchase options . . . . . . . . . . . . . . . . . . . . . . . . . . 3,285 3,670 3,724Restricted share units . . . . . . . . . . . . . . . . . . . . . . . . . . . 137 1,172 1,007Contingently issuable shares . . . . . . . . . . . . . . . . . . . . . . 218 631 376
Total weighted average anti-dilutive shares issuableexcluded from Diluted Net Loss Per CommonShare . . . . . . . . . . . . . . . . . . . . . . . . . . . . . . . . . . . . . . 3,640 5,473 5,107
(t) Use of Estimates
The preparation of financial statements in conformity with U.S. GAAP requires management to makeestimates and assumptions that affect the reported amounts of assets and liabilities and disclosure of contingentassets and liabilities at the date of the financial statements, and the reported amounts of revenue and expensesduring the reporting period. The most significant estimates made by management in the preparation of thefinancial statements relate to ultimate revenue and costs for investment in films and television programs;estimates of sales returns and other allowances and provisions for doubtful accounts; fair value of assets andliabilities for allocation of the purchase price of companies acquired; income taxes and accruals for contingentliabilities; and impairment assessments for investment in films and television programs, property and equipment,equity investments, goodwill and intangible assets. Actual results could differ from such estimates.
(u) Reclassifications
Certain amounts presented in prior years have been reclassified to conform to the current year’spresentation.
(v) Recent Accounting Pronouncements
Consolidation accounting for variable interest entities. This new accounting guidance modifies the previousguidance in relation to the identification of controlling financial interests in a variable interest entity (“VIE”).Under this new guidance, the primary beneficiary of a VIE is the enterprise that has both of the followingcharacteristics, among others: (a) the power to direct the activities of a VIE that most significantly impact theentity’s economic performance; and (b) the obligation to absorb losses of the entity, or the right to receivebenefits from the entity, that could potentially be significant to the VIE. If an enterprise determines that power isshared among multiple unrelated parties such that no one party has the power to direct the activities of a VIE thatmost significantly impact the VIE’s economic performance, then no party is the primary beneficiary. Power isshared if each of the parties sharing power are required to consent to the decisions relating to the activities thatmost significantly impact the VIE’s performance. The provisions of this standard became effective for theCompany beginning in fiscal 2011.
Upon adoption of the new accounting standard on April 1, 2010, the Company determined that it was nolonger the primary beneficiary of TV Guide Network because pursuant to the operating agreement of the entity,the power to direct the activities that most significantly impact the economic performance of TV Guide Networkare shared with the 49% owner of TV Guide Network, One Equity Partners (“OEP”). Accordingly, uponadoption of the new accounting standard, the Company is no longer consolidating TV Guide Network and insteadis accounting for TV Guide Network under the equity method of accounting.
F-13

LIONS GATE ENTERTAINMENT CORP.
NOTES TO AUDITED CONSOLIDATED FINANCIAL STATEMENTS— (Continued)
The Company has applied the provisions of the new accounting standard retrospectively and accordingly,the Company deconsolidated TV Guide Network from May 28, 2009, the date the Company sold a 49% interestto OEP, and retrospectively adjusted the financial statements to reflect TV Guide Network as if it were accountedfor under the equity method of accounting since that date. The deconsolidation of TV Guide Network resulted inthe reclassification of $305.4 million of assets, $147.3 million of liabilities and $30.0 million of non-controllinginterest amounts from each of their respective consolidated balance sheet captions to the investment in equitymethod investee’s account as of March 31, 2010, reflecting the carrying amount of the Company’s interest in themandatorily redeemable preferred and common stock units of TV Guide Network as of March 31, 2010. Thedeconsolidation of TV Guide Network also resulted in a $13.2 million increase in cash flows used in operatingactivities, a $2.9 million decrease in cash flows used in investing activities and an $11.9 million decrease in cashflows provided by financing activities, resulting in a net decrease in cash and cash equivalents of $22.2 millionfor the year ended March 31, 2010. In addition, under the equity method of accounting, the Company’s share ofthe revenues and expenses of TV Guide Network and income for the accretion of the dividend and discount ofthe mandatorily redeemable preferred stock are recorded net in the equity interest line item in the consolidatedstatements of operations. The adoption of the new accounting standard did not impact the Company’s net loss forthe year ended March 31, 2010. See Note 7 and Note 17 for further detail regarding the TV Guide Network.
3. Restricted Cash and Restricted Investments
Restricted Cash. Restricted cash represents amounts held as collateral required under our revolving filmcredit facility, amounts that are contractually designated for certain theatrical marketing obligations, andapproximately $14.0 million held in a trust to fund the Company’s cash severance obligations that would be dueto certain executive officers should their employment be terminated “without cause” (as defined), in connectionwith a “change in control” of the Company (as defined in each of their respective employment contracts). Forpurposes of the employment agreements with such executive officers, a “change in control” occurred on June 30,2010 when a certain shareholder became the beneficial owner of 33% or more of the Company’s common shares.Accordingly, the trust became irrevocable, and the Company may not withdraw any trust assets (other than onceevery six months in an amount that the trustee reasonably determines exceeds the remaining potential severanceobligations), until any cash severance obligations that have become payable to the executives have been paid orthe employment agreements with the executives expire or terminate without those obligations becoming payable.
Restricted Investments. Restricted investments, which are measured at fair value, represented amounts thatwere contractually designated as collateral for certain production loans pursuant to an escrow agreement. Thecarrying amount of this restricted investment is equal to its fair value as of March 31, 2010. The relatedproduction loan was paid off during the year ended March 31, 2011 and the restricted investment maturedresulting in no gain or loss. Realized and unrealized gains on investments available-for-sale were nil, nil, and$0.1 million during the years ended March 31, 2011, 2010 and 2009, respectively.
F-14

LIONS GATE ENTERTAINMENT CORP.
NOTES TO AUDITED CONSOLIDATED FINANCIAL STATEMENTS— (Continued)
4. Investment in Films and Television Programs
March 31,2011
March 31,2010
(Amounts in thousands)
Motion Picture Segment — Theatrical andNon-Theatrical Films
Released, net of accumulated amortization . . . . . . . . . . . . $216,893 $212,582Acquired libraries, net of accumulated amortization . . . . 31,929 43,374Completed and not released . . . . . . . . . . . . . . . . . . . . . . . 49,877 49,338In progress . . . . . . . . . . . . . . . . . . . . . . . . . . . . . . . . . . . . . 171,198 198,743In development . . . . . . . . . . . . . . . . . . . . . . . . . . . . . . . . . 11,825 10,730Product inventory . . . . . . . . . . . . . . . . . . . . . . . . . . . . . . . 34,442 38,291
516,164 553,058
Television Segment — Direct-to-Television ProgramsReleased, net of accumulated amortization . . . . . . . . . . . . 92,722 80,557In progress . . . . . . . . . . . . . . . . . . . . . . . . . . . . . . . . . . . . . 10,206 24,198In development . . . . . . . . . . . . . . . . . . . . . . . . . . . . . . . . . 2,196 3,292
105,124 108,047
$621,288 $661,105
The following table sets forth acquired libraries that represent titles released three years prior to the date ofacquisition, and amortized over their expected revenue stream from acquisition date up to 20 years:
Acquired Library Acquisition Date
TotalAmortization
Period
RemainingAmortization
Period
UnamortizedCosts
March 31,2011
UnamortizedCosts
March 31,2010
(In years) (Amounts in thousands)
Trimark Holdings . . . . . . . . . . . . . . . . . October 2000 20.00 9.50 $ 2,900 $ 4,589Artisan Entertainment . . . . . . . . . . . . . . December 2003 20.00 12.75 28,348 36,836Modern Entertainment . . . . . . . . . . . . . . August 2005 20.00 — — 1,142Lionsgate UK . . . . . . . . . . . . . . . . . . . . October 2005 20.00 14.50 681 807
Total Acquired Libraries . . . . . . . . . . . . $31,929 $43,374
The Company expects approximately 44% of completed films and television programs, net of accumulatedamortization will be amortized during the one-year period ending March 31, 2012. Additionally, the Companyexpects approximately 80% of completed and released films and television programs, net of accumulatedamortization and excluding acquired libraries, will be amortized during the three-year period ending March 31,2014.
F-15

LIONS GATE ENTERTAINMENT CORP.
NOTES TO AUDITED CONSOLIDATED FINANCIAL STATEMENTS— (Continued)
5. Property and EquipmentMarch 31,
2011March 31,
2010
(Amounts in thousands)
Leasehold improvements . . . . . . . . . . . . . . . . . . . . . . . . . . $ 8,412 $ 7,263Property and equipment . . . . . . . . . . . . . . . . . . . . . . . . . . . 8,073 7,691Computer equipment and software . . . . . . . . . . . . . . . . . . . 22,226 20,829
38,711 35,783Less accumulated depreciation and amortization . . . . . . . . (29,499) (24,575)
9,212 11,208Land . . . . . . . . . . . . . . . . . . . . . . . . . . . . . . . . . . . . . . . . . . 1,206 1,206
$ 10,418 $ 12,414
6. GoodwillThe changes in the carrying amount of goodwill by reporting segment in the years ended March 31, 2011
and 2010 were as follows:MotionPictures
TelevisionProduction
MediaNetworks Total
(Amounts in thousands)
Balance as of March 31, 2009 . . . . . . . . . . . . . . . $210,293 $13,961 $ 155,148 $ 379,402TV Guide Network . . . . . . . . . . . . . . . . . . . . — — (155,148) (155,148)Debmar-Mercury, LLC . . . . . . . . . . . . . . . . — 15,000 — 15,000
Balance as of March 31, 2010 . . . . . . . . . . . . . . . $210,293 $28,961 $ — $ 239,254
Balance as of March 31, 2011 . . . . . . . . . . . . . . . $210,293 $28,961 $ — $ 239,254
During the year ended March 31, 2010, goodwill increased by $15.0 million for the buy-out of the earn-outassociated with the acquisition of Debmar-Mercury, LLC (see Note 17). Also during the year ended March 31,2010, goodwill decreased by $155.1 million for the deconsolidation of TV Guide Network from May 28, 2009,the date the Company sold a 49% interest to OEP, pursuant to the new accounting guidance on accounting forVIEs effective April 1, 2010, which the Company has retrospectively applied. Accordingly, upon adoption of thenew accounting standard, the Company is no longer consolidating TV Guide Network and instead is accountingfor TV Guide Network under the equity method of accounting (see Note 7 and Note 17).
7. Equity Method InvestmentsEquity Method Investments. The carrying amount of significant equity method investments at March 31, 2011and March 31, 2010 were as follows:
Equity Method Investee
March 31,2011
OwnershipPercentage
March 31,2011
March 31,2010
(Amounts in thousands)
Horror Entertainment, LLC (“FEARnet”) . . . . . . . . . . 34.5% $ 2,809 $ 630NextPoint, Inc. (“Break Media”) . . . . . . . . . . . . . . . . . 42.0% 14,293 16,698Roadside Attractions, LLC (“Roadside”) . . . . . . . . . . 43.0% 2,756 1,913Studio 3 Partners, LLC (“EPIX”) . . . . . . . . . . . . . . . . . 31.2% 14,664 31,700TV Guide Network . . . . . . . . . . . . . . . . . . . . . . . . . . . . 51.0% 114,940 128,130Tiger Gate Entertainment Limited (“Tiger Gate”) . . . . 45.5% 1,123 —
$150,585 $179,071
F-16

LIONS GATE ENTERTAINMENT CORP.
NOTES TO AUDITED CONSOLIDATED FINANCIAL STATEMENTS— (Continued)
Equity interests in equity method investments in our consolidated statements of operations represent ourportion of the income or loss of our equity method investees based on our percentage ownership and theelimination of profits on sales to equity method investees. Equity interests in equity method investments for theyears ended March 31, 2011, 2010 and 2009 were as follows (income (loss)):
Equity Method Investee
YearEnded
March 31,2011
YearEnded
March 31,2010
YearEnded
March 31,2009
Horror Entertainment, LLC (“FEARnet”) . . . . . . . . . . . $ 679 $ (568) $(5,323)NextPoint, Inc. (“Break Media”) . . . . . . . . . . . . . . . . . . (2,404) (845) (2,543)Roadside Attractions, LLC (“Roadside”) . . . . . . . . . . . . 842 (149) (138)Studio 3 Partners, LLC (“EPIX”) . . . . . . . . . . . . . . . . . . (38,212) (26,587) (1,040)TV Guide Network . . . . . . . . . . . . . . . . . . . . . . . . . . . . . (2,988) (52) —Tiger Gate Entertainment Limited (“Tiger Gate”) . . . . . (1,847) — —
$(43,930) $(28,201) $(9,044)
Horror Entertainment, LLC. Horror Entertainment, LLC (“FEARnet”), a multiplatform programming andcontent service provider of horror genre films operating under the branding of “FEARnet.” The Companylicenses content to FEARnet for video-on-demand and broadband exhibition. The Company is recording its shareof the FEARnet results on a one quarter lag and, accordingly, during the year ended March 31, 2011, theCompany recorded its share of the income earned by FEARnet for the year ended December 31, 2010. TheCompany funded an additional $1.5 million during the year ended March 31, 2011.
NextPoint, Inc. NextPoint, Inc. (“Break Media”), an online home entertainment service provider operatingunder the branding of “Break Media.” The interest was acquired on June 29, 2007 for an aggregate purchaseprice of $21.4 million, which included $0.5 million of transaction costs, by issuing 1,890,189 of the Company’scommon shares. The value assigned to the shares for purposes of recording the investment of $20.9 million wasbased on the average price of the Company’s common shares a few days prior and subsequent to the date of theclosing of the acquisition. The Company is recording its share of the Break Media results on a one quarter lagand, accordingly, during the year ended March 31, 2011, the Company recorded its share of losses incurred byBreak Media for the year ended December 31, 2010.
Roadside Attractions, LLC. Roadside Attractions, LLC (“Roadside”), an independent theatrical releasingcompany. The Company is recording its share of the Roadside results on a one quarter lag and, accordingly,during the year ended March 31, 2011, the Company recorded its share of income earned by Roadside for theyear ended December 31, 2010.
Studio 3 Partners, LLC (“EPIX”). In April 2008, the Company formed a joint venture with Viacom Inc.(“Viacom”), its Paramount Pictures unit (“Paramount Pictures”) and Metro-Goldwyn-Mayer Studios Inc.(“MGM”) to create a premium television channel and subscription video-on-demand service named “EPIX”. TheCompany has invested $80.4 million through March 31, 2011, including $21.2 million funded during the yearended March 31, 2011. The Company is recording its share of the joint venture results on a one quarter lag and,accordingly, during the year ended March 31, 2011, the Company recorded its share of the loss incurred by thejoint venture for the year ended December 31, 2010. EPIX expects to report net income of approximately$24 million for its quarter ended March 31, 2011, of which the Company’s pro rata share will be recorded in thequarter ended June 30, 2011.
F-17

LIONS GATE ENTERTAINMENT CORP.
NOTES TO AUDITED CONSOLIDATED FINANCIAL STATEMENTS— (Continued)
The Company licenses certain of its theatrical releases and other films and television programs to EPIX. Aportion of the profits of these licenses reflecting the Company’s ownership share in the venture are eliminatedthrough an adjustment to the equity interest loss of the venture. These profits are recognized as they are realizedby the venture. For the year ended March 31, 2011 and March 31, 2010, the Company recognized $89.4 millionand $38.6 million, respectively, of revenue and $48.8 million and $26.3 million, respectively, of gross profit onthe licensing of films to EPIX before eliminations.
The following table presents summarized balance sheet data as of December 31, 2010 and 2009 for EPIX:
December 31,2010
December 31,2009
(Amounts in thousands)
Current assets . . . . . . . . . . . . . . . . . . . . . . . . . . . . . . . $117,835 $107,826Non-current assets . . . . . . . . . . . . . . . . . . . . . . . . . . . $ 89,648 $ 56,585Current liabilities . . . . . . . . . . . . . . . . . . . . . . . . . . . . $105,303 $ 49,509Non-current liabilities . . . . . . . . . . . . . . . . . . . . . . . . $ 6,719 $ 14,989
The following table presents the summarized statement of operations for the twelve months endedDecember 31, 2010 and 2009 for EPIX and a reconciliation of the net loss reported by EPIX to equity interestloss recorded by the Company:
Twelve MonthsEnded
December 31,2010
Twelve MonthsEnded
December 31,2009
(Amounts in thousands)
Revenues . . . . . . . . . . . . . . . . . . . . . . . . . . . . . . . . $123,571 $ 27Expenses:
Operating expenses . . . . . . . . . . . . . . . . . . . . 200,894 44,501Selling, general and administrativeexpenses . . . . . . . . . . . . . . . . . . . . . . . . . . 20,729 16,890
Operating loss . . . . . . . . . . . . . . . . . . . . . . . . . . . (98,052) (61,364)Interest income (expense) . . . . . . . . . . . . . . . 13 (110)
Net loss . . . . . . . . . . . . . . . . . . . . . . . . . . . . . . . . . $ (98,039) $(61,474)
Reconciliation of net loss reported by EPIX toequity interest loss:Net loss reported by EPIX . . . . . . . . . . . . . . . $ (98,039) $(61,474)Ownership interest in EPIX . . . . . . . . . . . . . 31.15% 30.55%(1)
Share of net loss . . . . . . . . . . . . . . . . . . . . . . (30,539) (18,779)Adjustments and eliminations of theCompany’s share of profits on sales toEPIX . . . . . . . . . . . . . . . . . . . . . . . . . . . . . (15,219) (8,051)
Realization of the Company’s share ofprofits on sales to EPIX . . . . . . . . . . . . . . . 7,546 243
Total equity interest loss recorded . . . . . . . . $ (38,212) $(26,587)
(1) During the twelve months ended December 31, 2009, the Company’s ownership percentage increased from28.57% to 31.15%.
F-18

LIONS GATE ENTERTAINMENT CORP.
NOTES TO AUDITED CONSOLIDATED FINANCIAL STATEMENTS— (Continued)
TV Guide Network. The Company’s investment balance consists of common share units of $12.6 millionand mandatorily redeemable preferred stock units of $102.4 million (which approximates fair value). OnFebruary 28, 2009, the Company purchased all of the issued and outstanding equity interests of TV GuideNetwork. The Company paid approximately $241.6 million for all of the equity interest of TV Guide Network.On May 28, 2009, the Company sold 49% of the Company’s interest in TV Guide Network (see Note 17).
The February 28, 2009 acquisition was accounted for as a purchase, with the results of operations of TVGuide Network included in the Company’s consolidated results from February 28, 2009 through May 27, 2009when a portion of the entity was sold. Subsequent to the sale of TV Guide Network, and pursuant to the newaccounting guidance on accounting for VIEs effective April 1, 2010, which the Company has retrospectivelyapplied, the Company’s interest in TV Guide Network is being accounted for under the equity method ofaccounting. Accordingly, the Company’s portion of the loss incurred by TV Guide Network for the year endedMarch 31, 2011 and the period from May 28, 2009 through March 31, 2010 is reflected in equity interest loss.
Investment in Mandatorily Redeemable Preferred Stock Units. The mandatorily redeemable preferred stockcarries a dividend rate of 10% compounded annually and is mandatorily redeemable in May 2019 at the statedvalue plus the dividend return and any additional capital contributions less previous distributions. Themandatorily redeemable preferred stock units were initially recorded based on their estimated fair value, asdetermined using an option pricing model methodology. The mandatorily redeemable preferred stock units andthe 10% dividend are being accreted up to its redemption amount over the ten-year period to the redemption datewhich is recorded as income from equity interest. During the year ended March 31, 2011, the Company receiveda pay-out of accreted interest of $10.2 million.
The Company licenses certain films and/or television programs to TV Guide Network. A portion of theprofits of these licenses reflecting the Company’s ownership share in the venture are eliminated through anadjustment to the equity interest loss of the venture. These profits are recognized as they are realized by theventure. For the year ended March 31, 2011, the Company recognized $14.9 million of revenue and $5.3 millionof gross profit on the licensing of television programs to TV Guide Network before eliminations.
The following table presents summarized balance sheet data as of March 31, 2011 and 2010 for TV GuideNetwork:
March 31,2011
March 31,2010
(Amounts in thousands)
Current assets . . . . . . . . . . . . . . . . . . . . . . . . . . . . . . . . . . $ 43,497 $ 45,963Non-current assets . . . . . . . . . . . . . . . . . . . . . . . . . . . . . . . $261,245 $260,932Current liabilities . . . . . . . . . . . . . . . . . . . . . . . . . . . . . . . . $ 32,126 $ 24,124Non-current liabilities . . . . . . . . . . . . . . . . . . . . . . . . . . . . $ 40,354 $ 30,174Redeemable preferred stock . . . . . . . . . . . . . . . . . . . . . . . $200,724 $193,021
F-19

LIONS GATE ENTERTAINMENT CORP.
NOTES TO AUDITED CONSOLIDATED FINANCIAL STATEMENTS— (Continued)
The following table presents the summarized statement of operations for the years ended March 31, 2011and 2010 for TV Guide Network and a reconciliation of the net loss reported by TV Guide Network to equityinterest loss recorded by the Company:
YearEnded
March 31,2011
Periodfrom
May 28,2009 to
March 31,2010 (1)
(Amounts in thousands)
Revenues . . . . . . . . . . . . . . . . . . . . . . . . . . . . . . . . . . . . . . $115,680 $ 96,983Expenses:
Cost of services . . . . . . . . . . . . . . . . . . . . . . . . . . . . . 38,369 29,760Selling, marketing, and general andadministration . . . . . . . . . . . . . . . . . . . . . . . . . . . . 60,913 49,493
Depreciation and amortization . . . . . . . . . . . . . . . . . . 15,331 15,609
Operating income . . . . . . . . . . . . . . . . . . . . . . . . . . . . . . . 1,067 2,121
Interest expense, net . . . . . . . . . . . . . . . . . . . . . . . . . . 1,853 784Accretion of redeemable preferred stock units (2) . . 27,703 20,587
Total Interest expense, net . . . . . . . . . . . . . . . . . 29,556 21,371
Loss before income taxes . . . . . . . . . . . . . . . . . . . . . . . . . (28,489) (19,250)Income tax expense . . . . . . . . . . . . . . . . . . . . . . . . . . (51) 12
Net loss . . . . . . . . . . . . . . . . . . . . . . . . . . . . . . . . . . . . . . . $ (28,540) $(19,262)
Reconciliation of net loss reported by TV GuideNetwork to equity interest loss:
Net loss reported by TV Guide Network . . . . . . . . . . $ (28,540) $(19,262)Ownership interest in TV Guide Network . . . . . . . . . 51% 51%
Share of net loss . . . . . . . . . . . . . . . . . . . . . . . . . . . . . (14,555) (9,824)Accretion of dividend and interest income onredeemable preferred stock units (2) . . . . . . . . . . . 14,129 10,499
Adjustments and eliminations of the Company’sshare of profits on sales to TV Guide Network . . . (2,744) (727)
Realization of the Company’s share of profits onsales to TV Guide Network . . . . . . . . . . . . . . . . . . 182 —
Total equity interest loss recorded . . . . . . . . . . . . . . . $ (2,988) $ (52)
(1) During the year ended March 31, 2010, the Company accounted for its interest in TV Guide Network underthe equity method of accounting from May 28, 2009, the date of deconsolidation, to March 31, 2010.
(2) Accretion of mandatorily redeemable preferred stock units represents TV Guide Network’s 10% dividendand the amortization of discount on its mandatorily redeemable preferred stock units held by the Companyand the 49% interest holder. The Company records 51% of this expense as income from the accretion ofdividend and discount on mandatorily redeemable preferred stock units as equity interest loss.
F-20

LIONS GATE ENTERTAINMENT CORP.
NOTES TO AUDITED CONSOLIDATED FINANCIAL STATEMENTS— (Continued)
Tiger Gate Entertainment Limited. Tiger Gate Entertainment Limited is an operator of pay televisionchannels and a distributor of television programming and action and horror films across Asia. The Company isrecording its share of the joint venture results on a one quarter lag and, accordingly, during the year endedMarch 31, 2011, the Company recorded its share of the loss incurred by the joint venture for the year endedDecember 31, 2010. The Company funded an additional $2.0 million during the year ended March 31, 2011.
8. Other Assets
The composition of the Company’s other assets is as follows as of March 31, 2011 and March 31, 2010:
March 31,2011
March 31,2010
(Amounts in thousands)
Deferred financing costs, net of accumulatedamortization . . . . . . . . . . . . . . . . . . . . . . . . . . . . . . . . . . . $15,422 $19,460
Loans receivable . . . . . . . . . . . . . . . . . . . . . . . . . . . . . . . . . 18,433 26,096Prepaid expenses and other . . . . . . . . . . . . . . . . . . . . . . . . . 12,746 16,471
$46,601 $62,027
Deferred Financing Costs. Deferred financing costs primarily include costs incurred in connection with (1) anamended senior revolving credit facility (see Note 9), (2) the issuance of the Senior Secured Second-PriorityNotes (as defined herein, see Note 10) and (3) the issuance of the October 2004 2.9375% Notes, theFebruary 2005 3.625% Notes and the April 2009 3.625% Notes (as defined herein, see Note 13) that are deferredand amortized to interest expense using the effective interest method.
Loans Receivable. The following table sets forth the Company’s loans receivable at March 31, 2011 andMarch 31, 2010:
Interest RateMarch 31,
2011March 31,
2010
(Amounts in thousands)
Third-party producer . . . . . . . . . . . . . . . . . . . . . . . 3.05% $ 8,777 $17,147NextPoint, Inc. (“Break Media”) . . . . . . . . . . . . . . 5.30% -20.0% 9,656 7,891Other . . . . . . . . . . . . . . . . . . . . . . . . . . . . . . . . . . . . 3.49% — 1,058
$18,433 $26,096
Prepaid Expenses and Other. Prepaid expenses and other primarily include prepaid expenses and securitydeposits.
9. Senior Revolving Credit Facility
Outstanding Amount. At March 31, 2011, the Company had borrowings of $69.8 million (March 31,2010 — $17.0 million).
Availability of Funds. At March 31, 2011, there was $255.2 million available (March 31, 2010 —$297.4 million). The senior revolving credit facility provides for borrowings and letters of credit up to anaggregate of $340 million. The availability of funds is limited by a borrowing base and also reduced byoutstanding letters of credit which amounted to $15.0 million at March 31, 2011 (March 31, 2010 —$25.6 million).
F-21

LIONS GATE ENTERTAINMENT CORP.
NOTES TO AUDITED CONSOLIDATED FINANCIAL STATEMENTS— (Continued)
Maturity Date. The senior revolving credit facility expires July 25, 2013.
Interest. As of March 31, 2011, the senior revolving credit facility bore interest of 2.5% over the “AdjustedLIBOR” rate (effective interest rate of 2.74% and 2.75% as of March 31, 2011 and March 31, 2010,respectively).
Commitment Fee. The Company is required to pay a quarterly commitment fee based upon 0.375% perannum on the total senior revolving credit facility of $340 million less the amount drawn.
Security. Obligations under the senior revolving credit facility are secured by collateral (as defined in thecredit agreement) granted by the Company and certain subsidiaries of the Company, as well as a pledge of equityinterests in certain of the Company’s subsidiaries.
Covenants. The senior revolving credit facility contains a number of affirmative and negative covenantsthat, among other things, require the Company to satisfy certain financial covenants and restrict the ability of theCompany to incur additional debt, pay dividends and make distributions, make certain investments andacquisitions, repurchase its stock and prepay certain indebtedness, create liens, enter into agreements withaffiliates, modify the nature of its business, enter into sale-leaseback transactions, transfer and sell material assetsand merge or consolidate.
Change in Control. Under the senior revolving credit facility, the Company may also be subject to an eventof default upon a change in control (as defined in the senior revolving credit facility) which, among other things,includes a person or group acquiring ownership or control in excess of 50% (amended from 20% on June 22,2010) of the Company’s common stock.
10. Senior Secured Second-Priority Notes
On October 21, 2009, Lions Gate Entertainment Inc. (“LGEI”), the Company’s wholly-owned subsidiary,issued $236.0 million aggregate principal amount of senior secured second-priority notes due 2016 (the “SeniorNotes”) in a private offering conducted pursuant to Rule 144A and Regulation S under the Securities Act of1933, as amended.
Outstanding Amount. The outstanding amount is set forth in the table below:
March 31,2011
March 31,2010
(Amounts in thousands)
Principal amount of Senior Secured Second-PriorityNotes . . . . . . . . . . . . . . . . . . . . . . . . . . . . . . . . . . . . . . . $236,000 $236,000
Unamortized discount (remaining period as of March 31,2011 of 5.6 years ) . . . . . . . . . . . . . . . . . . . . . . . . . . . . . (9,669) (10,845)
Net carrying amount of Senior Secured Second-PriorityNotes . . . . . . . . . . . . . . . . . . . . . . . . . . . . . . . . . . . . . . . $226,331 $225,155
Maturity Date. The Senior Notes are due November 1, 2016.
Original Issue Discount. The Senior Notes were issued by LGEI at an initial price of 95.222% (originalissue discount — 4.778%) of the principal amount. The original issue discount, interest and deferred financingcosts are being amortized through November 1, 2016 using the effective interest method.
Interest. The Senior Notes pay interest semi-annually on May 1 and November 1 of each year at a rate of10.25% per year.
F-22

LIONS GATE ENTERTAINMENT CORP.
NOTES TO AUDITED CONSOLIDATED FINANCIAL STATEMENTS— (Continued)
Security. The Senior Notes are guaranteed on a senior secured basis by the Company, and certain wholly-owned subsidiaries of both the Company and LGEI. The Senior Notes are ranked junior in right of payment tothe Company’s senior revolving credit facility, ranked equally in right of payment to the Company’s convertiblesenior subordinated notes, and ranked senior to any of the Company’s unsecured debt.
Covenants. The Senior Notes contain certain restrictions and covenants that, subject to certain exceptions,limit the Company’s ability to incur additional indebtedness, pay dividends or repurchase the Company’scommon shares, make certain loans or investments, and sell or otherwise dispose of certain assets subject tocertain conditions, among other limitations.
11. Participations and Residuals
The Company expects approximately 76% of accrued participations and residuals will be paid during theone-year period ending March 31, 2012.
Theatrical Slate Participation
On May 29, 2009, the Company terminated its theatrical slate participation arrangement with Pride Pictures,LLC (“Pride”), an unrelated entity. Under the arrangement dated May 25, 2007 and amended on January 30,2008, Pride contributed, in general, 50% of the Company’s production, acquisition, marketing and distributioncosts of theatrical feature films and participated in a pro rata portion of the pictures’ net profits or losses similarto a co-production arrangement based on the portion of costs funded. In late 2008, the administrative agent forthe senior lenders under Pride’s senior credit facility took the position, among others, that the senior lenders didnot have an obligation to continue to fund under the senior credit facility because the conditions precedent tofunding set forth in the senior credit facility could not be satisfied. The Company was not a party to the creditfacility. Consequently, Pride did not purchase the pictures The Spirit, My Bloody Valentine 3-D and Madea GoesTo Jail. Thereafter, on April 20, 2009, after failed attempts by the Company to facilitate a resolution, it gaveFilmCo and Pride notice that FilmCo, through Pride’s failure to make certain capital contributions, was in defaultof the Master Picture Purchase Agreement. On May 5, 2009, the representative for the Pride equity and the Pridemezzanine investor responded that the required amount was fully funded and that it had no further obligations tomake any additional capital contributions. Consequently, on May 29, 2009, the Company gave notice oftermination of the Master Picture Purchase Agreement. Since May 29, 2009, there have been no developmentswith respect to the arrangement. The Company will no longer receive financing as provided from theparticipation of Pride in its films.
Amounts provided from Pride are reflected as a participation liability. The difference between the ultimateparticipation expected to be paid to Pride and the amount provided by Pride is amortized as a charge to or areduction of participation expense under the individual-film-forecast method.
At March 31, 2011, $19.2 million (March 31, 2010, $24.1 million) was payable to Pride and is included inparticipations and residuals in the consolidated balance sheets.
Société Générale de Financement du Québec Filmed Entertainment Participation
On July 30, 2007, the Company entered into a four-year filmed entertainment slate participation agreementwith Société Générale de Financement du Québec (“SGF”), the Québec provincial government’s investment arm.SGF will provide up to 35% of production costs of television and feature film productions produced in Québecfor a four-year period for an aggregate participation of up to $140 million, and the Company will advance all
F-23

LIONS GATE ENTERTAINMENT CORP.
NOTES TO AUDITED CONSOLIDATED FINANCIAL STATEMENTS— (Continued)
amounts necessary to fund the remaining budgeted costs. The maximum aggregate of budgeted costs over thefour-year period will be $400 million, including the Company’s portion, but no more than $100 million per year.In connection with this agreement, the Company and SGF will proportionally share in the proceeds derived fromthe productions after the Company deducts a distribution fee, recoups all distribution expenses and releasingcosts, and pays all applicable third party participations and residuals.
Amounts provided from SGF are reflected as a participation liability. The difference between the ultimateparticipation expected to be paid to SGF and the amount provided by SGF is amortized as a charge to or areduction of participation expense under the individual film forecast method. At March 31, 2011, $7.1 million(March 31, 2010, $7.2 million) was payable to SGF and is included in participations and residuals in theconsolidated balance sheets. Under the terms of the arrangement, $35 million is available through July 30, 2011.Of the $35 million available through July 30, 2011, $5.3 million was provided through March 31, 2011, with theremaining commitment expiring on July 30, 2011.
12. Film Obligations and Production Loans
March 31,2011
March 31,2010
(Amounts in thousands)
Film obligations . . . . . . . . . . . . . . . . . . . . . . . . . . . . . . . . . $ 59,661 $ 40,267Production loans
Individual production loans . . . . . . . . . . . . . . . . . . . . 181,829 210,021Pennsylvania Regional Center production loans . . . . 65,500 65,746Film Credit Facility . . . . . . . . . . . . . . . . . . . . . . . . . . 20,430 35,735
Total film obligations and production loans . . . . . . . . . . . $327,420 $351,769
The following table sets forth future annual repayment of film obligations and production loans:
Year Ended March 31,
2012 2013 2014 2015 2016 Thereafter Total
(Amounts in thousands)
Future annual repayment of FilmObligations and ProductionLoans recorded as of March 31,2011Film obligations . . . . . . . . . . . . . $ 36,370 $10,254 $ 7,972 $4,691 $3,127 $— $ 62,414Production loans . . . . . . . . . . . . .
Individual productionloans . . . . . . . . . . . . . . . . 154,225 12,604 15,000 — — — 181,829
Pennsylvania RegionalCenter productionloans . . . . . . . . . . . . . . . . — — 65,500 — — — 65,500
Film Credit Facility . . . . . . 20,430 — — — — — 20,430
$211,025 $22,858 $88,472 $4,691 $3,127 $— $330,173
Less imputed interest onfilm obligations . . . . . . . . (2,753)
$327,420
F-24

LIONS GATE ENTERTAINMENT CORP.
NOTES TO AUDITED CONSOLIDATED FINANCIAL STATEMENTS— (Continued)
Film Obligations
Film obligations include minimum guarantees, which represent amounts payable for film rights that theCompany has acquired and certain theatrical marketing obligations, which represent amounts received from thirdparties that are contractually committed for theatrical marketing expenditures associated with specific titles.
Individual Production Loans
Production loans represent individual loans for the production of film and television programs that theCompany produces. Individual production loans have contractual repayment dates either at or near the expectedcompletion date, with the exception of certain loans containing repayment dates on a longer term basis.Individual production loans of $121.9 million incur interest at rates ranging from 3.45% to 4.25%, andapproximately $60.0 million of production loans are non-interest bearing.
Pennsylvania Regional Center
General. On April 9, 2008, the Company entered into a loan agreement with the Pennsylvania RegionalCenter, which provides for the availability of production loans up to $65,500,000 on a five-year term for use infilm and television productions in the State of Pennsylvania. The amount that was borrowed was limited toapproximately one half of the qualified production costs incurred in the State of Pennsylvania through thetwo-year period ended April 2010, and is subject to certain other limitations. Under the terms of the loan, forevery dollar borrowed, the Company’s production companies are required (within a two-year period) to eithercreate a specified number of jobs, or spend a specified amount in certain geographic regions in the State ofPennsylvania.
Outstanding Amount. At March 31, 2011, the Company had borrowings of $65.5 million (fair value —$62.0 million) (March 31, 2010 — $65.7 million (fair value — $60.3 million) which includes accrued interest of$0.2 million).
Availability of Funds. At March 31, 2011, there were no amounts available under this agreement (March 31,2010 — nil).
Maturity Date. All amounts borrowed under this loan agreement with the Pennsylvania Regional Center aredue April 11, 2013, five years from the date that the Company began to borrow under this agreement.
Interest. Amounts borrowed under the agreement carry an interest rate of 1.5%, which is payable semi-annually.
Security. The loan is secured by a first priority security interest in the Company’s film library pursuant to anintercreditor agreement with the Company’s senior lender under the Company’s senior revolving credit facility.Pursuant to the terms of the Company’s senior revolving credit facility, the Company is required to maintaincertain collateral equal to the loans outstanding plus 5% under this facility. Such collateral can consist of cash,cash equivalents or debt securities, including the Company’s convertible senior subordinated notes repurchased.As of March 31, 2011, $72.8 million principal value (fair value — $72.4 million) of the Company’s convertiblesenior subordinated notes repurchased in December 2009 (see Note 13) was held as collateral under theCompany’s senior revolving credit facility (March 31, 2010 — $72.8 million principal value, $69.5 million fairvalue).
Film Credit Facility
On October 6, 2009, the Company entered into a revolving film credit facility agreement, as amendedeffective June 22, 2010 (the “Film Credit Facility”), which provides for borrowings for the acquisition orproduction of motion pictures.
F-25

LIONS GATE ENTERTAINMENT CORP.
NOTES TO AUDITED CONSOLIDATED FINANCIAL STATEMENTS— (Continued)
Outstanding Amount. At March 31, 2011, the Company had borrowings of $20.4 million (March 31,2010 — $35.7 million).
Availability of Funds. Currently, the Film Credit Facility provides for total borrowings up to $130 million,subject to a borrowing base, which can vary based on the amount of sales contracts in place on pictures financedunder the facility. The Film Credit Facility can be increased to $200 million if additional qualified lenders orfinancial institutions become a party to and provide a commitment under the facility.
Maturity Date. The Film Credit Facility has a maturity date of April 6, 2013. Borrowings under the FilmCredit Facility are due the earlier of (a) nine months after delivery of each motion picture or (b) April 6, 2013.
Interest. As of March 31, 2011, the Film Credit Facility bore interest of 3.25% over the “LIBO” rate (asdefined in the credit agreement). The weighted average interest rate on borrowings outstanding as of March 31,2011 was 3.49% (March 31, 2010 — 3.50%).
Commitment Fee. The Company is required to pay a quarterly commitment fee of 0.75% per annum on theunused commitment under the Film Credit Facility.
Security. Borrowings under the Film Credit Facility are subject to a borrowing base calculation and aresecured by interests in the related motion pictures, together with certain other receivables from other motionpicture and television productions pledged by the Company, including a minimum pledge of such receivables of$25 million. Receivables pledged to the Film Credit Facility must be excluded from the borrowing basecalculation under the Company’s senior revolving credit facility, as described in Note 9.
13. Convertible Senior Subordinated Notes and Other Financing Obligations
Accounting Method Description. The Company accounts for its convertible senior subordinated notes byseparating the liability and equity components. The liability component is recorded at the date of issuance basedon its fair value which is generally determined in a manner that will reflect an interest cost equal to theCompany’s nonconvertible debt borrowing rate at the convertible senior subordinated notes issuance date. Theamount of the proceeds less the amount recorded as the liability component is recorded as an addition toshareholders’ equity reflecting the equity component (i.e., conversion feature). The difference between theprincipal amount and the amount recorded as the liability component represents the debt discount. The carryingamount of the liability is accreted up to the principal amount through the amortization of the discount, using theeffective interest method, to interest expense over the expected life of the note.
Outstanding Amount. The following table sets forth the convertible senior subordinated notes and otherfinancing obligations outstanding at March 31, 2011 and March 31, 2010:
March 31, 2011
PrincipalUnamortizedDiscount
Net CarryingAmount
(Amounts in thousands)
Convertible Senior Subordinated Notes . . . . . . . . . . . . . . . . . . . . . . . . . . . .October 2004 2.9375% (Equity Component $48,080) . . . . . . . . . . . . $ 46,326 $ (1,598) $ 44,728February 2005 3.625% (Equity Component $50,855) . . . . . . . . . . . . . 23,470 (1,363) 22,107April 2009 3.625% (Equity Component $16,085) . . . . . . . . . . . . . . . . 66,581 (26,161) 40,420
$136,377 $(29,122) 107,255
Other financing obligations . . . . . . . . . . . . . . . . . . . . . . . . . . . . . . . . . . . . . 3,718
$110,973
F-26

LIONS GATE ENTERTAINMENT CORP.
NOTES TO AUDITED CONSOLIDATED FINANCIAL STATEMENTS— (Continued)
March 31, 2010
PrincipalUnamortizedDiscount
NetCarryingAmount
(Amounts in thousands)
Convertible Senior Subordinated NotesOctober 2004 2.9375% (Equity Component $48,080) . . . . . . . . . . . . . . $110,035 $(10,564) $ 99,471February 2005 3.625% (Equity Component $50,855) . . . . . . . . . . . . . . 59,479 (6,804) 52,675April 2009 3.625% (Equity Component $16,085) . . . . . . . . . . . . . . . . . 66,581 (30,409) 36,172
$236,095 $(47,777) 188,318
Other financing obligations . . . . . . . . . . . . . . . . . . . . . . . . . . . . . . . . . . . . . . . 3,718
$192,036
The following table sets forth future annual contractual principal payment commitments under convertiblesenior subordinated notes as of March 31, 2011:
Year Ended March 31,
NoteFirst Holder
Redemption Date 2012 2013 2014 2015 2016 Thereafter Total
(Amounts in thousands)
October 2004 2.9375%Notes . . . . . . . . . . . . . . . . October 2011 $46,326 $— $— $ — $— $— $ 46,326
February 2005 3.625%Notes . . . . . . . . . . . . . . . . March 2012 23,470 — — — — — 23,470
April 2009 3.625% Notes . . March 2015 — — — 66,581 — — 66,581
$69,796 $— $— $66,581 $— $— $136,377
The future repayment dates of the convertible senior subordinated notes represent the first redemption dateby holder for each note respectively, as described above.
Interest Expense. The effective interest rate on the liability component and the amount of interest expense,which includes both the contractual interest coupon and amortization of the discount on the liability component,for the years ended March 31, 2011, 2010 and 2009 are presented below.
YearEnded
March 31,2011
YearEnded
March 31,2010
YearEnded
March 31,2009
(Amounts in thousands)
October 2004 2.9375% Convertible SeniorSubordinated Notes:Effective interest rate of liability component(9.65%) . . . . . . . . . . . . . . . . . . . . . . . . . . . . . . . . . .
Interest Expense . . . . . . . . . . . . . . . . . . . . . . . . . . . . .Contractual interest coupon . . . . . . . . . . . . . . . . . . $1,915 $ 3,879 $ 4,406Amortization of discount on liability componentand debt issuance costs . . . . . . . . . . . . . . . . . . . . 4,278 8,228 8,027
6,193 12,107 12,433
F-27

LIONS GATE ENTERTAINMENT CORP.
NOTES TO AUDITED CONSOLIDATED FINANCIAL STATEMENTS— (Continued)
YearEnded
March 31,2011
YearEnded
March 31,2010
YearEnded
March 31,2009
(Amounts in thousands)
February 2005 3.625% Convertible SeniorSubordinated Notes:Effective interest rate of liability component(10.03%) . . . . . . . . . . . . . . . . . . . . . . . . . . . . . . . . .
Interest Expense . . . . . . . . . . . . . . . . . . . . . . . . . . . . .Contractual interest coupon . . . . . . . . . . . . . . . . . . 1,238 2,965 6,235Amortization of discount on liability componentand debt issuance costs . . . . . . . . . . . . . . . . . . . . 2,053 5,399 8,387
3,291 8,364 14,622April 2009 3.625% Convertible Senior SubordinatedNotes:Effective interest rate of liability component(17.26%) . . . . . . . . . . . . . . . . . . . . . . . . . . . . . . . . .
Interest Expense . . . . . . . . . . . . . . . . . . . . . . . . . . . . .Contractual interest coupon . . . . . . . . . . . . . . . . . . 2,414 2,286 N/AAmortization of discount on liability componentand debt issuance costs . . . . . . . . . . . . . . . . . . . . 4,261 3,283 N/A
6,675 5,569 —TotalContractual interest coupon . . . . . . . . . . . . . . . . . . 5,567 9,130 10,641Amortization of discount on liability componentand debt issuance costs . . . . . . . . . . . . . . . . . . . . 10,592 16,910 16,414
$16,159 $26,040 $27,055
Convertible Senior Subordinated Notes Transactions
July 20, 2010 Refinancing Exchange Agreement: On July 20, 2010, the Company entered into a RefinancingExchange Agreement to exchange approximately $36.0 million in aggregate principal amount of theFebruary 2005 3.625% Notes and approximately $63.7 million in aggregate principal amount of theOctober 2004 2.9375% Notes for equal principal amounts, respectively, of new 3.625% Convertible SeniorSubordinated Notes due 2027 (the “New 3.625% Notes”) and new 2.9375% Convertible Senior SubordinatedNotes due 2026 (the “New 2.9375% Notes”, and together with the New 3.625% Notes, the “New Notes”). TheNew Notes took effect immediately and all terms were identical to the February 2005 3.625% Notes andOctober 2004 2.9375% Notes except that the New Notes had an extended maturity date, extended put rights bytwo years, and were immediately convertible at an initial conversion rate of 161.2903 common shares of theCompany per $1,000 principal amount of New Notes (conversion price per share of $6.20), subject to specifiedcontingencies.
On July 20, 2010, the New Notes were converted into 16,236,305 common shares of the Company. As aresult, the New Notes are no longer outstanding as of July 20, 2010.
As a result of the exchange transaction and related conversion, the Company recorded a non-cash loss onextinguishment of debt of $14.5 million during the quarter ended September 30, 2010, which includes the
F-28

LIONS GATE ENTERTAINMENT CORP.
NOTES TO AUDITED CONSOLIDATED FINANCIAL STATEMENTS— (Continued)
write-off of $0.6 million of unamortized deferred financing costs, an increase to common shares equity of$106.0 million and reduction in the carrying amount of the old notes of approximately $91.2 million. The lossrepresented the excess of the fair value of the common stock issuable pursuant to conversion terms contained inthe New Notes as compared to the fair value of the Company’s common stock issuable pursuant to theconversion terms of the old notes, partially offset by the excess of the carrying amount of the debt extinguishedover the fair value of the Company’s common stock issuable pursuant to the conversion terms of the old notes.
December 2009 Repurchase of a Portion of October 2004 2.9375% Notes and February 2005 3.625%Notes: In December 2009, LGEI paid $38.0 million to repurchase $40.0 million of aggregate principal amount(carrying value — $35.5 million) of the October 2004 2.9375% Notes and $37.7 million to repurchase$39.9 million of aggregate principal amount (carrying value — $35.0 million) of the February 2005 3.625%Notes. The Company recorded a loss on extinguishment in the quarter ended December 31, 2009 of $1.7 million,which includes $0.7 million of deferred financing costs written off. The loss represented the excess of the fairvalue of the liability component of the October 2004 2.9375% Notes and February 2005 3.625% Notes,repurchased over their carrying values, plus the deferred financing costs written off. The excess of the amountspaid over the fair values of the October 2004 2.9375% Notes and February 2005 3.625% Notes repurchased, wasrecorded as a reduction of shareholders’ equity reflecting the repurchases of the equity components of theOctober 2004 2.9375% Notes and February 2005 3.625% Notes repurchased.
The October 2004 2.9375% Notes and February 2005 3.625% Notes repurchased in December 2009 arebeing held as collateral under the Company’s senior revolving credit facility and may be resold at the prevailingmarket value.
April 20, 2009 Refinancing Exchange of a Portion of February 2005 3.625% Notes: On April 20, 2009,LGEI entered into Refinancing Exchange Agreements (the “2009 Refinancing Exchange Agreements”) withcertain existing holders of the February 2005 3.625% Notes. Pursuant to the terms of the 2009 RefinancingExchange Agreements, holders of the February 2005 3.625% Notes exchanged approximately $66.6 millionaggregate principal amount of the February 2005 3.625% Notes for new 3.625% convertible senior subordinatednotes (the “April 2009 3.625% Notes”) in the same aggregate principal amount under a new indenture enteredinto by LGEI, the Company, as guarantor, and an indenture trustee thereunder. As a result of the exchangetransaction, the Company recorded a gain on extinguishment of debt of $7.5 million during the quarter endedJune 30, 2009. The gain represented the excess of the carrying value of the liability component of theFebruary 2005 3.625% Notes over their fair value, net of the deferred financing costs written off. The excess ofthe fair value of both the equity and liability component of the April 2009 3.625% Notes over the fair value ofthe February 2005 3.625% Notes of $3.9 million was recorded as a reduction of shareholders’ equity reflectingthe repurchase of the equity component of the February 2005 3.625% Notes.
December 2008 Repurchase of a Portion of February 2005 3.625% Notes: In December 2008, LGEI paid$5.5 million to extinguish $9.0 million of aggregate principal amount (carrying value — $7.4 million) of theFebruary 2005 3.625% Notes and recorded a gain on extinguishment of $3.0 million during the quarter endedDecember 31, 2008, which includes $0.1 million of deferred financing costs written off. The gain represented theexcess of the carrying value of the liability component of the February 2005 3.625% Notes repurchased overtheir fair value, net of the deferred financing costs written off. The excess of the amount paid to repurchase theFebruary 2005 3.625% Notes over the fair value of the February 2005 3.625% Notes repurchased was recordedas a reduction of shareholders’ equity reflecting the repurchase of the equity component of the February 20053.625% Notes repurchased.
F-29

LIONS GATE ENTERTAINMENT CORP.
NOTES TO AUDITED CONSOLIDATED FINANCIAL STATEMENTS— (Continued)
Convertible Senior Subordinated Notes Terms
October 2004 2.9375% Notes. In October 2004, LGEI sold $150.0 million the October 2004 2.9375%Notes.
Outstanding Amount: As of March 31, 2011, $46.3 million of aggregate principal amount (carryingvalue — $44.7 million) of the October 2004 2.9375% Notes remain outstanding.
Interest: Interest on the October 2004 2.9375% Notes is payable semi-annually on April 15 andOctober 15.
Maturity Date: The October 2004 2.9375% Notes mature on October 15, 2024.
Redeemable by LGEI: From October 15, 2010 to October 14, 2011, LGEI may redeem the October2004 2.9375% Notes at 100.420%, and, thereafter, LGEI may redeem the October 2004 2.9375% Notesat 100%.
Redeemable by Holder: The holder may require LGEI to repurchase the October 2004 2.9375% Noteson October 15, 2011, 2014 and 2019 or upon a change in control at a price equal to 100% of the principalamount, together with accrued and unpaid interest through the date of repurchase.
Conversion Features: The holder may convert the October 2004 2.9375% Notes into the Company’scommon shares prior to maturity only if the price of the Company’s common shares issuable uponconversion of a note reaches or falls below a certain specific threshold over a specified period, the noteshave been called for redemption, a change in control occurs or certain other corporate transactions occur.Before the close of business on or prior to the trading day immediately before the maturity date, the holdermay convert the notes into the Company’s common shares at a conversion rate equal to 86.9565 shares per$1,000 principal amount of the October 2004 2.9375% Notes, subject to adjustment in certaincircumstances, which represents a conversion price of approximately $11.50 per share. Upon conversion ofthe October 2004 2.9375% Notes, the Company has the option to deliver, in lieu of common shares, cash ora combination of cash and common shares of the Company.
Make Whole Premium: Under certain circumstances, if the holder requires LGEI to repurchase all or aportion of their notes or the holder converts the notes upon a change in control, they will be entitled toreceive a make whole premium. The amount of the make whole premium, if any, will be based on the priceof the Company’s common shares on the effective date of the change in control. No make whole premiumwill be paid if the price of the Company’s common shares at such time is less than $8.79 per share orexceeds $50.00 per share.
February 2005 3.625% Notes. In February 2005, LGEI sold $175.0 million of the February 2005 3.625%Notes.
Outstanding Amount: As of March 31, 2011, $23.5 million of aggregate principal amount (carryingvalue — $22.1 million) of the February 2005 3.625% Notes remain outstanding.
Interest: Interest on the February 2005 3.625% Notes is payable at 3.625% per annum semi-annuallyon March 15 and September 15 until March 15, 2012 and at 3.125% per annum thereafter until maturity.
Maturity Date: The February 2005 3.625% Notes will mature on March 15, 2025.
Redeemable by LGEI: LGEI may redeem all or a portion of the February 2005 3.625% Notes at itsoption on or after March 15, 2012 at 100% of their principal amount, together with accrued and unpaidinterest through the date of redemption.
F-30

LIONS GATE ENTERTAINMENT CORP.
NOTES TO AUDITED CONSOLIDATED FINANCIAL STATEMENTS— (Continued)
Redeemable by Holder: The holder may require LGEI to repurchase the February 2005 3.625% Noteson March 15, 2012, 2015 and 2020 or upon a change in control at a price equal to 100% of the principalamount, together with accrued and unpaid interest through the date of repurchase.
Conversion Features: The February 2005 3.625% Notes are convertible, at the option of the holder, atany time before the maturity date, if the notes have not been previously redeemed or repurchased, at aconversion rate equal to 70.0133 shares per $1,000 principal amount of the February 2005 3.625% Notes,subject to adjustment in certain circumstances, which represents a conversion price of approximately $14.28per share. Upon conversion of the February 2005 3.625% Notes, the Company has the option to deliver, inlieu of common shares, cash or a combination of cash and common shares of the Company.
Make Whole Premium: Under certain circumstances, if the holder requires LGEI to repurchase all or aportion of their notes upon a change in control, they will be entitled to receive a make whole premium. Theamount of the make whole premium, if any, will be based on the price of the Company’s common shares onthe effective date of the change in control. No make whole premium will be paid if the price of theCompany’s common shares at such time is less than $10.35 per share or exceeds $75.00 per share.
April 2009 3.625% Notes. As discussed above, in April 2009, LGEI issued approximately $66.6 million of3.625% Convertible Senior Subordinated Notes (the “April 2009 3.625% Notes”).
Outstanding Amount: As of March 31, 2011, $66.6 million of aggregate principal amount (carryingvalue — $40.4 million) of the April 2009 3.625% Notes remain outstanding.
Interest: Interest on the April 2009 3.625% Notes is payable at 3.625% per annum semi-annually onMarch 15 and September 15 of each year.
Maturity Date: The April 2009 3.625% Notes will mature on March 15, 2025.
Redeemable by LGEI: On or after March 15, 2015, the Company may redeem the April 2009 3.625%Notes, in whole or in part, at a price equal to 100% of the principal amount of the April 2009 3.625% Notesto be redeemed, plus accrued and unpaid interest through the date of redemption.
Redeemable by Holder: The holder may require LGEI to repurchase the April 2009 3.625% Notes onMarch 15, 2015, 2018 and 2023 or upon a “designated event,” at a price equal to 100% of the principalamount of the April 2009 3.625% Notes to be repurchased plus accrued and unpaid interest.
Conversion Features: The April 2009 3.625% Notes may be converted into common shares of theCompany at any time before maturity, redemption or repurchase. The initial conversion rate of theApril 2009 3.625% Notes is 121.2121 common shares per $1,000 principal amount of the April 20093.625% Notes, subject to adjustment in certain circumstances, which represents a conversion price ofapproximately $8.25 per share. Upon conversion of the April 2009 3.625% Notes, the Company has theoption to deliver, in lieu of common shares, cash or a combination of cash and common shares of theCompany.
Make Whole Premium: Under certain circumstances, if the holder requires LGEI to repurchase all or aportion of their notes upon a change in control, they will be entitled to receive a make whole premium. Theamount of the make whole premium, if any, will be based on the price of the Company’s common shares onthe effective date of the change in control. No make whole premium will be paid if the price of theCompany’s common shares at such time is less than $5.36 per share or exceeds $50.00 per share.
F-31

LIONS GATE ENTERTAINMENT CORP.
NOTES TO AUDITED CONSOLIDATED FINANCIAL STATEMENTS— (Continued)
Other Financing Obligations
On June 1, 2007, the Company entered into a bank financing agreement for $3.7 million to fund theacquisition of certain capital assets. Interest is payable in monthly payments totaling $0.3 million per year forfive years at an interest rate of 8.02%, with the entire principal due June 2012.
14. Fair Value Measurements
Fair Value
Accounting guidance and standards about fair value define fair value as the price that would be receivedfrom selling an asset or paid to transfer a liability in an orderly transaction between market participants at themeasurement date.
Fair Value Hierarchy
Accounting guidance and standards about fair value establish a fair value hierarchy that requires an entity tomaximize the use of observable inputs and minimize the use of unobservable inputs when measuring fair value.A financial instrument’s categorization within the fair value hierarchy is based upon the lowest level of input thatis significant to the fair value measurement. The accounting guidance and standards establish three levels ofinputs that may be used to measure fair value:
• Level 1 — Quoted prices in active markets for identical assets or liabilities.
• Level 2 — Observable inputs other than Level 1 prices such as quoted prices for similar assets orliabilities; quoted prices in markets with insufficient volume or infrequent transactions (less activemarkets); or model-derived valuations in which all significant inputs are observable or can be derivedprincipally from or corroborated by observable market data for substantially the full term of the assetsor liabilities. Level 2 liabilities that are measured at fair value on a recurring basis include theCompany’s senior revolving credit facility and convertible senior subordinated notes, both priced usingdiscounted cash flow techniques that use observable market inputs, such as LIBOR-based yield curves,three- and seven-year swap rates, and credit ratings.
• Level 3 — Unobservable inputs to the valuation methodology that are significant to the measurementof fair value of assets or liabilities.
The following table sets forth the carrying values and fair values (all determined using Level 2 inputsdefined above) of the Company’s outstanding debt at March 31, 2011:
CarryingValue Fair Value
(Level 2)(Amounts in thousands)
Senior revolving credit facility . . . . . . . . . . . . . . . . . . . . . $ 69,750 $ 69,750October 2004 2.9375% Convertible Senior SubordinatedNotes . . . . . . . . . . . . . . . . . . . . . . . . . . . . . . . . . . . . . . . 44,728 46,713
February 2005 3.625% Convertible Senior SubordinatedNotes . . . . . . . . . . . . . . . . . . . . . . . . . . . . . . . . . . . . . . . 22,107 22,926
April 2009 3.625% Convertible Senior SubordinatedNotes . . . . . . . . . . . . . . . . . . . . . . . . . . . . . . . . . . . . . . . 40,420 59,205
Senior Secured Second-Priority Notes . . . . . . . . . . . . . . . 226,331 248,685
$403,336 $447,279
F-32

LIONS GATE ENTERTAINMENT CORP.
NOTES TO AUDITED CONSOLIDATED FINANCIAL STATEMENTS— (Continued)
15. Comprehensive Loss
Components of accumulated other comprehensive loss are as follows:
ForeignCurrencyTranslationAdjustments
UnrealizedGain (Loss)on ForeignExchangeContracts
UnrealizedGain (Loss) on
Securities
AccumulatedOther
ComprehensiveLoss
(Amounts in thousands)
Balance at March 31, 2009 . . . . . . . . . . . . $(11,896) $ 18 $— $(11,878)Current year change . . . . . . . . . . . . . . . . . 4,849 418 — 5,267
Balance at March 31, 2010 . . . . . . . . . . . . (7,047) 436 — (6,611)Current year change . . . . . . . . . . . . . . . . . 5,756 (569) — 5,187
Balance at March 31, 2011 . . . . . . . . . . . . $ (1,291) $(133) $— $ (1,424)
16. Capital Stock
(a) Common Shares
The Company had 500,000,000 authorized shares of common stock at March 31, 2011 and 2010. The tablebelow outlines common shares reserved for future issuance:
March 31,2011
March 31,2010
(Amounts in thousands)
Stock options outstanding, average exercise price $9.75(March 31, 2010 — $9.75) . . . . . . . . . . . . . . . . . . . . . . . 3,310 3,360
Restricted share units — unvested . . . . . . . . . . . . . . . . . . . 1,801 3,416Share purchase options and restricted share units availablefor future issuance . . . . . . . . . . . . . . . . . . . . . . . . . . . . . . 3,683 3,717
Shares issuable upon conversion of October 20042.9375% Notes at conversion price of $11.50 pershare . . . . . . . . . . . . . . . . . . . . . . . . . . . . . . . . . . . . . . . . 4,028 9,568
Shares issuable upon conversion of February 2005 3.625%Notes at conversion price of $14.28 per share . . . . . . . . 1,643 4,164
Shares issuable upon conversion of April 2009 3.625%Notes at conversion price of $8.25 per share . . . . . . . . . 8,070 8,070
Shares reserved for future issuance . . . . . . . . . . . . . . . . . . . 22,535 32,295
The Company’s Board of Directors has authorized the repurchase of up to $150 million of the Company’scommon shares, with the timing, price, quantity, and manner of the purchases to be made at the discretion ofmanagement, depending upon market conditions. During the period from the authorization date throughMarch 31, 2011, 6,787,310 shares have been repurchased pursuant to the plan at a cost of approximately$65.2 million, including commission costs. During the year ended March 31, 2009, 4,588,675 shares wererepurchased pursuant to the plan at a cost of approximately $45.0 million. No shares were repurchased during theyears ended March 31, 2011 and 2010. The share repurchase program has no expiration date.
(b) Share-Based Compensation
The Company has two stock option and long-term incentive plans that permit the grant of stock options andother equity awards to certain employees, officers, non-employee directors and consultants for up to 23.0 millionshares of the Company’s common stock.
F-33

LIONS GATE ENTERTAINMENT CORP.
NOTES TO AUDITED CONSOLIDATED FINANCIAL STATEMENTS— (Continued)
Employees’ and Directors’ Equity Incentive Plan (the “Plan”): The plan provides for the issuance of up to9.0 million shares of common stock of the Company to eligible employees, directors, and service providers. Ofthe 9.0 million common shares allocated for issuance, up to a maximum of 250,000 common shares may beissued as discretionary bonuses in accordance with the terms of a share bonus plan. No new awards were grantedunder the Plan subsequent to the 2004 Annual General Meeting of Shareholders. Any remaining shares availablefor additional grant purposes under the Plan may be issued under the 2004 Plan. At March 31, 2011, 101,351common shares were available for grant under the 2004 Plan.
2004 Performance Incentive Plan (the “2004 Plan”): The 2004 Plan provides for the issuance of up to anadditional 14.0 million common shares, stock options, share appreciation rights, restricted shares, share bonusesor other forms of awards granted or denominated in common shares of the Company to eligible employees,directors, officers and other eligible persons through the grant of awards and incentives for high levels ofindividual performance and improved financial performance of the Company. The per share exercise price of anoption granted under the 2004 Plan generally may not be less than the fair market value of a common share of theCompany on the date of grant. The maximum term of an option granted under the 2004 Plan is ten years from thedate of grant. At March 31, 2011, 3,581,255 common shares were available for grant under the 2004 Plan.
The Company accounts for stock-based compensation in accordance with accounting standards that requirethe measurement of all stock-based awards using a fair value method and the recognition of the related stock-based compensation expense in the consolidated financial statements over the requisite service period. Further,the Company estimates forfeitures for share-based awards that are not expected to vest. As stock-basedcompensation expense recognized in the Company’s consolidated financial statements is based on awardsultimately expected to vest, it has been reduced for estimated forfeitures.
The Company recognized the following stock-based compensation expense (benefit) during the years endedMarch 31, 2011, 2010 and 2009:
YearEnded
March 31,2011
YearEnded
March 31,2010
YearEnded
March 31,2009
(Amounts in thousands)
Compensation Expense (Benefit): . . . . . . . . . . . . . . . . .Stock Options . . . . . . . . . . . . . . . . . . . . . . . . . . . . . $ 2,644 $ 3,213 $ 3,184Restricted Share Units and Other Share-basedCompensation . . . . . . . . . . . . . . . . . . . . . . . . . . . 26,032 14,385 10,063
Stock Appreciation Rights . . . . . . . . . . . . . . . . . . . 3,829 1,225 (3,527)
Total . . . . . . . . . . . . . . . . . . . . . . . . . . . . . . . . . . . . $32,505 $18,823 $ 9,720
On June 30, 2010, certain unvested equity awards of certain executive officers immediately vested as aresult of the triggering of “change in control” provisions in their respective employment agreements. Forpurposes of the employment agreements with such executive officers, a “change in control” occurred on June 30,2010 when a certain shareholder became the beneficial owner of 33% or more of the Company’s common shares.As a result, the Company recognized $21.9 million in additional compensation expense during the year endedMarch 31, 2011, which is included in the table above.
There was no income tax benefit recognized in the statements of operations for stock-based compensationarrangements during the years ended March 31, 2011, 2010 and 2009.
F-34

LIONS GATE ENTERTAINMENT CORP.
NOTES TO AUDITED CONSOLIDATED FINANCIAL STATEMENTS— (Continued)
Stock Options
A summary of option activity under the various plans as of March 31, 2011, 2010 and 2009 and changesduring the years then ended is presented below:
Options:Number ofShares (1)
Numberof Shares (2)
TotalNumber ofShares
Weighted-AverageExercisePrice
WeightedAverage
RemainingContractual
Term In Years
AggregateIntrinsic
Value as ofMarch 31,
2011
Outstanding at April 1, 2008 . . . . . 4,537,363 600,000 5,137,363 $ 8.32Granted . . . . . . . . . . . . . . . . . . 5,000 — 5,000 9.53Exercised . . . . . . . . . . . . . . . . (1,158,177) — (1,158,177) 3.67Forfeited or expired . . . . . . . . (85,020) — (85,020) 6.51
Outstanding at March 31, 2009 . . . 3,299,166 600,000 3,899,166 $ 9.75Granted . . . . . . . . . . . . . . . . . . 110,000 — 110,000 5.41Exercised . . . . . . . . . . . . . . . . — — — —Forfeited or expired . . . . . . . . (649,166) — (649,166) 8.97
Outstanding at March 31, 2010 . . . 2,760,000 600,000 3,360,000 $ 9.75Granted . . . . . . . . . . . . . . . . . . — — — —Exercised . . . . . . . . . . . . . . . . — — — —Forfeited or expired . . . . . . . . (50,000) — (50,000) 10.00
Outstanding at March 31, 2011 . . . 2,710,000 600,000 3,310,000 $ 9.75 5.83 $92,800
Outstanding as of March 31, 2011,vested or expected to vest in thefuture . . . . . . . . . . . . . . . . . . . . . 2,706,333 600,000 3,306,333 $ 9.75 5.83 $89,707
Exercisable at March 31, 2011 . . . 2,636,666 600,000 3,236,666 $ 9.85 5.77 $30,933
(1) Issued under our long-term incentive plans.(2) On September 10, 2007, in connection with the acquisition of Mandate Pictures (see Note 17), two
executives entered into employment agreements with LGF. Pursuant to the employment agreements, theexecutives were granted an aggregate of 600,000 stock options, all of which have vested. The options weregranted outside of our long-term incentive plans.
The fair value of each option award is estimated on the date of grant using a closed-form option valuationmodel (Black-Scholes) based on the assumptions noted in the following table. Expected volatilities are based onimplied volatilities from traded options on the Company’s stock, historical volatility of the Company’s stock andother factors. The expected term of options granted represents the period of time that options granted areexpected to be outstanding. The weighted-average grant-date fair values for options granted during the yearended March 31, 2011 was nil (2010 — $3.21, 2009 — $3.06). The following table represents the assumptionsused in the Black-Scholes option-pricing model for stock options granted during the years ended March 31, 2010and 2009:
YearEnded
March 31,2010
YearEnded
March 31,2009
Risk-free interest rate 2.6% - 3.6% 2.7%Expected option lives (in years) . . . . . . . . . . . . . . . . . . 10 years 5.0 yearsExpected volatility for options . . . . . . . . . . . . . . . . . . . 45% 31%Expected dividend yield . . . . . . . . . . . . . . . . . . . . . . . . 0% 0%
F-35

LIONS GATE ENTERTAINMENT CORP.
NOTES TO AUDITED CONSOLIDATED FINANCIAL STATEMENTS— (Continued)
The total intrinsic value of options exercised as of each exercise date during the year ended March 31, 2011was nil (2010 — nil, 2009 — $7.1 million).
During the year ended March 31, 2009, 279,368 shares were cancelled to fund withholding tax obligationsupon exercise.
Restricted Share Units
Effective June 27, 2005, the Company, pursuant to the 2004 Plan, began granting restricted share units tocertain employees, directors and consultants.
A summary of the status of the Company’s restricted share units as of March 31, 2011, 2010 and 2009, andchanges during the years then ended is presented below:
Restricted Share Units:Number ofShares (1)
Number ofShares (2)
TotalNumber ofShares
Weighted AverageGrant Date Fair
Value
Outstanding at April 1, 2008 . . . . . . . . . . 2,037,125 287,500 2,324,625 $10.09Granted . . . . . . . . . . . . . . . . . . . . . . . 1,301,400 105,000 1,406,400 8.57Vested . . . . . . . . . . . . . . . . . . . . . . . . (1,097,403) (8,333) (1,105,736) 10.06Forfeited . . . . . . . . . . . . . . . . . . . . . . (59,621) — (59,621) 10.07
Outstanding at March 31, 2009 . . . . . . . . 2,181,501 384,167 2,565,668 $ 9.27Granted . . . . . . . . . . . . . . . . . . . . . . . 1,910,792 52,500 1,963,292 5.58Vested . . . . . . . . . . . . . . . . . . . . . . . . (918,618) (113,334) (1,031,952) 9.16Forfeited . . . . . . . . . . . . . . . . . . . . . . (81,040) — (81,040) 7.91
Outstanding at March 31, 2010 . . . . . . . . 3,092,635 323,333 3,415,968 $ 7.22Granted . . . . . . . . . . . . . . . . . . . . . . . 2,585,688 105,000 2,690,688 6.84Vested . . . . . . . . . . . . . . . . . . . . . . . . (3,792,987) (428,333) (4,221,320) 7.24Forfeited . . . . . . . . . . . . . . . . . . . . . . (84,278) — (84,278) 4.90
Outstanding at March 31, 2011 . . . . . . . . 1,801,058 — 1,801,058 $ 6.70
(1) Issued under our long-term incentive plans.(2) On September 10, 2007, in connection with the acquisition of Mandate Pictures (see Note 17), two
executives entered into employment agreements with Lions Gate Films, Inc. Pursuant to the employmentagreements, the executives were granted an aggregate of 287,500 restricted share units, all of which havevested. The restricted share units were granted outside of our long-term incentive plans.
The fair values of restricted share units are determined based on the market value of the shares on the dateof grant.
The following table summarizes the total remaining unrecognized compensation cost as of March 31, 2011related to non-vested stock options and restricted share units and the weighted average remaining years overwhich the cost will be recognized:
TotalUnrecognizedCompensation
Cost
WeightedAverage
RemainingYears
(Amounts in thousands)
Stock Options . . . . . . . . . . . . . . . . . . . . . . . . . . . . . . . . $ 160 1.4Restricted Share Units . . . . . . . . . . . . . . . . . . . . . . . . . 7,591 1.6
Total . . . . . . . . . . . . . . . . . . . . . . . . . . . . . . . . . . . . . . . $7,751
F-36

LIONS GATE ENTERTAINMENT CORP.
NOTES TO AUDITED CONSOLIDATED FINANCIAL STATEMENTS— (Continued)
At March 31, 2011, 458,037 shares of restricted share units have been awarded to two key executiveofficers, the vesting of which will be subject to performance targets to be set annually by the CompensationCommittee of the Board of Directors of the Company. These restricted share units will vest in two annualinstallments assuming annual performance targets have been met. The fair value of the 458,037 shares whosefuture annual performance targets have not been set was $2.9 million, based on the market price of theCompany’s common shares as of March 31, 2011. The market value will be remeasured when the annualperformance criteria are set and the value will be expensed over the remaining vesting periods once it becomesprobable that the performance targets will be satisfied.
Under the Company’s two stock option and long term incentive plans, the Company withholds shares tosatisfy minimum statutory federal, state and local tax withholding obligations arising from the vesting ofrestricted share units. During the year ended March 31, 2011, 1,832,026 shares were withheld upon the vesting ofrestricted share units.
The Company becomes entitled to an income tax deduction in an amount equal to the taxable incomereported by the holders of the stock options and restricted share units when vesting or exercise occurs, therestrictions are released and the shares are issued. Restricted share units are forfeited if the employees terminateprior to vesting.
Stock Appreciation Rights
The Company has the following stock appreciation rights (“SARs”) outstanding as of March 31, 2011:
Grant Date
July 14,2008
August 14,2008
February 5,2009
April 6,2009
March 17,2010
February 15,2011
SARs outstanding . . . . . . . . . . . . . . . . . 750,000 250,000 850,000 700,000 500,000 1,000,000Vested and exercisable . . . . . . . . . . . . . 750,000 250,000 850,000 700,000 500,000 0Exercise price . . . . . . . . . . . . . . . . . . . . $ 9.56 $ 11.16 $ 5.45 $ 5.17 $ 5.95 $ 6.13Original vesting period (see below) . . . 3 years 4 years 3 years 4 years 4 years 3 yearsExpiration date . . . . . . . . . . . . . . . . . . . July 14,
2013June 20,
2012February5, 2014
April 6,2014
March17, 2015
February15, 2016
Fair value as of March 31, 2011 . . . . . . $ 0.86 $ 0.25 $ 2.24 $ 2.41 $ 2.41 $ 2.63Liability as of March 31, 2011 (inthousands) . . . . . . . . . . . . . . . . . . . . . $ 643 $ 62 $ 1,906 $ 1,690 $ 1,203 $ 551
At March 31, 2011, the Company has a stock-based compensation liability accrual in the amount of$6.1 million (March 31, 2010 — $2.3 million) included in accounts payable and accrued liabilities on theconsolidated balance sheets relating to these SARs.
On June 30, 2010, the SARs granted on February 5, 2009, April 6, 2009 and March 17, 2010 became fullyvested due to the triggering of the “change in control” provisions in certain executive officer employmentagreements discussed above.
On February 15, 2011, the Company granted an additional 1,000,000 SARs to a third party producer, whichvest in 333,333 SAR increments over a three-year period based on the commencement of principal photographyof certain films.
F-37

LIONS GATE ENTERTAINMENT CORP.
NOTES TO AUDITED CONSOLIDATED FINANCIAL STATEMENTS— (Continued)
SARs require that upon their exercise, the Company pay the holder the excess of the market value of theCompany’s common stock at that time over the exercise price of the SAR multiplied by the number of SARsexercised. SARs can be exercised at any time subsequent to vesting and prior to expiration. The fair value of allunexercised SARs are determined at each reporting period under a Black-Scholes option pricing methodologybased on the inputs in the table below and are recorded as a liability over the vesting period. With the exceptionof the SARs granted on July 14, 2008 and February 15, 2011, the fair value of the SARs is expensed on a pro ratabasis over the vesting period or service period, if shorter. Changes in the fair value of vested SARs are expensedin the period of change. SARs granted on July 14, 2008 and February 15, 2011 were granted to a third partyproducer and vest in 250,000 and 333,333 SAR increments, respectively, over a three-year period based on thecommencement of principal photography of certain films. Accordingly, the pro rata portion of the fair value ofSARs is recorded as part of the cost of the related films until commencement of principal photography of themotion picture (i.e., vesting) with subsequent changes in the fair value of SARs recorded to expense.
For the year ended March 31, 2011, the following assumptions were used in the Black-Scholes option-pricing model:
Grant Date
July 14,2008
August 14,2008
February 5,2009
April 6,2009
March 17,2010
February 15,2011
Risk-free interest rate . . . . . . . . . . . . . . . 0.8% 0.3% 1.3% 1.3% 1.8% 2.2%Expected option lives (in years) . . . . . . . 2.3 years 1.2 years 2.9 years 3.0 years 4.0 years 4.9 yearsExpected volatility for options . . . . . . . . 45% 45% 45% 45% 45% 45%Expected dividend yield . . . . . . . . . . . . . 0% 0% 0% 0% 0% 0%
Other Share-Based Compensation
During the years ended March 31, 2011 and 2010, as per the terms of certain employment agreements, theCompany granted the equivalent of $1.8 million and $1.2 million, respectively, in common shares to certainofficers on a quarterly basis through the term of their employment contracts. For the years ended March 31, 2011and 2010, the Company issued 150,299 and 131,234 shares, respectively, net of shares withheld to satisfyminimum tax withholding obligations. The Company recorded stock-based compensation expense related to thisarrangement in the amount of $1.8 million, $1.3 million and $0.5 million for the years ended March 31, 2011,2010 and 2009, respectively.
17. Acquisitions and Divestitures
TV Guide Network
Acquisition of TV Guide Network. On February 28, 2009, the Company purchased all of the issued andoutstanding equity interests of TV Guide Network and TV Guide.com (collectively “TV Guide Network”), anetwork and online provider of entertainment and television guidance-related programming, as well as localizedprogram listings and descriptions primarily in the U.S. The Company paid approximately $241.6 million for allof the equity interest of TV Guide Network, which included a capital lease obligation of $12.1 million, andincurred approximately $1.5 million in direct transaction costs (legal fees, accountant’s fees and otherprofessional fees).
Sale of Non-Controlling Interest in TV Guide Network. On May 28, 2009, the Company entered into aPurchase Agreement with OEP, the global private equity investment arm of JPMorgan Chase Bank, N.A.,pursuant to which OEP purchased 49% of the Company’s interest in TV Guide Network for approximately$122.4 million in cash. In addition, OEP reserved the option of buying another 1% of TV Guide Network undercertain circumstances. The arrangement contains joint control rights, as evidenced in an operating agreement aswell as certain transfer restrictions and exit rights. There was no gain or loss on the transaction.
F-38

LIONS GATE ENTERTAINMENT CORP.
NOTES TO AUDITED CONSOLIDATED FINANCIAL STATEMENTS— (Continued)
The February 28, 2009 acquisition was accounted for as a purchase, with the results of operations ofTV Guide Network included in the Company’s consolidated results from February 28, 2009 through May 27,2009. Subsequent to the sale of TV Guide Network, and pursuant to the new accounting guidance on accountingfor VIEs effective April 1, 2010, which the Company has retrospectively applied, the Company’s interest inTV Guide Network is being accounted for under the equity method of accounting (see Note 7).
The final allocation of the February 28, 2009 acquisition purchase price to the assets acquired and liabilitiesassumed was recorded in the separate financial statements of TV Guide Network and was as follows:
Allocation
(Amounts inthousands)
Accounts receivable, net . . . . . . . . . . . . . . . . . . . . . . . . . . . $ 14,505Property and equipment . . . . . . . . . . . . . . . . . . . . . . . . . . . . 26,649Other assets acquired . . . . . . . . . . . . . . . . . . . . . . . . . . . . . . 1,831Finite-lived intangible assets:
Customer relationships . . . . . . . . . . . . . . . . . . . . . . . . . 66,340Trademarks/trade names . . . . . . . . . . . . . . . . . . . . . . . 10,250Internal use software . . . . . . . . . . . . . . . . . . . . . . . . . . 2,200Prepaid patent license agreements . . . . . . . . . . . . . . . . 1,510
Goodwill . . . . . . . . . . . . . . . . . . . . . . . . . . . . . . . . . . . . . . . . 152,599Other liabilities assumed . . . . . . . . . . . . . . . . . . . . . . . . . . . (32,775)
Total purchase price including transaction costs . . . $243,109
Acquisition of Mandate Pictures, LLC
On September 10, 2007, the Company purchased all of the membership interests in Mandate Pictures, LLC(“Mandate”), a worldwide independent film producer and distributor. The Company paid approximately $58.6million, comprised of $46.8 million in cash and 1,282,999 of the Company’s common shares. The value assignedto the shares for purposes of recording the acquisition was $11.8 million and was based on the average price ofthe Company’s common shares a few days prior and subsequent to the date of the closing of the acquisition,which is when it was publicly announced.
In addition, the Company may be obligated to pay additional amounts pursuant to the purchase agreementshould certain films or derivative works meet certain target performance thresholds. Such amounts, to the extentthey relate to films or derivative works of films identified at the acquisition date will be charged to goodwill ifthe target thresholds are achieved, and such amounts, to the extent they relate to other qualifying films producedin the future, will be accounted for similar to other film participation arrangements. The amount to be paid is theexcess of the sum of the following amounts over the performance threshold (i.e., the “Hurdle Amount”):
• 80% of the earnings of certain films for the longer of 5 years from the closing or 5 years from therelease of the pictures, plus
• 20% of the earnings of certain pictures which commence principal photography within 5 years from theclosing date for a period up to 10 years, plus
• certain fees designated for derivative works which commence principal photography within 7 years ofthe initial release of the original picture.
The Hurdle Amount is the purchase price of approximately $56 million plus an interest cost accruing untilsuch hurdle is reached, and certain other costs the Company agreed to pay in connection with the acquisition.Accordingly, the additional consideration is the total of the above in excess of the Hurdle Amount. As of
F-39

LIONS GATE ENTERTAINMENT CORP.
NOTES TO AUDITED CONSOLIDATED FINANCIAL STATEMENTS— (Continued)
March 31, 2011, the total earnings and fees from identified projects in process are not projected to reach theHurdle Amount. However, as additional projects are identified in the future and current projects are released inthe market place, the total projected earnings and fees from these projects could increase causing additionalpayments to the sellers to become payable.
Acquisition of Debmar-Mercury, LLC
On July 3, 2006, the Company acquired all of the capital stock of Debmar-Mercury, LLC (“Debmar-Mercury”), a leading syndicator of film and television packages. Consideration for the Debmar-Mercuryacquisition was $27.0 million, comprised of a combination of $24.5 million in cash paid on July 3, 2006 and$2.5 million in common shares of the Company issued in January 2008, and assumed liabilities of $10.5 million.Goodwill of $8.7 million represents the excess of the purchase price over the fair value of the net identifiabletangible and intangible assets acquired.
The purchase agreement provided for additional purchase consideration if the aggregate earnings beforeinterest, taxes, depreciation and amortization adjusted to add back 20% of the overhead expense (“AdjustedEBITDA”) of Debmar-Mercury exceeded certain thresholds. In March 2010, the Company negotiated thebuy-out of this potential additional purchase consideration for $15 million. This amount was recorded as anaddition to goodwill in March 2010. In connection with this buy-out, the Company extended certain employmentcontracts which provides for certain contractual bonuses, as defined.
18. Direct Operating Expenses
Year Year YearEnded Ended Ended
March 31, March 31, March 31,2011 2010 2009
(Amounts in thousands)
Amortization of films and television programs . . . . . . $529,428 $511,658 $458,757Participations and residual expense . . . . . . . . . . . . . . . 265,319 264,945 328,267Other expenses:
Provision for doubtful accounts . . . . . . . . . . . . . . (501) 1,398 3,718Foreign exchange losses (gains) . . . . . . . . . . . . . . 1,500 (32) 3,074
$795,746 $777,969 $793,816
19. Income Taxes
The Company’s Canadian, UK, U.S., Australian and Hong Kong pretax income (loss), net of intercompanyeliminations, are as follows:
Year Year YearEnded Ended Ended
March 31, March 31, March 31,2011 2010 2009
(Amounts in thousands)
Canada . . . . . . . . . . . . . . . . . . . . . . . . . . . . . . . . . . . . . $ 30,573 $ 15,167 $ (6,011)United Kingdom . . . . . . . . . . . . . . . . . . . . . . . . . . . . . . 19,122 23,663 (9,747)United States . . . . . . . . . . . . . . . . . . . . . . . . . . . . . . . . (99,107) (57,171) (155,734)Australia . . . . . . . . . . . . . . . . . . . . . . . . . . . . . . . . . . . . 69 81 (744)Hong Kong . . . . . . . . . . . . . . . . . . . . . . . . . . . . . . . . . . — — (3,494)
$(49,343) $(18,260) $(175,730)
F-40

LIONS GATE ENTERTAINMENT CORP.
NOTES TO AUDITED CONSOLIDATED FINANCIAL STATEMENTS— (Continued)
The Company’s current and deferred income tax provision (benefits) are as follows:
Year Year YearEnded Ended Ended
March 31, March 31, March 31,2011 2010 2009
(Amounts in thousands)
Current . . . . . . . . . . . . . . . . . . . . . . . . . . . . . . . . . . . . . . . $ 3,567 $ 871 $ 876Deferred . . . . . . . . . . . . . . . . . . . . . . . . . . . . . . . . . . . . . . 689 347 1,848
$ 4,256 $1,218 $2,724
CANADACurrent . . . . . . . . . . . . . . . . . . . . . . . . . . . . . . . . . . . . . . . $ 576 $ 779 $ (590)Deferred . . . . . . . . . . . . . . . . . . . . . . . . . . . . . . . . . . . . . . (1,280) — 513
(704) 779 (77)
UNITED KINGDOMCurrent . . . . . . . . . . . . . . . . . . . . . . . . . . . . . . . . . . . . . . . $ 327 $ — $ —Deferred . . . . . . . . . . . . . . . . . . . . . . . . . . . . . . . . . . . . . . — —
327 — —
UNITED STATESCurrent . . . . . . . . . . . . . . . . . . . . . . . . . . . . . . . . . . . . . . . $ 2,650 $ 29 $1,569Deferred . . . . . . . . . . . . . . . . . . . . . . . . . . . . . . . . . . . . . . 1,969 347 1,318
4,619 376 2,887
AUSTRALIACurrent . . . . . . . . . . . . . . . . . . . . . . . . . . . . . . . . . . . . . . . $ 14 $ 63 $ (103)Deferred . . . . . . . . . . . . . . . . . . . . . . . . . . . . . . . . . . . . . . — — 17
14 63 (86)
The differences between income taxes expected at U.S. statutory income tax rates and the income taxprovision are as set forth below:
Year Year YearEnded Ended Ended
March 31, March 31, March 31,2011 2010 2009
(Amounts in thousands)
Income taxes (tax benefits) computed at Federalstatutory rate of 35% . . . . . . . . . . . . . . . . . . . . . . . . . $(17,270) $(6,391) $(61,506)
Federal alternative minimum tax . . . . . . . . . . . . . . 0 (1,567) (88)Foreign and provincial operations subject todifferent income tax rates . . . . . . . . . . . . . . . . . . (256) (307) 1,455
State income tax . . . . . . . . . . . . . . . . . . . . . . . . . . . 427 494 1,327Change to the accrual for tax liability . . . . . . . . . . 0 (482) (255)Foreign income tax withholding . . . . . . . . . . . . . . . 2,608 1,698 1,148Permanent differences . . . . . . . . . . . . . . . . . . . . . . 25,639 6,019 (2,102)Deferred tax on goodwill amortization . . . . . . . . . . 1,970 1,001 1,318Other . . . . . . . . . . . . . . . . . . . . . . . . . . . . . . . . . . . . (903) (506) (1,602)Increase (decrease) in valuation allowance . . . . . . (7,959) 1,259 63,029
$ 4,256 $ 1,218 $ 2,724
F-41

LIONS GATE ENTERTAINMENT CORP.
NOTES TO AUDITED CONSOLIDATED FINANCIAL STATEMENTS— (Continued)
Although the Company is incorporated under Canadian law, the majority of its global operations arecurrently subject to tax in the U.S. As a result, the Company believes it is more appropriate to use theU.S. Federal statutory rate in its reconciliation of the statutory rate to its reported income tax rate.
The income tax effects of temporary differences between the book value and tax basis of assets andliabilities are as follows:
March 31, March 31,2011 2010
(Amounts in thousands)CANADAAssets . . . . . . . . . . . . . . . . . . . . . . . . . . . . . . . . . . . . . . .
Net operating losses . . . . . . . . . . . . . . . . . . . . . . . . $ 25,293 $ 9,961Property and equipment . . . . . . . . . . . . . . . . . . . . . 1,906 1,792Reserves . . . . . . . . . . . . . . . . . . . . . . . . . . . . . . . . . 1,317 1,670Other . . . . . . . . . . . . . . . . . . . . . . . . . . . . . . . . . . . . 1,532 5,975Valuation allowance . . . . . . . . . . . . . . . . . . . . . . . . (28,254) (18,938)
1,794 460Liabilities
Investment in film and television obligations . . . . (25) (104)Other . . . . . . . . . . . . . . . . . . . . . . . . . . . . . . . . . . . . (427) (356)
Net Canada . . . . . . . . . . . . . . . . . . . . . . . . . . . . . . . . . . . 1,342 —
UNITED KINGDOMAssets
Net operating losses . . . . . . . . . . . . . . . . . . . . . . . . $ 3,818 $ 4,439Property and equipment . . . . . . . . . . . . . . . . . . . . . 70 45Interest Payable . . . . . . . . . . . . . . . . . . . . . . . . . . . . 846 674Other . . . . . . . . . . . . . . . . . . . . . . . . . . . . . . . . . . . . 11 52Valuation Allowance . . . . . . . . . . . . . . . . . . . . . . . (3,655) (4,030)
1,090 1,180Liabilities . . . . . . . . . . . . . . . . . . . . . . . . . . . . . . . . . . . .
Investment in film and television obligations . . . . (1,090) (1,180)
Net United Kingdom . . . . . . . . . . . . . . . . . . . . . . . . . . . — —
UNITED STATESAssets . . . . . . . . . . . . . . . . . . . . . . . . . . . . . . . . . . . . . . .
Net operating losses . . . . . . . . . . . . . . . . . . . . . . . . $ 64,454 $ 48,894Accounts payable . . . . . . . . . . . . . . . . . . . . . . . . . . 15,121 18,315Other assets . . . . . . . . . . . . . . . . . . . . . . . . . . . . . . . 54,010 54,836Reserves . . . . . . . . . . . . . . . . . . . . . . . . . . . . . . . . . 58,965 59,197Valuation allowance . . . . . . . . . . . . . . . . . . . . . . . . (121,376) (114,157)
71,174 67,085Liabilities . . . . . . . . . . . . . . . . . . . . . . . . . . . . . . . . . . . .
Investment in film and television obligations . . . . (12,972) (12,224)Accounts receivable . . . . . . . . . . . . . . . . . . . . . . . . (444) (457)Subordinated notes . . . . . . . . . . . . . . . . . . . . . . . . . (16,255) (20,930)Other . . . . . . . . . . . . . . . . . . . . . . . . . . . . . . . . . . . . (45,182) (35,183)
Net United States . . . . . . . . . . . . . . . . . . . . . . . . . . . . . . (3,679) (1,709)
F-42

LIONS GATE ENTERTAINMENT CORP.
NOTES TO AUDITED CONSOLIDATED FINANCIAL STATEMENTS— (Continued)
March 31, March 31,2011 2010
(Amounts in thousands)
AUSTRALIAAssets . . . . . . . . . . . . . . . . . . . . . . . . . . . . . . . . . . . . . . . . .
Net operating losses . . . . . . . . . . . . . . . . . . . . . . . . . . $ —Property and equipment . . . . . . . . . . . . . . . . . . . . . . . 1 1Other . . . . . . . . . . . . . . . . . . . . . . . . . . . . . . . . . . . . . . 1 1Valuation allowance . . . . . . . . . . . . . . . . . . . . . . . . . . (2) (2)
Liabilities Net Australia . . . . . . . . . . . . . . . . . . . . . . . — —
TOTAL . . . . . . . . . . . . . . . . . . . . . . . . . . . . . . . . . . . . . . . . $(2,337) $(1,709)
Due to the uncertainty surrounding the timing of realizing the benefits of its deferred tax assets in future taxreturns, the Company has recorded a valuation allowance against its deferred tax assets with the exception ofdeferred tax liabilities related to tax goodwill and certain foreign deferred tax assets. The total change in thevaluation allowance was $16.2 million and $14.5 million for fiscal 2011 and fiscal 2010, respectively.
The deferred tax liabilities associated with tax goodwill cannot be considered a source of taxable income tosupport the realization of deferred tax assets, because these deferred tax liabilities will not reverse until someindefinite future period. As such, the Company has recorded a deferred tax liability as of March 31, 2011 and2010 of $3.7 million and $1.7 million, respectively, arising from the Mandate Pictures and TV Guide Networkacquisitions.
At March 31, 2011, the Company had U.S. net operating loss carryforwards of approximately $179.0million available to reduce future federal income taxes which expire beginning in 2019 through 2029. AtMarch 31, 2011, the Company had state net operating loss carryforwards of approximately $123.5 millionavailable to reduce future state income taxes which expire in varying amounts beginning 2011. At March 31,2011, the Company had Canadian loss carryforwards of $31.7 million which will expire beginning in 2014through 2030, and $6.8 million of UK loss carryforwards available indefinitely to reduce future income taxes.The Company expects the future utilization of the Company’s U.S. NOLs to offset future taxable income will besubject to a substantial annual limitation as a result of ownership changes that have occurred previously or thatcould occur in the future.
The Company recognizes tax benefits associated with the exercise of stock options and vesting of restrictedshare units directly to stockholders’ equity only when realized. Accordingly, deferred tax assets are notrecognized for net operating loss carryforwards resulting from tax benefits occurring from April 1, 2006 onward.A tax benefit occurs when the actual tax benefit realized upon an employee’s disposition of a share-based awardexceeds the deferred tax asset, if any, associated with the award. At March 31, 2011, deferred tax assets do notinclude $25.1 million of loss carryovers from stock-based compensation.
U.S. income taxes were not provided on undistributed earnings from Australian and UK subsidiaries. Thoseearnings are considered to be permanently reinvested in accordance with accounting guidance.
Accounting guidance clarifies the accounting for uncertainty in income taxes recognized in an entity’sfinancial statements and prescribes a recognition threshold and measurement attributes for financial statementdisclosure of tax positions taken or expected to be taken on a tax return. Under this accounting guidance, theimpact of an uncertain income tax position on the income tax return must be recognized at the largest amount
F-43

LIONS GATE ENTERTAINMENT CORP.
NOTES TO AUDITED CONSOLIDATED FINANCIAL STATEMENTS— (Continued)
that is more-likely-than-not to be sustained upon audit by the relevant taxing authority. An uncertain income taxposition will not be recognized if it has less than a 50% likelihood of being sustained. Additionally, thisaccounting guidance provides guidance on derecognition, classification, interest and penalties, accounting ininterim periods, disclosure and transition.
The Company adopted the provisions of this accounting standard on April 1, 2007. Upon adoption, theCompany recognized no adjustment in its balance of unrecognized tax benefits. As of April 1, 2007, the date ofadoption, the Company’s unrecognized tax benefits totaled $0.5 million exclusive of associated interest andpenalties.
The following table summarizes the changes to the gross unrecognized tax benefits for the years endedMarch 31, 2011, 2010, and 2009:
(Amountsin millions)
Gross unrecognized tax benefits at April 1, 2008 . . . . . . . . . $—Increases in tax positions for prior years . . . . . . . . . . . . . . . . —Decreases in tax positions for prior years . . . . . . . . . . . . . . . —Increases in tax positions for current year . . . . . . . . . . . . . . . —Settlements . . . . . . . . . . . . . . . . . . . . . . . . . . . . . . . . . . . . . . . —Lapse in statute of limitations . . . . . . . . . . . . . . . . . . . . . . . . —Gross unrecognized tax benefits at March 31, 2009 . . . . . . . —Increases in tax positions for prior years . . . . . . . . . . . . . . . . —Decreases in tax positions for prior years . . . . . . . . . . . . . . . —Increases in tax positions for current year . . . . . . . . . . . . . . . 0.4Settlements . . . . . . . . . . . . . . . . . . . . . . . . . . . . . . . . . . . . . . . —Lapse in statute of limitations . . . . . . . . . . . . . . . . . . . . . . . . —Gross unrecognized tax benefits at March 31, 2010 . . . . . . . —Increases in tax positions for prior years . . . . . . . . . . . . . . . . —Decreases in tax positions for prior years . . . . . . . . . . . . . . . (0.1)Increases in tax positions for current year . . . . . . . . . . . . . . . —Settlements . . . . . . . . . . . . . . . . . . . . . . . . . . . . . . . . . . . . . . . —Lapse in statute of limitations . . . . . . . . . . . . . . . . . . . . . . . . —Gross unrecognized tax benefits at March 31, 2011 . . . . . . . 0.3
The Company’s practice is to recognize interest and/or penalties related to income tax matters in income taxexpense. For the years ended March 31, 2011 and 2010, interest and penalties were not significant. The Companyis subject to taxation in the U.S. and various state and foreign jurisdictions. With a few exceptions, the Companyis subject to income tax examination by U.S. and state tax authorities for the fiscal years ended March 31, 2005and forward. However, to the extent allowed by law, the taxing authorities may have the right to examine priorperiods where net operating losses (“NOLs”) were generated and carried forward, and make adjustments up tothe amount of the NOLs. The Company’s fiscal years ended March 31, 2007 and forward are subject toexamination by the UK tax authorities. The Company’s fiscal years ended March 31, 2006 and forward aresubject to examination by the Canadian tax authorities. The Company’s fiscal years ended March 31, 2007 andforward are subject to examination by the Australian tax authorities. Currently, audits are occurring in variousstate and local tax jurisdictions.
F-44

LIONS GATE ENTERTAINMENT CORP.
NOTES TO AUDITED CONSOLIDATED FINANCIAL STATEMENTS— (Continued)
20. Government Assistance
Tax credits earned for film and television production activity for the year ended March 31, 2011 totaled$57.8 million (2010 — $51.7 million; 2009 — $39.4 million) and are recorded as a reduction of the cost of therelated film and television program. Accounts receivable at March 31, 2011 includes $79.6 million with respectto tax credits receivable (2010 — $45.8 million).
The Company is subject to routine inquiries and review by regulatory authorities of its various incentiveclaims which have been received or are receivable. Adjustments of claims, if any, as a result of such inquiries orreviews, will be recorded at the time of such determination.
21. Segment Information
Accounting guidance requires the Company to make certain disclosures about each reportable segment. TheCompany’s reportable segments are determined based on the distinct nature of their operations and each segmentis a strategic business unit that offers different products and services and is managed separately. The Companyhas two reportable business segments as of March 31, 2011: Motion Pictures and Television Production. TheMedia Networks segment has been reclassified to the equity interest line item from May 28, 2009, the date ofsale of the 49% interest in TV Guide Network, as a result of the new accounting standard adopted on April 1,2010 and retrospectively applied (see Note 2). Motion Pictures consists of the development and production offeature films, acquisition of North American and worldwide distribution rights, North American theatrical, homeentertainment and television distribution of feature films produced and acquired, and worldwide licensing ofdistribution rights to feature films produced and acquired.
Television Production consists of the development, production and worldwide distribution of televisionproductions including television series, television movies and mini-series and non-fiction programming.
Segmented information by business is as follows:
Year Year YearEnded Ended Ended
March 31, March 31, March 31,2011 2010 2009
(Amounts in thousands)
Segment revenues . . . . . . . . . . . . . . . . . . . . .Motion Pictures . . . . . . . . . . . . . . . . . . . $ 1,229,493 $ 1,119,355 $ 1,233,879Television Production . . . . . . . . . . . . . . 353,227 350,876 222,173Media Networks (February 28, 2009thru May 27, 2009) . . . . . . . . . . . . . . — 19,275 10,322
$1,582,720 $1,489,506 $1,466,374
Direct operating expenses . . . . . . . . . . . . . . .Motion Pictures . . . . . . . . . . . . . . . . . . . $ 525,919 $ 491,603 $ 613,339Television Production . . . . . . . . . . . . . . 269,827 278,943 176,763Media Networks (February 28, 2009thru May 27, 2009) . . . . . . . . . . . . . . — 7,423 3,714
$ 795,746 $ 777,969 $ 793,816
F-45

LIONS GATE ENTERTAINMENT CORP.
NOTES TO AUDITED CONSOLIDATED FINANCIAL STATEMENTS— (Continued)
Year Year YearEnded Ended Ended
March 31, March 31, March 31,2011 2010 2009
(Amounts in thousands)
Distribution and marketing . . . . . . . . . . . . . . . . . . . . .Motion Pictures . . . . . . . . . . . . . . . . . . . . . . . . . . $511,795 $471,606 $641,571Television Production . . . . . . . . . . . . . . . . . . . . . 35,431 32,527 26,149Media Networks (February 28, 2009 thruMay 27, 2009) . . . . . . . . . . . . . . . . . . . . . . . . . — 2,008 1,837
$547,226 $506,141 $669,557
Segment contribution before general andadministration expenses . . . . . . . . . . . . . . . . . . . . . .Motion Pictures . . . . . . . . . . . . . . . . . . . . . . . . . . $191,779 $156,146 $ (21,031)Television Production . . . . . . . . . . . . . . . . . . . . . 47,969 39,406 19,261Media Networks (February 28, 2009 thruMay 27, 2009) . . . . . . . . . . . . . . . . . . . . . . . . . — 9,844 4,771
$239,748 $205,396 $ 3,001
General and administration . . . . . . . . . . . . . . . . . . . . .Motion Pictures . . . . . . . . . . . . . . . . . . . . . . . . . . $ 48,413 $ 47,251 $ 49,643Television Production . . . . . . . . . . . . . . . . . . . . . 11,470 9,699 13,129Media Networks (February 28, 2009 thruMay 27, 2009) . . . . . . . . . . . . . . . . . . . . . . . . . — 6,194 3,770
$ 59,883 $ 63,144 $ 66,542
Segment profit (loss) . . . . . . . . . . . . . . . . . . . . . . . . . .Motion Pictures . . . . . . . . . . . . . . . . . . . . . . . . . . $143,366 $108,895 $ (70,674)Television Production . . . . . . . . . . . . . . . . . . . . . 36,499 29,707 6,132Media Networks (February 28, 2009 thruMay 27, 2009) . . . . . . . . . . . . . . . . . . . . . . . . . — 3,650 1,001
$179,865 $142,252 $ (63,541)
Acquisition of investment in films and televisionprograms . . . . . . . . . . . . . . . . . . . . . . . . . . . . . . . . . .Motion Pictures . . . . . . . . . . . . . . . . . . . . . . . . . . $313,579 $287,991 $366,095Television Production . . . . . . . . . . . . . . . . . . . . . 173,812 176,725 187,913Media Networks (February 28, 2009 thruMay 27, 2009) . . . . . . . . . . . . . . . . . . . . . . . . . — 6,371 4,269
$487,391 $471,087 $558,277
Segment contribution before general and administration expenses is defined as segment revenue lesssegment direct operating and distribution and marketing expenses.
F-46

LIONS GATE ENTERTAINMENT CORP.
NOTES TO AUDITED CONSOLIDATED FINANCIAL STATEMENTS— (Continued)
Segment profit (loss) is defined as segment revenue less segment direct operating, distribution andmarketing and general and administration expenses. The reconciliation of total segment profit (loss) to theCompany’s loss before income taxes is as follows:
Year Year YearEnded Ended Ended
March 31, March 31, March 31,2011 2010 2009
(Amounts in thousands)
Company’s total segment profit (loss) . . . . . . . . . . . $ 179,865 $142,252 $ (63,541)Less:
Shared services and corporate expenses (1) . . . (111,524) (79,916) (70,021)Depreciation and amortization . . . . . . . . . . . . . (5,811) (12,455) (7,657)Interest expense . . . . . . . . . . . . . . . . . . . . . . . . . (55,180) (47,162) (34,275)Interest and other income . . . . . . . . . . . . . . . . . 1,742 1,547 5,785Gain (loss) on extinguishment of debt . . . . . . . . (14,505) 5,675 3,023Equity interests loss . . . . . . . . . . . . . . . . . . . . . . (43,930) (28,201) (9,044)
Loss before income taxes . . . . . . . . . . . . . . . . . . . . . $ (49,343) $ (18,260) $(175,730)
(1) Includes stock-based compensation expense of $32.2 million, $18.8 million, and $9.7 million for the yearsended March 31, 2011, 2010, and 2009, respectively. During the year ended March 31, 2011 the Companyincurred $21.9 million of stock-based compensation expense associated with the immediate vesting ofequity awards of certain executive officers triggered by the “change in control” provisions in theirrespective employment agreements. The $21.9 million of accelerated stock-based compensation expenseincludes $7.0 million of stock-based compensation expense that would have been expensed during the yearended March 31, 2011. Also includes special charges associated with a shareholder activist matter of $22.9million, $5.8 million and $1.0 million for the years ended March 31, 2011, 2010 and 2009, respectively.
The following table sets forth significant assets as broken down by segment and other unallocated assets asof March 31, 2011 and 2010:
March 31, 2011 March 31, 2010
Motion Television Motion TelevisionPictures Production Total Pictures Production Total
(Amounts in thousands)
Significant assets by segment . . . . . . .Accounts receivable . . . . . . . . . . $196,290 $163,531 $ 359,821 $171,522 $121,402 $ 292,924Investment in films andtelevision programs, net . . . . . 516,164 105,124 621,288 553,058 108,047 661,105
Goodwill . . . . . . . . . . . . . . . . . . . 210,293 28,961 239,254 210,293 28,961 239,254
$922,747 $297,616 $1,220,363 $934,873 $258,410 $1,193,283
Other unallocated assets (primarilycash, other assets and equitymethod investments) . . . . . . . . . . . . 337,481 333,872
Total assets . . . . . . . . . . . . . . . . . . . . . $1,557,844 $1,527,155
F-47

LIONS GATE ENTERTAINMENT CORP.
NOTES TO AUDITED CONSOLIDATED FINANCIAL STATEMENTS— (Continued)
Purchases of property and equipment amounted to $2.8 million, $3.7 million, and $8.7 million for the fiscalyear ended March 31, 2011, 2010, and 2009, respectively, all primarily pertaining to purchases for theCompany’s corporate headquarters for the year ended March 31, 2011, and primarily pertaining to purchases forMedia Networks prior to the deconsolidation of TV Guide Network for the years ended March 31, 2010 and2009.
Revenue by geographic location, based on the location of the customers, with no other foreign countryindividually comprising greater than 10% of total revenue, is as follows:
Year Year YearEnded Ended Ended
March 31, March 31, March 31,2011 2010 2009
(Amounts in thousands)
Canada . . . . . . . . . . . . . . . . . . . . . . . . . . . . . . . . . $ 86,955 $ 71,402 $ 71,925United States . . . . . . . . . . . . . . . . . . . . . . . . . . . . 1,223,454 1,171,336 1,195,138Other foreign . . . . . . . . . . . . . . . . . . . . . . . . . . . . 272,311 246,768 199,311
$1,582,720 $1,489,506 $1,466,374
Assets by geographic location are as follows:
March 31, March 31,2011 2010
(Amounts in thousands)
Canada . . . . . . . . . . . . . . . . . . . . . . . . . . . . . . . . . . . $ 75,005 $ 49,927United States . . . . . . . . . . . . . . . . . . . . . . . . . . . . . . 1,382,073 1,380,172United Kingdom . . . . . . . . . . . . . . . . . . . . . . . . . . . 96,257 95,740Australia . . . . . . . . . . . . . . . . . . . . . . . . . . . . . . . . . 4,509 1,316
$1,557,844 $1,527,155
Total amount of revenue from one retail customer representing greater than 10% of consolidated revenuesfor the year ended March 31, 2011 was $197.2 million (2010 — $191.9 million; 2009 — $255.1 million).Accounts receivable due from this retail customer was approximately 12% of consolidated gross accountsreceivable at March 31, 2011 and accounts receivable due from a broadcasting customer was approximately 24%of consolidated gross accounts receivable at March 31, 2011. The total amount of gross accounts receivable duefrom this retail customer was approximately $55.2 million at March 31, 2011 and the total amount of grossaccounts receivable due from this broadcasting customer was approximately $111.4 million at March 31, 2011.Accounts receivable due from this retail customer was approximately 15% of consolidated gross accountsreceivable at March 31, 2010 and accounts receivable due from a broadcasting customer was approximately 19%of consolidated gross accounts receivable at March 31, 2010. The total amount of gross accounts receivable duefrom this retail customer was approximately $60.1 million at March 31, 2010 and the total amount of grossaccounts receivable due from this broadcasting customer was approximately $74.3 million at March 31, 2010.
F-48

LIONS GATE ENTERTAINMENT CORP.
NOTES TO AUDITED CONSOLIDATED FINANCIAL STATEMENTS— (Continued)
22. Commitments and Contingencies
The following table sets forth our future annual repayment of debt and other financing obligations outstanding,and our contractual commitments as of March 31, 2011:
Year Ended March 31,
2012 2013 2014 2015 2016 Thereafter Total
Future annual repayment of debt andother financing obligations recorded asof March 31, 2011Senior revolving credit facility . . . . . . . $ — $ — $ 69,750 $ — $ — $ — $ 69,750Film obligations(1) . . . . . . . . . . . . . . . . 36,370 10,254 7,972 4,691 3,127 — 62,414Production loans(1) . . . . . . . . . . . . . . .
Individual production loans . . . . . 154,225 12,604 15,000 — — — 181,829Pennsylvania Regional Centerproduction loans . . . . . . . . . . . . — — 65,500 — — — 65,500
Film Credit Facility . . . . . . . . . . . 20,430 — — — — — 20,430Principal amounts of convertible seniorsubordinated notes and otherfinancing obligations (2) . . . . . . . . .October 2004 2.9375% Notes(carrying value of $44.7 millionat March 31, 2011) . . . . . . . . . . 46,326 — — — — — 46,326
February 2005 3.625% Notes(carrying value of $22.1 millionat March 31, 2011) . . . . . . . . . . 23,470 — — — — — 23,470
April 2009 3.625% Notes(carrying value of $40.4 millionat March 31, 2011) . . . . . . . . . . — — — 66,581 — — 66,581
Other financing obligations . . . . . — 3,718 — — — — 3,718Principal amount of senior securedsecond-priority notes, dueNovember 2016 (carrying value of$226.3 million at March 31,2011)(5) . . . . . . . . . . . . . . . . . . . . . . — — — — — 236,000 236,000
$280,821 $26,576 $158,222 $71,272 $3,127 $236,000 $776,018
F-49

LIONS GATE ENTERTAINMENT CORP.
NOTES TO AUDITED CONSOLIDATED FINANCIAL STATEMENTS— (Continued)
Year Ended March 31,
2012 2013 2014 2015 2016 Thereafter Total
Contractual commitments byexpected repayment dateDistribution and marketingcommitments (3) . . . . . . . . . . . $ 84,456 $ 52,000 $ — $ — $ — $ — $ 136,456
Minimum guaranteecommitments (4) . . . . . . . . . . . 104,062 37,421 6,093 4,966 3,310 — 155,852
Production loan commitments(4) . . . . . . . . . . . . . . . . . . . . . . 15,498 5,049 — — — — 20,547
Cash interest payments onsubordinated notes and otherfinancing obligations . . . . . . . . 4,921 2,440 2,414 2,414 — — 12,189
Cash interest payments on seniorsecured second prioritynotes . . . . . . . . . . . . . . . . . . . . 24,190 24,190 24,190 24,190 24,190 24,190 145,140
Operating lease commitments . . . 9,078 9,460 9,523 8,976 4,157 603 41,797Other contractual obligations . . . 524 — — — — — 524Employment and consultingcontracts . . . . . . . . . . . . . . . . . 35,539 20,752 9,536 2,648 1,890 — 70,365
$278,268 $151,312 $ 51,756 $ 43,194 $33,547 $ 24,793 $ 582,870
Total future commitments undercontractual obligations . . . . . . . . . $559,089 $177,888 $209,978 $114,466 $36,674 $260,793 $1,358,888
(1) Film obligations include minimum guarantees and theatrical marketing obligations. Production loansrepresent loans for the production of film and television programs that we produce. Repayment dates arebased on anticipated delivery or release date of the related film or contractual due dates of the obligation.
(2) The future repayment dates of the convertible senior subordinated notes represent the first possibleredemption date by the holder for each note respectively.
(3) Distribution and marketing commitments represent contractual commitments for future expendituresassociated with distribution and marketing of films which we will distribute. The payment dates of theseamounts are primarily based on the anticipated release date of the film.
(4) Minimum guarantee commitments represent contractual commitments related to the purchase of film rightsfor pictures to be delivered in the future. Production loan commitments represent amounts committed forfuture film production and development to be funded through production financing and recorded as aproduction loan liability when incurred. Future payments under these commitments are based on anticipateddelivery or release dates of the related film or contractual due dates of the commitment. The amountsinclude future interest payments associated with the commitment.
(5) Excludes $200.0 million of additional senior secured second-priority notes, due November 2016 that wereissued on May 13, 2011 (see Note 29).
Operating Leases. The Company has operating leases for offices and equipment. The Company incurredrental expense of $8.6 million during the year ended March 31, 2011 (2010 — $9.7 million; 2009 —$9.6 million). The Company earned sublease income of $0.7 million during the year ended March 31, 2011(2010 — $0.7 million; 2009 — $0.5 million).
Contingencies. On July 23, 2010, Icahn Partners filed a petition in the BC Court against us, Dr. Rachesky,MHR Fund Management LLC and MHR Institutional Partners III LP (the “MHR Fund”) and Kornitzer CapitalManagement, Inc. (the “BC Action”). Icahn Partners filed an amended petition on July 26, 2010. Dr. Rachesky isthe managing member of MHR Institutional Partners III LP’s general partner. Among other things, IcahnPartners claimed that a July 20, 2010 Refinancing Exchange Agreement (as discussed under “Management’sdiscussion and analysis of financial conditions and results of operations—Refinancing exchange agreement”)
F-50

LIONS GATE ENTERTAINMENT CORP.
NOTES TO AUDITED CONSOLIDATED FINANCIAL STATEMENTS— (Continued)
between us and Kornitzer Capital Management, Inc. to exchange certain convertible senior subordinated notes ofLGEI (the “Exchange”), as well as the Note Sale (as defined below) and Conversion (as defined below), were“oppressive” to Icahn Partners under British Columbia law. Icahn Partners sought orders that would, among otherthings, (1) declare that the Company is oppressing its shareholders, (2) prohibit MHR Institutional Partners III LPfrom transferring or voting its new shares, (3) prohibit us from issuing any securities, (4) unwind the July 20transactions between the MHR Fund, us, and Kornitzer Capital Management, Inc. (which includes the Exchange,the Note Sale and the Conversion) and (5) compensate the petitioners. The BC Court heard argument during theweek of October 11, 2010. On November 1, 2010, the BC Court issued a final order and decision dismissingIcahn Partners’ claims in their entirety and awarding costs to us. On November 2, 2010, Icahn Partnersannounced its intent to appeal the decision. On November 5, 2010, a single Justice of the British Columbia Courtof Appeal denied Icahn Partners’ application for an expedited appeal or, in the alternative, an order prohibitingthe Company from scheduling its 2010 annual general meeting of shareholders before January 21, 2011. IcahnPartners’ application to vary this order was denied by a panel of the British Columbia Court of Appeal onDecember 7, 2010. The British Columbia Court of Appeal heard oral argument on the Icahn Partners’ appealfrom the final order and decision of the BC Court on March 24, 2011. The appeal was dismissed on May 10,2011. For purposes herein, the “Note Sale” means the July 20, 2010 entry into a Purchase Agreement andsubsequent sale of the New Notes received by Kornitzer Capital Management, Inc. in the Exchange to MHRInstitutional Partners III LP. Additionally, the “Conversion” means, after the consummation of the Note Sale, theJuly 20, 2010 exercise by MHR Institutional Partners III LP of conversion rights under the New Notes wherebythe New Notes were converted in full into 16,236,305 common shares of Lions Gate.
Icahn Partners also sought an order from the British Columbia Securities Commission (the “BCSC”) on July 22,2010 requiring, among other things, that Dr. Rachesky, the MHR Fund, and their respective affiliates ceasetrading in any of our securities until further order of the BCSC and that we and each of our directors ceasetrading in any of our securities until further order of the BCSC. Icahn Partners alleged that the Exchange was,among other things, an unlawful defensive tactic, and that the disclosures concerning the transactions violatedapplicable securities laws. A hearing on the request for a temporary cease trade order was held on July 28, 2010,and the BCSC determined to dismiss Icahn Partners’ application for a temporary cease trade order against us andthe MHR Fund.
On July 26, 2010, Icahn Partners filed suit in New York Supreme Court against us, our Board of Directors, LGEI,Dr. Rachesky, the MHR Fund, MHR Institutional Advisors II LLC, MHR Institutional Advisors III LLC, andKornitzer Capital Management, Inc. and its principal John C. Kornitzer (the “New York Action”). Icahn Partnersclaimed, among other things, that the Exchange and subsequent issuance of common shares of Lions Gate toDr. Rachesky’s fund through the Conversion constituted (1) a breach of a certain July 9, 2010 letter agreementbetween us and Icahn Partners; (2) tortious interference with the same July 9 letter agreement; and (3) tortiousinterference with prospective business relationships. The complaint sought, among other things, a preliminaryand permanent injunction rescinding the Exchange and share issuance; a preliminary injunction prohibiting alldefendants from voting their shares in any election of directors or any other shareholder vote; and an award ofcompensatory and punitive damages. On August 26, 2010, the defendants moved to dismiss or stay the NewYork Action. On November 15, 2010, Icahn Partners filed a motion for a preliminary injunction. Icahn Partners’motion for a preliminary injunction was denied on December 9, 2010. On March 30, 2011, defendants’ motion todismiss the complaint was granted in its entirety and the complaint was dismissed. Icahn Partners filed a noticeof appeal on April 4, 2011.
On October 28, 2010, we filed an action in the United States District Court for the Southern District of New Yorkagainst Carl Icahn, Brett Icahn, and various investment vehicles controlled by Carl Icahn. The action is captionedLions Gate Entertainment Corp. v. Carl C. Icahn, Brett Icahn, Icahn Partners LP, High River Limited Partnership,
F-51

LIONS GATE ENTERTAINMENT CORP.
NOTES TO AUDITED CONSOLIDATED FINANCIAL STATEMENTS— (Continued)
Hopper Investments LLC, Barberry Corp., Icahn Onshore LP, Icahn Offshore LP, Icahn Capital LP, IPH GPLLC, Icahn Enterprises Holdings L.P., Icahn Enterprises G.P. Inc., and Beckton Corp., No. 10-CV-8169. Thecomplaint, filed as Exhibit (a)(8) to our Amendment No. 7 to the Schedule 14D-9, filed with the SEC onOctober 29, 2010, alleges violations of Sections 13(d), 14(a), 14(d), and 14(e) of the Exchange Act, and certainrules promulgated thereunder, and tortious interference with prospective business relations under state law. Thecomplaint seeks damages and injunctive relief, including an order requiring the defendants to make correctivedisclosures before our 2010 annual general meeting of shareholders. On November 22, 2010, Icahn Partnersmoved to dismiss the complaint. We amended our complaint on December 3, 2010. Icahn Partners moved todismiss the amended complaint on December 17, 2010. Following oral argument on March 18, 2011, the Courtgranted in part and denied in part Icahn Partners’ motion to dismiss. The Court granted Icahn Partners’ motion todismiss with respect to our claims alleging that Icahn Partners violated Sections 13(d), 14(a), 14(d) (except forSection 14(d)(7) as discussed below) and 14(e) of the Exchange Act, and certain rules promulgated thereunder,and tortuous interference with prospective business relations under state law. The Court denied Icahn Partners’motion to dismiss with respect to our claim alleging that Icahn Partners violated Section 14(d)(7) of theExchange Act, and Rule 14d-10(a)(2) promulgated thereunder, by offering special consideration to a particularshareholder in the course of its tender offer when it was required to offer all shareholders the highestconsideration paid to any single shareholder, and the suit is ongoing with respect to that remaining claim. IcahnPartners has since moved for reconsideration of the Court’s ruling on the motion to dismiss.
From time to time, the Company is involved in certain claims and legal proceedings arising in the normal courseof business. While the resolution of these matters cannot be predicted with certainty, the Company does notbelieve, based on current knowledge, that the outcome of any currently pending claims or legal proceedings inwhich the Company is currently involved will have a material adverse effect on the Company’s consolidatedfinancial position, results of operations or cash flow.
23. Financial Instruments
(a) Credit Risk
Concentration of credit risk with the Company’s customers is limited due to the Company’s customer baseand the diversity of its sales throughout the world. The Company performs ongoing credit evaluations andmaintains a provision for potential credit losses. The Company generally does not require collateral for its tradeaccounts receivable. Accounts receivable include amounts receivable from Canadian governmental agencies inconnection with government assistance for productions as well as amounts due from customers. Amountsreceivable from governmental agencies amounted to 22.0% of accounts receivable, net at March 31, 2011(2010 — 15.6%).
(b) Forward Contracts
The Company enters into forward foreign exchange contracts to hedge its foreign currency exposures onfuture production expenses denominated in various foreign currencies. As of March 31, 2011, we hadoutstanding forward foreign exchange contracts to sell Canadian $1.1 million in exchange for US$1.1 millionover a period of three months at a weighted average exchange rate of one Canadian dollar equals US$1.00. Wealso had outstanding forward foreign exchange contracts to sell British Pound Sterling £9.4 million in exchangefor US$15.0 million over a period of twelve months at a weighted average exchange rate of one BritishPound Sterling equals US$1.59. Changes in the fair value representing a net unrealized fair value loss on foreignexchange contracts that qualified as effective hedge contracts outstanding during the year ended March 31, 2011amounted to $0.6 million and are included in accumulated other comprehensive loss, a separate component ofshareholders’ equity. These contracts are entered into with a major financial institution as counterparty. We areexposed to credit loss in the event of nonperformance by the counterparty, which is limited to the cost ofreplacing the contracts, at current market rates. We do not require collateral or other security to support thesecontracts.
F-52
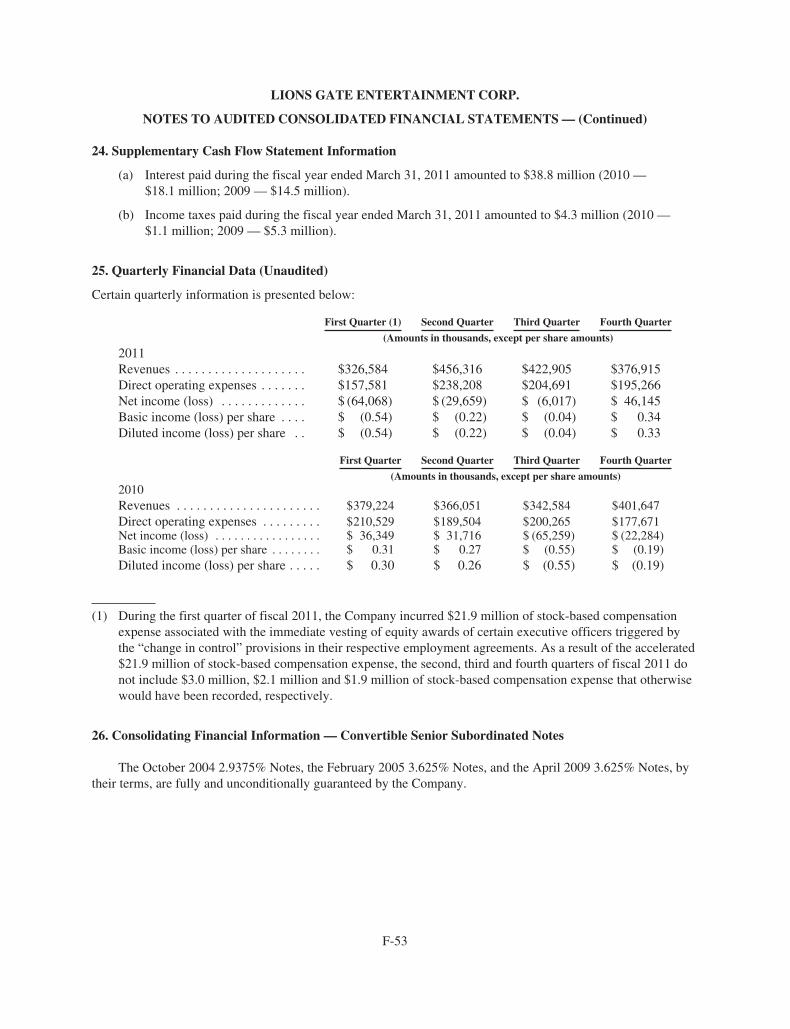
LIONS GATE ENTERTAINMENT CORP.
NOTES TO AUDITED CONSOLIDATED FINANCIAL STATEMENTS— (Continued)
24. Supplementary Cash Flow Statement Information
(a) Interest paid during the fiscal year ended March 31, 2011 amounted to $38.8 million (2010 —$18.1 million; 2009 — $14.5 million).
(b) Income taxes paid during the fiscal year ended March 31, 2011 amounted to $4.3 million (2010 —$1.1 million; 2009 — $5.3 million).
25. Quarterly Financial Data (Unaudited)
Certain quarterly information is presented below:
First Quarter (1) Second Quarter Third Quarter Fourth Quarter
(Amounts in thousands, except per share amounts)
2011Revenues . . . . . . . . . . . . . . . . . . . . $326,584 $456,316 $422,905 $376,915Direct operating expenses . . . . . . . $157,581 $238,208 $204,691 $195,266Net income (loss) . . . . . . . . . . . . . $ (64,068) $ (29,659) $ (6,017) $ 46,145Basic income (loss) per share . . . . $ (0.54) $ (0.22) $ (0.04) $ 0.34Diluted income (loss) per share . . $ (0.54) $ (0.22) $ (0.04) $ 0.33
First Quarter Second Quarter Third Quarter Fourth Quarter
(Amounts in thousands, except per share amounts)2010Revenues . . . . . . . . . . . . . . . . . . . . . . $379,224 $366,051 $342,584 $401,647Direct operating expenses . . . . . . . . . $210,529 $189,504 $200,265 $177,671Net income (loss) . . . . . . . . . . . . . . . . . $ 36,349 $ 31,716 $ (65,259) $ (22,284)Basic income (loss) per share . . . . . . . . $ 0.31 $ 0.27 $ (0.55) $ (0.19)Diluted income (loss) per share . . . . . $ 0.30 $ 0.26 $ (0.55) $ (0.19)
(1) During the first quarter of fiscal 2011, the Company incurred $21.9 million of stock-based compensationexpense associated with the immediate vesting of equity awards of certain executive officers triggered bythe “change in control” provisions in their respective employment agreements. As a result of the accelerated$21.9 million of stock-based compensation expense, the second, third and fourth quarters of fiscal 2011 donot include $3.0 million, $2.1 million and $1.9 million of stock-based compensation expense that otherwisewould have been recorded, respectively.
26. Consolidating Financial Information — Convertible Senior Subordinated Notes
The October 2004 2.9375% Notes, the February 2005 3.625% Notes, and the April 2009 3.625% Notes, bytheir terms, are fully and unconditionally guaranteed by the Company.
F-53

LIONS GATE ENTERTAINMENT CORP.
NOTES TO AUDITED CONSOLIDATED FINANCIAL STATEMENTS— (Continued)
The following tables present condensed consolidating financial information as of March 31, 2011, and 2010and for the years ended March 31, 2011, 2010, and 2009 for (1) the Company, on a stand-alone basis, (2) LGEI,on a stand-alone basis, (3) the non-guarantor subsidiaries of the Company (including the subsidiaries of LGEI),on a combined basis (collectively, the “Non-guarantor Subsidiaries”) and (4) the Company, on a consolidatedbasis.
As of March 31, 2011
Lions GateEntertainment
Corp.
Lions GateEntertainment
Inc.Non-guarantorSubsidiaries
ConsolidatingAdjustments
Lions GateConsolidated
(Amounts in thousands)
BALANCE SHEETAssetsCash and cash equivalents . . . . . . . . . . . $ 795 $ 6,451 $ 79,173 $ — $ 86,419Restricted cash . . . . . . . . . . . . . . . . . . . . 13,992 29,466 — — 43,458Restricted investments . . . . . . . . . . . . . . — — — — —Accounts receivable, net . . . . . . . . . . . . 494 4,237 355,090 — 359,821Investment in films and televisionprograms, net . . . . . . . . . . . . . . . . . . . 12 6,391 616,795 (1,910) 621,288
Property and equipment, net . . . . . . . . . — 8,292 2,126 — 10,418Equity method investments . . . . . . . . . . 1,123 17,052 132,410 — 150,585Goodwill . . . . . . . . . . . . . . . . . . . . . . . . 10,173 — 229,081 — 239,254Other assets . . . . . . . . . . . . . . . . . . . . . . 458 34,214 11,929 — 46,601Subsidiary investments andadvances . . . . . . . . . . . . . . . . . . . . . . 102,680 (171,895) (229,913) 299,128 —
$129,727 $ (65,792) $1,196,691 $297,218 $1,557,844
Liabilities and Shareholders’ Equity(Deficiency)
Senior revolving credit facility . . . . . . . $ — $ 69,750 $ — $ — $ 69,750Senior secured second-priority notes . . . — 226,331 — — 226,331Accounts payable and accruedliabilities . . . . . . . . . . . . . . . . . . . . . . 1,910 52,035 189,482 13 243,440
Participations and residuals . . . . . . . . . . 195 11,093 290,194 (96) 301,386Film obligations and productionloans . . . . . . . . . . . . . . . . . . . . . . . . . . 76 — 327,344 — 327,420
Convertible senior subordinated notesand other financing obligations . . . . . — 107,255 3,718 — 110,973
Deferred revenue . . . . . . . . . . . . . . . . . . — 134 150,864 — 150,998Shareholders’ equity (deficiency) . . . . . 127,546 (532,390) 235,089 297,301 127,546
$129,727 $ (65,792) $1,196,691 $297,218 $1,557,844
F-54

LIONS GATE ENTERTAINMENT CORP.
NOTES TO AUDITED CONSOLIDATED FINANCIAL STATEMENTS— (Continued)
Year Ended March 31, 2011
Lions GateEntertainment
Corp.
Lions GateEntertainment
Inc.Non-guarantorSubsidiaries
ConsolidatingAdjustments
Lions GateConsolidated
(Amounts in thousands)STATEMENT OF OPERATIONSRevenues . . . . . . . . . . . . . . . . . . . . . . . . . . $ — $ 25,399 $1,595,659 $(38,338) $1,582,720EXPENSES:
Direct operating . . . . . . . . . . . . . . . . . — 1,534 830,743 (36,531) 795,746Distribution and marketing . . . . . . . . — 522 546,747 (43) 547,226General and administration . . . . . . . . 3,098 108,160 60,498 (349) 171,407Depreciation and amortization . . . . . — 3,694 2,117 — 5,811
Total expenses . . . . . . . . . . . . . . 3,098 113,910 1,440,105 (36,923) 1,520,190
OPERATING INCOME (LOSS) . . . . . . . (3,098) (88,511) 155,554 (1,415) 62,530
Other expenses (income):Interest expense . . . . . . . . . . . . . . . . . — 51,132 4,819 (771) 55,180Interest and other income . . . . . . . . . (172) (1,731) (610) 771 (1,742)Loss (gain) on extinguishment ofdebt . . . . . . . . . . . . . . . . . . . . . . . . — 14,505 — — 14,505
Total other expenses(income) . . . . . . . . . . . . . . . . (172) 63,906 4,209 — 67,943
INCOME (LOSS) BEFORE EQUITYINTERESTS AND INCOMETAXES . . . . . . . . . . . . . . . . . . . . . (2,926) (152,417) 151,345 (1,415) (5,413)
Equity interests income (loss) . . . . . . . . . . (50,673) 70,576 (40,521) (23,312) (43,930)
INCOME (LOSS) BEFORE INCOMETAXES . . . . . . . . . . . . . . . . . . . . . . . . . (53,599) (81,841) 110,824 (24,727) (49,343)
Income tax provision (benefit) . . . . . . . . . — 3,032 1,224 — 4,256
NET INCOME (LOSS) . . . . . . . . . . . . . . . $(53,599) $ (84,873) $ 109,600 $(24,727) $ (53,599)
F-55

LIONS GATE ENTERTAINMENT CORP.
NOTES TO AUDITED CONSOLIDATED FINANCIAL STATEMENTS— (Continued)
Year Ended March 31, 2011
Lions GateEntertainment
Corp.
Lions GateEntertainment
Inc.Non-guarantorSubsidiaries
ConsolidatingAdjustments
Lions GateConsolidated
(Amounts in thousands)STATEMENT OF CASH FLOWSNET CASH FLOWS PROVIDED BY(USED IN) OPERATING ACTIVITIES $ 15,420 $ (54,654) $ 81,561 $— $ 42,327
INVESTING ACTIVITIES:Purchases of restricted investments . . . . . — (13,993) — — (13,993)Proceeds from the sale of restrictedinvestments . . . . . . . . . . . . . . . . . . . . . . — 20,989 — — 20,989
Buy-out of the earn-out associated withthe acquisition of Debmar-Mercury,LLC . . . . . . . . . . . . . . . . . . . . . . . . . . . — — (15,000) — (15,000)
Investment in equity method investees . . (2,000) — (22,677) — (24,677)Increase in loan receivables . . . . . . . . . . . — (1,042) — — (1,042)Repayment of loans receivable . . . . . . . . — — 8,113 — 8,113Purchases of property and equipment . . . — (658) (2,098) — (2,756)
NET CASH FLOWS PROVIDED BY(USED IN) INVESTINGACTIVITIES . . . . . . . . . . . . . . . . . . . . . . . (2,000) 5,296 (31,662) — (28,366)
FINANCING ACTIVITIES:Tax withholding requirements on equityawards . . . . . . . . . . . . . . . . . . . . . . . . . (13,476) — — — (13,476)
Borrowings under senior revolving creditfacility . . . . . . . . . . . . . . . . . . . . . . . . . — 525,250 — — 525,250
Repayments of borrowings under seniorrevolving credit facility . . . . . . . . . . . . — (472,500) — — (472,500)
Borrowings under individual productionloans . . . . . . . . . . . . . . . . . . . . . . . . . . . — — 118,589 — 118,589
Repayment of individual productionloans . . . . . . . . . . . . . . . . . . . . . . . . . . . — — (147,102) — (147,102)
Production loan borrowings under filmcredit facility . . . . . . . . . . . . . . . . . . . . — — 19,456 — 19,456
Production loan repayments under filmcredit facility . . . . . . . . . . . . . . . . . . . . — — (34,762) — (34,762)
Change in restricted cash collateralassociated with financing activities . . . — — 3,087 — 3,087
NET CASH FLOWS PROVIDED BY(USED IN) FINANCINGACTIVITIES . . . . . . . . . . . . . . . . . . . . . . . (13,476) 52,750 (40,732) — (1,458)
NET CHANGE IN CASH AND CASHEQUIVALENTS . . . . . . . . . . . . . . . . . . . . . (56) 3,392 9,167 — 12,503
FOREIGN EXCHANGE EFFECTS ONCASH . . . . . . . . . . . . . . . . . . . . . . . . . . . . . . 37 — 4,637 — 4,674
CASH AND CASH EQUIVALENTS —BEGINNING OF PERIOD . . . . . . . . . . . . 814 3,059 65,369 — 69,242
CASH AND CASH EQUIVALENTS —END OF PERIOD . . . . . . . . . . . . . . . . . . . $ 795 $ 6,451 $ 79,173 $— $ 86,419
F-56

LIONS GATE ENTERTAINMENT CORP.
NOTES TO AUDITED CONSOLIDATED FINANCIAL STATEMENTS— (Continued)
As of March 31, 2010
Lions GateEntertainment
Corp.
Lions GateEntertainment
Inc.Non-guarantorSubsidiaries
ConsolidatingAdjustments
Lions GateConsolidated
(Amounts in thousands)
BALANCE SHEETAssetsCash and cash equivalents . . . . . . . . . . . $ 814 $ 3,059 $ 65,369 $ — $ 69,242Restricted cash . . . . . . . . . . . . . . . . . . . . — 4,123 — — 4,123Restricted investments . . . . . . . . . . . . . . — 6,995 — — 6,995Accounts receivable, net . . . . . . . . . . . . 99 1,116 291,209 500 292,924Investment in films and televisionprograms, net . . . . . . . . . . . . . . . . . . . 2 6,391 655,994 (1,282) 661,105
Property and equipment, net . . . . . . . . . — 11,328 1,086 — 12,414Equity method investments . . . . . . . . . . — 18,611 160,460 — 179,071Goodwill . . . . . . . . . . . . . . . . . . . . . . . . 10,173 — 229,081 — 239,254Other assets . . . . . . . . . . . . . . . . . . . . . . 431 25,446 36,150 — 62,027Subsidiary investments andadvances . . . . . . . . . . . . . . . . . . . . . . 43,686 (5,885) (249,526) 211,725 —
$55,205 $ 71,184 $1,189,823 $210,943 $1,527,155
Liabilities and Shareholders’ Equity(Deficiency)
Senior revolving credit facility . . . . . . . $ — $ 17,000 $ — $ — $ 17,000Senior secured second-priority notes . . . — 225,155 — — 225,155Accounts payable and accruedliabilities . . . . . . . . . . . . . . . . . . . . . . 1,018 53,706 198,915 106 253,745
Participations and residuals . . . . . . . . . . 186 3,760 298,741 (10) 302,677Film obligations and productionloans . . . . . . . . . . . . . . . . . . . . . . . . . . 79 — 351,690 — 351,769
Convertible senior subordinated notesand other financing obligations . . . . . — 188,318 3,718 — 192,036
Deferred revenue . . . . . . . . . . . . . . . . . . — 247 130,725 (121) 130,851Shareholders’ equity (deficiency) . . . . . 53,922 (417,002) 206,034 210,968 53,922
$55,205 $ 71,184 $1,189,823 $210,943 $1,527,155
F-57

LIONS GATE ENTERTAINMENT CORP.
NOTES TO AUDITED CONSOLIDATED FINANCIAL STATEMENTS— (Continued)
Year Ended March 31, 2010
Lions GateEntertainment
Corp.
Lions GateEntertainment
Inc.Non-guarantorSubsidiaries
ConsolidatingAdjustments
Lions GateConsolidated
(Amounts in thousands)
STATEMENT OF OPERATIONSRevenues . . . . . . . . . . . . . . . . . . . . . . . . $ — $ 32,219 $1,490,667 $(33,380) $1,489,506EXPENSES:
Direct operating . . . . . . . . . . . . . . . — 458 806,301 (28,790) 777,969Distribution and marketing . . . . . . — 7,475 498,708 (42) 506,141General and administration . . . . . . 7,070 72,705 63,543 (258) 143,060Depreciation and amortization . . . — 4,832 7,623 — 12,455
Total expenses . . . . . . . . . . . . 7,070 85,470 1,376,175 (29,090) 1,439,625
OPERATING INCOME (LOSS) . . . . . (7,070) (53,251) 114,492 (4,290) 49,881
Other expenses (income):Interest expense . . . . . . . . . . . . . . . — 45,165 2,808 (811) 47,162Interest and other income . . . . . . . (130) (12,050) (677) 11,310 (1,547)Gain on extinguishment of debt . . — (5,675) — — (5,675)
Total other expenses(income) . . . . . . . . . . . . . . . (130) 27,440 2,131 10,499 39,940
INCOME (LOSS) BEFORE EQUITYINTERESTS AND INCOMETAXES . . . . . . . . . . . . . . . . . . . . . (6,940) (80,691) 112,361 (14,789) 9,941
Equity interests income (loss) . . . . . . . . (12,513) 49,090 (37,749) (27,029) (28,201)
INCOME (LOSS) BEFORE INCOMETAXES . . . . . . . . . . . . . . . . . . . . . . . (19,453) (31,601) 65,944 (33,150) (18,260)
Income tax provision . . . . . . . . . . . . . . . 25 225 968 — 1,218
NET INCOME (LOSS) . . . . . . . . . . . . . $(19,478) $(31,826) $ 73,644 $(41,818) $ (19,478)
F-58

LIONS GATE ENTERTAINMENT CORP.
NOTES TO AUDITED CONSOLIDATED FINANCIAL STATEMENTS— (Continued)
Year Ended March 31, 2010
Lions GateEntertainment
Corp.
Lions GateEntertainment
Inc.Non-guarantorSubsidiaries
ConsolidatingAdjustments
Lions GateConsolidated
(Amounts in thousands)STATEMENT OF CASH FLOWSNET CASH FLOWS PROVIDED BY (USED IN)OPERATING ACTIVITIES . . . . . . . . . . . . . . . . . $(12,543) $ 14,072 $(136,489) $— $(134,960)
INVESTING ACTIVITIES:Purchases of restricted investments . . . . . . . . . . . — (13,994) — — (13,994)Proceeds from the sale of restrictedinvestments . . . . . . . . . . . . . . . . . . . . . . . . . . . . — 13,985 — — 13,985
Investment in equity method investees . . . . . . . . . — — (47,129) — (47,129)Increase in loan receivables . . . . . . . . . . . . . . . . . — (362) (1,056) — (1,418)Repayment of loans receivable . . . . . . . . . . . . . . . — — 8,333 — 8,333Purchases of property and equipment . . . . . . . . . . — (1,146) (2,538) — (3,684)
NET CASH FLOWS PROVIDED BY (USED IN)INVESTING ACTIVITIES . . . . . . . . . . . . . . . . . . — (1,517) (42,390) — (43,907)
FINANCING ACTIVITIES:Tax withholding requirements on equityawards . . . . . . . . . . . . . . . . . . . . . . . . . . . . . . . . (2,030) — — — (2,030)
Proceeds from the issuance of mandatorilyredeemable preferred stock units and commonstock units related to the sale of 49% interest inTV Guide Network . . . . . . . . . . . . . . . . . . . . . . — — 109,776 — 109,776
Borrowings under senior revolving creditfacility . . . . . . . . . . . . . . . . . . . . . . . . . . . . . . . . — 302,000 — — 302,000
Repayments of borrowings under seniorrevolving credit facility . . . . . . . . . . . . . . . . . . . — (540,000) — — (540,000)
Borrowings under individual production loans . . — — 144,741 — 144,741Repayment of individual production loans . . . . . . — — (136,261) — (136,261)Production loan borrowings under PennsylvaniaRegional Center credit facility . . . . . . . . . . . . . — — 63,133 — 63,133
Production loan borrowings under film creditfacility, net of deferred financing costs . . . . . . — — 30,469 — 30,469
Production loan repayments under film creditfacility . . . . . . . . . . . . . . . . . . . . . . . . . . . . . . . . — — (2,718) — (2,718)
Proceeds from sale of senior secured second-priority notes, net of deferred financingcosts . . . . . . . . . . . . . . . . . . . . . . . . . . . . . . . . . — 214,727 — — 214,727
Repurchase of convertible senior subordinatednotes . . . . . . . . . . . . . . . . . . . . . . . . . . . . . . . . . — (75,185) — — (75,185)
Repayment of other financing obligations . . . . . . — — (134) — (134)
NET CASH FLOWS PROVIDED BY (USED IN)FINANCING ACTIVITIES . . . . . . . . . . . . . . . . . . (2,030) (98,458) 209,006 — 108,518
NET CHANGE IN CASH AND CASHEQUIVALENTS . . . . . . . . . . . . . . . . . . . . . . . . . . . (14,573) (85,903) 30,127 — (70,349)
FOREIGN EXCHANGE EFFECTS ON CASH . . . 2,134 — (1,018) — 1,116CASH AND CASH EQUIVALENTS —BEGINNING OF PERIOD . . . . . . . . . . . . . . . . . . 13,253 88,962 36,260 — 138,475
CASH AND CASH EQUIVALENTS — END OFPERIOD . . . . . . . . . . . . . . . . . . . . . . . . . . . . . . . . . . $ 814 $ 3,059 $ 65,369 $— $ 69,242
F-59

LIONS GATE ENTERTAINMENT CORP.
NOTES TO AUDITED CONSOLIDATED FINANCIAL STATEMENTS— (Continued)
Year Ended March 31, 2009
Lions GateEntertainment
Corp.
Lions GateEntertainment
Inc.Non-guarantorSubsidiaries
ConsolidatingAdjustments
Lions GateConsolidated
(Amounts in thousands)
STATEMENT OF OPERATIONSRevenues . . . . . . . . . . . . . . . . . . . . . . . . $ 560 $ 24,810 $1,475,631 $ (34,627) $1,466,374EXPENSES:
Direct operating . . . . . . . . . . . . . . . 712 — 796,770 (3,666) 793,816Distribution and marketing . . . . . . 8 2,374 667,229 (54) 669,557General and administration . . . . . . 1,584 67,734 67,243 2 136,563Depreciation and amortization . . . — 3,889 3,768 — 7,657
Total expenses . . . . . . . . . . . . 2,304 73,997 1,535,010 (3,718) 1,607,593
OPERATING INCOME (LOSS) . . . . . (1,744) (49,187) (59,379) (30,909) (141,219)
Other expenses (income):Interest expense . . . . . . . . . . . . . . . 14 32,707 1,554 — 34,275Interest and other income . . . . . . . (229) (4,022) (1,534) — (5,785)Gain on extinguishment of debt . . — (3,023) — — (3,023)
Total other expenses(income) . . . . . . . . . . . . . . . (215) 25,662 20 — 25,467
INCOME (LOSS) BEFORE EQUITYINTERESTS AND INCOMETAXES . . . . . . . . . . . . . . . . . . . . . . . (1,529) (74,849) (59,399) (30,909) (166,686)
Equity interests income (loss) . . . . . . . . (176,919) (87,022) (6,150) 261,047 (9,044)
INCOME (LOSS) BEFORE INCOMETAXES . . . . . . . . . . . . . . . . . . . . . . . (178,448) (161,871) (65,549) 230,138 (175,730)
Income tax provision (benefit) . . . . . . . 6 1,374 1,344 — 2,724
NET INCOME (LOSS) . . . . . . . . . . . . . $(178,454) $(163,245) $ (66,893) $230,138 $ (178,454)
F-60

LIONS GATE ENTERTAINMENT CORP.
NOTES TO AUDITED CONSOLIDATED FINANCIAL STATEMENTS— (Continued)
Year Ended March 31, 2009
Lions GateEntertainment
Corp.
Lions GateEntertainment
Inc.Non-guarantorSubsidiaries
ConsolidatingAdjustments
Lions GateConsolidated
(Amounts in thousands)STATEMENT OF CASH FLOWSNET CASH FLOWS PROVIDED BY (USEDIN) OPERATING ACTIVITIES . . . . . . . . . $ 56,435 $ (256,846) $ 98,505 $— $ (101,906)
INVESTING ACTIVITIES:Purchases of investments — auction ratesecurities . . . . . . . . . . . . . . . . . . . . . . . — (13,989) — — (13,989)
Proceeds from the sale of investments —auction rate securities . . . . . . . . . . . . . — 14,000 — — 14,000
Acquisition of TV Guide, net ofunrestricted cash acquired . . . . . . . . . . — (243,158) — — (243,158)
Investment in equity method investees . . — — (18,031) — (18,031)Increase in loan receivables . . . . . . . . . . . — (3,767) (25,000) — (28,767)Purchases of property and equipment . . . — (7,549) (1,125) — (8,674)
NET CASH FLOWS PROVIDED BY (USEDIN) INVESTING ACTIVITIES . . . . . . . . . . — (254,463) (44,156) — (298,619)
FINANCING ACTIVITIES:Exercise of stock options . . . . . . . . . . . . . 2,894 — — — 2,894Tax withholding requirements on equityawards . . . . . . . . . . . . . . . . . . . . . . . . . (3,734) — — — (3,734)
Repurchases of common shares . . . . . . . . (44,968) — — — (44,968)Production loan borrowings underPennsylvania Regional Center creditfacility . . . . . . . . . . . . . . . . . . . . . . . . . — 255,000 — — 255,000
Production loan borrowings under filmcredit facility, net of deferredfinancing costs . . . . . . . . . . . . . . . . . . . — — 189,858 — 189,858
Proceeds from sale of senior securedsecond-priority notes, net of deferredfinancing costs . . . . . . . . . . . . . . . . . . . — — (222,034) — (222,034)
Repurchase of convertible seniorsubordinated notes . . . . . . . . . . . . . . . . — (5,310) (67) — (5,377)
NET CASH FLOWS PROVIDED BY (USEDIN) FINANCING ACTIVITIES . . . . . . . . . . (45,808) 249,690 (32,243) — 171,639
NET CHANGE IN CASH AND CASHEQUIVALENTS . . . . . . . . . . . . . . . . . . . . . . 10,627 (261,619) 22,106 — (228,886)
FOREIGN EXCHANGE EFFECTS ONCASH . . . . . . . . . . . . . . . . . . . . . . . . . . . . . . . (1,848) — (2,380) — (4,228)
CASH AND CASH EQUIVALENTS —BEGINNING OF PERIOD . . . . . . . . . . . . . . 4,474 350,581 16,534 — 371,589
CASH AND CASH EQUIVALENTS — ENDOF PERIOD . . . . . . . . . . . . . . . . . . . . . . . . . . $ 13,253 $ 88,962 $ 36,260 $— $ 138,475
F-61

LIONS GATE ENTERTAINMENT CORP.
NOTES TO AUDITED CONSOLIDATED FINANCIAL STATEMENTS— (Continued)
27. Consolidating Financial Information — Senior Secured Second-Priority Notes
In October 2009, the Company issued $236.0 million aggregate principal amount of the Senior Notes due2016 in a private offering conducted pursuant to Rule 144A and Regulation S under the Securities Act of 1933,as amended, through LGEI.
The Company has agreed to make available to the trustee and the holders of the Senior Notes the followingtables which present condensed consolidating financial information as of March 31, 2011 and March 31, 2010,and for years ended March 31, 2011, 2010 and 2009 for (1) the Company, on a stand-alone basis, (2) LGEI, on astand-alone basis, (3) the guarantor subsidiaries of the Company (including the subsidiaries of LGEI), on acombined basis (4) the non-guarantor subsidiaries of the Company (including the subsidiaries of LGEI), on acombined basis and (5) the Company, on a consolidated basis.
As of March 31, 2011
Lions GateEntertainment
Lions GateEntertainment Other Subsidiaries Consolidating Lions Gate
Corp. Inc. Guarantors Non-guarantors Adjustments Consolidated
(Amounts in thousands)BALANCE SHEETAssetsCash and cash equivalents . . . . . . . $ 795 $ 6,451 $ 696 $ 78,477 $ — $ 86,419Restricted cash . . . . . . . . . . . . . . . . 13,992 29,466 — — — 43,458Restricted investments . . . . . . . . . . — — — — — —Accounts receivable, net . . . . . . . . 494 4,237 292,860 62,230 — 359,821Investment in films and televisionprograms, net . . . . . . . . . . . . . . . 12 6,391 513,505 102,668 (1,288) 621,288
Property and equipment, net . . . . . — 8,292 189 1,937 — 10,418Equity method investments . . . . . . 1,123 17,052 17,405 117,514 (2,509) 150,585Goodwill . . . . . . . . . . . . . . . . . . . . . 10,173 — 198,883 30,198 — 239,254Other assets . . . . . . . . . . . . . . . . . . 458 34,214 10,658 1,271 — 46,601Subsidiary investments andadvances . . . . . . . . . . . . . . . . . . . 102,680 (171,895) (28,053) (199,205) 296,473 —
$129,727 $ (65,792) $1,006,143 $ 195,090 $292,676 $1,557,844
Liabilities and Shareholders’Equity (Deficiency)
Senior revolving credit facility . . . . $ — $ 69,750 $ — $ — $ — $ 69,750Senior secured second-prioritynotes . . . . . . . . . . . . . . . . . . . . . . — 226,331 — — — 226,331
Accounts payable and accruedliabilities . . . . . . . . . . . . . . . . . . . 1,910 52,035 141,715 47,739 41 243,440
Participations and residuals . . . . . . 195 11,093 264,320 25,877 (99) 301,386Film obligations and productionloans . . . . . . . . . . . . . . . . . . . . . . 76 — 308,744 18,600 — 327,420
Convertible senior subordinatednotes and other financingobligations . . . . . . . . . . . . . . . . . — 107,255 3,718 — — 110,973
Deferred revenue . . . . . . . . . . . . . . — 134 123,696 27,168 — 150,998Shareholders’ equity(deficiency) . . . . . . . . . . . . . . . . 127,546 (532,390) 163,950 75,706 292,734 127,546
$129,727 $ (65,792) $1,006,143 $ 195,090 $292,676 $1,557,844
F-62

LIONS GATE ENTERTAINMENT CORP.
NOTES TO AUDITED CONSOLIDATED FINANCIAL STATEMENTS— (Continued)
Year Ended March 31, 2011
Lions GateEntertainment
Lions GateEntertainment Other Subsidiaries Consolidating Lions Gate
Corp. Inc. Guarantors Non-guarantors Adjustments Consolidated
(Amounts in thousands)
STATEMENT OFOPERATIONS
Revenues . . . . . . . . . . . . $ — $ 25,399 $1,427,122 $190,214 $(60,015) $1,582,720EXPENSES:
Direct operating . . . — 1,534 769,468 84,020 (59,276) 795,746Distribution andmarketing . . . . . . — 522 462,254 84,493 (43) 547,226
General andadministration . . . 3,098 108,160 45,532 14,963 (346) 171,407
Depreciation andamortization . . . . — 3,694 1,373 744 — 5,811
Totalexpenses . . . 3,098 113,910 1,278,627 184,220 (59,665) 1,520,190
OPERATING INCOME(LOSS) . . . . . . . . . . . . (3,098) (88,511) 148,495 5,994 (350) 62,530
Other expenses (income):Interest expense . . . — 51,132 3,968 851 (771) 55,180Interest and otherincome . . . . . . . . (172) (1,731) (444) (166) 771 (1,742)
Loss onextinguishment ofdebt . . . . . . . . . . . — 14,505 — — — 14,505
Total otherexpenses(income) . . . (172) 63,906 3,524 685 — 67,943
INCOME(LOSS) BEFOREEQUITY INTERESTSAND INCOMETAXES . . . . . . . . . . . . (2,926) (152,417) 144,971 5,309 (350) (5,413)
Equity interests income(loss) . . . . . . . . . . . . . . (50,673) 70,576 (37,585) (427) (25,821) (43,930)
INCOME(LOSS) BEFOREINCOME TAXES . . . (53,599) (81,841) 107,386 4,882 (26,171) (49,343)
Income tax provision(benefit) . . . . . . . . . . . — 3,032 1,530 (306) — 4,256
NET INCOME(LOSS) . . . . . . . . . . . . $(53,599) $ (84,873) $ 105,856 $ 5,188 $(26,171) $ (53,599)
F-63

LIONS GATE ENTERTAINMENT CORP.
NOTES TO AUDITED CONSOLIDATED FINANCIAL STATEMENTS— (Continued)
Year Ended March 31, 2011
Lions GateEntertainment
Corp.
Lions GateEntertainment
Inc.Other Subsidiaries Consolidating
AdjustmentsLions GateConsolidatedGuarantors Non-guarantors
(Amounts in thousands)STATEMENT OF CASH FLOWSNET CASH FLOWS PROVIDED BY(USED IN) OPERATINGACTIVITIES . . . . . . . . . . . . . . . . . . . . $ 15,420 $ (54,654) $ 69,717 $11,844 $— $ 42,327
INVESTING ACTIVITIES:Purchases of restricted investments . . — (13,993) — — — (13,993)Proceeds from the sale of restrictedinvestments . . . . . . . . . . . . . . . . . . . — 20,989 — — — 20,989
Buy-out of the earn-out associatedwith the acquisition of Debmar-Mercury, LLC . . . . . . . . . . . . . . . . . — — (15,000) — — (15,000)
Investment in equity methodinvestees . . . . . . . . . . . . . . . . . . . . . (2,000) — (22,677) — — (24,677)
Increase in loan receivables . . . . . . . . — (1,042) — — — (1,042)Repayment of loans receivable . . . . . . — — 8,113 — — 8,113Purchases of property andequipment . . . . . . . . . . . . . . . . . . . . — (658) (504) (1,594) — (2,756)
NET CASH FLOWS PROVIDED BY(USED IN) INVESTINGACTIVITIES . . . . . . . . . . . . . . . . . . . . (2,000) 5,296 (30,068) (1,594) — (28,366)
FINANCING ACTIVITIES:Tax withholding requirements onequity awards . . . . . . . . . . . . . . . . . (13,476) — — — — (13,476)
Borrowings under senior revolvingcredit facility . . . . . . . . . . . . . . . . . . — 525,250 — — — 525,250
Repayments of borrowings undersenior revolving credit facility . . . . — (472,500) — — — (472,500)
Borrowings under individualproduction loans . . . . . . . . . . . . . . . — — 105,194 13,395 — 118,589
Repayment of individual productionloans . . . . . . . . . . . . . . . . . . . . . . . . — — (140,080) (7,022) — (147,102)
Production loan borrowings underfilm credit facility . . . . . . . . . . . . . . — — 19,456 — — 19,456
Production loan repayments underfilm credit facility . . . . . . . . . . . . . . — — (34,762) — — (34,762)
Decrease in restricted cash collateralrequirement under the film creditfacility . . . . . . . . . . . . . . . . . . . . . . . — — 3,087 — — 3,087
NET CASH FLOWS PROVIDED BY(USED IN) FINANCINGACTIVITIES . . . . . . . . . . . . . . . . . . . . (13,476) 52,750 (47,105) 6,373 — (1,458)
NET CHANGE IN CASH AND CASHEQUIVALENTS . . . . . . . . . . . . . . . . . . (56) 3,392 (7,456) 16,623 — 12,503
FOREIGN EXCHANGE EFFECTS ONCASH . . . . . . . . . . . . . . . . . . . . . . . . . . . 37 — — 4,637 — 4,674
CASH AND CASH EQUIVALENTS —BEGINNING OF PERIOD . . . . . . . . . 814 3,059 8,152 57,217 — 69,242
CASH AND CASH EQUIVALENTS —END OF PERIOD . . . . . . . . . . . . . . . . $ 795 $ 6,451 $ 696 $78,477 $— $ 86,419
F-64

LIONS GATE ENTERTAINMENT CORP.
NOTES TO AUDITED CONSOLIDATED FINANCIAL STATEMENTS— (Continued)
As of March 31, 2010
Lions GateEntertainment
Corp.
Lions GateEntertainment
Inc.Other Subsidiaries Consolidating
AdjustmentsLions GateConsolidatedGuarantors Non-guarantors
(Amounts in thousands)BALANCE SHEETAssetsCash and cash equivalents . . . . . . . . . . . . . $ 814 $ 3,059 $ 8,152 $ 57,217 $ — $ 69,242Restricted cash . . . . . . . . . . . . . . . . . . . . . . — 4,123 — — — 4,123Restricted investments . . . . . . . . . . . . . . . . — 6,995 — — — 6,995Accounts receivable, net . . . . . . . . . . . . . . . 99 1,116 238,138 53,071 500 292,924Investment in films and televisionprograms, net . . . . . . . . . . . . . . . . . . . . . 2 6,391 567,718 88,276 (1,282) 661,105
Property and equipment, net . . . . . . . . . . . . — 11,328 382 704 — 12,414Equity method investments . . . . . . . . . . . . — 18,611 32,330 128,130 — 179,071Goodwill . . . . . . . . . . . . . . . . . . . . . . . . . . . 10,173 — 198,883 30,198 — 239,254Other assets . . . . . . . . . . . . . . . . . . . . . . . . 431 25,446 32,837 3,313 — 62,027Subsidiary investments and advances . . . . 43,686 (5,885) (91,278) (188,711) 242,188 —
$ 55,205 $ 71,184 $ 987,162 $ 172,198 $241,406 $1,527,155
Liabilities and Shareholders’ Equity(Deficiency)
Senior revolving credit facility . . . . . . . . . . $ — $ 17,000 $ — $ — $ — $ 17,000Senior secured second-priority notes . . . . . — 225,155 — — — 225,155Accounts payable and accruedliabilities . . . . . . . . . . . . . . . . . . . . . . . . . 1,018 53,706 169,893 30,298 (1,170) 253,745
Participations and residuals . . . . . . . . . . . . 186 3,760 255,794 42,947 (10) 302,677Film obligations and production loans . . . . 79 — 334,791 16,899 — 351,769Convertible senior subordinated notes andother financing obligations . . . . . . . . . . . — 188,318 3,718 — — 192,036
Deferred revenue . . . . . . . . . . . . . . . . . . . . — 247 125,323 5,402 (121) 130,851Shareholders’ equity (deficiency) . . . . . . . 53,922 (417,002) 97,643 76,652 242,707 53,922
$ 55,205 $ 71,184 $ 987,162 $ 172,198 $241,406 $1,527,155
Year Ended March 31, 2010
Lions GateEntertainment
Corp.
Lions GateEntertainment
Inc.Other Subsidiaries Consolidating
AdjustmentsLions GateConsolidatedGuarantors Non-guarantors
(Amounts in thousands)STATEMENT OF OPERATIONSRevenues . . . . . . . . . . . . . . . . . . . . . . . . . . $ — $ 32,219 $1,238,659 $ 259,654 $ (41,026) $1,489,506EXPENSES:
Direct operating . . . . . . . . . . . . . . . . . — 458 664,323 156,297 (43,109) 777,969Distribution and marketing . . . . . . . . . — 7,475 433,878 64,830 (42) 506,141General and administration . . . . . . . . 7,070 72,705 42,347 21,212 (274) 143,060Depreciation and amortization . . . . . . — 4,832 3,645 3,978 — 12,455
Total expenses . . . . . . . . . . . . . . 7,070 85,470 1,144,193 246,317 (43,425) 1,439,625
OPERATING INCOME (LOSS) . . . . . . . . (7,070) (53,251) 94,466 13,337 2,399 49,881
Other expenses (income):Interest expense . . . . . . . . . . . . . . . . . — 45,165 1,662 1,146 (811) 47,162Interest and other income . . . . . . . . . . (130) (12,050) (605) (72) 11,310 (1,547)Gain on extinguishment of debt . . . . . — (5,675) — — — (5,675)
Total other expenses (income) . . (130) 27,440 1,057 1,074 10,499 39,940
INCOME (LOSS) BEFORE EQUITYINTERESTS AND INCOME TAXES . . . . . (6,940) (80,691) 93,409 12,263 (8,100) 9,941
Equity interests income (loss) . . . . . . . . . . (12,513) 49,090 (27,155) (10,594) (27,029) (28,201)
INCOME (LOSS) BEFORE INCOMETAXES . . . . . . . . . . . . . . . . . . . . . . . . . . (19,453) (31,601) 66,254 1,669 (35,129) (18,260)
Income tax provision (benefit) . . . . . . . . . . 25 225 (751) 1,719 — 1,218
NET INCOME (LOSS) . . . . . . . . . . . . . . . (19,478) (31,826) 67,005 (50) (35,129) (19,478)
F-65

LIONS GATE ENTERTAINMENT CORP.
NOTES TO AUDITED CONSOLIDATED FINANCIAL STATEMENTS— (Continued)
Year Ended March 31, 2010
Lions GateEntertainment
Corp.
Lions GateEntertainment
Inc.Other Subsidiaries Consolidating
AdjustmentsLions GateConsolidatedGuarantors Non-guarantors
(Amounts in thousands)STATEMENT OF CASH FLOWSNET CASH FLOWS PROVIDED BY(USED IN) OPERATINGACTIVITIES . . . . . . . . . . . . . . . . . . . . . . . . $(12,543) $ 14,072 $ (94,998) $ (41,491) $— $(134,960)
INVESTING ACTIVITIES:Purchases of restricted investments . . . . . . — (13,994) — — — (13,994)Proceeds from the sale of restrictedinvestments . . . . . . . . . . . . . . . . . . . . . . . — 13,985 — — — 13,985
Investment in equity method investees . . . . . . . — — (47,129) — — (47,129)Increase in loan receivables . . . . . . . . . . . . — (362) — (1,056) — (1,418)Repayment of loans receivable . . . . . . . . . — — 8,333 — — 8,333Purchases of property and equipment . . . . . . . . — (1,146) (605) (1,933) — (3,684)
NET CASH FLOWS PROVIDED BY(USED IN) INVESTING ACTIVITIES . . . — (1,517) (39,401) (2,989) — (43,907)
FINANCING ACTIVITIES:Tax withholding requirements on equityawards . . . . . . . . . . . . . . . . . . . . . . . . . . (2,030) — — — — (2,030)
Proceeds from the issuance of mandatorilyredeemable preferred stock units andcommon stock units related to the saleof 49% interest in TV GuideNetwork . . . . . . . . . . . . . . . . . . . . . . . . . — — — 109,776 — 109,776
Borrowings under senior revolving creditfacility . . . . . . . . . . . . . . . . . . . . . . . . . . — 302,000 — — — 302,000
Repayments of borrowings under seniorrevolving credit facility . . . . . . . . . . . . . — (540,000) — — — (540,000)
Borrowings under individual productionloans . . . . . . . . . . . . . . . . . . . . . . . . . . . . — — 128,590 16,151 — 144,741
Repayment of individual productionloans . . . . . . . . . . . . . . . . . . . . . . . . . . . . — — (87,347) (48,914) — (136,261)
Production loan borrowings underPennsylvania Regional Center creditfacility . . . . . . . . . . . . . . . . . . . . . . . . . . — — 63,133 — — 63,133
Production loan borrowings under filmcredit facility, net of deferred financingcosts . . . . . . . . . . . . . . . . . . . . . . . . . . . . — — 30,469 — — 30,469
Production loan repayments under filmcredit facility . . . . . . . . . . . . . . . . . . . . . — — (2,718) — — (2,718)
Proceeds from sale of senior securedsecond-priority notes, net of deferredfinancing costs . . . . . . . . . . . . . . . . . . . . — 214,727 — — — 214,727
Repurchase of convertible seniorsubordinated notes . . . . . . . . . . . . . . . . . — (75,185) — — — (75,185 )
Repayment of other financingobligations . . . . . . . . . . . . . . . . . . . . . . . — — — (134) — (134)
NET CASH FLOWS PROVIDED BY(USED IN) FINANCING ACTIVITIES . . (2,030) (98,458) 132,127 76,879 — 108,518
NET CHANGE IN CASH AND CASHEQUIVALENTS . . . . . . . . . . . . . . . . . . . . . . (14,573) (85,903) (2,272) 32,399 — (70,349)
FOREIGN EXCHANGE EFFECTS ONCASH . . . . . . . . . . . . . . . . . . . . . . . . . . . . . . . 2,134 — — (1,018) — 1,116
CASH AND CASH EQUIVALENTS—BEGINNING OF PERIOD . . . . . . . . . . . . . 13,253 88,962 10,424 25,836 — 138,475
CASH AND CASH EQUIVALENTS—END OF PERIOD . . . . . . . . . . . . . . . . . . . . $ 814 $ 3,059 $ 8,152 $ 57,217 $— $ 69,242
F-66

LIONS GATE ENTERTAINMENT CORP.
NOTES TO AUDITED CONSOLIDATED FINANCIAL STATEMENTS— (Continued)
Year Ended March 31, 2009
Lions GateEntertainment
Corp.
Lions GateEntertainment
Inc.Other Subsidiaries Consolidating
AdjustmentsLions GateConsolidatedGuarantors Non-guarantors
(Amounts in thousands)STATEMENT OF OPERATIONSRevenues . . . . . . . . . . . . . . . . . . . . . . . . . . $ 560 $ 24,810 $1,291,404 $187,455 $ (37,855) $1,466,374EXPENSES:
Direct operating . . . . . . . . . . . . . . . . . 712 — 733,948 95,863 (36,707) 793,816Distribution and marketing . . . . . . . . . 8 2,374 580,625 86,630 (80) 669,557General and administration . . . . . . . . 1,584 67,734 45,648 21,597 — 136,563Depreciation and amortization . . . . . . — 3,889 1,052 2,716 — 7,657
Total expenses . . . . . . . . . . . . . . 2,304 73,997 1,361,273 206,806 (36,787) 1,607,593
OPERATING LOSS . . . . . . . . . . . . . . . . . (1,744) (49,187) (69,869) (19,351) (1,068) (141,219)
Other expenses (income):Interest expense . . . . . . . . . . . . . . . . . 14 32,707 1,187 961 (594) 34,275Interest and other income . . . . . . . . . . (229) (4,022) (1,489) (639) 594 (5,785)
Total other expenses(income) . . . . . . . . . . . . . . . . . (215) 25,662 (302) 322 — 25,467
INCOME (LOSS) BEFORE EQUITY . . .INTERESTS AND INCOMETAXES . . . . . . . . . . . . . . . . . . . . . . (1,529) (74,849) (69,567) (19,673) (1,068) (166,686)
Equity interests income (loss) . . . . . . . . . . (176,919) (98,120) (6,151) — 272,146 (9,044)
INCOME (LOSS) BEFORE INCOMETAXES . . . . . . . . . . . . . . . . . . . . . . . . . . (178,448) (172,969) (75,718) (19,673) 271,078 (175,730)
Income tax provision (benefit) . . . . . . . . . . 6 1,374 1,134 210 — 2,724
NET INCOME (LOSS) . . . . . . . . . . . . . . . $(178,454) $(174,343) $ (76,852) $ (19,883) $271,078 $ (178,454)
F-67

LIONS GATE ENTERTAINMENT CORP.
NOTES TO AUDITED CONSOLIDATED FINANCIAL STATEMENTS— (Continued)
Year Ended March 31, 2009
Lions GateEntertainment
Corp.
Lions GateEntertainment
Inc.Other Subsidiaries Consolidating
AdjustmentsLions GateConsolidatedGuarantors Non-guarantors
(Amounts in thousands)STATEMENT OF CASH FLOWS
NET CASH FLOWS PROVIDED BY(USED IN) OPERATINGACTIVITIES $ 56,435 $(256,846) $ 92,006 $ 6,499 $— $(101,906)
INVESTING ACTIVITIES:Purchases of restricted investments . . — (13,989) — — — (13,989)Proceeds from the sale of restrictedinvestments . . . . . . . . . . . . . . . . . . . — 14,000 — — — 14,000
Acquisition of TV Guide, net ofunrestricted cash acquired . . . . . . . — (243,158) — — — (243,158)
Investment in equity methodinvestees . . . . . . . . . . . . . . . . . . . . . — — (18,031) — — (18,031)
Increase in loan receivables . . . . . . . . — (3,767) (25,000) — — (28,767)Purchases of property andequipment . . . . . . . . . . . . . . . . . . . . — (7,549) (191) (934) — (8,674)
NET CASH FLOWS PROVIDED BY(USED IN) INVESTINGACTIVITIES — (254,463) (43,222) (934) — (298,619)
FINANCING ACTIVITIES:Exercise of stock options . . . . . . . . . . 2,894 — — — — 2,894Tax withholding requirements onequity awards . . . . . . . . . . . . . . . . . (3,734) — — — — (3,734)
Repurchases of common shares . . . . . (44,968) — — — — (44,968)Borrowings under senior revolvingcredit facility . . . . . . . . . . . . . . . . . . — 255,000 — — — 255,000
Borrowings under individualproduction loans . . . . . . . . . . . . . . . — — 148,583 41,275 — 189,858
Repayment of individual productionloans . . . . . . . . . . . . . . . . . . . . . . . . — — (192,842) (29,192) — (222,034)
Repayment of other financingobligations . . . . . . . . . . . . . . . . . . . — (5,310) — (67) — (5,377)
NET CASH FLOWS PROVIDED BY(USED IN) FINANCINGACTIVITIES (45,808) 249,690 (44,259) 12,016 — 171,639
NET CHANGE IN CASH AND CASHEQUIVALENTS 10,627 (261,619) 4,525 17,581 — (228,886)
FOREIGN EXCHANGE EFFECTS ONCASH (1,848) — — (2,380) — (4,228)
CASH AND CASH EQUIVALENTS —BEGINNING OF PERIOD 4,474 350,581 5,899 10,635 — 371,589
CASH AND CASH EQUIVALENTS —END OF PERIOD $ 13,253 $ 88,962 $ 10,424 $ 25,836 $— $ 138,475
28. Related Party Transactions
Cerulean, LLC Transactions
In December 2003 and April 2005 (as amended in May 2010), the Company entered into distributionagreements with Cerulean, LLC (“Cerulean”), a company in which Jon Feltheimer, the Company’s Chief
F-68

LIONS GATE ENTERTAINMENT CORP.
NOTES TO AUDITED CONSOLIDATED FINANCIAL STATEMENTS— (Continued)
Executive Officer and Co-Chairman of the Company’s Board of Directors, and Michael Burns, the Company’sVice Chairman and a director, each hold a 28% interest. Under the agreements, the Company obtained rights todistribute certain titles in home video and television media and Cerulean is entitled to receive royalties. Duringthe year ended March 31, 2011, the Company paid $0.1 million to Cerulean under these agreements (2010 —$0.1 million, 2009 — nominal).
Icon International Transactions
In January 2007, the Company and Icon International, Inc. (“Icon”) entered into a vendor subscriptionagreement (the “Vendor Agreement”) with a term of five years. Icon is a company which directly reports toOmnicom Group, Inc, and Daryl Simm, a director of the Company, is the Chairman and Chief Executive Officerof Omnicom Media Group, a division of Omnicom Group, Inc. Under the Vendor Agreement, the Companyagreed to purchase media advertising through Icon and Icon agreed to reimburse the Company for certainoperating expenses as follows: (1) $763,958 during the first year of the term; (2) $786,013 during the second yearof the term; (3) $808,813 during the third year of the term; (4) $832,383 during the fourth year of the term; and(5) $856,750 during the fifth year of the term (collectively, the “Minimum Annual Payment Amounts”) or at theCompany’s option, the Company could elect that Icon reimburse the Company for certain operating expenses inthe following amounts: (a) $1,145,936 during the first year of the term; (b) $1,179,019 during the second year ofthe term; (c) $1,213,219 during the third year of the term; (d) $1,248,575 during the fourth year of the term; and(e) $1,285,126 during the fifth year of the term (collectively, the “Supplemental Annual Payment Amounts”).The Company elected to be reimbursed for the Supplemental Annual Payment Amount for the first year of theterm. In exchange, the Company agreed to purchase media advertising through Icon of approximately$5.6 million per year (if the Company elects to be reimbursed for the Minimum Annual Payment Amount) orapproximately $8.4 million per year (if the Company elects to be reimbursed for the Supplemental AnnualPayment Amount) for the five-year term. The actual amount of media advertising to be purchased is determinedusing a formula based upon values assigned to various types of advertising, as set forth in the Vendor Agreement.For accounting purposes, the operating expenses incurred by the Company will continue to be expensed in fulland the reimbursements from Icon of such expenses will be treated as a discount on media advertising and willbe reflected as a reduction of advertising expense as the media advertising costs are incurred by the Company.The Vendor Agreement may be terminated by the Company effective as of any Vendor Agreement year end withsix months notice. During the year ended March 31, 2011, Icon paid $1.3 million to the Company under theVendor Agreement (2010 — $1.2 million, 2009 — $1.2 million). During the year ended March 31, 2011, theCompany incurred $7.8 million in media advertising expenses with Icon under the Vendor Agreement (2010 —$7.2 million, 2009 — $10.9 million).
Other Transactions with Equity Method Investees
FEARnet. During the year ended March 31, 2011, the Company recognized $3.2 million in revenue pursuantto the five-year license agreement with FEARnet (2010 — $2.2 million, 2009 — $2.9 million), and held accountsreceivable due from FEARnet pursuant to the agreement of $0.3 million (2010 — $0.6 million, 2009 — nil).
Roadside. During the year ended March 31, 2011, the Company recognized $0.5 million in distribution andmarketing expenses paid to Roadside in connection with the release of certain theatrical titles (2010 — less than$0.1 million, 2009 — $4.7 million). During the year ended March 31, 2011, the Company made $10.4 million inparticipation payments to Roadside in connection with the distribution of certain theatrical titles (2010 —$3.1 million, 2009 — $0.3 million).
Break Media. During the year ended March 31, 2011, the Company recognized $1.6 million in interestincome associated with a $9.7 million note receivable from Break Media, see Note 8 (2010 — $0.6 million, 2009— $0.6 million).
F-69

LIONS GATE ENTERTAINMENT CORP.
NOTES TO AUDITED CONSOLIDATED FINANCIAL STATEMENTS— (Continued)
EPIX. During the year ended March 31, 2011, the Company recognized $89.4 million of revenue from EPIXin connection with the licensing of certain theatrical releases and other films and television programs, see Note 7(2010 — $38.6 million, 2009 — nil). As of March 31, 2011, the Company held $25.9 million of accountsreceivables from EPIX (2010 — $11.8 million, 2009 — nil). In addition, as of March 31, 2011, the Company had$2.4 million in deferred revenue from EPIX (2010 — $3.3 million, 2009 — nil).
TV Guide Network. During the year ended March 31, 2011, the Company recognized $14.9 million ofrevenue (2010 — $0.3 million, 2009 — nil) from TV Guide Network in connection with the licensing of certainfilms and/or television programs, see Note 7. Additionally, the Company recognized $14.1 million of income forthe accretion of the dividend and discount of the mandatorily redeemable preferred stock units as equity interestincome (2010 — $10.5 million, 2009 — nil). Also, during the year ended March 31, 2011, the Company receiveda pay-out of accreted interest on the mandatorily redeemable preferred stock units of $10.2 million. As ofMarch 31, 2011, the Company held $12.7 million of accounts receivables from TV Guide Network (2010 — $1.9million, 2009 — nil).
29. Subsequent Events (Unaudited)
Additional Issuance of Senior Secured Second-Priority Notes. On May 13, 2011, LGEI issuedapproximately $200.0 million aggregate principal amount of senior secured second priority notes due 2016 (the“Additional Senior Notes”) in a private offering conducted pursuant to Rule 144A and Regulation S under theSecurities Act of 1933, as amended. The Additional Senior Notes were issued pursuant to a supplementalindenture dated as of May 13, 2011 (the “Supplemental Indenture”) to the indenture dated as of October 21, 2009(the “Indenture”), among LGEI, the Company, the subsidiary guarantors party thereto, and U.S. Bank NationalAssociation, as trustee. LGEI had issued $236.0 million aggregate principal amount of 10.25% senior securedsecond priority notes due 2016 (the “Senior Notes”) under the Indenture on October 21, 2009. The SupplementalIndenture amended the Indenture to, among other things, enable the Issuer to issue additional notes having thesame terms as the Senior Notes, except for the issue date, issue price and first interest payment, in an aggregateprincipal amount of up to $200.0 million. The Additional Senior Notes were sold at 102.219% of the principalamount plus accrued interest thereon from May 1, 2011, resulting in gross proceeds of approximately$204.4 million and net proceeds of approximately $197.2 million after certain transaction costs, andapproximately $191.6 million after $5.6 million paid in connection with the consent solicitation of holders of theSenior Notes. A portion of the proceeds were used to pay down amounts outstanding under our senior securedcredit facility. The Additional Senior Notes accrue interest at a rate of 10.25% per annum from May 1, 2011 andwill be payable semiannually on May 1 and November 1 of each year, commencing on November 1, 2011. TheAdditional Senior Notes will mature on November 1, 2016.
F-70


